Effects of Thickness of Solid Media, Ventilation Rate, and Chamber Volume on Ammonia Emission from Liquid Fertilizers Using Dynamic Chamber-Capture System (DCS)


Abstract
:1. Introduction
2. Materials and Methods
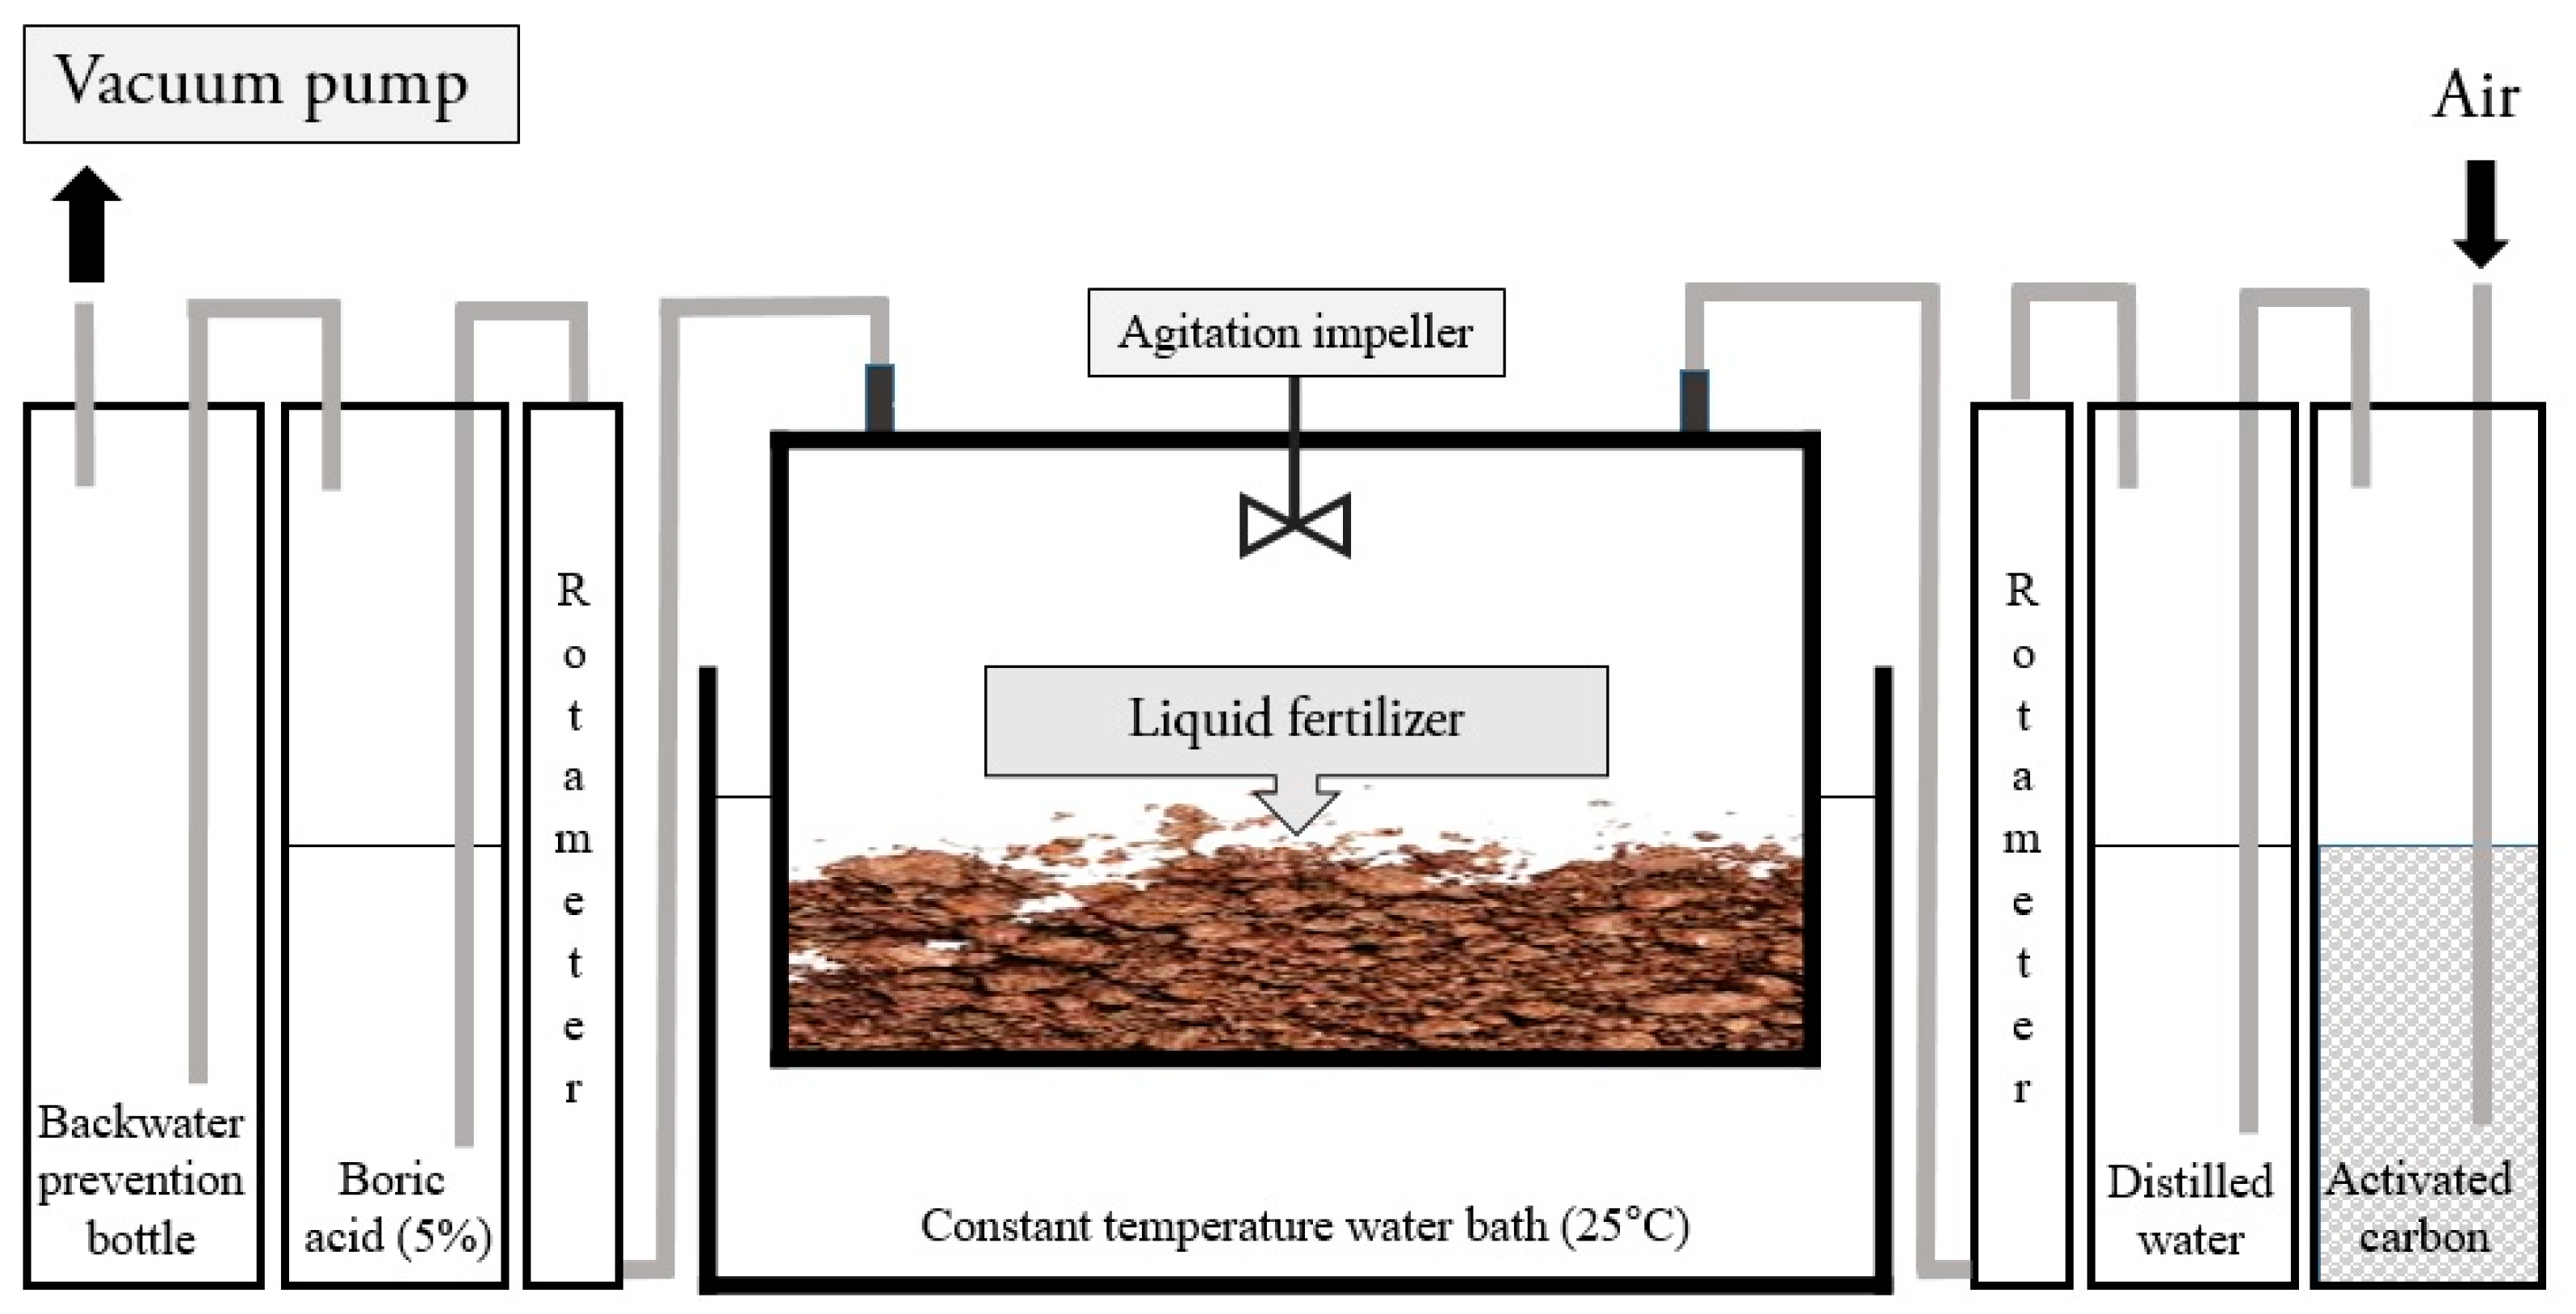
2.1. Dynamic Chamber-Capture System (DCS)
2.2. Preparation and Analysis of Samples
2.3. Experimental Set-Up
2.3.1. Effect of the Characteristic of Liquid Fertilizer on Ammonia Emission Flux
2.3.2. Effect of Thickness of Solid Media on Ammonia Emission Flux
2.3.3. Effect of Ventilation Rate on Ammonia Emission Flux
2.3.4. Confirmation Experiment
2.4. Statistical Analysis
3. Results and Discussion
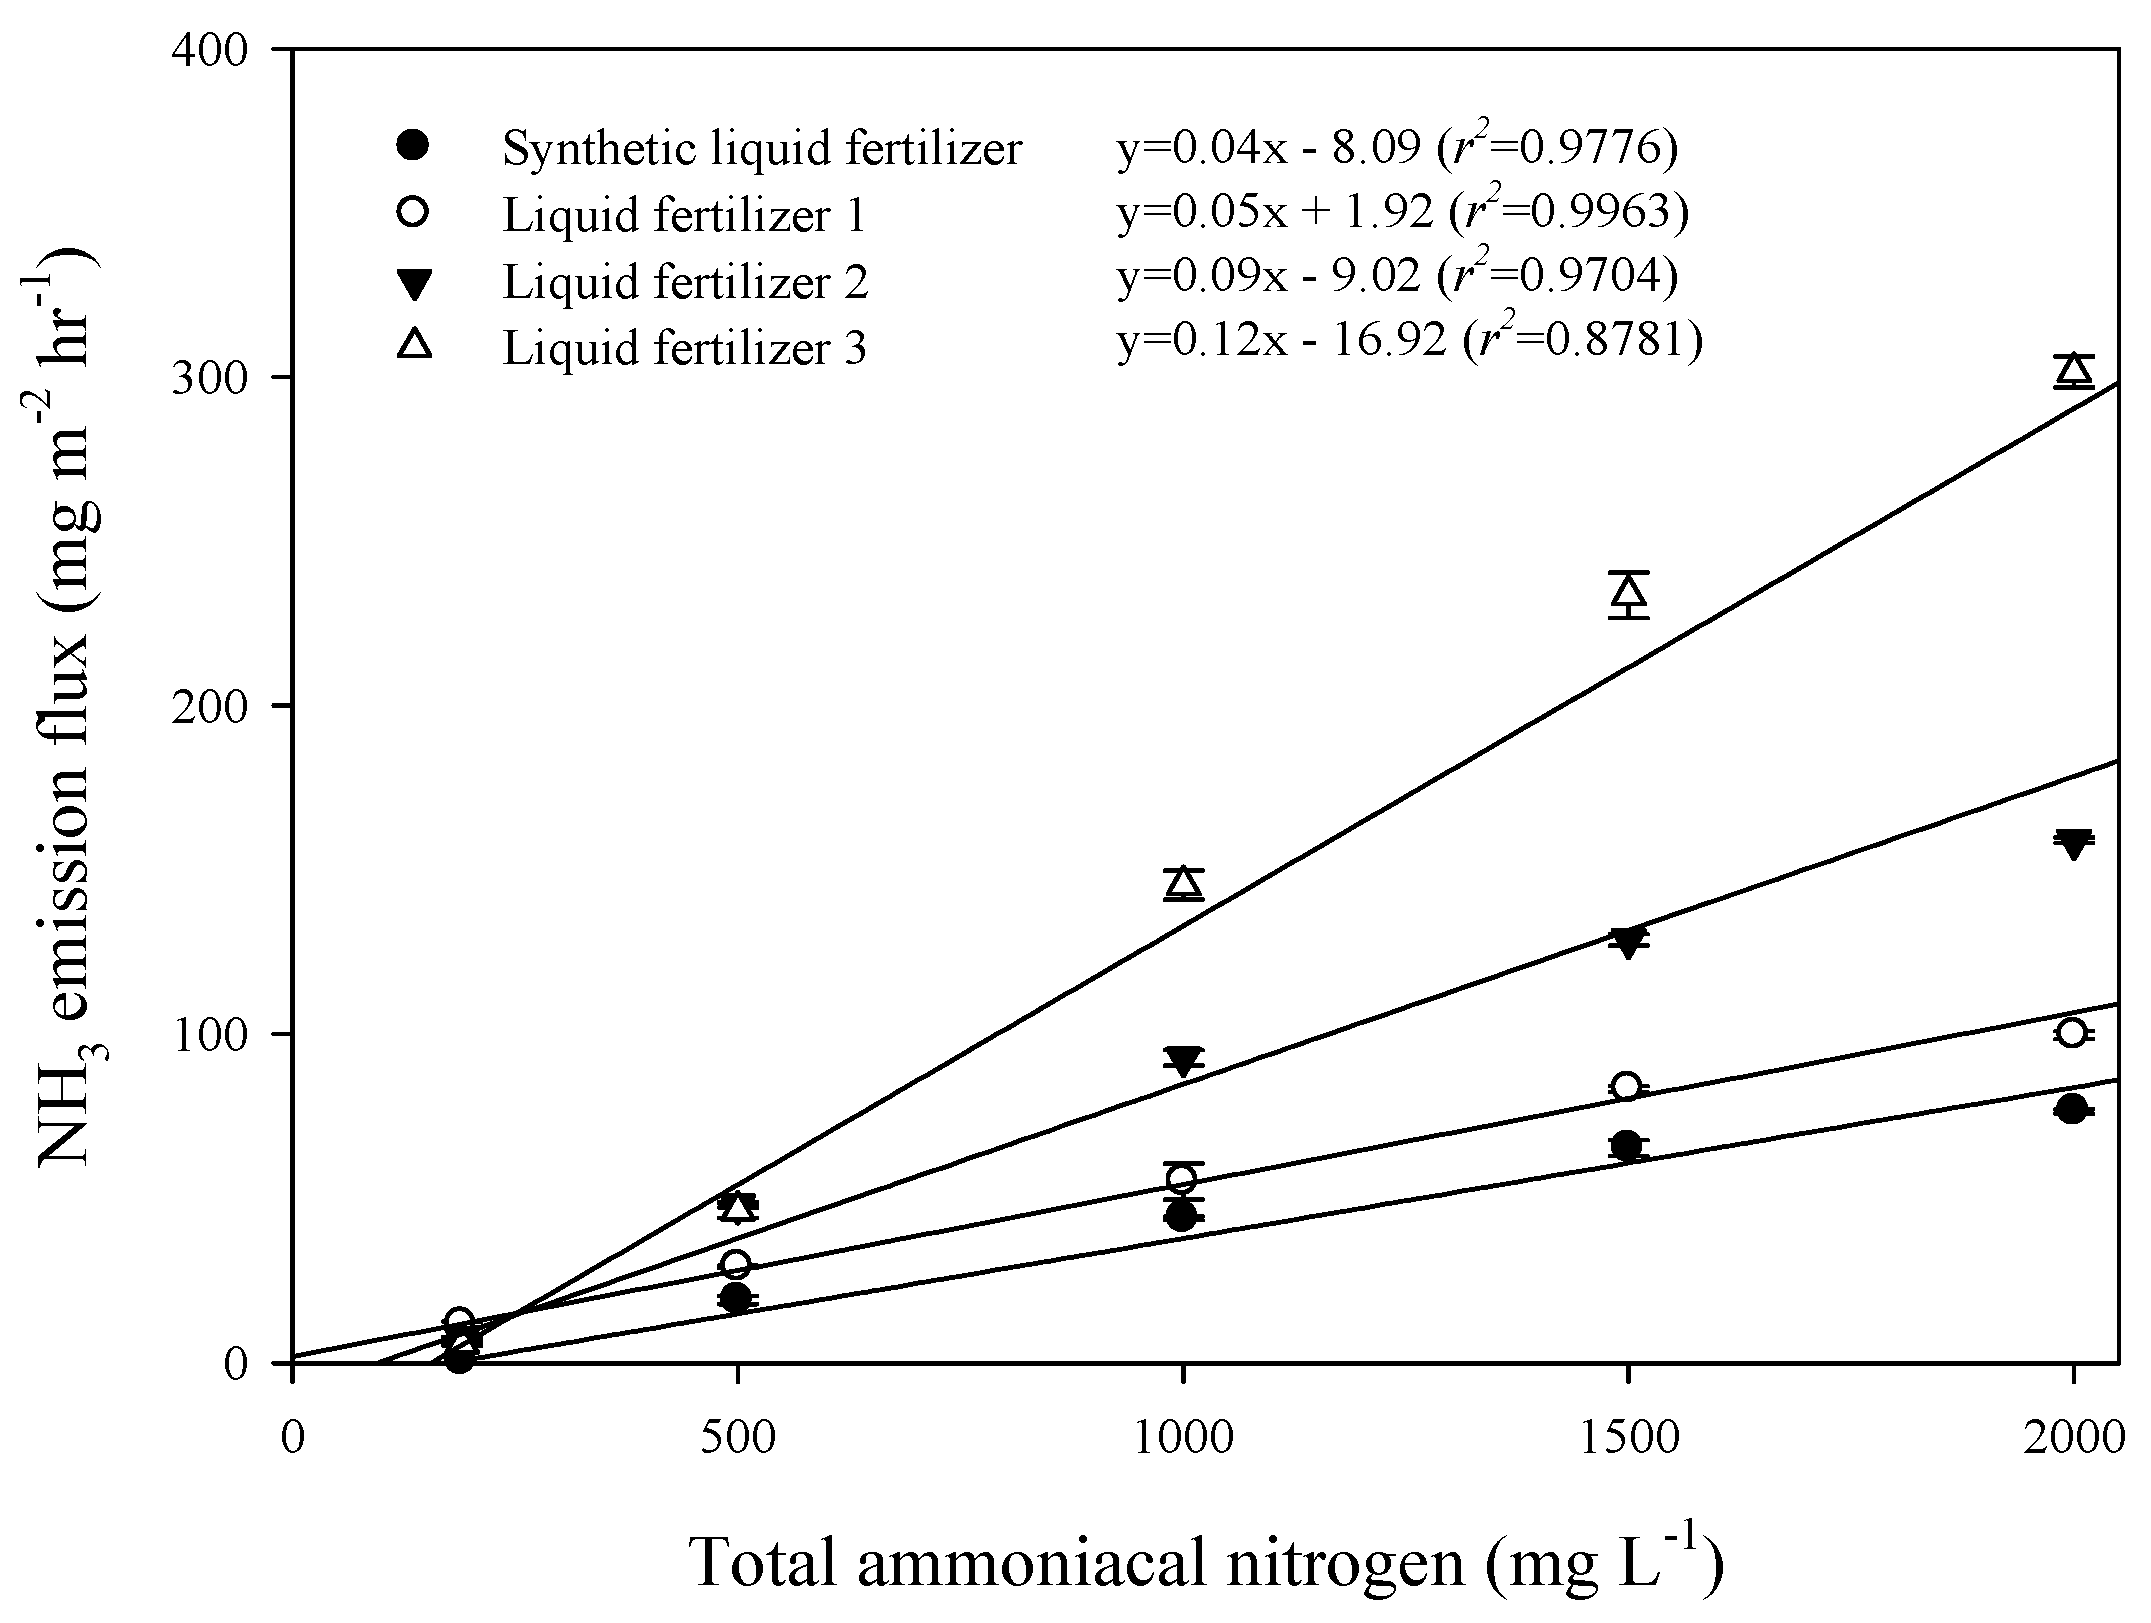
3.1. Characteristics of Liquid Fertilizer and GWS and Their Ammonia Emission Flux
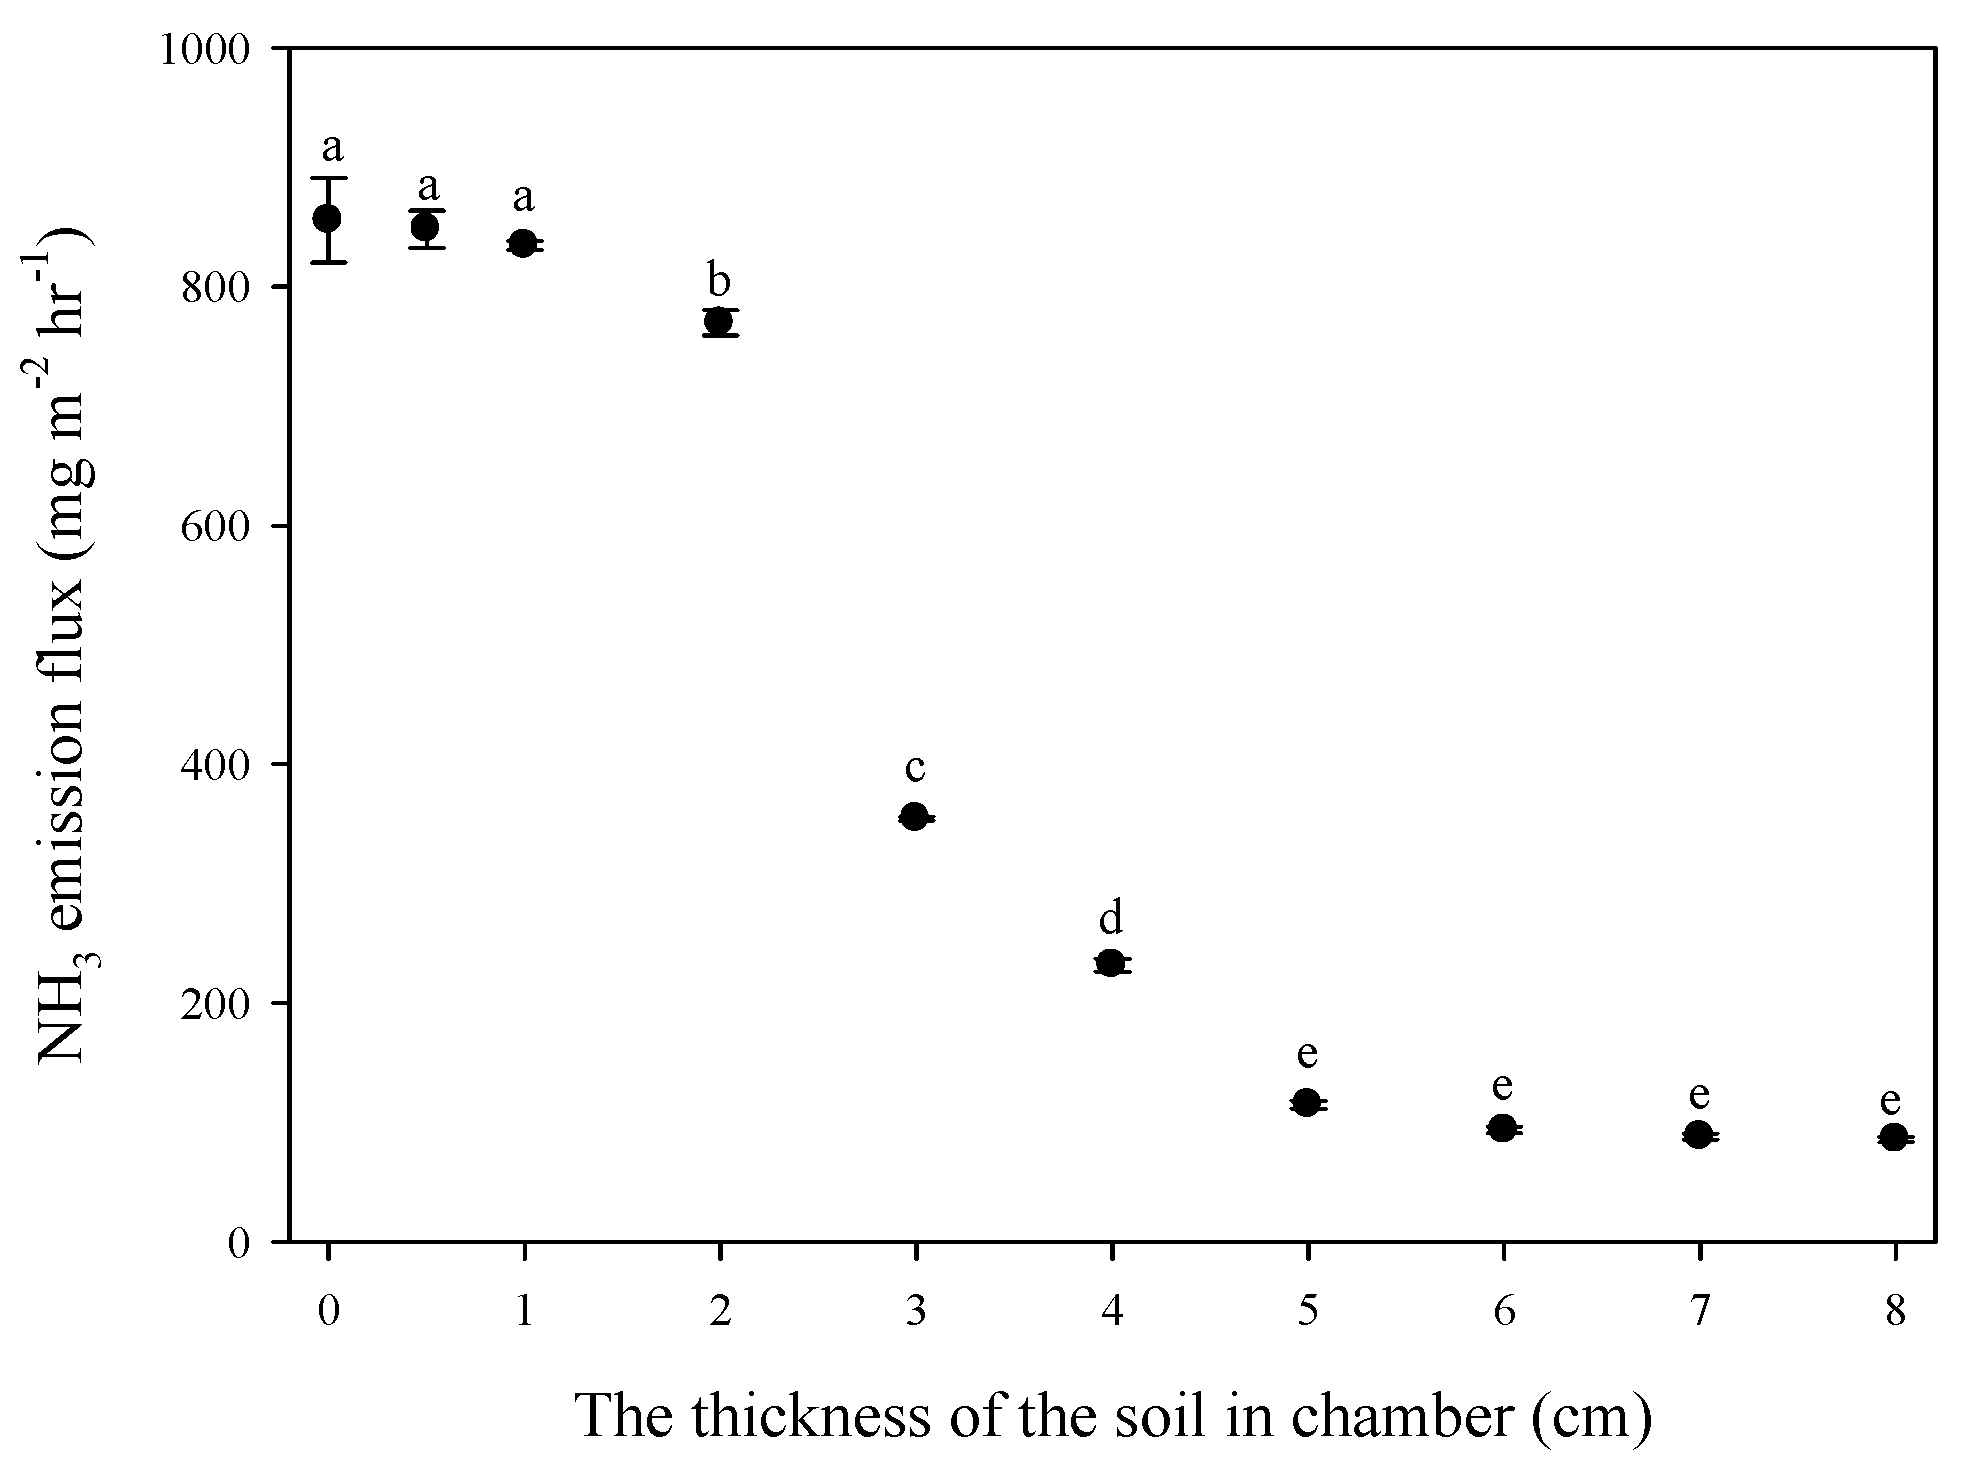
3.2. Effect of Thickness of Solid Media on Ammonia Emission Flux
3.3. Effect of Ventilation Rate on Ammonia Emission Flux
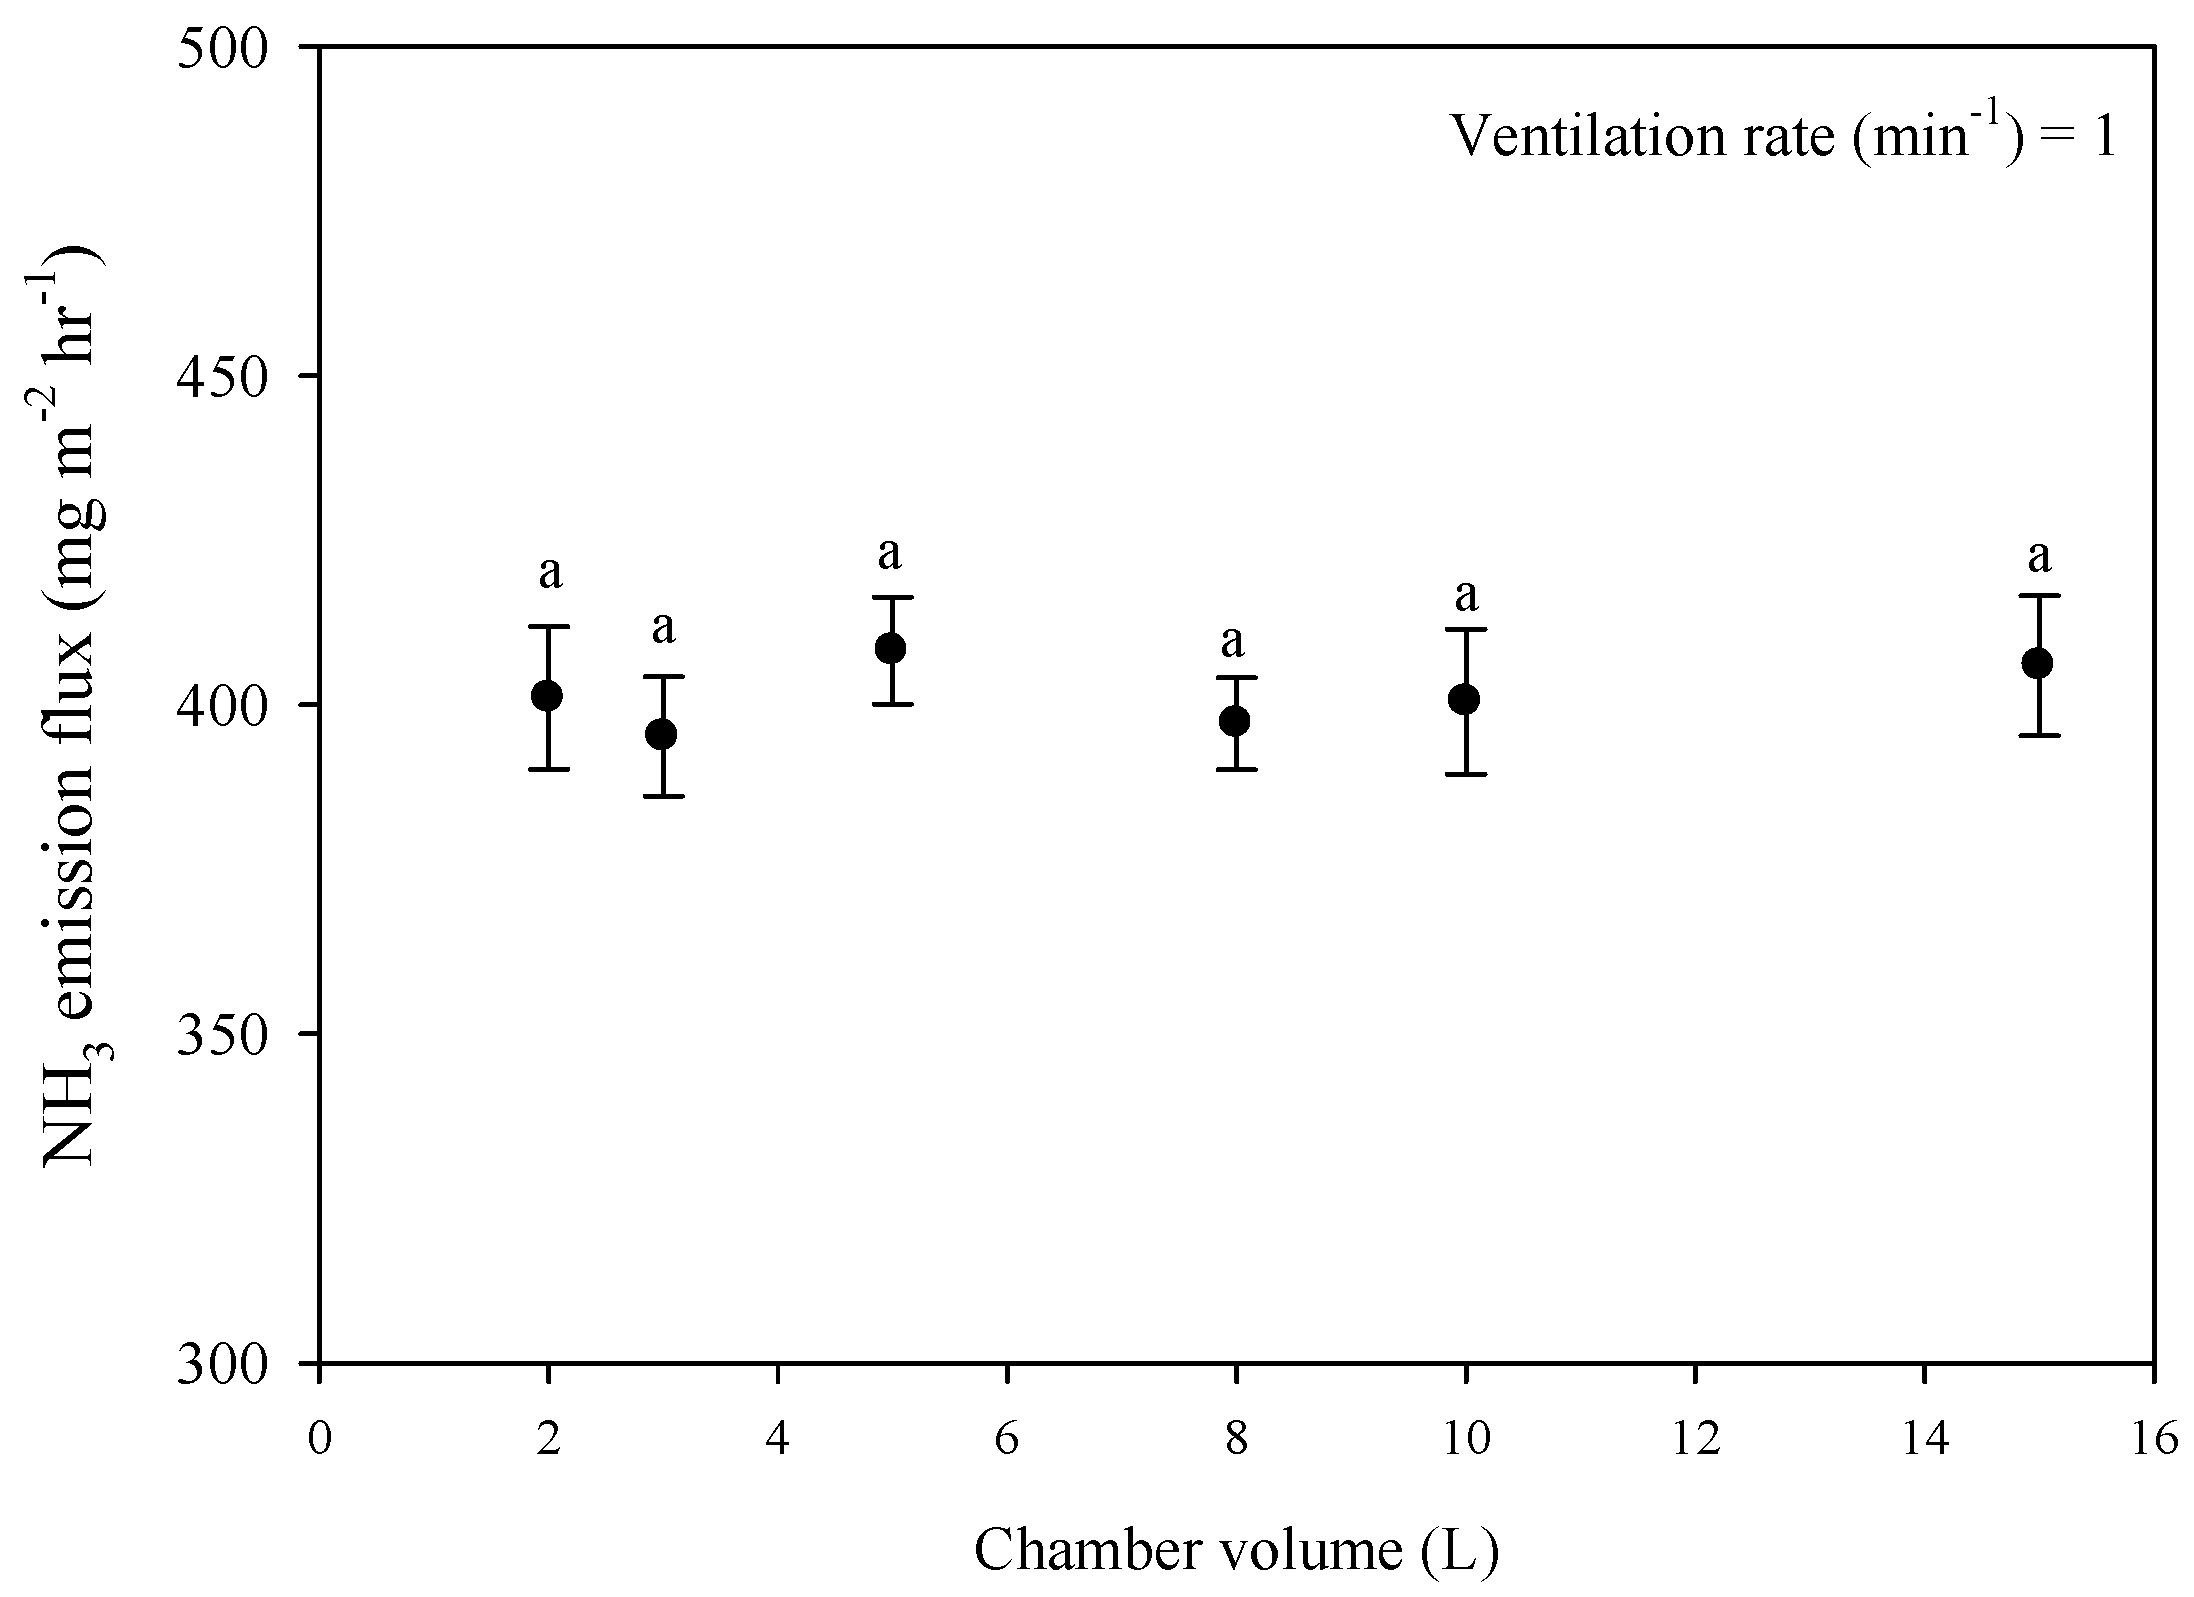
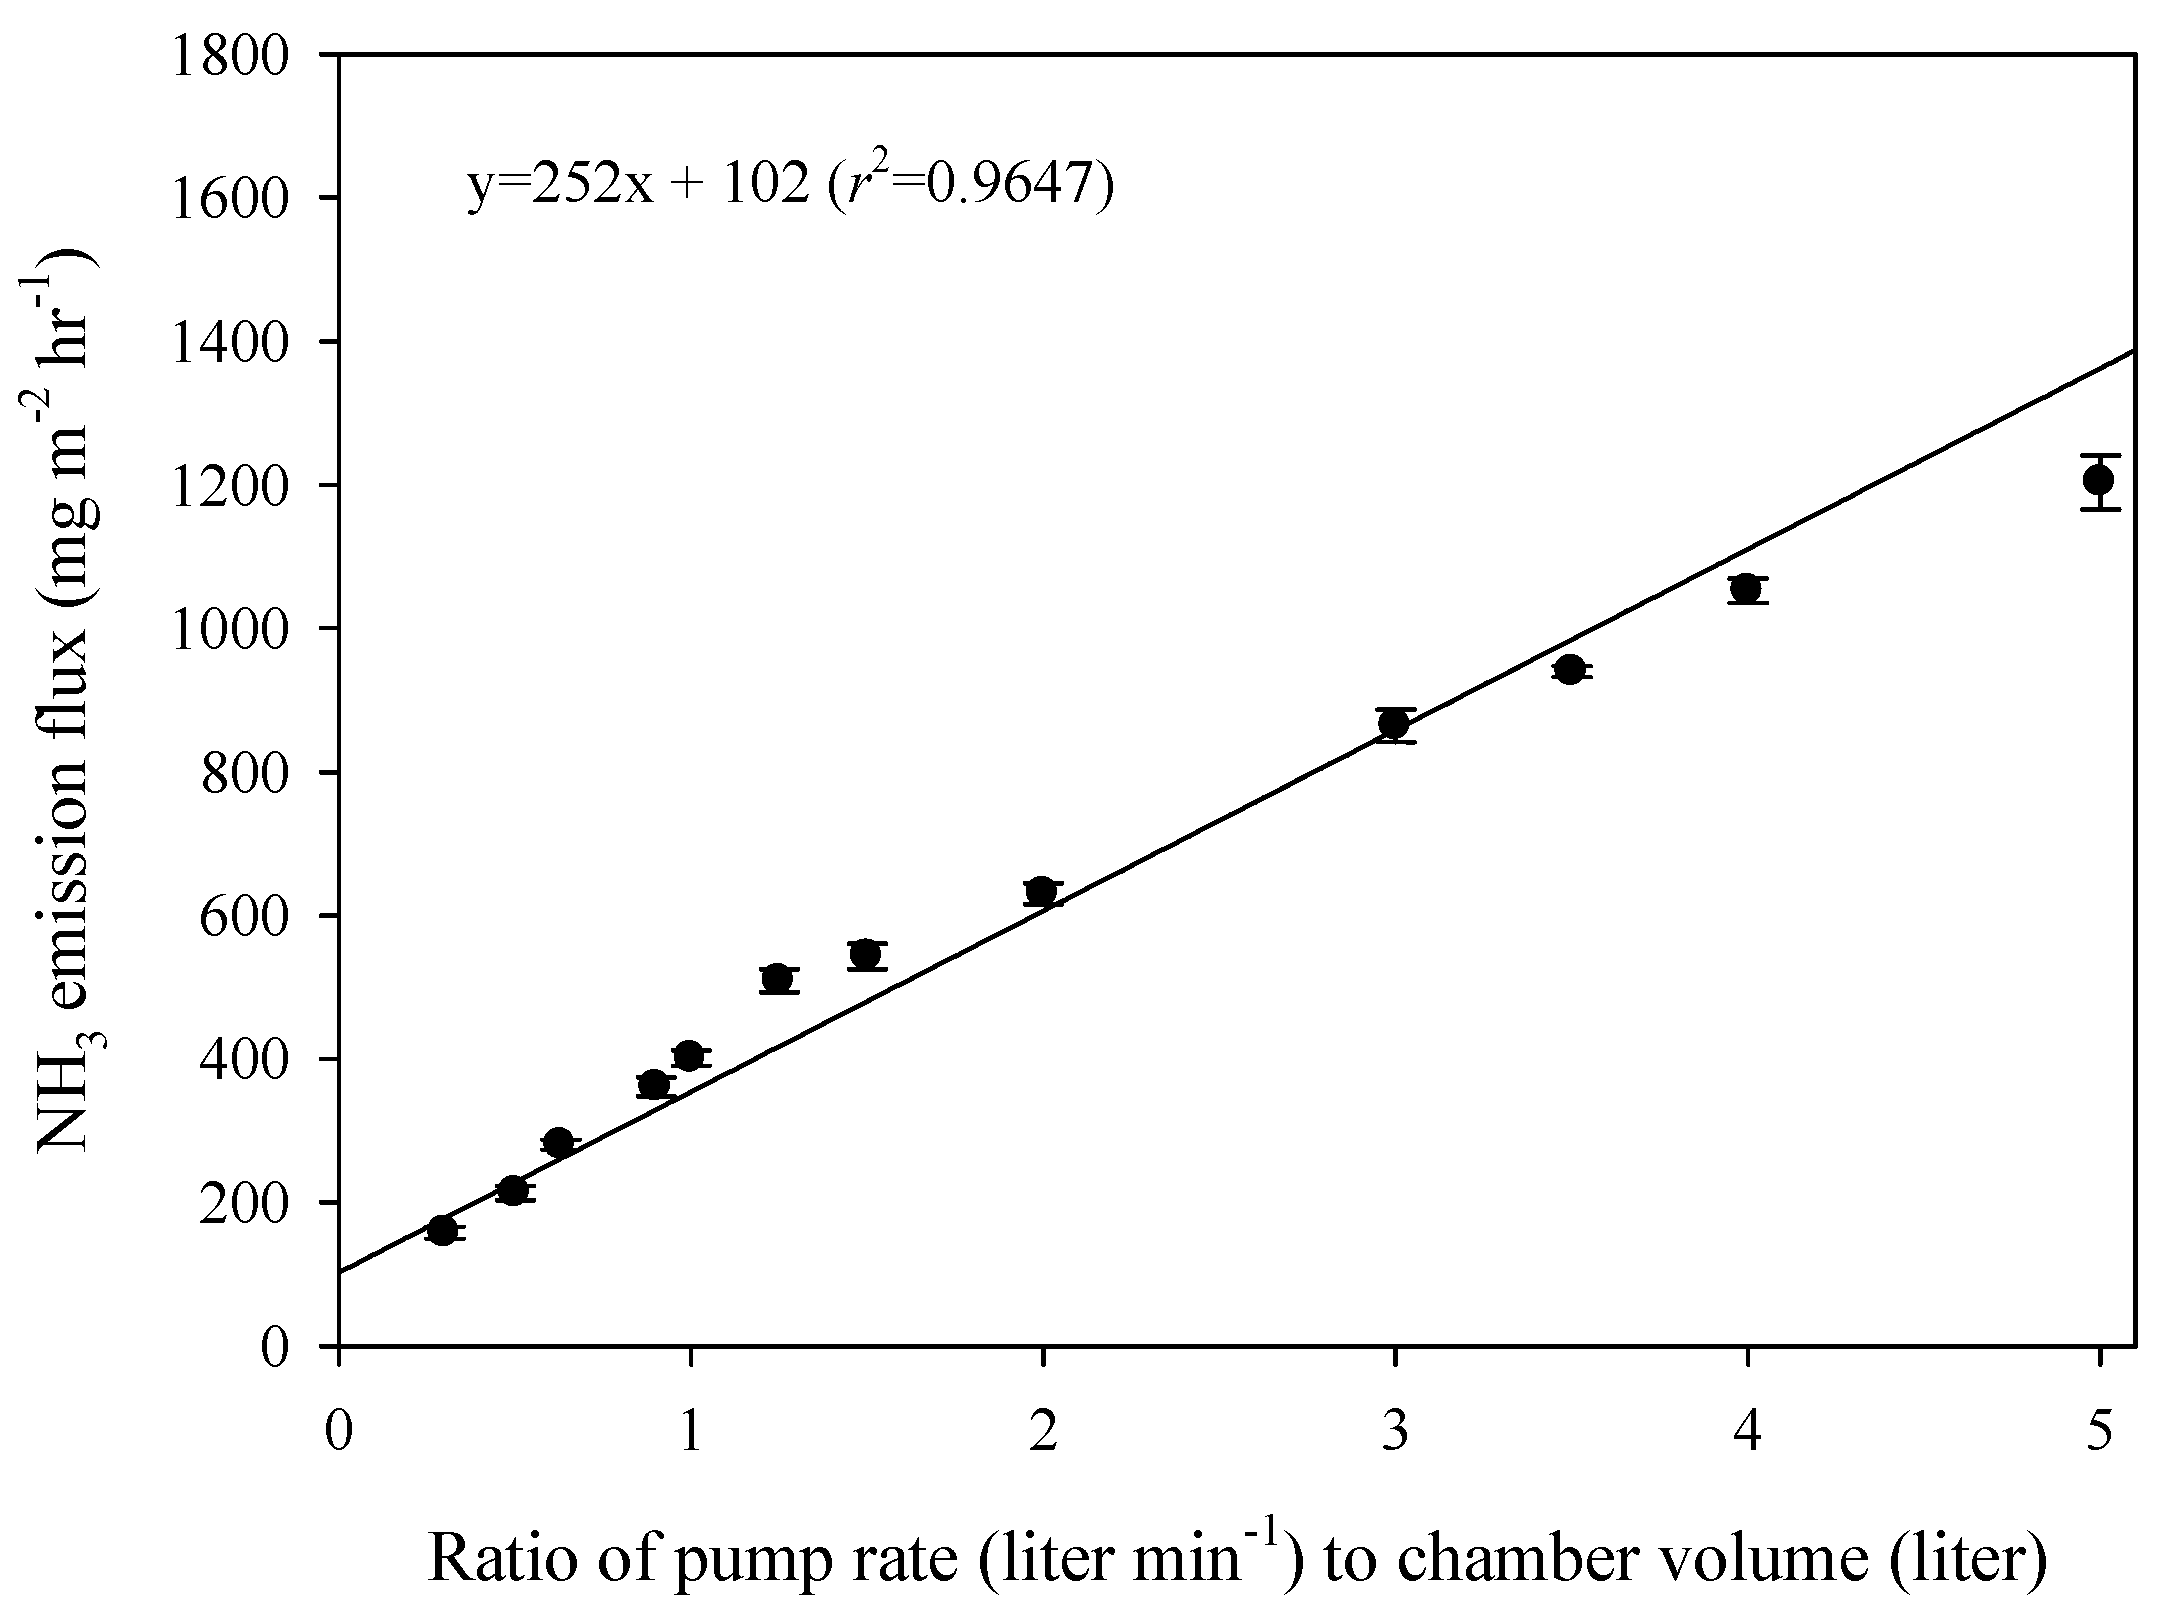
3.4. Effect of Volume of Headspace in Chamber on Ammonia Emission Flux
4. Conclusions
Author Contributions
Funding
Conflicts of Interest
References
- Hodan, W.B.; Barnard, W.R. Evaluating the Contribution of PM2.5 Precursor Gases and Re-ENTRAINED ROAD EMISSIONS to Mobile Source PM2.5 Particulate Matter Emissions; MACTEC Federal Programs, Inc.: Triangle Park, Durham, NC, USA, 2004. [Google Scholar]
- Behera, S.N.; Sharma, M.; Aneja, V.P.; Balasubramanian, R. Ammonia in the atmosphere: A review on emission sources, atmospheric chemistry and deposition on terrestrial bodies. Environ. Sci. Pollut. Res. 2013, 20, 8092–8131. [Google Scholar] [CrossRef] [PubMed]
- Shin, D.W.; Joo, H.S.; Seo, E.; Kim, C.Y. Management Strategies to Reduce PM-2.5 Emission: Emphasis-Ammonia; Korea Environment Institute: Sejong, Korea, 2017. [Google Scholar]
- Environmental Protection Agency. 2014 National Emissions Inventory, Version 1; EPA: Washington, DC, USA, 2016.
- European Environment Agency. EMEP/EEA Air Pollutant Emission Inventory Guidebook 2016; EEA: Copenhagen, Denmark, 2016. [Google Scholar]
- National Institute of Environmental Research (NIER). 2015 National Air Pollution Emission; Ministry of Environment: Sejong, Korea, 2016.
- National Institute of Environmental Research (NIER). National Air Pollutant Emission Estimation Manual (III); National Institute of Environmental Research: Incheon, Korea, 2008.
- Sommer, S.G. Effect of composting on nutrient loss and nitrogen availability of cattle deep litter. Eur. J. Agron. 2001, 14, 123–133. [Google Scholar] [CrossRef]
- Sommer, S.G.; Génermont, S.; Cellier, P.; Hutchings, N.J.; Olesen, J.E.; Morvan, T. Processes controlling ammonia emission from livestock slurry in the field. Eur. J. Agron. 2003, 19, 465–486. [Google Scholar] [CrossRef]
- Nyord, T.; Søgaard, H.T.; Hansen, M.N.; Jensen, L.S. Injection methods to reduce ammonia emission from volatile liquid fertilisers applied to growing crops. Biosyst. Eng. 2008, 100, 235–244. [Google Scholar] [CrossRef]
- Sommer, S.G.; Olesen, J.E.; Christensen, B.T. Effects of temperature, wind speed and air humidity on ammonia volatilization from surface applied cattle slurry. J. Agric. Sci. 1991, 117, 91–100. [Google Scholar] [CrossRef]
- Shim, H.Y.; Lee, K.S.; Lee, D.S.; Jeon, D.S.; Park, M.S.; Shin, J.S.; Lee, Y.K.; Goo, J.W.; Kim, S.B.; Song, S.G.; et al. Infiltration rates of liquid pig manure with various dilution ratios in three different soil. Korean J. Environ. Agric. 2014, 33, 164–168. [Google Scholar] [CrossRef]
- Fang, C.; Moncrieff, B. Am improvement dynamic chamber technique for measuring CO2 efflux from the surface of soil. Func. Ecol. 1996, 10, 297–305. Available online: https://www.jstor.org/stable/2389856 (accessed on 12 June 2020). [CrossRef]
- Fang, C.; Moncrieff, B. An open-top chamber for measuring soil respiration and the influence of pressure difference on CO2 efflux measurement. Funct. Ecol. 1998, 12, 319–325. [Google Scholar] [CrossRef]
- Eckley, C.S.; Gustin, M.; Lin, C.J.; Miller, M.B. The influence of dynamic chamber design and operating parameters on calculated surface-to-air mercury fluxes. Atmos. Environ. 2010, 44, 194–203. [Google Scholar] [CrossRef]
- Mkhabela, M.S.; Gordon, R.; Burton, D.; Madani, A.; Hart, W. Effect of lime, dicyandiamide and soil water content on ammonia and nitrous oxide emissions following application of liquid hog manure to a marshland soil. Plant Soil 2006, 284, 351–361. [Google Scholar] [CrossRef]
- Snell, H.G.J.; Seipelt, F.; Van den Weghe, H.F.A. Ventilation rates and gaseous emissions from naturally ventilated dairy houses. Biosyst. Eng. 2003, 86, 67–73. [Google Scholar] [CrossRef]
- Verdoes, N.; Ogink, N.W.M. Odour emissions from pig houses with low ammonia emission. In Proceedings of the International Symposium on Ammonia odour emissions from animal production facilities, Winkeloord, The Netherlands, 6–10 October 1997; pp. 252–317. [Google Scholar]
- Young, I.R.; Zieger, S.; Babanin, A.V. Global trends in wind speed and wave height. Science 2011, 332, 451–455. [Google Scholar] [CrossRef] [PubMed]
- Kim, M.-S.; Lee, Y.-S.; Min, H.-G.; Kim, J.-G. Applicability of the dynamic chamber-capture system (DCS) for estimating the flux of ammonia emission during liquid fertilizer spreading. Atmos. Pollut. Res. 2020, 11, 723–729. [Google Scholar] [CrossRef]
- Nelson, D.W.; Sommers, L.E. Total carbon, organic carbon, and organic matter. In Methods of Soil Analysis Part 3-Chemical Method; Sparks, D.L., Ed.; SSSA: Madison, WI, USA, 1996; pp. 961–1010. [Google Scholar]
- Park, N.G.; Ko, S.B.; Lee, C.E.; Hwang, K.J.; Kim, M.C.; Song, S.T. Effect of pig slurry application on the forage yield of sorghum × sudangrass hybrid and leaching of NO3-N in volcanic ash soil. J. Kor. Grassl. Sci. 2003, 23, 151–158. [Google Scholar]
- Hwang, K.J.; Park, H.S.; Park, N.G.; Ko, M.S.; Kim, M.C.; Song, S.T. Effects of applying pig slurry fermented with probiotics on forage crops productivity and chemical changes in soil. J. Korean Soc. Grassl. Forage Sci. 2006, 26, 293–300. [Google Scholar] [CrossRef] [Green Version]
- Kang, T.W.; Halder, J.N.; Kim, S.R.; Yoon, Y.M.; Lee, M.G. Nutrient composition and heavy metal contents of matured livestock liquid fertilizer in Korea. J. Kor. Org. Resour. Recyc. Assoc. 2017, 25, 31–39. [Google Scholar] [CrossRef]
- Svensson, L. A new dynamic chamber technique for measuring ammonia emissions from land-spread manure and fertilizers. Acta Agric. Scand. Sect. B Plant Soil Sci. 1994, 44, 35–46. [Google Scholar] [CrossRef]
- Arogo, J.; Zhang, R.H.; Riskowski, G.L.; Christianson, L.L.; Day, D.L. Mass transfer coefficient of ammonia in liquid swine manure and aqueous solutions. J. Agric. Eng. Res. 1999, 73, 77–86. [Google Scholar] [CrossRef]
- He, Z.-L.; Alva, A.K.; Calvert, D.V.; Banks, D.J. Ammonia volatilization from different fertilizer sources and effects of temperature and soil pH. Soil Sci. 1999, 164, 750–758. [Google Scholar] [CrossRef]
- Fan, X.H.; Li, Y.C.; Alva, A.K. Effects of temperature and soil type on ammonia volatilization from slow-release nitrogen fertilizers. Commun. Soil Sci. Plant Anal. 2011, 42, 1111–1122. [Google Scholar] [CrossRef]
- Hichri, H.; Accary, A.; Puaux, J.P.; Andrieu, J. Gas-liquid mass-transfer coefficients in a slurry batch reactor equipped with a self-gas-inducing agitator. Ind. Eng. Chem. Res. 1992, 31, 1864–1867. [Google Scholar] [CrossRef]
- Lee, S.-R.; Yates, S.R.; Robarge, W.P.; Bradford, S.A. Synergistic ammonia losses from animal wastewater. Atmos. Environ. 2013, 71, 245–250. [Google Scholar] [CrossRef]
- Ko, J.-I.; Park, G.-H.; Bae, J.-S.; Oh, G.-Y.; Chung, S.-Y. A study on the odor characteristics and identification of microbial in biological swine manure treatment process by bioreactor. J. Korean Soc. Environ. Eng. 2015, 37, 526–532. [Google Scholar] [CrossRef]
- Jeong, C.-H.; Park, M.-J.; Jeong, D.-W. Reduction of odor from swine manure using soil microorganisms on liquid manure circulation system. J. Korean Soc. Water Sci. Technol. 2019, 27, 97–106. [Google Scholar] [CrossRef]
- Freney, J.R.; Denmead, O.T.; Watanabe, I.; Craswell, E.T. Ammonia and nitrous oxide losses following applications of ammonium sulfate to flooded rice. Aust. J. Agric. Res. 1981, 32, 37–45. [Google Scholar] [CrossRef]
- Rubæk, G.H.; Henriksen, K.; Petersen, J.; Rasmussen, B.; Sommer, S.G. Effects of application technique and anaerobic digestion on gaseous nitrogen loss from animal slurry applied to ryegrass (Lolium perenne). J. Agric. Sci. 1996, 126, 481–492. [Google Scholar] [CrossRef]
- Lim, E.S.; Ji, Y.H.; Han, S.J.; Song, S.W.; Sung, M.J.; Song, W.K. Hyperspectral image analysis study for liquid fertilizer contaminated area detection. In Proceedings of the Korea Society for Geospatial Information Science, Goyang-si, Korea, 18 November 2019; pp. 115–118. [Google Scholar]
- Sommer, S.G.; Hutchings, N.J. Ammonia emission from field applied manure and its reduction—invited paper. Eur. J. Agron. 2001, 15, 1–15. [Google Scholar] [CrossRef]
- Sommer, S.G.; Ersbøll, A.K. Soil tillage effects on ammonia volatilization from surface-applied or injected animal slurry. J. Environ. Qual. 1994, 23, 493–498. [Google Scholar] [CrossRef]
- Sommer, S.G.; Olessen, J.E. Modelling ammonia volatilization from animal slurry applied with trail hoses to cereals. Atmos. Environ. 2000, 34, 2361–2372. [Google Scholar] [CrossRef]
- Denmead, O.T.; Freney, J.R.; Simpson, J.R. Dynamics of ammonia volatilization during furrow irrigation of maize1. Soil Sci. Soc. Am. J. 1982, 46, 149. [Google Scholar] [CrossRef]
- Thompson, R.B.; Pain, B.F.; Rees, Y.J. Ammonia volatilization from cattle slurry following surface application to grassland. Plant Soil 1990, 125, 119–128. [Google Scholar] [CrossRef]
- Søgaard, H.T.; Sommer, S.G.; Hutchings, N.J.; Huijsmans, J.F.M.; Bussink, D.W.; Nicholson, F. Ammonia volatilization from field-applied animal slurry—the ALFAM model. Atmos. Environ. 2002, 36, 3309–3319. [Google Scholar] [CrossRef]
- Korea Meteorological Administration. Annual Climatological Report; Korea Meteorological Administration: Seoul, Korea, 2018; Publication number 11-1360000-000016-10.
- Sommer, S.G.; Misselbrook, T.H. A review of ammonia emission measured using wind tunnels compared with micrometeorological techniques. Soil Use Manag. 2016, 32, 101–108. [Google Scholar] [CrossRef]
- Watt, D.; Rochette, P.; Vanderzaag, A.; Strachan, I.B.; Bertrand, N. Impact of the oasis effect on wind tunnel measurements of ammonia volatilization from urea. Can. J. Soil Sci. 2016, 96, 485–495. [Google Scholar] [CrossRef] [Green Version]
- Woodley, A.L.; Drury, C.F.; Reynolds, W.D.; Calder, W.; Yang, X.M.; Oloya, T.O. Improved acid trap methodology for determining ammonia volatilization in wind tunnel experiments. Can. J. Soil Sci. 2018, 98, 193–199. [Google Scholar] [CrossRef]
- Sommer, S.G.; Webb, J.; Hutchings, N.D. New emission factors for calculation of ammonia volatilization from european livestock manure management systems. Front. Sustain. Food Syst. 2019, 3, 101. [Google Scholar] [CrossRef] [Green Version]
- Dattamudi, S.; Wang, J.J.; Dodla, S.K.; Arceneaux, A.; Viator, H.P. Effect of nitrogen of fertilization and residue management practices on ammonia emissions from subtropical sugarcane production. Atmos. Environ. 2016, 139, 122–130. [Google Scholar] [CrossRef] [Green Version]
- Sarwar, G.; Corsi, R.L.; Kinney, K.A.; Banks, J.A.; Torres, V.M.; Schmidt, C. Measurements of ammonia emissions from oak and pine forests and development of a non-industrial ammonia emissions inventory in texas. Atmos. Environ. 2005, 39, 7137–7153. [Google Scholar] [CrossRef]
- Aneja, V.P.; Blunden, J.; Claiborn, C.S.; Rogers, H.H. Dynamic chamber system to measure gaseous compounds emissions and atmospheric-biospheric interactions. In Environmental Simulation Chambers: Application to Atmospheric Chemical Process; Barnes, I., Rudzinski, K.J., Eds.; Springer: Dordrecht, The Netherlands, 2006; pp. 97–109. [Google Scholar]


| Liquid Fertilizer 1 | Liquid Fertilizer 2 | Liquid Fertilizer 3 | ||||
|---|---|---|---|---|---|---|
| pH | 9.07 | A * | 8.19 | b | 7.57 | c |
| Electrical conductivity (ms cm−1) | 18.02 | a | 10.72 | b | 8.73 | b |
| Total nitrogen (%) | 0.20 | a | 0.11 | b | 0.03 | c |
| Total ammoniacal nitrogen (mg L−1) | 1899 | a | 1021 | b | 189 | c |
| Total organic carbon (%) | 0.15 | b | 0.16 | b | 0.35 | a |
| Total phosphorous (mg L−1) | 190 | a | 48 | b | 183 | a |
| Suspended solid (mg L−1) | 4827 | b | 3373 | c | 6027 | a |
© 2020 by the authors. Licensee MDPI, Basel, Switzerland. This article is an open access article distributed under the terms and conditions of the Creative Commons Attribution (CC BY) license (http://creativecommons.org/licenses/by/4.0/).
Share and Cite
Kim, M.-S.; Kim, J.-G. Effects of Thickness of Solid Media, Ventilation Rate, and Chamber Volume on Ammonia Emission from Liquid Fertilizers Using Dynamic Chamber-Capture System (DCS). Agriculture 2020, 10, 226. https://doi.org/10.3390/agriculture10060226
Kim M-S, Kim J-G. Effects of Thickness of Solid Media, Ventilation Rate, and Chamber Volume on Ammonia Emission from Liquid Fertilizers Using Dynamic Chamber-Capture System (DCS). Agriculture. 2020; 10(6):226. https://doi.org/10.3390/agriculture10060226
Chicago/Turabian StyleKim, Min-Suk, and Jeong-Gyu Kim. 2020. "Effects of Thickness of Solid Media, Ventilation Rate, and Chamber Volume on Ammonia Emission from Liquid Fertilizers Using Dynamic Chamber-Capture System (DCS)" Agriculture 10, no. 6: 226. https://doi.org/10.3390/agriculture10060226
APA StyleKim, M.-S., & Kim, J.-G. (2020). Effects of Thickness of Solid Media, Ventilation Rate, and Chamber Volume on Ammonia Emission from Liquid Fertilizers Using Dynamic Chamber-Capture System (DCS). Agriculture, 10(6), 226. https://doi.org/10.3390/agriculture10060226