Article

Resource-Efficient Classification and Early Predictions of Carcass Composition in Fattening Pigs by Means of Ultrasound Examinations

1
Institute for Animal Nutrition, University of Veterinary Medicine Hannover, Foundation, D-30173 Hanover, Germany
2
Hoelscher + Leuschner GmbH & Co. KG; D-48488 Emsbueren, Germany
3
Clinic for Swine and Small Ruminants, University Veterinary Medicine Hannover, Foundation, D-30173 Hanover, Germany
4
Institute of Agricultural Engineering, University of Bonn, 53115 Bonn, Germany
*
Author to whom correspondence should be addressed.
Agriculture 2020, 10(6), 222; https://doi.org/10.3390/agriculture10060222
Submission received: 13 May 2020 / Revised: 6 June 2020 / Accepted: 7 June 2020 / Published: 10 June 2020
(This article belongs to the Special Issue Productivity, Efficiency, and Sustainability in Agriculture)

Abstract

:
The development of the backfat thickness of fattening pigs in relation to their weight allows first conclusions to be drawn concerning the efficiency of individual growth and classification of the carcass. The hypothesis was that, firstly, via measurement of backfat thickness and muscle diameter, their ratio and the quality of the carcass can be predicted and that, secondly, using resource-efficient and sustainable feeding has no negative effects on the carcass. Over a 70-day period, ultrasound examinations of backfat and musculus longissimus dorsi were performed in a pen with sorting gates and automatic body mass recordings every two weeks on 121 animals of the same age, starting at approximately 50 kg. Data were subdivided into four groups for each measurement time. There was weak (Examination 1: r = −0.28164; p = 0.0018) but steadily increasing correlation (Examination 5: r = −0.60657; p ≤ 0.0001) between the backfat/muscle ratio and the carcass quality. In all four groups, significant differences in the diameter of the M. longissimus dorsi (“light fat (LF) = 3.29 cm; “light lean (LL)” = 3.62 cm; “heavy fat (HF)” = 3.69 cm; “heavy lean (HL)” = 3.93 cm) and in backfat thickness (LF = 0.44 cm; LL = 0.38 cm; HF= 0.47 cm; HL= 0.39 cm) could be shown during the first examination.

1. Introduction

Consumer preferences regarding pork changed significantly in the last century [1]. Since the 1960s, consumers express an increased desire for leaner pork [2] such that the fat content of slaughter pigs fell from 35% to 23% in recent decades [3]. Body composition is of crucial importance for the marketing of pork [4], as fattened pigs are paid at the slaughterhouse based on lean meat content [5]. To achieve the highest price, the pig must have a certain slaughter weight and a high muscle percentage [5], which is the aim in pig fattening [6]. Accordingly, genetic selection increasingly focuses on increasing the lean meat proportion while at the same time reducing the proportion of fat [7]. The composition of the mass growth of a fattening pig changes in the course of its growth. When reaching a body mass of 60–70 kg, the relative protein content of the body mass decreases, while the fat content increases more and more [8,9]. In addition, the body composition is determined by genetics and sex. According to Kirchgeßner 2014, the genetic determined protein accumulation capacity has a significantly higher effect on the protein accretion than the different protein and energy supply [10]. Boars show the highest percentage of muscle meat at 61% with a low fatty content of 19%. The sows were, with 59% lean meat content and 22% fat, between the boars and the castrates. Castrates had the lowest meat content at 57% and the highest fat content at 25% [11]. Different dietary recommendations are issued by the German Society of Nutritional Physiology (GfE) for female and male pigs, as well as for meat-poor and meat-rich pigs [12]. In today’s feeding of fattening pigs, the differentiation between gender, genetic variation in one gender, and different feed intake capacities still needs to be improved.
The difficulties are limitations in protein utilization, as well as different feed intake capacities [13]. Only about 30% of the ingested protein is metabolized efficiently and used to gain muscle mass [14]. It was also shown that multi-phase feeding strategies, with adaption to the changing protein requirements of the animals during the fattening period, are preferable to single-phase feeding [15]. However, since current concepts of phase feeding are only based on the average nutrient requirements of the animals, the individual needs are not taken into account sufficiently well [16]. At present, the fattening pigs are sorted by weight and put in weight groups. The feed is designed only according to the average growth of the group. Furthermore, pigs differ genetically within the group in the level of feed intake, as well as in the composition of the growth, i.e., animals with a high fat content could be fed more efficiently by adapting the feed to the feed intake capacity.
This can lead to a reduction in the use of resources without having a negative impact on performance, i.e., improved profitability. The approach of classifying and further subdividing pigs during the fattening phase could lead to more individualized feeding, which could be adapted to actual needs. Feeding plays a key role in efficiently achieving maximal muscle growth with a minimum fat accumulation.
The supply of energy and nutrients, which goes beyond the requirements, leads to a significantly increased production of fat in the last third of the fattening period. An excess of protein above demand cannot further stimulate meat production [8,17]. The level of body fat in the case of castrates rises more than that of females [10,18]; thus, limiting energy supply is often done by rationing the feed amount allocation to prevent fatty degeneration [19,20]. In the context of the best possible promotion of animal welfare, a restrictive feed allocation in the final fattening is being increasingly criticized [21]. This is because a restricted available amount of feed for the individual animal can be a stressful situation [22,23], promoting the occurrence of aggressive behaviors [24].
Due to the strictly regulated price calculation at the abattoirs, it is important to be able to make predictions on how the body composition might evolve during fattening at an early stage of the fattening process. With this in mind, it might be possible to offer an adapted ration for different types of fattening pigs [16] and, thus, to adapt the carcass quality to the existing pricing. To relate the slaughter data evaluation to ultrasound images during the fattening period and, thus, to draw early conclusions on the body composition of the fattening pigs is a completely new concept. In addition, based on the new findings, a feeding concept is to be developed which prevents an excess of protein and energy and, thus, reduces the excreted nitrogen levels. At the same time, it will be examined whether a new classification of the pigs has a negative influence on the carcass quality of the fattening pigs and whether an early classification is advantageous. The finding that pigs have different growth potential at an early stage, despite identical conditions, means that, with more individual feeding and rations adapted to actual requirements, more efficient feeding can be achieved and a foundation stone laid for resource-efficient pig fattening.
The aim of this study was firstly to test a classification that takes into account both body weight and intra-sexual variations in meat and fat content, and to develop a feeding system that is as resource-efficient as possible by controlling the nutrient and energy concentrations in the feed in relation to the level of feed intake and body development of the pig, with a newly adapted feeding concept. Secondly, it was necessary to investigate when and if it is possible to predict early on how the carcass will be ratified under the conditions of ad libitum feeding of pigs at the abattoirs. For this project, the parameters body mass, backfat thickness, and diameter of the musculus longissimus dorsi (at the level of the last rib) were recorded.

2. Materials and Methods
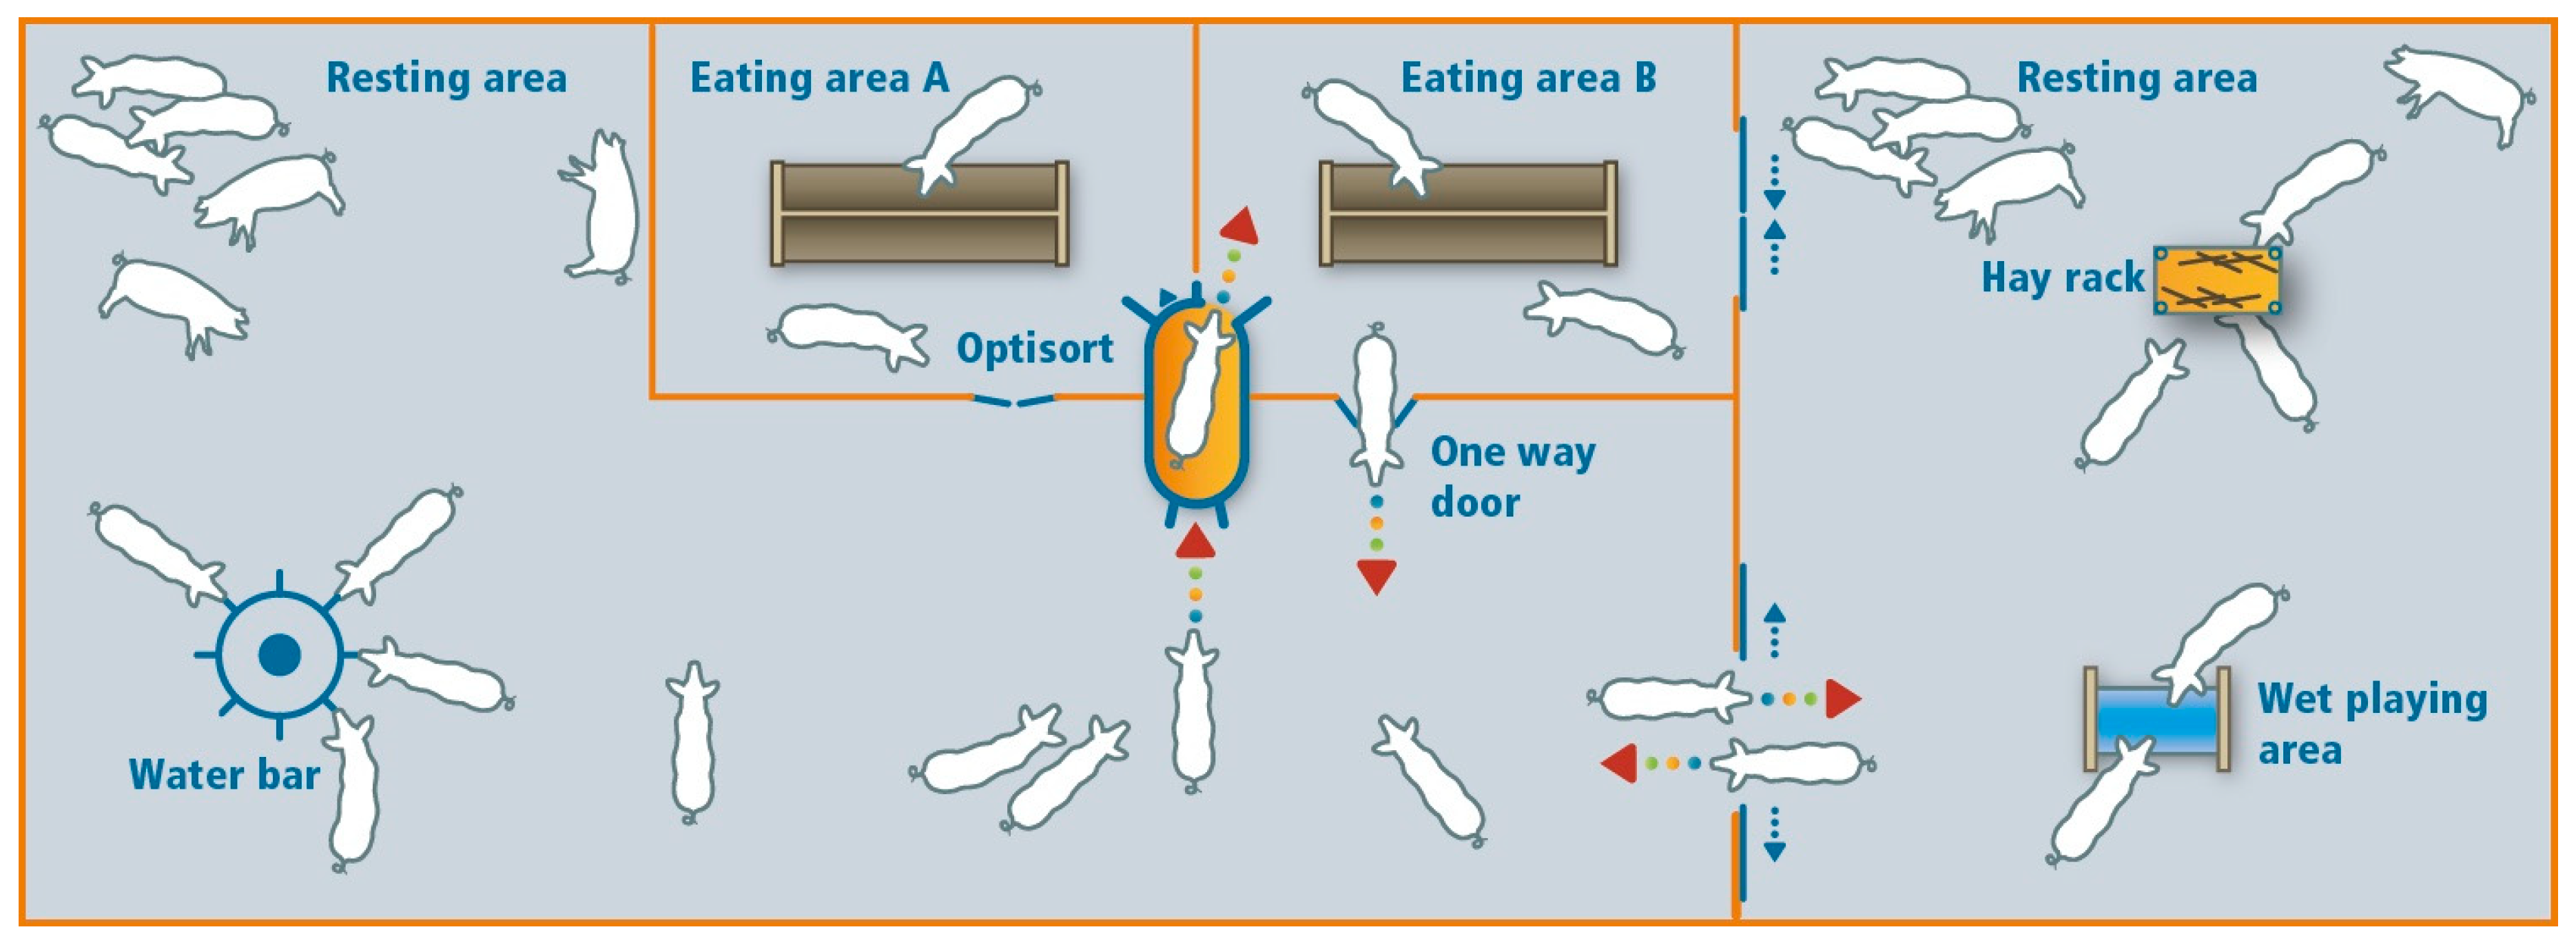
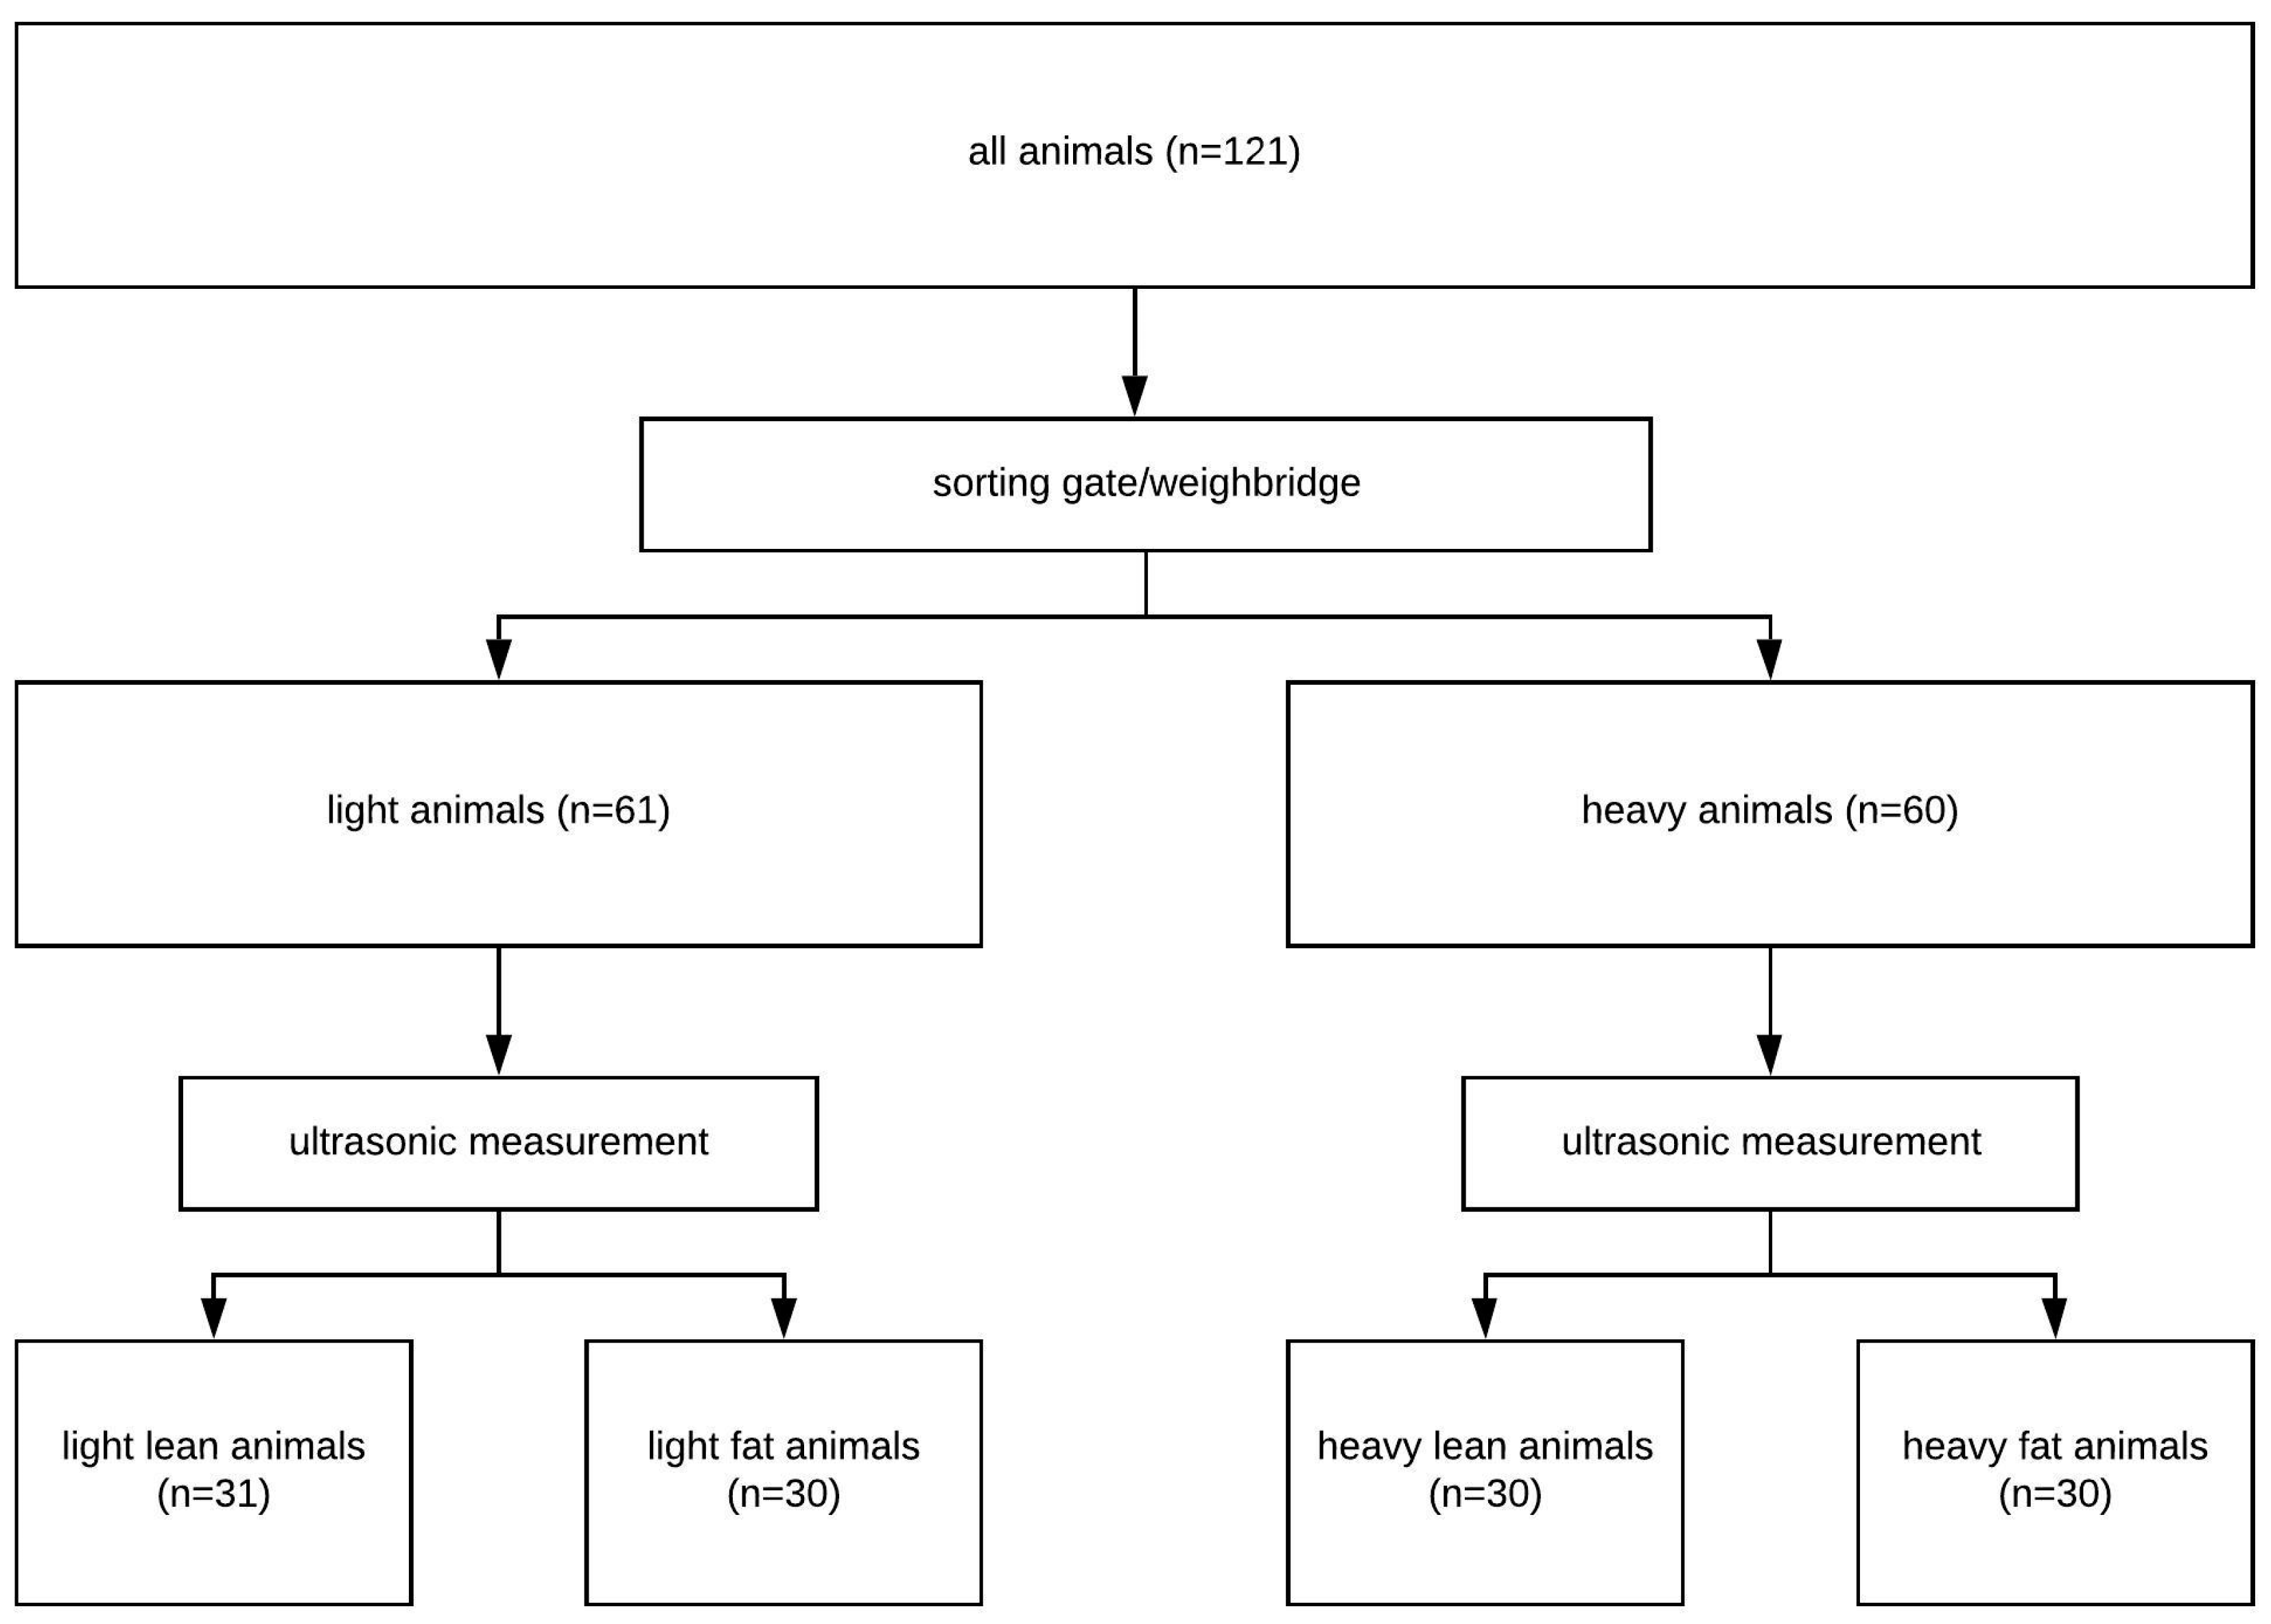
The investigations were carried out in a fattening barn in Lower Saxony in Germany. Animals were housed in a large group stable. This was equipped with a sorting gate from the company Hoelscher & Leuschner (®Hoelscher + Leuschner GmbH & Co. KG, Emsbueren, Germany), which was able to move the animals from one large room with activity and lying areas into two separate feeding areas (feeding areas “A” and “B”). In each feeding area was a trough, which could be filled in each case via a feeding valve (valve 1–2) with a feed in liquid form of different composition. An overview of the barn is given in Figure 1.
The sorting gate consisted of an entrance door, a measuring area (including a scale, three-dimensional (3D) camera, and ear tag recognition) and two exit doors through which the animals could be guided depending on their specific setting. The animals had to pass through the sorting gate to reach the feeding areas. The sorting gates allowed for the detection and recording of individual animal data via transponder ear tags [16]. By means of camera technology, which was installed above the sorting gate, each animal was recorded when it went through the gate, and the live weight was calculated by measuring the height and width of the animal with the assistance of special software (optiSORT, Hoelscher + Leuschner GmbH and Co. KG, Emsbueren, Germany). In addition, a mechanical weighbridge was integrated in the bottom of the sorting gate so that the current body weight of each animal could be determined. The correlation of optical and mechanical weight determination was verified by Cielejewski et al. [25] and used as the basis for this study.

2.1. Animals

The housed 121 piglets were crossbred products of a Danzucht and Bundeshybridzuchtprogramm (BHZP; German Federal Hybrid Breeding Program). The animals were all from a litter group and the males were castrated as suckling pigs. Their average body weight at the time of housing was about 30 kg. The feeding schedule was not changed for the study so that the regular feeding patterns were used.

2.2. Feeding

The fattening pigs on the farm were fed exclusively with liquid feeding. The liquid feed for fattening pigs was composed of a total of three different components (complete feed, supplementary feed, and feed material) in different percentage proportions. The complete feed “CF” and the supplementary feed “SF” were used as a sole component and as part of the compound feed. Corn-Cob-Mix “CCM” was used as the farm’s own feed material. The components were used according to the average live weight and the classification into the different groups of animals in different ration proportions (Tables S1 and S2, Supplementary Materials).
The liquid feeding was carried out fully automatically using a system of Hoelscher & Leuschner (®Hoelscher + Leuschner GmbH & Co. KG, Emsbueren, Germany). The sensors for measuring the level in the troughs were set accordingly so that, during feeding, when the level of food in the trough became low, feed was replenished again. The water supply was additionally provided by an open drinking trough and drinking nipples.

2.3. Feeding Scheme

The feed was offered to all feeding groups ad libitum throughout the fattening period. The composition of the offered feed changed over the course of the fattening period, in order to meet energy and nutrient demands as far possible. The sorting gate automatically determined the average body mass of the feeding group and divided the animals into 50% “light” and 50% “heavy” animals. Based on this subdivision, the individual animals were sorted into the appropriate feeding area. Table 1 shows examples of three different diets for the “light” or “heavy” animals at 50 kg, 60 kg, and 70 kg body mass, respectively.

2.3.1. Body Mass

Upon entering the sorting gate, the body mass of each individual animal was recorded by means of a mechanical weighing bridge which was regularly calibrated and developed by ®Hoelscher + Leuschner GmbH & Co. KG (Emsbueren, Germany). The measured data were stored on a computer so that accurate daily weight development data could be read [16]. The starting body mass could only be specified as average starting body mass by the delivery note. The daily gains were calculated based on the first weight measured at the sorting gate. Accordingly, the average daily weight gain per fattening day was not divided by the total number of days of fattening but by the days of fattening from the activation of the sorting gate (same day as the first ultrasound examination) until the last ultrasound examination.

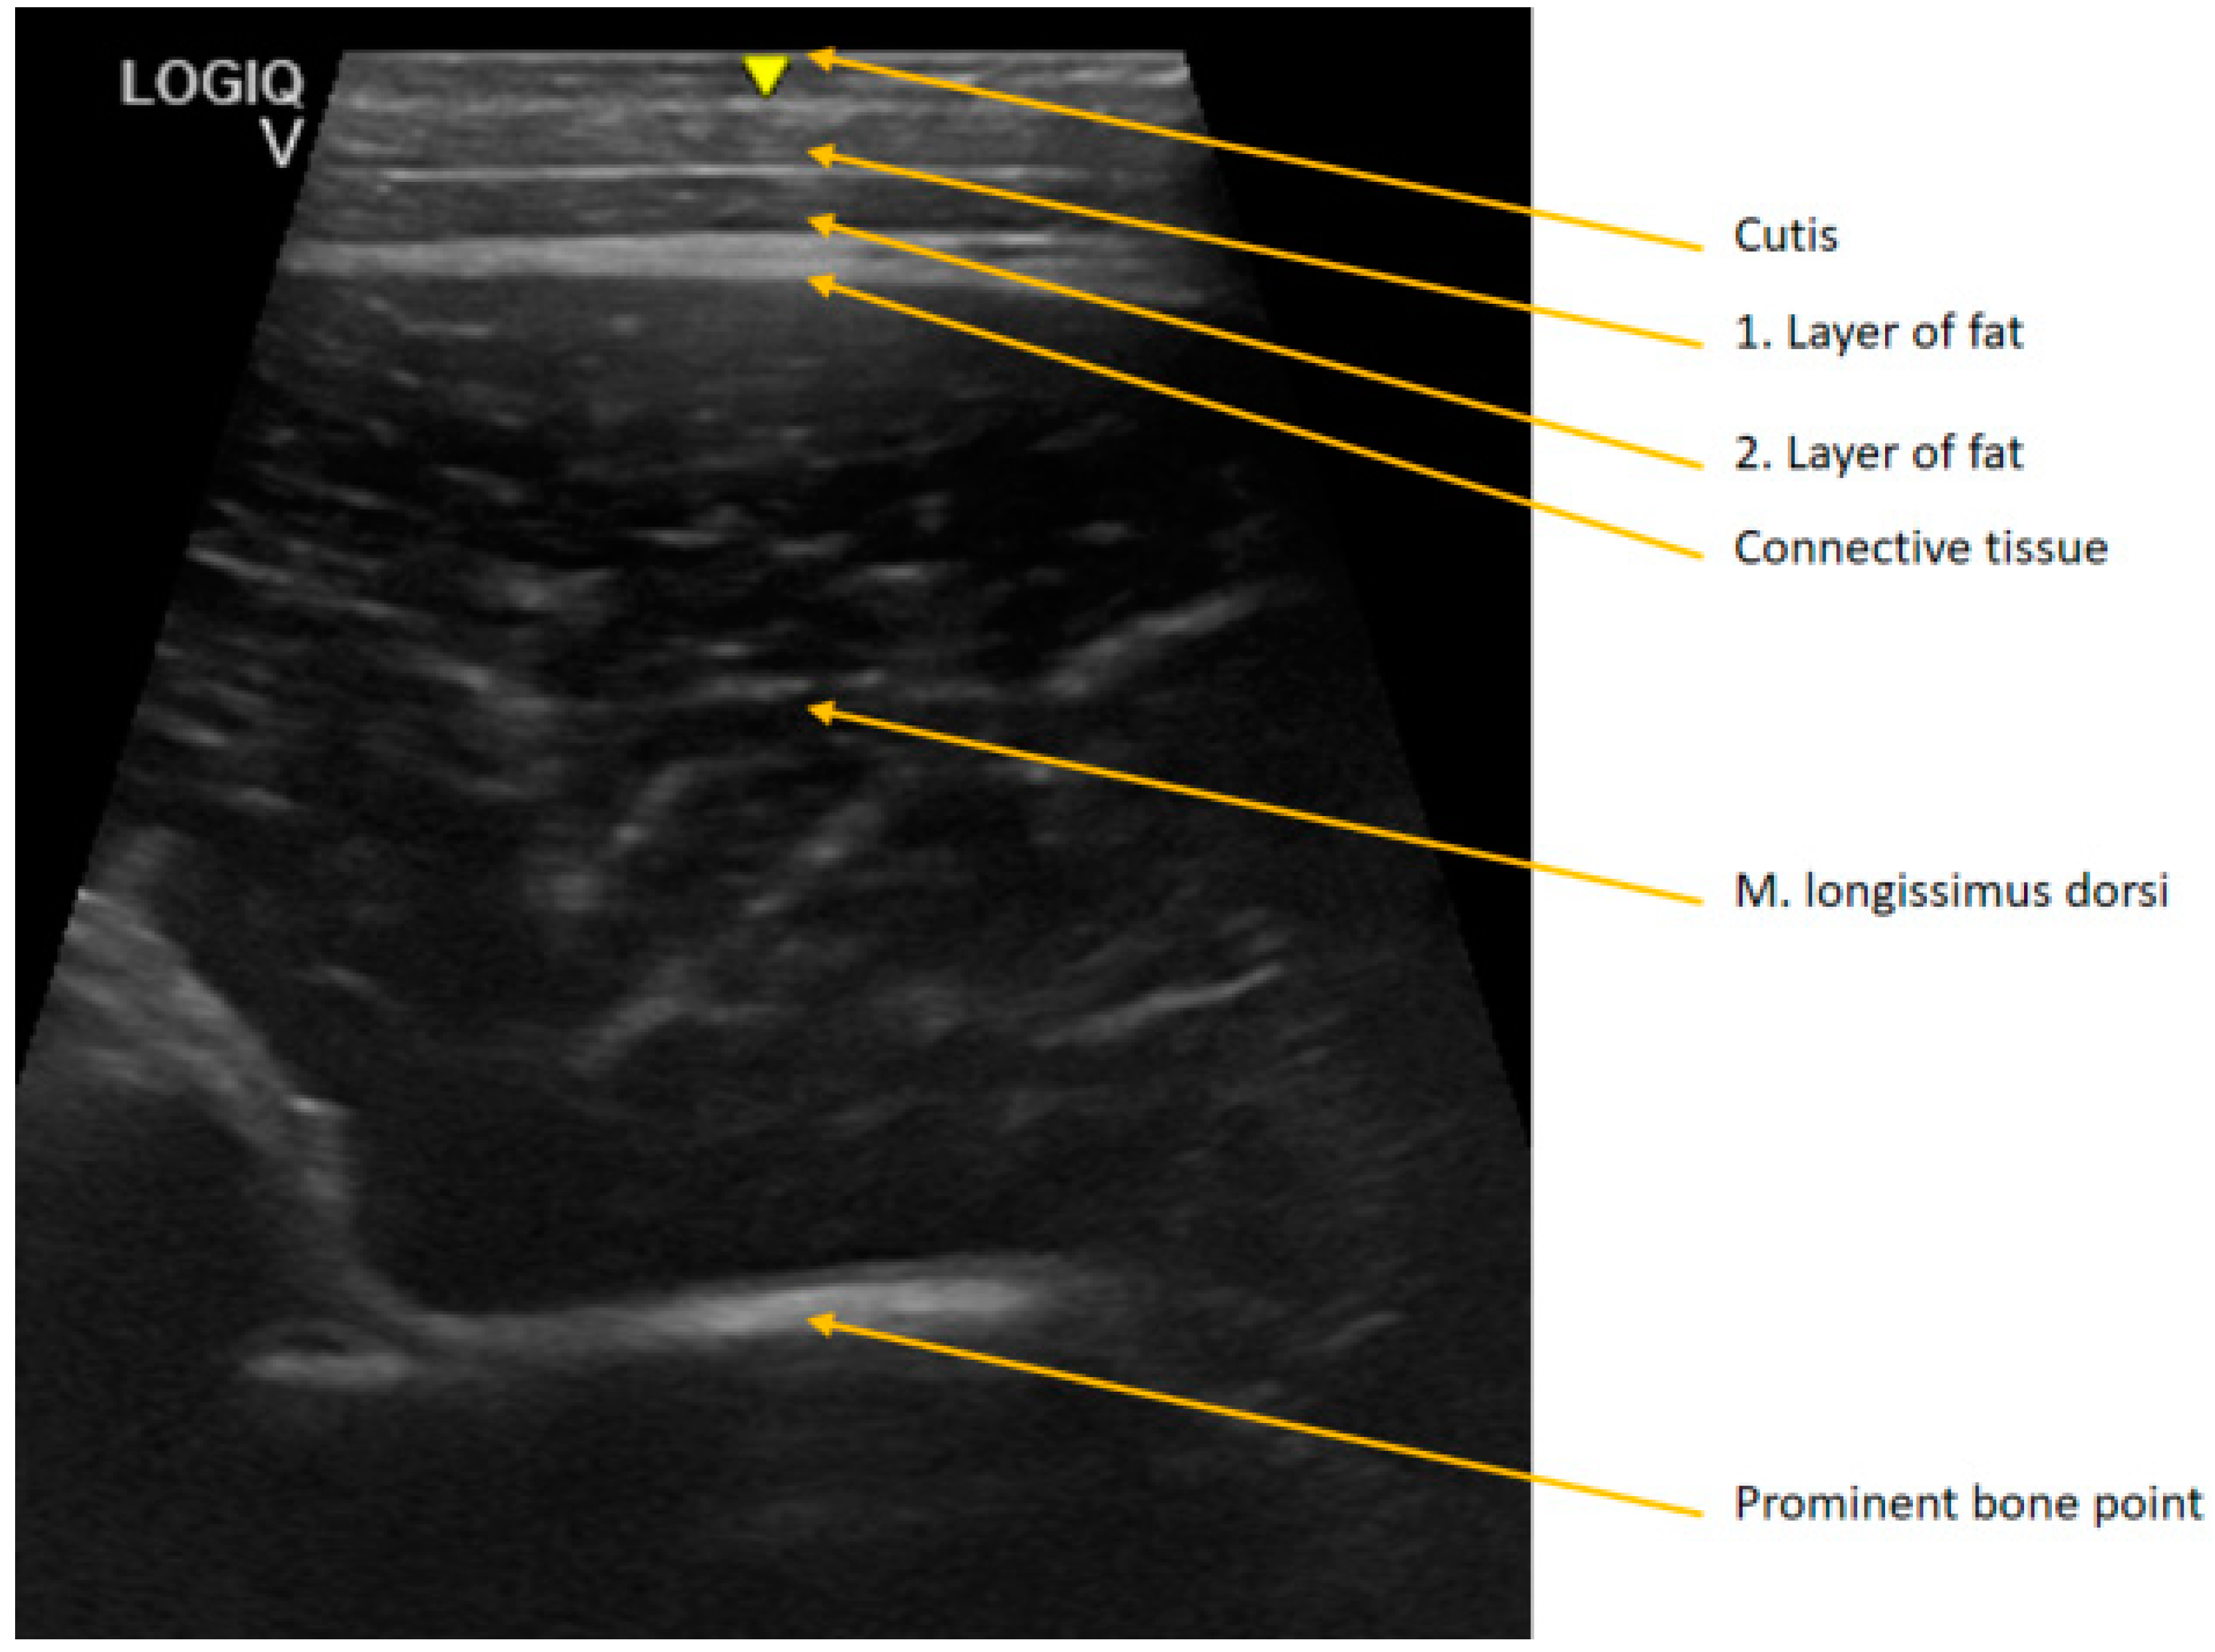
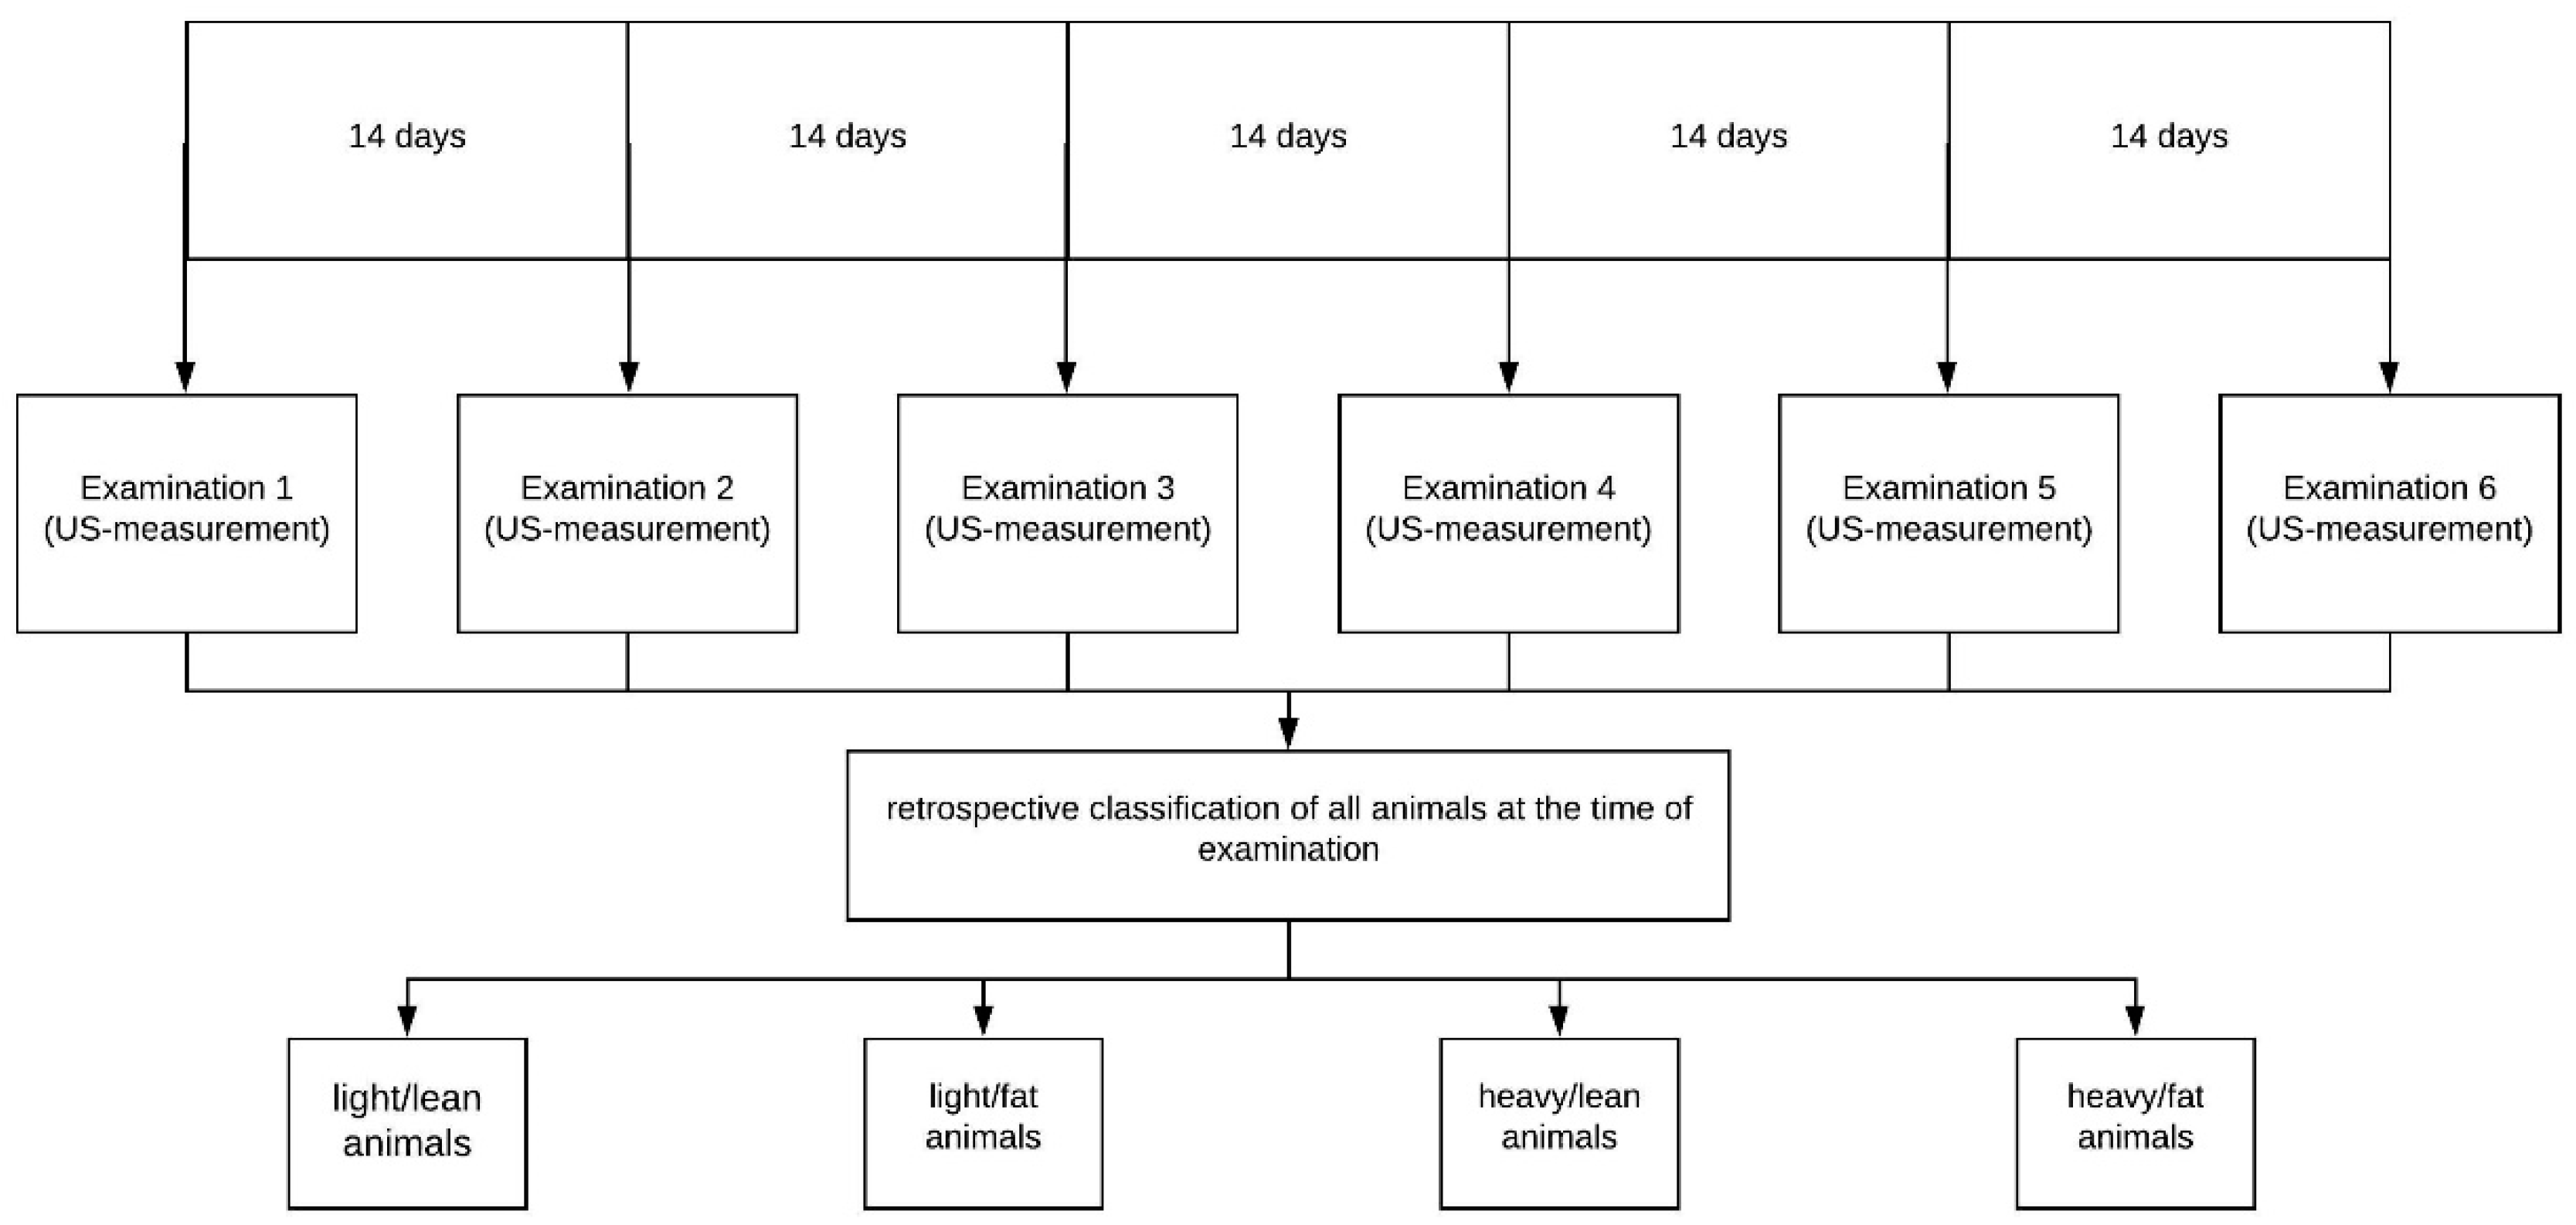
2.3.2. Ultrasound Examination

The ultrasound examination was performed with the LOGIQ® V2 device (GE Healthcare, Little Chalfont, Great Britain). The measurement was made at the exit gate after the feed intake of the animals. The side of the spine at the height of the last rib on the left body side was chosen as the measuring point. This measuring point was based on the P2 measuring point [3]. Since, in younger animals, the greatest possible muscle thickness cannot be detected 6–8 cm laterally of the back line [17], the point was adapted to the body mass and the body condition of the growing animal. In order to examine the same point with each measurement, a prominent bone point was used which was anatomically visible on the ultrasound image (Figure 2).
The backfat and muscle thickness were determined every 14 days for all 121 animals. The measurement was performed on the longissimus dorsi muscle and the backfat thickness, which consists of the skin, the first layer of fat (subcutis), and the second layer of fat (interfascial fat layer), as well as the connective tissue, which is located above the longissimus dorsi muscle, and the muscle thickness of the aforementioned muscle was recorded (Figure 2) [26].

2.3.3. Slaughter Data Analysis

The animals were slaughtered at Westfleisch’s abattoir in Oer-Erkenschwick, Germany. By reading the transponder ear tags at the abattoir, the carcasses could be assigned to the corresponding animal in the individual list of the slaughter data statement.
The abattoir price was calculated at the abattoir on the basis of the carcass quality, which describes the carcass formation with its meat-forming parts and the amount of fat [17]. Auto-FOM marketing is based on the function of fully automated ultrasound equipment [26]. The pig is pulled undivided onto its back by a metal rod in which 16 ultrasound heads are integrated. These heads measure the tissue composition at a distance of 5 mm, producing sectional images from which individual data on bacon and meat size can be obtained [19,27,28]. From these data, mathematical formulae are used to determine the lean meat content, the amount of carcass fat, and the total carcass and cuts [10,26]. Payment in the context of Auto-FOM marketing is based on so-called index points [29]. A multiplier is applied to each cut in relation to the most valuable cut “salmon” [5]. The total number of index points is calculated using a current market price factor [10].

2.3.4. Grouping

The group classification of the animals was retrospective. The groups were divided according to the parameters of body weight and the ratio between backfat and the diameter of M. longissimus dorsi. Based on the weighing data of all 121 animals, the animals were subdivided into “light” (n = 61) and “heavy” (n = 60) in roughly equal proportions. In addition, all 121 animals were categorized as “fat” and “lean” based on the ultrasound data and the calculated backfat/muscle ratio. The categorization was carried out for both the light and the heavy animals, so that 50% of the light animals with low backfat/muscle ratio (“light lean (LL)”) formed the first group and the other half of the light animals with a high backfat/muscle ratio (“light fat (LF)”) formed the second group (Figure 3). Among the heavy animals, there were groups “heavy lean (HL)” and “heavy fat (HF)”, analogous to the “light” groups.
The classification of the individual animals in the subgroups could change after each measurement and the corresponding grouping (Figure 4).

2.4. Statistical Analysis

Data analysis was performed using the statistical software package from SAS, Version 7.1 (SAS Inst., Cary, NC, USA). All measured data were analyzed descriptively by sample size, mean values, confidence interval, standard deviation, minimum, and maximum.
All charts were created with MS Office Excel 2016. The group comparisons were performed by one-way analysis of variance (ANOVA) for independent samples. In general, the Ryan–Einot–Gabriel–Welsch multiple-range test (REGWQ) was used for multiple pairwise means comparisons between the four groups. All correlations were performed and calculated according to Pearson. All statements of statistical significance were based on p < 0.05.

3. Results

Firstly, it was considered how to classify the animals properly to distinguish the different types of pigs. For this purpose, the animals were divided into the first step by weight in 50% “heavy” and 50% “light” animals. Therefore, the “heavy” and the “light” group were once again divided according to the ratio of backfat and muscle diameter of the M. longissimus dorsi. The resulting groups were as follows: “light fat” (LF); “light lean” (LL); “heavy fat” (HF); “heavy lean” (HL).
This classification highlighted the significant differences in body composition (Table 2).
In the row “body weight”, the significant difference between the “light” (L/LF/LL) and the “heavy” (H/HF/HL) groups became immediately clear.
The line backfat/muscle ratio showed a significant difference between the “fats” (LF/HF) and the “leans” (LL/HL) in examinations one, two, and five. At the third examination, a significant difference among LF, LL, and HL could be shown. In addition, there was still a significant difference between HL and HF. The fourth study found no significant differences.
Another aspect of the retrospective evaluation was to determine the optimal and most informative time for the classification of pigs in different groups.
For this purpose, the animals were retrospectively classified at the various ultrasound examinations (Table 3, Table 4 and Table 5), and it was examined at what point in time the classification was still meaningful at the end of fattening.
The division was made according to the pattern described above after the first ultrasound examination. At the end of fattening, no significant differences could be shown, especially in the fat thickness.
The division was made according to the pattern described above after the second ultrasound examination. At the end of fattening, significant differences between the four different groups in fat thickness could be shown. The significant differences in muscle thickness were able to be mostly visualized between the heavy and light groups.
The division was made according to the pattern described above after the third ultrasound examination. At the end of fattening, some significant differences in the fat thickness between the four different groups could be shown. The significant differences in muscle thickness could be partially shown between the heavy and light groups.
In order to explain the variations in the significance of the muscle thickness (Table 3, Table 4 and Table 5), it was checked whether there was a direct correlation between the muscle diameter and the body weight (Table 6). The animals were firstly evaluated as a whole. A second step was to perform the evaluation in the subgroups with the classification after the first examination.
It should be noted that there was a linear correlation between body mass and the muscle diameter. A closer look at the correlations in the various groups revealed that the “heavy lean” group had the strongest correlation. For the animals in the “fatter” groups, there was not always a meaningful correlation (e.g., Examination 3, Group HF).
To establish a link between the ultrasound examinations and the slaughter data, the first step was to see whether the ratio between backfat thickness and M. longissimus dorsi correlated with the ratio between bacon and meat size (Table 7).
As a result, it became clear that there was a correlation between the two ratios. This became stronger as the examination approached the slaughter date.
As a next step, a direct correlation between the collected data and the determined index points should be derived. For this purpose, it was examined whether there was a correlation (Table 8).
There was a weak negative correlation between the index points per kg and the ratio of backfat/muscle. The later the examination was performed, the better the examinations correlated with each other.

4. Discussion

The overall objective of this study was to find a new resource-efficient approach to fattening pig feeding. In order to substantiate the idea of resource efficiency, the first step was to look at how differently the animals develop during a fattening phase (Section 4.1). The second challenge was to find the optimal point in time for a new classification where diversity allows conclusions to be drawn regarding individual development (Section 4.2). Finally, it should be investigated whether and what connection could exist between resource-efficient feeding and carcass development (Section 4.3).

4.1. Heterogeneity of Animals and a Possibility for Resource-Efficient Classification

Although fattening pigs are fed the same feed on most farms, the body composition develops in a clearly different way. A simple and clear parameter is body weight. A significant difference in weight between light (L) and heavy (H) animals was shown in Table 2. Due to the backfat/muscle ratio between the groups L and H, no significant differences could be seen, such that simple weight differentiation was not sufficient for efficient feeding of the individual animals. This may be due to the fact that not all fattening pigs are able to make efficient use of the high feed intake capacity and the associated high energy and protein intake, even if the energy-to-protein ratio and the aminogram are optimally available. As a result, the animals produce more fat tissue and excrete more nitrogen [30].
The next step was to further subdivide the animals according to their backfat/muscle ratio. Four different groups were formed (LL/LF/HL/HF). The significant difference in body weight between the light groups (LL/LF) and the heavy groups (HL/HF) remained constant. A possible starting point could be the mass growth of the fattening pig, which changes during its development. At a body mass of 60–70 kg, the protein content of the body mass decreases and the fat content increases further [7,8]. Genetics and gender also play a major role in the composition of the body mass. According to Kirchgeßner 2014, the genetic protein attachment capacity has a significantly higher influence on the protein attachment than the different protein and energy supply via the feed [9]. This statement is supported by the literature describing that there is a higher fat cover in castrates compared to female fattening pigs [31,32,33]. According to our findings, a solely gender-separated grouping was not sufficient for differentiated and further optimized feeding according to the requirements. In addition, there is often the problem in practice that it is not possible to obtain only female or castrated young animals. Therefore, the study was designed to find a classification in which the animals can be kept in mixed-gender housing and still be fed according to demand and resource-efficiently. If the sexual differences in growth potential described in the literature are combined with studies of body composition in terms of backfat thickness and the diameter of the M. longissimus dorsi (Table 2), it becomes clear that a further division of the animals into subgroups is necessary in order to ensure resource-efficient feeding that is optimized to individual requirements.

4.2. Finding the Optimal Time for Grading the Fattening Pigs

Once the classification of the animals into four subgroups proved to be useful, the aim was to determine the right time for classification. For this purpose, the groups were performed retrospectively after studies 1, 2, and 3 (Table 3, Table 4 and Table 5). A later date was not considered useful because there would then be too little time for effective intervention in feed management and adapted body composition.
There were significant differences in the diameter of M. longissimus dorsi between the light and heavy animals at the time of classification (Table 3). However, this alone was not sufficient as there were no significant differences between the backfat of the light and heavy animals. Looking at the four subgroups, there were significant differences between the fat (LF/HF) and the lean animals (LL/HL) in the backfat. This changes during fattening, such that, in the classification after the first ultrasound examination, no significant differences were found at the time of the last examination.
However, it became clear in the later classifications that there were significant differences in the diameter of M. longissimus dorsi between the light and heavy animals. It was only from the second examination point onward that significant differences in backfat between the two last examinations became apparent (Table 4), especially with regard to the clear distinction between the fat (LF/HF) and the lean (LL/HL) animals. This was also shown in the later evaluations, but not as clearly as in the previous table (Table 5).
On the basis of the new findings and the significant differences in the tables, it is, therefore, assumed that, for resource-conserving feeding, it is necessary to differentiate the animals into more than two subgroups (e.g., by weight or gender) and that this should be done, for example, using the newly examined method at an average body weight of 61.19 kg (Table 4; Examination 2).

4.3. Relationship between Ultrasound Examinations and Slaughter Data

It can be stated that there is a linear relationship between body weight and muscle diameter. On closer examination, however, it became clear that there were significant differences in the subgroups. A higher fat percentage in the body composition led to a lower correlation (e.g., Examination 3, group HF). It is, therefore, not sufficient to draw direct conclusions from body weight to the diameter of the back muscle (Table 6). There is a clear correlation between the collected ultrasound data and the slaughter data, which increases with the age of the examination. In addition, it was shown that the collected ultrasound data (ratio backfat/muscle) correlate with the slaughter data (fat measure/meat measure) (Table 7). From this, it can be concluded that the body composition can be predicted by precise ultrasound measurement.
It is clear from the investigations that a tendency can be established in the correlation between the index points and backfat/muscle ratio (Table 8). This allows an early detection of the type of fattening pig and an adapted resource-efficient feeding. Furthermore, it was shown that the classification of the pigs into specific subgroups and the conclusions on carcass quality (index points) can be made at an early stage, becoming more accurate toward the end of the fattening period.
The next step was to examine whether the classification of pigs into subgroups has an impact on slaughter data and the associated index points. Unfortunately, the same applies here; the later the investigation took place, the more accurate the conclusions on the index points could be predicted.
In summary, early conclusions on the development of body mass composition and slaughtering data can be drawn, thus providing the option of feeding the fattening pigs more individually and more resource-efficiently, even though the correlations between body composition and slaughter data are not as strong as expected. Furthermore, a more practical replacement for ultrasound examinations would have to be found. However, by classifying pigs into subgroups at an early stage, resource-efficient and more individualized feeding would be possible. Newly developed feeding systems (slowing down the feed intake of fat-prone animals or similar) could have a direct influence on carcasses and make production more resource-efficient.

5. Conclusions

An important aspect of this retrospective study is that resource-efficient feeding could be established by a more individualized classification of fattening pigs using ultrasound. The more precise classification of the animals could lead to the animals producing less fat and, thus, to more sustainable fattening.
The influence on the efficiently fed animals and, thus, the positive aspects in achieving the standardized best possible body composition are also given. Therefore, it can be stated that a more precise classification of the animals has a lasting effect and definitely no negative influence on the body composition. Therefore, there is no negative impact on the performance of fattening pigs in relation to the target body composition required by abattoirs.
Further studies are necessary to implement these findings and to control the animals in their feed intake.

Supplementary Materials

The following are available online at https://www.mdpi.com/2077-0472/10/6/222/s1, Figure S1. Scatterplot between body mass and musclediameter at time of Examination 1; Figure S2. Scatterplot between body mass and musclediameter at time of Examination 5; Table S1. Chemical composition of “CF” and “SF” in accordance with declaration. For Corn-Cob-Mix, the results of feed analyses are given in the Institute for Animal Nutrition Hannover (88% DM); Table S2. Feed composition; Table S3. Correlation between body mass and muscle diameter at time of Examination 1; Table S4. Correlation between body mass and muscle diameter at time of Examination 5.

Author Contributions

Conceptualization, B.R., C.S., A.L., U.S., R.H., K.-H.W., and C.V.; methodology, B.R., C.S., A.L., U.S., R.H., K.-H.W., and C.V.; software B.R.; validation, B.R. and C.V.; formal analysis, B.R.; investigation, B.R. and U.S.; resources, R.H., K.-H.W., and C.V.; data curation, B.R.; writing—original draft preparation, B.R.; writing—review and editing, C.V.; visualization, B.R.; supervision, K.-H.W. and C.V.; project administration, R.H., K.-H.W., and C.V.; funding acquisition, R.H., K.-H.W., and C.V. All authors have read and agreed to the published version of the manuscript.

Funding

This research was funded by the German Federal Environmental Foundation, 33449/01-36. This publication was supported by Deutsche Forschungsgemeinschaft and University of Veterinary Medicine Hannover Foundation within the funding program Open Access Publishing.

Acknowledgments

We wish to thank Frances Sherwood-Brock for proofreading the English manuscript.

Conflicts of Interest

The authors declare no conflicts of interest. The funders had no role in the design of the study; in the collection, analyses, or interpretation of data; in the writing of the manuscript, or in the decision to publish the results.

References

  1. Font-I-Furnols, M.; Tous, N.; Esteve-Garcia, E.; Gispert, M. Do all the consumers accept marbling in the same way? The relationship between eating and visual acceptability of pork with different intramuscular fat content. Meat Sci. 2012, 91, 448–453. [Google Scholar] [CrossRef] [PubMed]
  2. Peter, F. Untersuchung zu Zusammenhängen zwischen den Ergebnissen der Eigenleistungsprüfung und dem Erstbelegungsalter von Jungsauen und deren späteren Fruchtbarkeitsleistungen. Neubrandenburg, Hochschule Neubrandenburg, Masterarbeit. Züchtungsk 2011, 83, 182–190. [Google Scholar]
  3. Hesse, A. Entwicklung Einer Automatischen Konditionsfütterung für Sauen Unter Besonderer Berücksichtigung der Tierleistung; Bundesanstalt für Landwirtschaft (FAL) Landbauforschung: Völkenrode, Germany, 2003; p. 253. [Google Scholar]
  4. Eckert, S.; Müller, U.; Gschwender, F.; Bergfeld, U.; Schöberlein, L. Drei Vaterrassen im Test: Wer hat die Nase vorn? SUS 2001, 49, 32–35. [Google Scholar]
  5. Beuck, J. Mit AutoFOM in Ein Neues Zeitalter. eingesehen am 05.03.2016. Available online: http://westfleisch.de/fileadmin/Bilder/03_Landwirtschaft/03.04_Info_Landwirte/03.04.10_2000/03.04.10.00_AutoFOM_11_12_2000.pdf (accessed on 10 November 2019).
  6. Verordnung über gesetzliche Handelsklassen für Schweineschlachtkörper (Schweineschlachtkörper-Handelsklassenverordnung) in der Fassung der Bekanntmachung vom August 1990(BGBl. I S. 1809), die zuletzt durch Artikel 2 der Verordnung vom Januar 2019 (BGBl. I S. 2) geändert worden ist. Available online: https://www.gesetze-im-internet.de/hdlklschwv_1986/BJNR126240986.html (accessed on 17 January 2020).
  7. Gilbert, H.; Billon, Y.; Brossard, L.; Faure, J.; Gatellier, P.; Gondret, F.; Labussière, E.; Lebret, B.; Lefaucheur, L.; Le Floch, N.; et al. Review: Divergent selection for residual feed intake in the growing pig. Animals 2017, 11, 1427–1439. [Google Scholar] [CrossRef] [PubMed] [Green Version]
  8. Schinckel, A.P.; Einstein, M.E. Concepts of pig growth and composition. In Purdue Swine Day; Purdue University: Purdue, IN, USA, 1995. [Google Scholar]
  9. Hollmichel, K.; Quanz, G. Bedarfsgerechte Proteinversorgung von Schweinen. LLH-Fachinformation Tierproduktion. Available online: http://www.proteinmarkt.de/aktuelle-meldungen/artikel/news/bedarfsgerechte-proteinversorgung/ (accessed on 17 January 2020).
  10. Kirchgeßner, M. Tierernährung. In Leitfaden für Studium, Beratung und Praxis; Aktualisierte Aufl., DLG-Verl: Frankfurt am Main, Germany, 2014; Volume 14, pp. 305–319. [Google Scholar]
  11. Bauer, A.; Judas, M. Schlachtkörperqualität von Mastebern in Vergleich zu Sauen und Börgen. Züchtungskunde 2014, 86, 374–389. [Google Scholar]
  12. Sommer, W. Neue Fütterungsempfehlungen für die Schweinemast. Landwirtschaftskammer Nordrhein-Westfalen. Available online: https://www.landwirtschaftskammer.de/landwirtschaft/tierproduktion/schweinehaltung/fuetterung/empfehlungen-schweinemast.htm (accessed on 17 January 2020).
  13. Jeroch, H.; Drochner, W.; Ortwin, S. Ernährung Landwirtschaftlicher Nutztiere; Ernährungsphysiologie, Futtermittelkunde, Fütterung; UTB: Stuttgart, Germany, 1999. [Google Scholar]
  14. Aarnink, A.J.A. Ammonia Emissions from Houses for Growing Pigs as Affected by Pen Design, Indoor Climate and Behaviour. Ph.D. Thesis, University of Wageningen, Wageningen, The Netherlands, 1997. [Google Scholar]
  15. Lenis, N.P.; Jongbloed, A.W. New Technologies in Low Pollution Swine Diets: Diet Manipulation and Use of Synthetic Amino Acids, Phytase and Phase Feeding for Reduction of Nitrogen and Phosphorus Excretion and Ammonia Emission-Review. Asian-Australasian J. Anim. Sci. 1999, 12, 305–327. [Google Scholar] [CrossRef]
  16. Lengling, A.; Reckels, B.; Schwennen, C.; Hoelscher, R.; Waldmann, K.-H.; Visscher, C.; Büscher, W. Validation of a New Resource-Efficient Feeding System for Fattening Pigs Using Increased Crude Fiber Concentrations in Diets: Feed Intake and Ammonia Emissions. Animals 2020, 10, 497. [Google Scholar] [CrossRef] [Green Version]
  17. Susenbeth, A. Factors affecting lysine utilization in growing pigs: An analysis of literature data. Livest. Prod. Sci. 1995, 43, 193–204. [Google Scholar] [CrossRef]
  18. Schön, A.U.A. Untersuchung zum Muskel- und Fettgewebeansatz Wachsender Schweine. Landwirtschaftskammer Niedersachsen. Available online: http://www.lwk-niedersachsen.de/index.cfm/portal/1/nav/1093/article/17105.html (accessed on 11 February 2020).
  19. Brade, W.; Flachowsky, G. Schweinezucht und Schweinefleischerzeugung-Empfehlung für die Praxis; Ernährung und Fütterung der Schweine, Sonderheft 2296; Landbauforschung Völkenrode—FAL Agricultural Research; Bundesforschungsanstalt für Landwirtschaft (FAL): Braunschweig, Germany, 2006; pp. 123–155. [Google Scholar]
  20. Kamphues, J.; Wolf, P.; Coenen, M.; Eder, K.; Iben, C.; Kienzle, E.; Liesegang, A.; Männer, K.; Zebeli, Q.; Zentek, J. Supplemente zur Tierernährung Für Studium und Praxis, 12th überarbeitete Aufl ed; M. & H. Schaper: Hannover, Germany, 2014; Volume 12, pp. 366–374. [Google Scholar]
  21. Hohmeier, S. Use and Nutritive Value of Whole- Plant Corn Silage as Part of a Ration as Well as Sole Ingredient in Fattening Pigs. Ph.D. Thesis, Tierärztliche Hochschule, Hannover, Germany, 2015. [Google Scholar]
  22. Meunier-Salaün, M.; Edwards, S.; Robert, S. Effect of dietary fibre on the behaviour and health of the restricted fed sow. Anim. Feed. Sci. Technol. 2001, 90, 53–69. [Google Scholar] [CrossRef]
  23. D’Eath, R.B.; Tolkamp, B.J.; Kyriazakis, I.; Lawrence, A. ‘Freedom from hunger’ and preventing obesity: The animal welfare implications of reducing food quantity or quality. Anim. Behav. 2009, 77, 275–288. [Google Scholar] [CrossRef]
  24. Petherick, J.; Blackshaw, J. A review of the factors influencing the aggressive and agonistic behaviour of the domestic pig. Aust. J. Exp. Agric. 1987, 27, 605–611. [Google Scholar] [CrossRef]
  25. Cielejewski, H.; Tholen, E.; Geerdes, K.; Leuschner, P. Untersuchungen über die Eignung des Videobildsystems opti-SORT (Firma Hoelscher + Leuschner) zur Bestimmung des Gewichts und der Beurteilung der AutoFOM-Schlachtkörperqualität von Schweinen in der Endmast. In Proceedings of the Tagung Bau, Technik und Umwelt in der Landwirtschaftlichen Nutztierhaltung 2005, Braunschweig, Germany, 1–3 März 2005; Kuratorium für Technik und Bauwesen in der Landwirtschaft e. V., Ed.; Landwirtschaftsverl: Münster-Hiltrup, Germany, 2005. [Google Scholar]
  26. Müller, S.; Polten, S. Vergleichsuntersuchungen zur Ultraschall-Speckdickenmessung beim Schwein im Rahmen der Eigenleistungsprüfung. Arch. Anim. Breed. 2004, 47, 249–263. [Google Scholar] [CrossRef]
  27. Höreth, R. Praxis-Informationen. Mitt. Fleischforsch. Kulmb. 2013, 52, 175–178. Available online: https://www.openagrar.de/receive/openagrar_mods_00000548 (accessed on 12 May 2020).
  28. Brøndum, J.; Egebo, M.; Agerskov, C.; Busk, H. On-line pork carcass grading with the Autofom ultrasound system. J. Anim. Sci. 1998, 76, 1859–1868. [Google Scholar] [CrossRef] [PubMed]
  29. Branscheid, W.; Judas, M.; Höreth, R. Zur Klassifizierung von Schweinehälften: Neue Schätzformel und neue Geräte. Mitt. Fleischforsch. Kulmb. 2011, 50, 9–28. [Google Scholar]
  30. Canh, T.; Aarnink, A.; Schutte, J.; Sutton, A.; Langhout, D.; Verstegen, M. Dietary protein affects nitrogen excretion and ammonia emission from slurry of growing–finishing pigs. Livest. Prod. Sci. 1998, 56, 181–191. [Google Scholar] [CrossRef]
  31. Giles, L.R.; Eamens, G.J.; Arthur, P.F.; Barchia, I.M.; James, K.J.; Taylor, R.D. Differential growth and development of pigs as assessed by X-ray computed tomography1. J. Anim. Sci. 2009, 87, 1648–1658. [Google Scholar] [CrossRef] [PubMed] [Green Version]
  32. Overholt, M.F.; Arkfeld, E.K.; Mohrhauser, D.A.; King, D.A.; Wheeler, T.L.; Dilger, A.C.; Shackelford, S.; Boler, D. Comparison of variability in pork carcass composition and quality between barrows and gilts1. J. Anim. Sci. 2016, 94, 4415–4426. [Google Scholar] [CrossRef]
  33. Moeller, S.J.; Christian, L.L.; Goodwin, R.N. Development of adjustment factors for backfat and loin muscle area from serial real-time ultrasonic measurements on purebred lines of swine. J. Anim. Sci. 1998, 76, 2008–2016. [Google Scholar] [CrossRef]
Figure 1. Outline of a comparable barn with the different feeding areas (A; B) (©Hoelscher + Leuschner GmbH & Co. KG, Emsbueren, Germany).
Agriculture 10 00222 g001
Figure 2. Ultrasound image taken in these examinations in order to illustrate the layers and the prominent bone point mentioned (photo: ©Reckels, University of Veterinary Medicine Hanover, Hanover, Germany).
Agriculture 10 00222 g002
Figure 3. Schematic diagram for the explanation of the group classification (©Reckels, University of Veterinary Medicine Hanover, Hanover, Germany).
Agriculture 10 00222 g003
Figure 4. Schematic overview of the examination time and retrospective classification (©Reckels, University of Veterinary Medicine Hanover, Hanover, Germany).
Agriculture 10 00222 g004
Table 1. Calculated energy and nutrient contents per kg dry matter (DM) in the diets of animals weighing between 50 kg and 70 kg.
Diet 50 kgDiet 60 kgDiet 70 kgDiet 50 kgDiet 60 kgDiet 70 kg
LightLightLightHeavyHeavyHeavy
MEMJ kg DM15.1115.1015.1115.1115.1015.00
Ashg/kg DM44.8043.0043.0044.8043.1043.20
Crude Proteing/kg DM172.00167.00167.00172.00167.00167.00
Crude Fatg/kg DM42.4042.3042.3042.4041.3040.40
Starchg/kg DM471.00486.00486.00471.00489.00492.00
Crude Fiberg/kg DM46.7045.1045.1046.7046.4047.70
Lysing/kg DM12.1011.5011.5012.1011.1010.80
Table 2. The body mass development of fattening pigs, which was collected during the two-week ultrasound examinations, and the ratio of the backfat thickness to the diameter of the musculus longissimus dorsi.
ItemGroupExamination 1Examination 2Examination 3Examination 4Examination 5
BodyL42.90 B ± 3.5456.68 B ± 4.6869.37 B ± 5.5081.80 B ± 6.9791.82 B ± 6.28
weight (in kg)H52.90 A ± 4.2065.71 A ± 6.8378.49 A ± 7.4689.53 A ± 9.5899.50 A ± 10.21
Backfat/muscle L0.11 A ± 0.020.15 A ± 0.020.17 A ± 0.030.18 A ± 0.030.19 A ± 0.03
ratioH0.11 A ± 0.020.14 A ± 0.020.16 A ± 0.020.18 A ± 0.030.18 A ± 0.03
Body
weight
(in kg)
LF 43.50 B ± 3.0857.22 B ± 5.2470.08 B ± 6.0182.81 B ± 7.5192.78 B ± 6.69
LL 42.30 B ± 3.8856.16 B ± 4.1068.69 B ± 4.9680.77 B ± 7.5290.90 B ± 5.81
HF 52.26 A ± 3.9565.59 A ± 5.5278.07 A ± 6.0188.05 A ± 9.3098.71 A ± 9.93
HL 53.54 A ± 4.4165.83 A ± 8.0478.93 A ± 8.8291.07 A ± 9.81100.27 A ± 10.61
Backfat/muscle ratioLF0.13 A ± 0.010.16 A ± 0.020.18 A ± 0.030.18 A ± 0.030.20 A ± 0.04
LL0.11 B ± 0.010.13 B ± 0.020.16 BC ± 0.030.17 A ± 0.030.17 B ± 0.03
HF0.13 A ± 0.020.15 A ± 0.020.17 AB ± 0.030.18 A ± 0.030.19 A ± 0.02
HL0.10 B ± 0.010.14 B ± 0.020.15 C ± 0.020.17 A ± 0.030.17 B ± 0.03
A, B, C Averages differ significantly within a column (p < 0.05).
Table 3. Retrospective classification of the animals after the first examination. Evaluation of muscle and fat thickness in the different groups.
ItemGroupExamination 1Examination 2Examination 3Examination 4Examination 5
Diameter of M. longissimus dorsi (cm)All3.63 ± 0.374.31± 0.424.66 ± 0.465.14 ± 0.415.51 ± 0.47
Heavy3.81 A ± 0.354.48 A ± 0.424.88 A ± 0.345.28 A ± 0.405.62 A ± 0.47
Light3.46 B ± 0.314.14 B ± 0.344.44 B ± 4.474.99 B ± 0.365.40 B ± 0.45
Diameter of M. longissimus dorsi (cm)LF3.29 C ± 0.284.01 C ± 0.364.33 B ± 0.444.87 C ± 0.285.29 B ± 0.38
LL3.62 B ± 0.244.25 B ± 0.264.55 B ± 0.475.12 B ± 0.405.50 AB ± 0.48
HF3.69 B ± 0.314.45 AB ± 0.384.81 A ± 0.395.16 B ± 0.365.50 AB ± 0.47
HL3.93 A ± 0.354.52 A ± 0.464.96 A ± 0.285.40 A ± 0.425.75 A ± 0.45
Backfat (cm)All0.42 ± 0.070.62 ± 0.100.76 ± 0.130.89 ± 0.151.02 ± 0.18
Heavy0.43 A ± 0.080.64 A ± 0.100.78 A ± 0.110.92 A ± 0.161.03 A ± 0.16
Light0.41 A ± 0.060.59 B ± 0.090.74 A ± 0.130.87 A ± 0.131.00 A ± 0.18
Backfat (cm)LF0.44 A ± 0.060.62 AB ± 0.110.78 A ± 0.150.89 AB ± 0.141.04 A ± 0.21
LL0.38 B ± 0.090.57 B ± 0.070.70 B ± 0.110.84 B ± 0.120.96 A ± 0.14
HF0.47 A ± 0.090.67 A ± 0.090.81 A ± 0.120.96 A ± 0.171.07 A ± 0.15
HL0.39 B ± 0.040.61 AB ± 0.100.74 AB ± 0.100.87 AB ± 0.140.99 A ± 0.16
A, B, C Averages differ significantly within a column (p < 0.05).
Table 4. Retrospective classification of the animals after the second examination. Evaluation of muscle and fat thickness in the different groups.
ItemGroupExamination 1Examination 2Examination 3Examination 4Examination 5
Diameter of M. longissimus dorsi (cm)All3.63 ± 0.374.31 ± 0.424.66 ± 0.465.14 ± 0.415.51 ± 0.47
Heavy3.78 A ± 0.384.48 A ± 0.434.89 A ± 0.375.31 A ± 0.405.68 A ± 0.43
Light3.47 B ± 0.284.13 B ± 0.324.13 B ± 0.444.98 B ± 0.345.35 B ± 0.47
Diameter of M. longissimus dorsi (cm)LF3.45 B ± 0.293.99 C ± 0.344.32 C ± 0.424.91 C ± 0.315.30 B ± 0.43
LL3.50 B ± 0.294.28 B ± 0.214.56 BC ± 0.445.07 BC ± 0.375.41 AB ± 0.51
HF3.73 A ± 0.374.34 B ± 0.454.80 AB ± 0.435.25 AB ± 0.455.69 A ± 0.45
HL3.83 A ± 0.394.62 A ± 0.354.97 A ± 0.285.37 A ± 0.345.67 A ± 0.42
Backfat (cm)All0.42 ± 0.0690.62 ± 0.100.76 ± 0.130.89 ± 0.151.02 ± 0.18
Heavy0.44 A ± 0.060.66 A ± 0.100.80 A ± 0.120.93 A ± 0.161.05 A ± 0.16
Light0.40 B ± 0.040.57 B ± 0.070.72 B ± 0.120.84 B ± 0.120.97 B ± 0.17
Backfat (cm)LF0.42 B ± 0.040.61 B ± 0.070.77 B ± 0.120.89 B ± 0.131.05 B ± 0.17
LL0.37 C ± 0.030.52 C ± 0.050.65 C ± 0.080.80 B ± 0.090.88 D ± 0.10
HF0.45 A ± 0.070.71 A ± 0.100.85 A ± 0.120.99 A ± 0.131.14 A ± 0.13
HL0.42 B ± 0.050.61 B ± 0.070.74 B ± 0.100.87 B ± 0.160.96 C ± 0.14
A, B, C, D Averages differ significantly within a column (p < 0.05).
Table 5. Retrospective classification of the animals after the third examination. Evaluation of muscle and fat thickness in the different groups.
ItemGroupExamination 1Examination 2Examination 3Examination 4Examination 5
Diameter of M. longissimus dorsi (cm) All3.63 ± 0.374.31 ± 0.424.66 ± 0.465.14 ± 0.415.51 ± 0.47
Heavy3.78 A ± 0.404.49 A ± 0.404.85 A ± 0.425.29 A ± 0.415.70 A ± 0.41
Light3.46 B ± 0.304.15 B ± 0.344.45 B ± 0.424.97 B ± 0.365.28 B ± 0.45
Diameter of M. longissimus dorsi (cm)LF3.35 C ± 0.314.03 B ± 0.364.27 C ± 0.474.83 C ± 0.335.20 C ± 0.43
LL3.58 BC ± 0.254.27 AB ± 0.274.65 B ± 0.275.13 B ± 0.325.36 BC ± 0.47
HF3.71 AB ± 0.374.43 A ± 0.384.69 B ± 0.425.15 B ± 0.355.58 AB ± 0.40
HL3.85 A ± 0.424.56 A ± 0.425.01 A ±0.355.43 A ± 0.425.82 A ± 0.39
Backfat (cm)All0.42 ± 0.070.62 ± 0.100.76 ± 0.130.89 ± 0.151.02 ± 0.18
Heavy0.45 A ± 0.080.68 A ± 0.090.81 A ± 0.12 0.94 A ± 0.16 1.07 A ± 0.16
Light0.39 B ± 0.040.56 B ± 0.060.70 B ± 0.11 0.83 B ± 0.11 0.96 B ± 0.16
Backfat (cm)LF0.41 B ± 0.030.58 BC ± 0.070.76 B ± 0.110.87 B ± 0.121.01 B ± 0.18
LL0.37 B ± 0.030.53 C ± 0.050.64 C ± 0.050.78 C ± 0.080.90 C ± 0.10
HF0.48 A ± 0.090.72 A ± 0.080.89 A ± 0.081.05 A ± 0.111.12 A ± 0.12
HL0.42 B ± 0.050.63 B ± 0.080.72 B ± 0.090.84 BC ± 0.140.97 BC ± 0.13
A, B, C Averages differ significantly within a column (p < 0.05).
Table 6. Correlation between body mass and muscle diameter.
ItemGroup Examination 1 *Examination 2Examination 3Examination 4Examination 5 *
Body mass (kg)
correlated to
muscle diameter (cm)
Allr0.61840.543730.53770.535260.51723
(n = 121)p<0.0001<0.0001<0.0001<0.0001<0.0001
LFr0.210920.477960.18570.328930.46296
(n = 30)p0.26320.01170.36380.08740.0131
LLr0.574380.485690.363080.318990.42297
(n = 31)p0.00070.00880.06270.10480.0199
HF r0.569160.404540.355250.482810.3191
(n = 30)p0.0010.03640.06360.00930.0979
HL r0.645110.400450.736770.650970.74759
(n = 30)p0.00010.0347<0.00010.0002<0.0001
* In order to visualize the data, scatterplots from these examinations are provided in the Supplementary Materials (Tables S3 and S4 and Figures S1 and S2).
Table 7. Correlation between the ration of the amount of fat to the amount of meat and the ratio between backfat and the M. longissmus dorsi diameter.
ItemGroup Examination 1Examination 2Examination 3Examination 4Examination 5
Amount of fat/amount of meat
correlated to
backfat/muscle ratio
Allr0.389880.486200.570470.642510.66378
(n = 121)p<0.0001<0.0001<0.0001<0.0001<0.0001
LF r0.369140.514640.424130.725870.69135
(n = 30)p0.04470.00510.0275<0.0001<0.0001
LL r0.157250.452540.502550.290360.60602
(n = 31)p0.39820.01560.00640.13390.0004
HF r0.229870.270880.633120.777360.61204
(n = 30)p0.22170.17170.0003<0.00010.0005
HL r0.183970.247690.523560.713700.70164
(n = 30)P0.33050.20380.0051<0.0001<0.0001
(“Amount of fat” and “amount of meat” were calculated using mathematical formulae during the Auto-FOM classification).
Table 8. Correlation between the index points per kg to the ratio of backfat and the diameter of M. longissmus dorsi.
ItemGroup Examination 1Examination 2Examination 3Examination 4Examination 5
allr−0.28164−0.44417−0.51052−0.59201−0.60657
Index points per kg to backfat/muscle ratio(n = 121)p0.0018<0.0001<0.0001<0.0001<0.0001
SF r−0.35456−0.47912−0.43638−0.70450−0.65226
(n = 30)p0.05450.00990.0229<0.00010.0001
SLr−0.12204−0.53207−0.50105−0.17746−0.53933
(n = 31)p0.51310.00360.00660.36630.0021
HF r−0.12797−0.23416−0.59018−0.64012−0.57583
(n = 30)p0.50040.23980.00090.00020.0013
HL r−0.07190−0.26046−0.42133−0.71739−0.63235
(n = 30)p0.70580.18070.0286<0.00010.0002

