Analysis of Dairy Product Price Transmission in Hungary: A Nonlinear ARDL Model


Abstract
1. Introduction
2. The Dairy Sector in Hungary
3. Materials and Methods
NARDL Model
4. Results
5. Discussion
6. Conclusions
Author Contributions
Funding
Conflicts of Interest
References
- Vőneki, É.; Mándi-Nagy, D.; Stark, A. Prospects for the European Union and Hungarian dairy sectors after the abolition of the milk quota system. Stud. Agric. Econ. 2015, 117, 1–9. [Google Scholar] [CrossRef]
- Acosta, A.; Ihle, R.; Von Cramon-Taubadel, S. Combining market structure and econometric methods for pricetransmission analysis. Food Secur. 2019, 11, 941–951. [Google Scholar] [CrossRef]
- Bronnmann, J.; Bittmann, T. Asymmetric adjustment of retail cod and herring prices in Germany: A NARDL approach. Mar. Policy 2019, 106, 103513. [Google Scholar] [CrossRef]
- Grau, A.; Hockmann, H. Market power in the German dairy value chain. Agribusiness 2017, 34, 93–111. [Google Scholar] [CrossRef]
- Fousekis, P.; Katrakilidis, C.; Trachanas, E. Vertical price transmission in the US beef sector: Evidence from the nonlinear ARDL model. Econ. Model. 2016, 52, 499–506. [Google Scholar] [CrossRef]
- Acosta, A.; Valdés, A. Vertical price transmission of milk prices: Are small dairy producers efficiently integrated into markets? Agribusiness 2014, 30, 56–63. [Google Scholar] [CrossRef]
- Serra, T.; Goodwin, B.K. Price transmission and asymmetric adjustment in the Spanish dairy sector. Appl. Econ. 2003, 35, 1889–1899. [Google Scholar] [CrossRef]
- Dong, X.; Brown, C.; Waldron, S.; Zhang, J. Asymmetric price transmission in the Chinese pork and pig market. Br. Food J. 2018, 120, 120–132. [Google Scholar] [CrossRef]
- Bakucs, Z.; Brümmer, B.; Von Cramon-Taubadel, S.; Fertő, I. Wheat market integration between Hungary and Germany. Appl. Econ. Lett. 2011, 19, 785–788. [Google Scholar] [CrossRef]
- Jeremić, M.; Zekić, S.; Matkovski, B.; Kleut, Ž. Spatial price transmission in pork market in Serbia. Custos E Agronegocio 2019, 15, 328–346. [Google Scholar]
- Bakucs, Z.; Benedek, Z.; Fertő, I. Spatial price transmission and trade in the European dairy sector. Agris On-line Pap. Econ. Inform. 2019, 11, 13–20. [Google Scholar] [CrossRef]
- Meyer, J.; von Cramon-Taubadel, S. Asymmetric price transmission: A survey. J. Agric. Econ. 2004, 55, 581–611. [Google Scholar] [CrossRef]
- Frey, G.; Manera, M. Econometric models of asymmetric price transmission. J. Econ. Surv. 2007, 21, 349–415. [Google Scholar] [CrossRef]
- Kharin, S. Vertical price transmission along the diary supply chain in Russia. Stud. Agric. Econ. 2015, 117, 80–85. [Google Scholar] [CrossRef]
- Ahn, D.H.; Boudoukh, J.; Richardson, M.; Whitelaw, R.F. Partial adjustment or stale prices? Implications from stock index and futures return autocorrelations. Rev. Financ. Stud. 2002, 15, 655–689. [Google Scholar] [CrossRef]
- Fernández-Amador, O.; Baumgartner, J.; Crespo-Cuaresma, J. Milking the prices: The role of asymmetries in the price transmission mechanism for milk products in Austria. In WIFO Working Papers 378; WIFO: Wien, Austria, 2010. [Google Scholar]
- Rezitis, A.N.; Tsionas, M.G. Modeling asymmetric price transmission in the European food market. Econ. Model. 2019, 76, 216–230. [Google Scholar] [CrossRef]
- Davies, A. Testing for international equity market integration using regime switching cointegration techniques. Rev. Financ. Econ. 2006, 15, 305–321. [Google Scholar] [CrossRef]
- Bor, Ö.; Ismihan, M.; Bayaner, A. Asymmetry in farm-retail price transmission in the Turkish fluid milk market. New Medit 2014, 13, 2–8. [Google Scholar]
- Awokuse, T.O.; Wang, X. Threshold effects and asymmetric price adjustments in US dairy markets. Can. J. Agric. Econ. Rev. Can. 2009, 57, 269–286. [Google Scholar] [CrossRef]
- Weldesenbet, T. Asymmetric price transmission in the Slovak liquid milk market. Agric. Econ. 2013, 59, 512–524. [Google Scholar] [CrossRef]
- Meyer, D.F.; Sanusi, K.A.; Hassan, A. Analysis of the asymmetric impacts of oil prices on food prices in oil-exporting developing countries. J. Int. Stud. 2018, 11, 82–94. [Google Scholar] [CrossRef] [PubMed]
- Hockmann, H.; Vöneki, É. Collusion in the Hungarian market for raw milk. Outlook Agric. 2009, 38, 39–45. [Google Scholar] [CrossRef]
- Buleca, J.; Kováč, V.; Šubová, N. Milk production related to price of raw cow’s milk in selected european countries. Potravin. Slovak J. Food Sci. 2018, 12, 798–805. [Google Scholar] [CrossRef]
- Vargova, L.; Rajcaniova, M. spatial price transmission of milk prices among tHevisegrad countries. Visegr. J. Bioecon. Sustain. Dev. 2017, 6, 79–83. [Google Scholar] [CrossRef]
- Szucs, I.; Szollosi, L. Problems of the Hungarian dairy sector in connection with the abolition of the milk quota system. Rocz. Nauk. StowarzyszeniaEkon. Rol. I Agrobiz. 2015, 17, 379–385. [Google Scholar]
- Kovacs, K.; Pandey, R. Hungarian Dairy And Beef Production Sector Technical Efficiency Comparsion Using Dea. Apstract Appl. Stud. Agribus. Commer. 2017, 11, 131–140. [Google Scholar] [CrossRef]
- Research Institute of Agricultural Economics. Market Price and Information SystemURL. 2019. Available online: https://pair.aki.gov.hu/web_public/general/home.do (accessed on 1 October 2019).
- Bruszt, L.; Karas, D. Diverging developmental strategies beyond “lead sectors” in the EU’s periphery: The politics of developmental alliances in the Hungarian and Polish dairy sectors. Rev. Int. Political Econ. 2019, 1–21, (this special issue, published online 7 August 2019). [Google Scholar] [CrossRef]
- Pesaran, M.H.; Shin, Y. An autoregressive distributed-lag modelling approach to cointegration analysis. Econom. Soc. Monogr. 1998, 31, 371–413. [Google Scholar]
- Pesaran, M.H.; Shin, Y.; Smith, R.J. Bounds testing approaches to the analysis of level relationships. J. Appl. Econom. 2001, 16, 289–326. [Google Scholar] [CrossRef]
- Shin, Y.; Yu, B.; Greenwood-Nimmo, M. Modelling asymmetric cointegration and dynamic multipliers in a nonlinear ARDL framework. In InFestschrift in Honor of Peter Schmidt 2014; Springer: New York, NY, USA, 2014; pp. 281–314. [Google Scholar]
- Phillips, P.C.; Perron, P. Testing for a unit root in time series regression. Biometrika 1988, 75, 335–346. [Google Scholar] [CrossRef]
- Zivot, E.; Andrews, D.W. Further evidence on the great crash, the oil-price shock, and the unit-root hypothesis. J. Bus. Econ. 2002, 20, 25–44. [Google Scholar] [CrossRef]
- Rezitis, A.N. Investigating price transmission in the Finnish dairy sector: An asymmetric NARDL approach. Empir. Econ. 2019, 57, 861–900. [Google Scholar] [CrossRef]


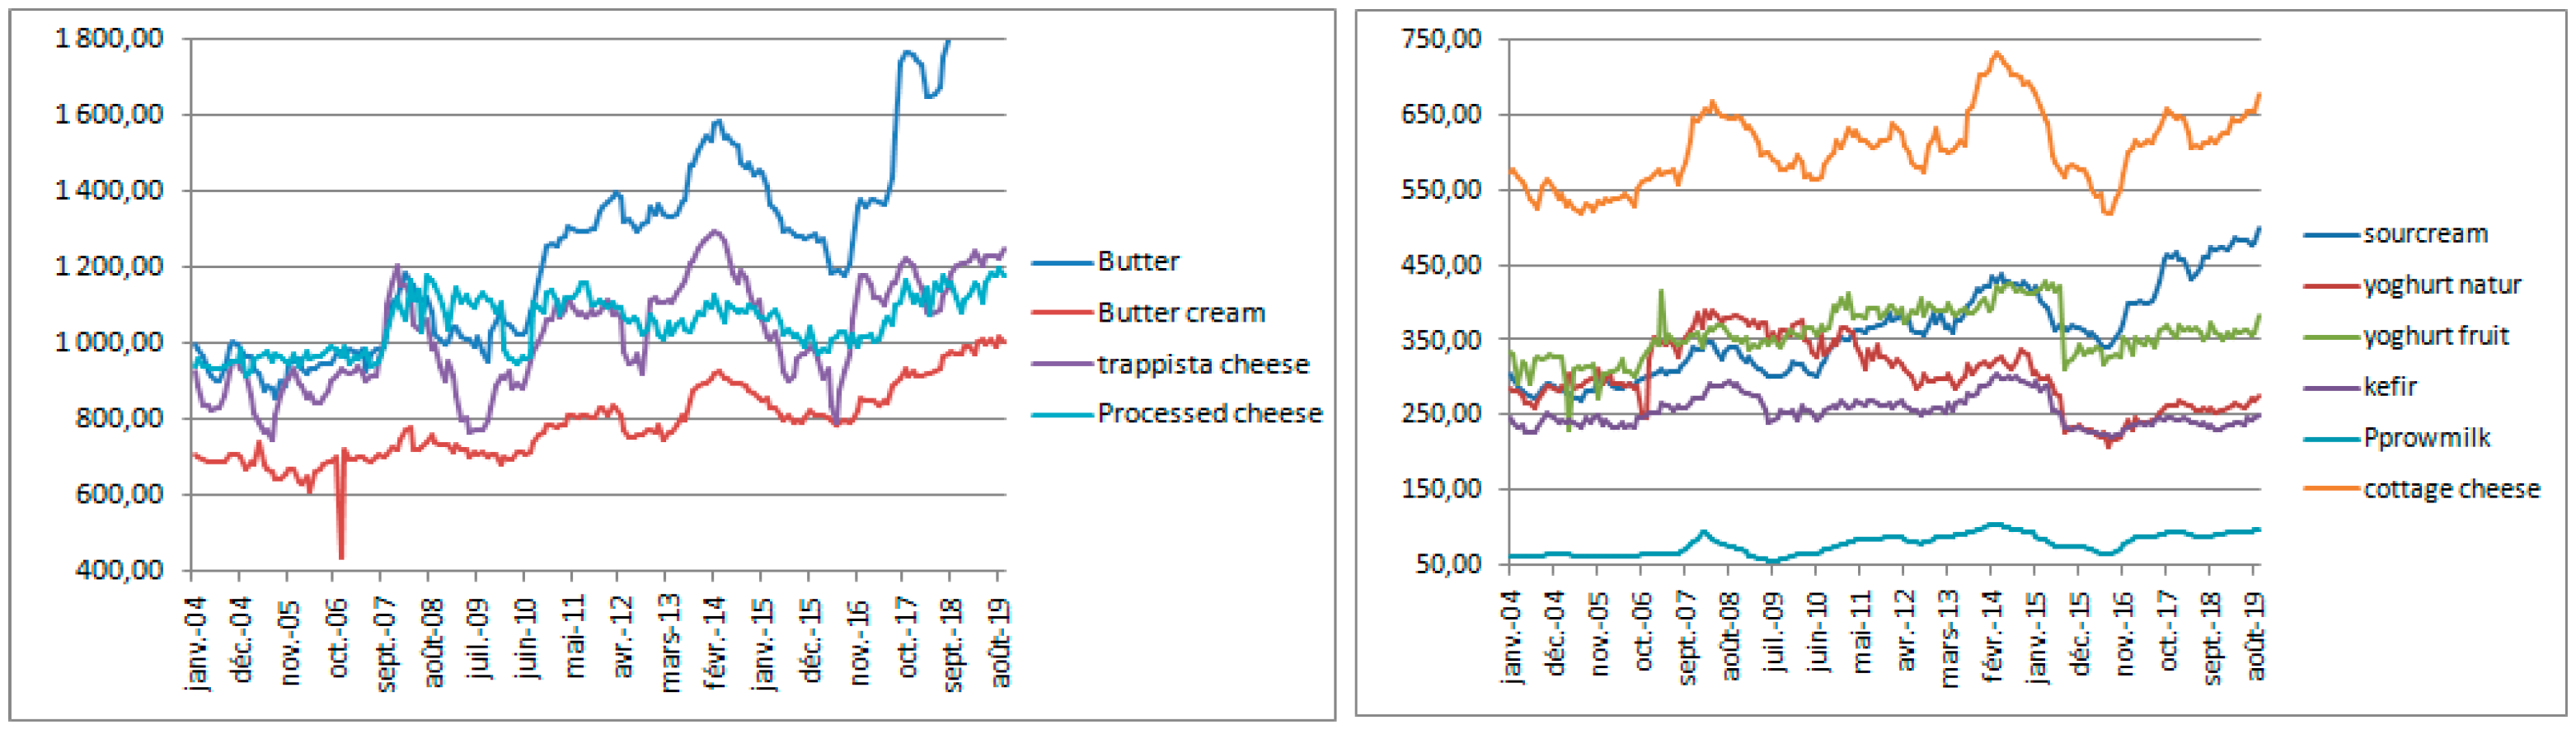
| Min | Max | Mean | Standard Deviation | |
|---|---|---|---|---|
| Butter (BU) | 856.20 | 1885.40 | 1260.40 | 278.94 |
| Butter cream (BCREAM) | 432.80 | 1018.80 | 787.10 | 100.07 |
| Cottage cheese (CCHEESE) | 517.80 | 733.90 | 604.30 | 49.50 |
| Sour cream (SCREAM) | 268.10 | 499.90 | 360.70 | 59.66 |
| Natural yogurt (YOGNAT) | 209.20 | 390.60 | 303.20 | 45.86 |
| Fruit yogurt (YOGFRUIT) | 229.80 | 427.70 | 359.40 | 34.22 |
| Kefir (KEFIR) | 221.00 | 305.80 | 255.40 | 20.41 |
| Trappistacheese (TCHEESE) | 746.50 | 1294.80 | 1020.80 | 141.65 |
| Processed cheese (PCHEESE) | 916.00 | 1195.90 | 1051.40 | 72.61 |
| Raw milk (PPRM) | 54.99 | 105.33 | 77.81 | 13.39 |
| PP Statistics | ZA Statistics | Break Point | PP Statistics | ZA Statistics | PP Statistics | |
|---|---|---|---|---|---|---|
| Intercept | Intercept and Trend | |||||
| LPPRM | −1.36 | −4.21 | 12/2014 | −2.00 | −3.37 | 10/2012 |
| LBU | −0.26 | −3.67 | 10/2014 | −2.51 | −3.35 | 08/2016 |
| LBCREAM | −1.84 | −3.44 | 06/2017 | −6.53 *** | −3.39 | 09/2016 |
| LCCHEESE | −1.88 | −4.21 | 01/2015 | −2.35 | −3.33 | 10/2007 |
| LSCREAM | −0.28 | −3.83 | 01/2015 | −2.72 | −3.47 | 02/2017 |
| LYOGNAT | −1.71 | −5.01 ** | 11/2006 | −2.25 | −3.28 | 10/2007 |
| LYOGFRUIT | −3.30 ** | −7.73 *** | 07/2015 | −3.82 ** | −3.82 | 12/2011 |
| LKEFIR | −2.04 | −4.81 ** | 04/2015 | −2.07 | −2.58 | 11/2007 |
| LTCHEESE | −1.98 | −4.43 | 08/2014 | −2.97 | −3.82 | 03/2018 |
| LPCHEESE | −2.82 * | −3.76 | 08/2007 | −3.60 | −3.30 | 12/2007 |
| Intercept | Intercept and Trend | |||||
| ΔLPPRM | −5.16 *** | −5.00 ** | 12/2007 | −5.15 *** | −4.63 ** | 03/2015 |
| ΔLBU | −10.09 *** | −7.05 *** | 07/2016 | −10.11 *** | −6.76 *** | 05/2015 |
| ΔLBCREAM | −26.45 *** | −9.69 *** | 02/2014 | −26.48 | −9.48 *** | 01/2007 |
| ΔLCCHEESE | −11.08 *** | −6.34 *** | 06/2016 | −11.07 *** | −6.06 *** | 07/2015 |
| ΔLSCREAM | −12.28 *** | −7.36 *** | 07/2016 | −12.31 *** | −7.04 *** | 05/2015 |
| ΔlYOGNAT | −15.25 *** | −11.05 *** | 06/2016 | −15.23 *** | −10.83 *** | 07/2015 |
| ΔlYOGFRUIT | −19.61 *** | −10.51 *** | 03/2005 | −19.55 *** | −10.24 *** | 06/2004 |
| ΔlKEFIR | −15.77 *** | −6.83 *** | 02/2014 | −15.75 *** | −6.73 *** | 06/2004 |
| ΔlTCHEESE | −9.87 *** | −6.41 *** | 06/2016 | −9.85 *** | −6.19 *** | 08/2004 |
| ΔLPCHEESE | −18.40 *** | −9.79 *** | 07/2008 | −18.35 *** | −9.64 *** | 05/2015 |
| Cointegration Hypothesis | F Statistic |
|---|---|
| F (LBU/PPRM+, PPRM−) | 6.74 *** |
| F (LBCREAM/PPRM+, PPRM−) | 12.40 *** |
| F (LCCHEESE/PPRM+, PPRM−) | 5.87 *** |
| F (LSCREAM/PPRM+, PPRM−) | 7.78 *** |
| F (LYOGNAT/PPRM+, PPRM−) | 2.56 ** |
| F (LYOGFRUIT/PPRM+, PPRM−) | 7.16 *** |
| F (LKEFIR/PPRM+, PPRM−) | 6.65 *** |
| F (LTCHEESE/PPRM+, PPRM−) | 17.02 *** |
| F (LPCHEESE/PPRM+, PPRM−) | 5.34 *** |
| Butter | Butter Cream | Kefir | Sour Cream | ||||
|---|---|---|---|---|---|---|---|
| Variable | Coefficient | Variable | Coefficient | Variable | Coefficient | Variable | Coefficient |
| C | 0.45 *** | C | 1.03 *** | C | 0.27 *** | C | 0.34 *** |
| LBUt−1 | −0.15 *** | LBCREAMt−1 | −0.36 *** | LKEFIRt−1 | −0.11 *** | LSCREAMt−1 | −0.14 *** |
| LPPRMt−1+ | 0.11 *** | LPPRMt−1+ | 0.14 *** | LPPRMt−1+ | 0.06 *** | LPPRMt−1+ | 0.09 *** |
| LPPRMt−1− | 0.07 *** | LPPRMt−1− | 0.08 ** | LPPRMt−1− | 0.08 *** | LPPRMt−1− | 0.06 *** |
| ΔLBUt−1 | 0.13 * | ΔLBCREAMt−1 | −0.39 *** | ΔLKEFIRt−1 | −0.21 *** | ΔLSCREAMt−1 | −0.07 |
| ΔLBUt−2 | 0.13 * | ΔLBCREAMt−2 | −0.16 ** | ΔLKEFIRt−2 | 0.00 | ΔLSCREAMt−2 | 0.15 ** |
| ΔLPPRMt−1+ | 0.69 *** | ΔLPPRMt−1+ | −0.19 | ΔLPPRMt−1+ | 0.30 ** | ΔLPPRMt−1+ | 0.62 *** |
| ΔLPPRMt−2+ | −0.36 ** | ΔLPPRMt−1− | 0.61 * | ΔLPPRMt−1− | 0.44 *** | ΔLPPRMt−1− | 0.53 *** |
| LM | 3.65 (0.37) | LM | 0.50 (0.60) | LM | 3.51 (0.53) | LM | 7.01 (0.27) |
| ARCH (4) | 5.48 (0.24) | ARCH (2) | 2.09 (0.35) | ARCH (2) | 0.92 (0.62) | ARCH (4) | 7.25 (0.12) |
| Long run coefficients | |||||||
| LPPRMt−1+ | 0.74 *** | LPPRMt−1+ | 0.39 *** | LPPRMt−1+ | 0.57 *** | LPPRMt−1+ | 0.65 *** |
| LPPRMt−1− | 0.48 *** | LPPRMt−1− | 0.24 *** | LPPRMt−1− | 0.76 *** | LPPRMt−1− | 0.48 *** |
| F stat | 15.68 *** | F stat | 13.97 *** | F stat | 16.06 *** | F stat | 8.96 *** |
| Cottage Cheese | TrappistaCheese | Processed Cheese | Natural Yogurt | Yogurt Fruit | |||||
|---|---|---|---|---|---|---|---|---|---|
| Variable | Coefficient | Variable | Coefficient | Variable | Coefficient | Variable | Coefficient | Variable | Coefficient |
| C | 0.25 *** | C | 0.98 *** | C | 0.47 *** | C | 0.15 ** | C | 0.56 *** |
| LCCHEESEt−1 | −0.09 *** | LTCHEESEt−1 | −0.33 *** | LPCHEESEt−1 | −0.16 *** | LYOGNATt−1 | −0.06 ** | LYOFRUITt−1 | −0.22 *** |
| LPPRMt−1+ | 0.05 *** | LPPRMt−1+ | 0.20 *** | LPPRMt−1+ | 0.04 ** | LPPRMt−1+ | 0.02 | LPPRMt−1+ | 0.09 *** |
| LPPRMt−1− | 0.06 *** | LPPRMt−1− | 0.19 *** | LPPRMt−1− | 0.03 * | LPPRMt−1− | 0.04 | LPPRMt−1− | 0.09 *** |
| ΔLCCHEESEt−1 | 0.00 | ΔLTCHEESEt−1 | 0.24 *** | ΔLPCHEESEt−1 | −0.21 *** | ΔLYOGNATt−1 | −0.11 | ΔLYOFRUITt−1 | −0.21 *** |
| ΔLCCHEESEt−2 | 0.12 | ΔLTCHEESEt−2 | - | ΔLPCHEESEt−2 | - | ΔLYOGNATt−2 | ΔLYOGNATt−2 | ||
| ΔLPPRMt−1+ | 0.70 *** | ΔLPPRMt−1+ | 0.74 *** | ΔLPPRMt−1+ | 0.21 | ΔLPPRMt−1+ | 0.35 * | ΔLPPRMt−1+ | 0.37 |
| ΔLPPRMt−2+ | −0.42 ** | ΔLPPRMt−1− | 0.93 *** | ΔLPPRMt−1− | −0.17 | ΔLPPRMt−1− | 0.14 | ΔLPPRMt−1− | −0.33 |
| LM | 10.48 (0.23) | LM | 0.50 (0.60) | LM | 1.47 (0.43) | LM | 2.88 (0.33) | LM | 2.66 (0.35) |
| ARCH (5) | 7.81 (0.16) | ARCH (1) | 9.51 (0.00) | ARCH (1) | 6.06 (0.01) | ARCH (1) | 4.25 (0.03) | ARCH (1) | 18.32 (0.00) |
| Long run coefficients | |||||||||
| LPPRMt−1+ | 0.58 *** | LPPRMt−1+ | 0.62 *** | LPPRMt−1+ | 0.25 *** | LPPRMt−1+ | 0.41 *** | LPPRMt−1+ | 0.41 *** |
| LPPRMt−1− | 0.65 *** | LPPRMt−1− | 0.58 *** | LPPRMt−1− | 0.25 *** | LPPRMt−1− | 0.77 *** | LPPRMt−1− | 0.43 *** |
| F stat | 3.39 * | F stat | 4.11 ** | F stat | 0.27 (0.59) | F stat | 4.77 ** | F stat | 0.14 (0.70) |
© 2020 by the authors. Licensee MDPI, Basel, Switzerland. This article is an open access article distributed under the terms and conditions of the Creative Commons Attribution (CC BY) license (http://creativecommons.org/licenses/by/4.0/).
Share and Cite
Ben Abdallah, M.; Fekete Farkas, M.; Lakner, Z. Analysis of Dairy Product Price Transmission in Hungary: A Nonlinear ARDL Model. Agriculture 2020, 10, 217. https://doi.org/10.3390/agriculture10060217
Ben Abdallah M, Fekete Farkas M, Lakner Z. Analysis of Dairy Product Price Transmission in Hungary: A Nonlinear ARDL Model. Agriculture. 2020; 10(6):217. https://doi.org/10.3390/agriculture10060217
Chicago/Turabian StyleBen Abdallah, Marwa, Maria Fekete Farkas, and Zoltan Lakner. 2020. "Analysis of Dairy Product Price Transmission in Hungary: A Nonlinear ARDL Model" Agriculture 10, no. 6: 217. https://doi.org/10.3390/agriculture10060217
APA StyleBen Abdallah, M., Fekete Farkas, M., & Lakner, Z. (2020). Analysis of Dairy Product Price Transmission in Hungary: A Nonlinear ARDL Model. Agriculture, 10(6), 217. https://doi.org/10.3390/agriculture10060217