Automatic Determination of the Parameters of Electrical Signals and Functional Responses of Plants Using the Wavelet Transformation Method

 ,
,  , and
, and 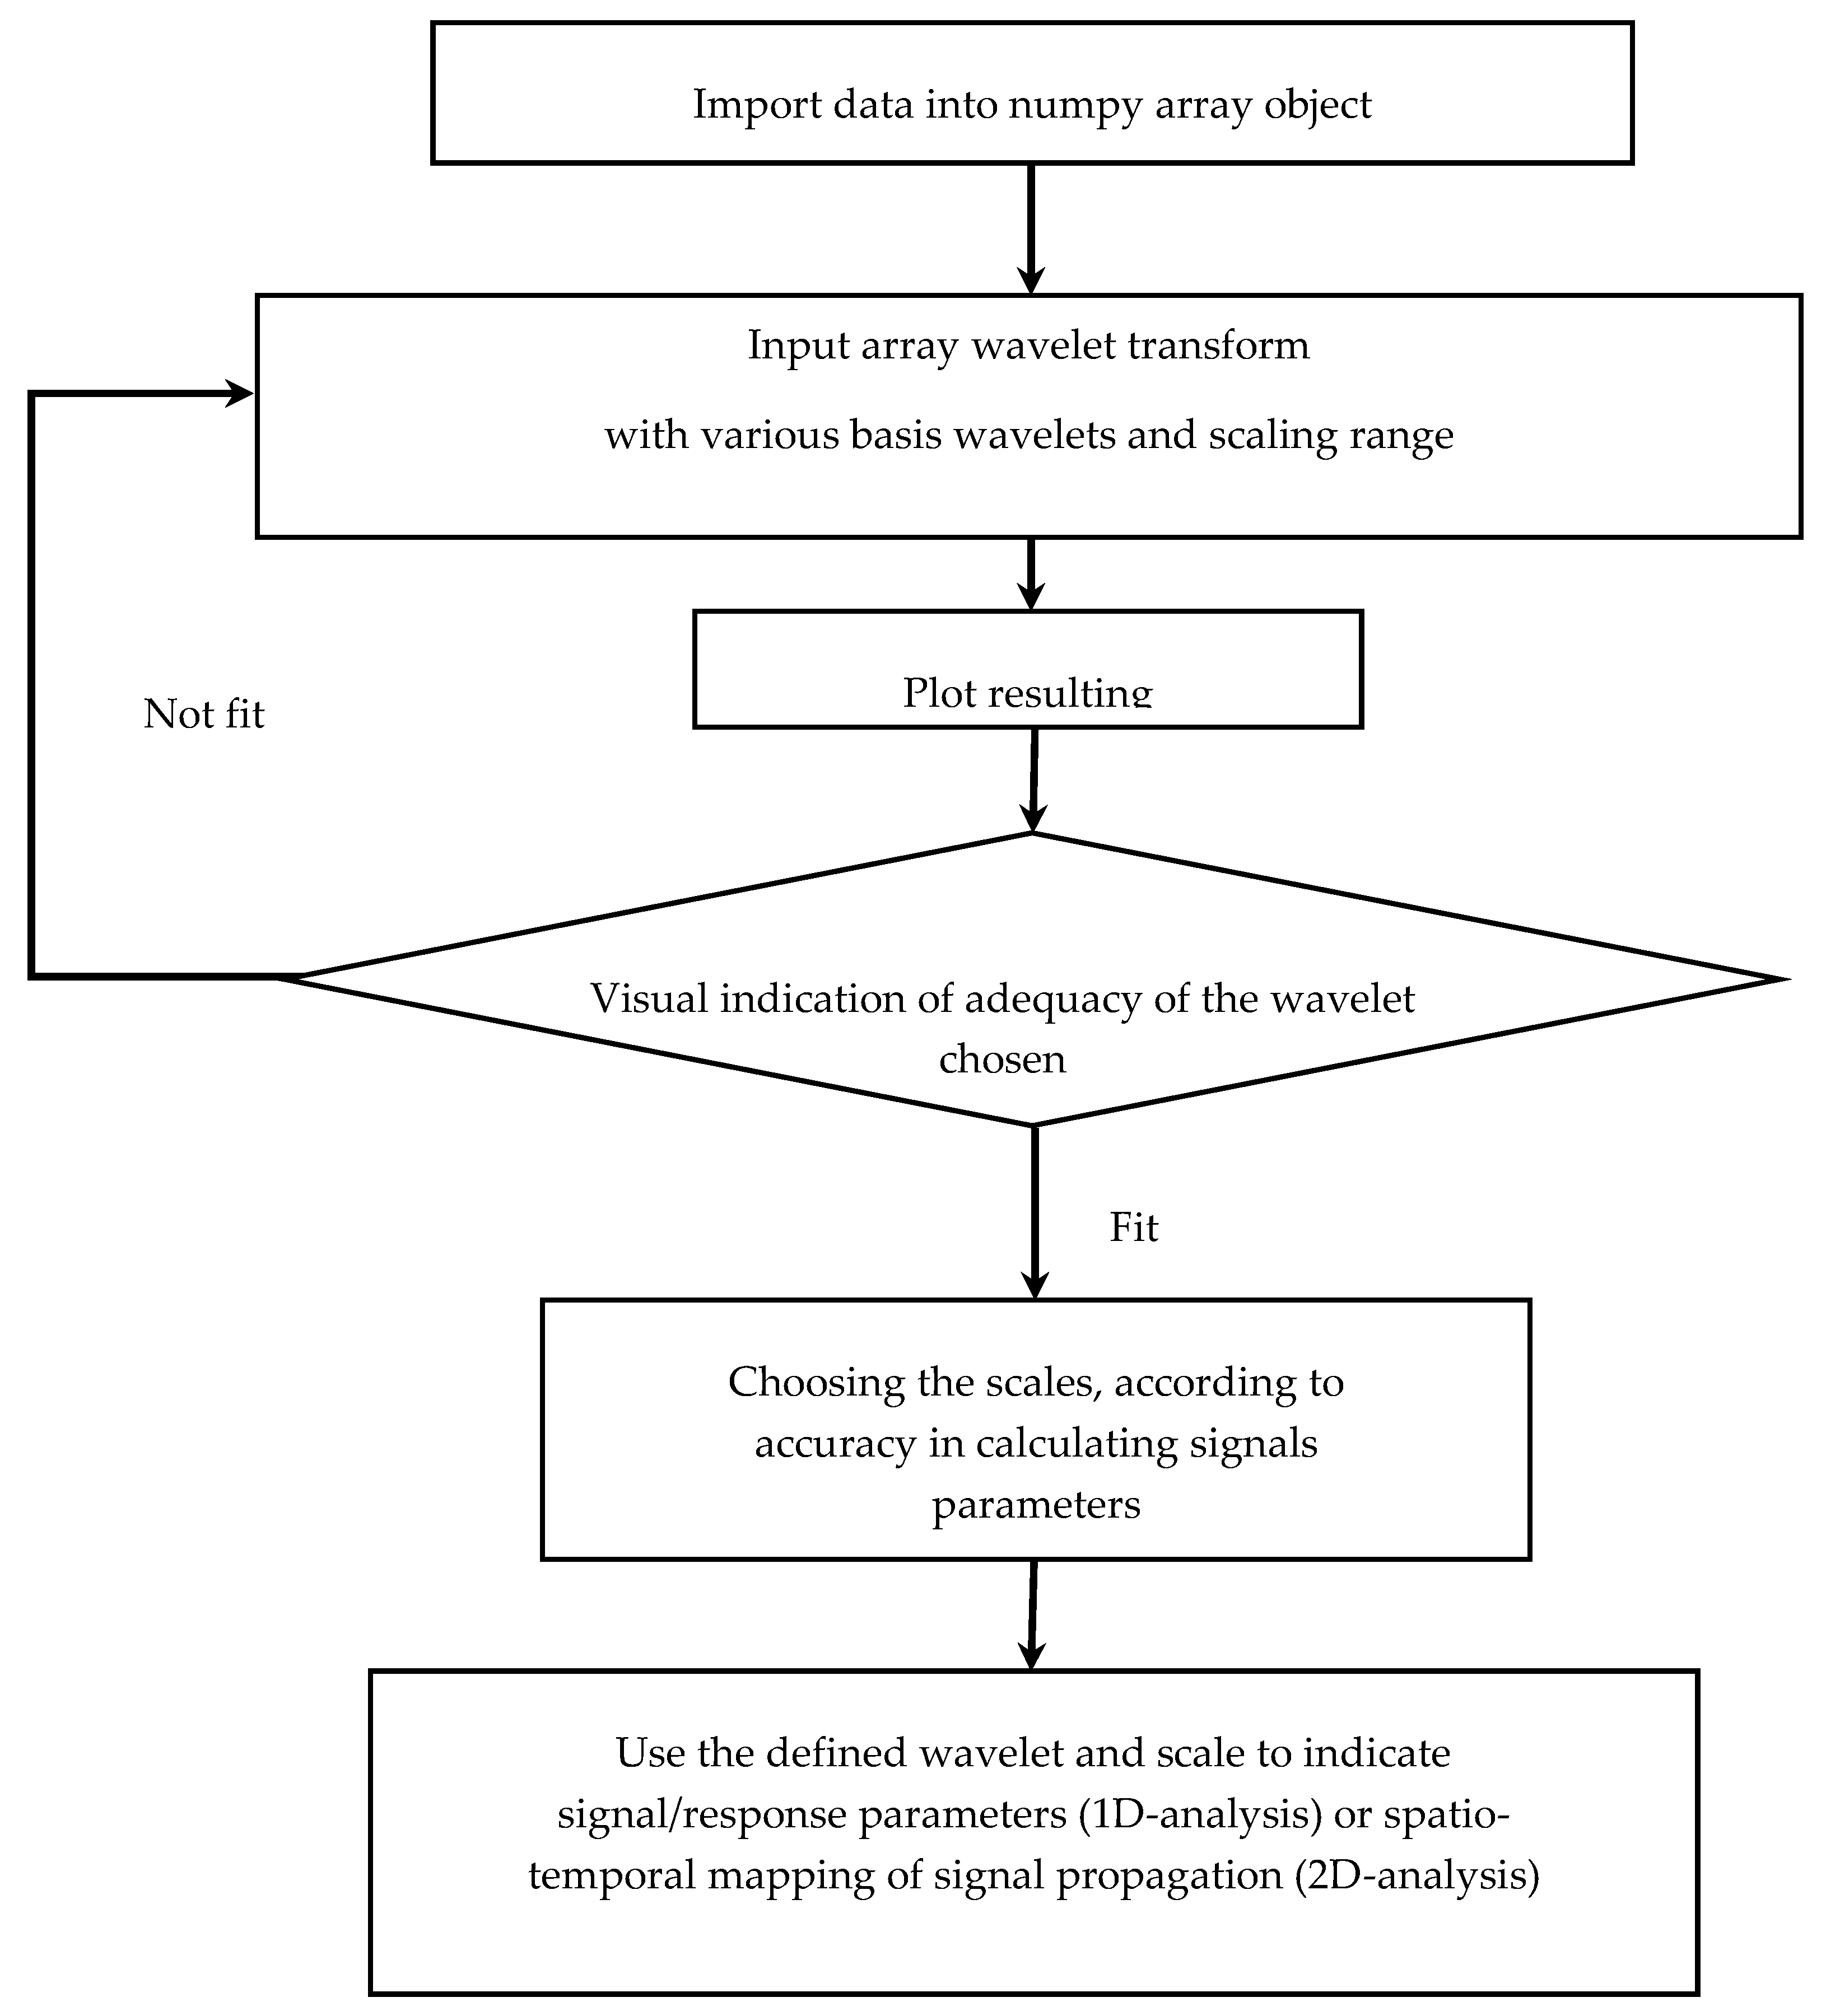
Abstract
1. Introduction
2. Materials and Methods
2.1. Experimental Methods
2.1.1. Plant Material and Stimulation
2.1.2. Intracellular Measurement of Electrical Activity
2.1.3. Extracellular Measurement of Electrical Activity
2.1.4. Measurement of Photosynthetic Parameters and Transpiration
2.2. Wavelet Transform
3. Results
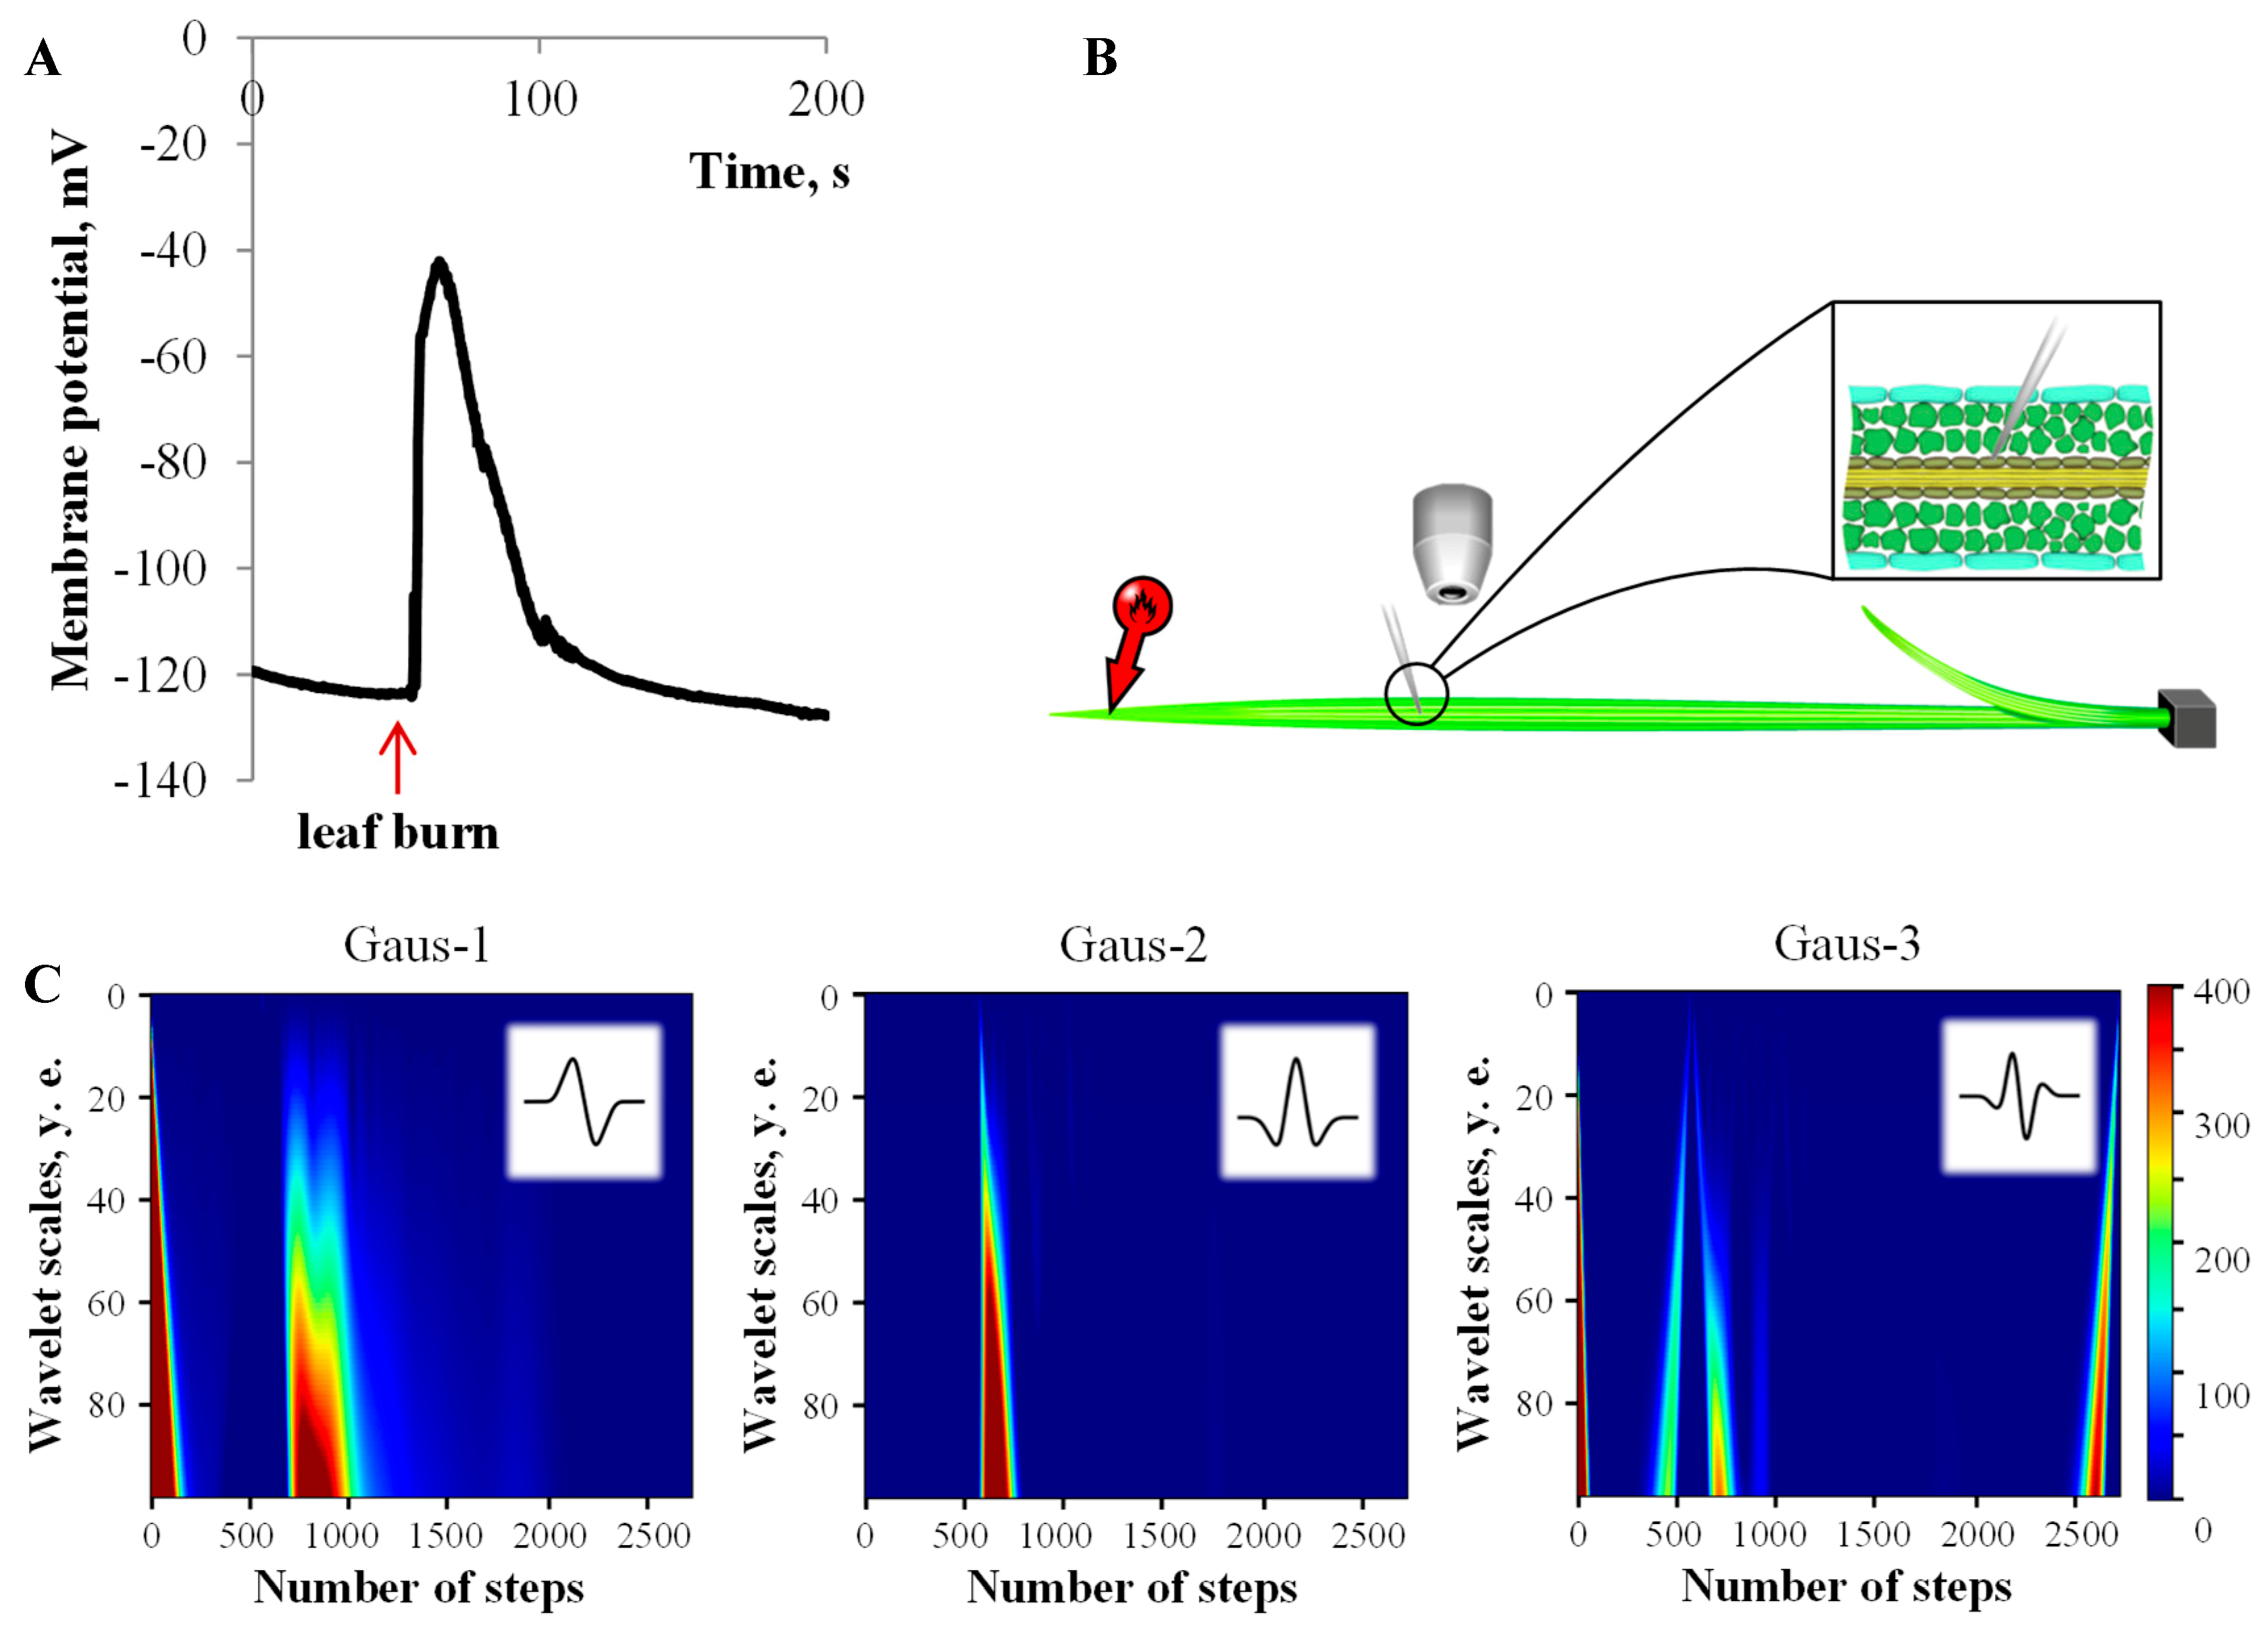
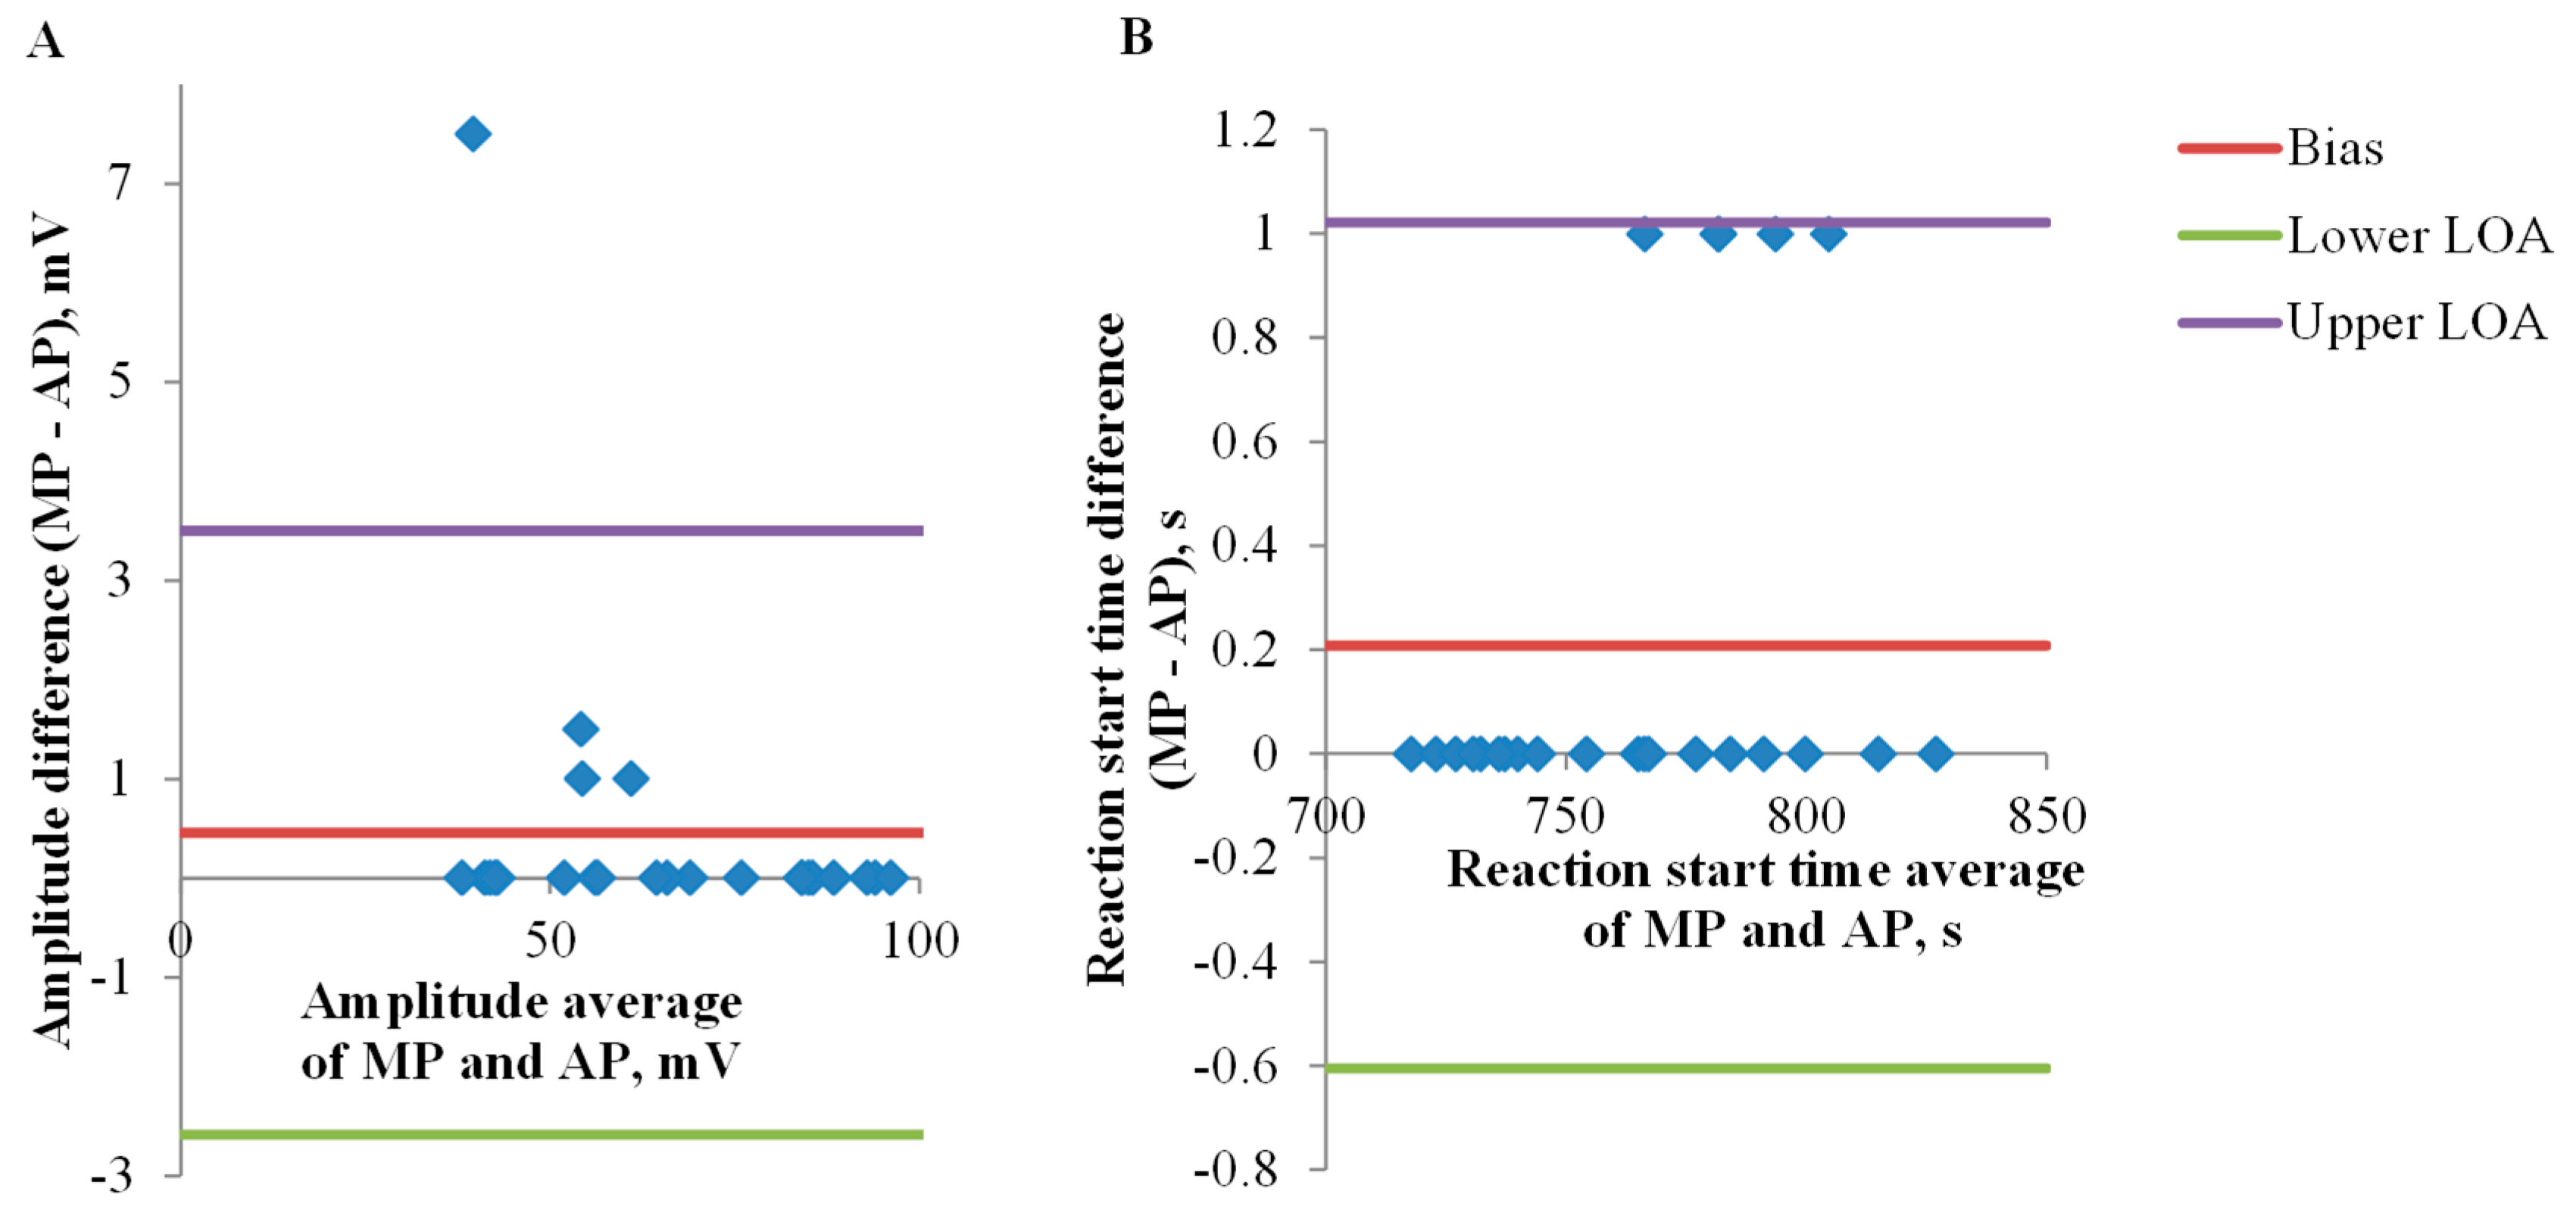
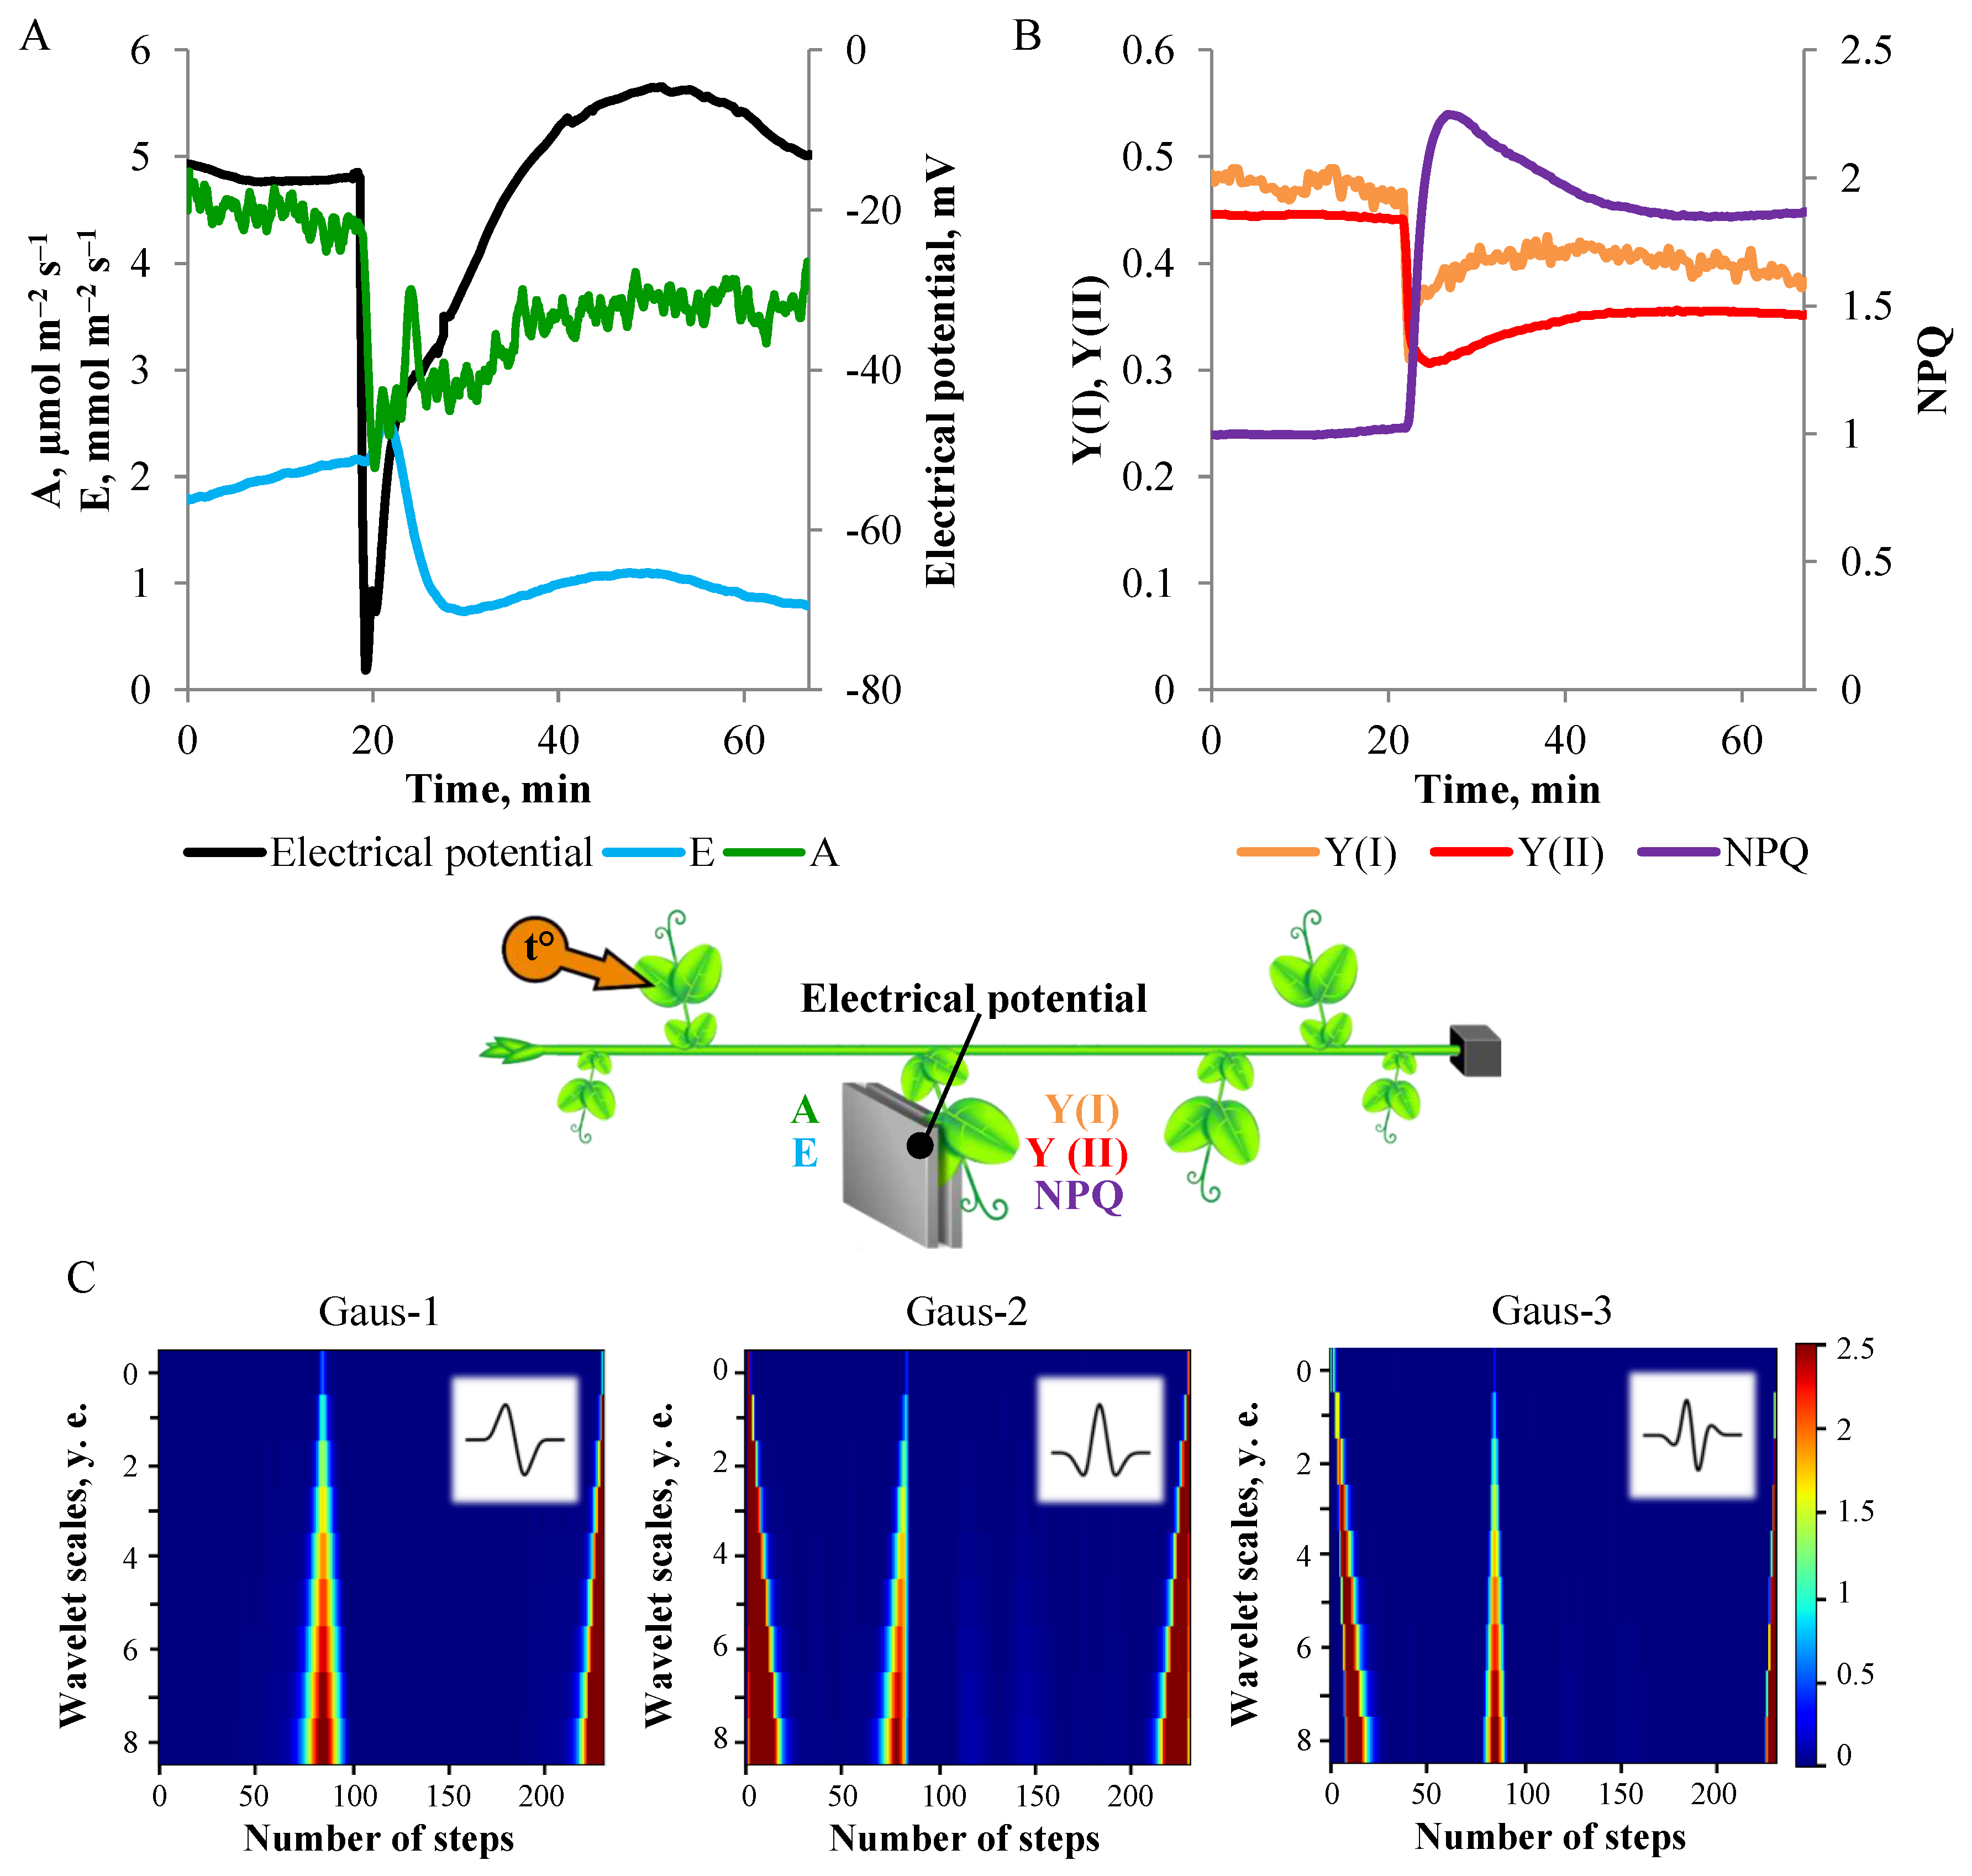
3.1. Electrical Signals Analysis
3.2. One-Dimensional Analysis of Photosynthetic Activity
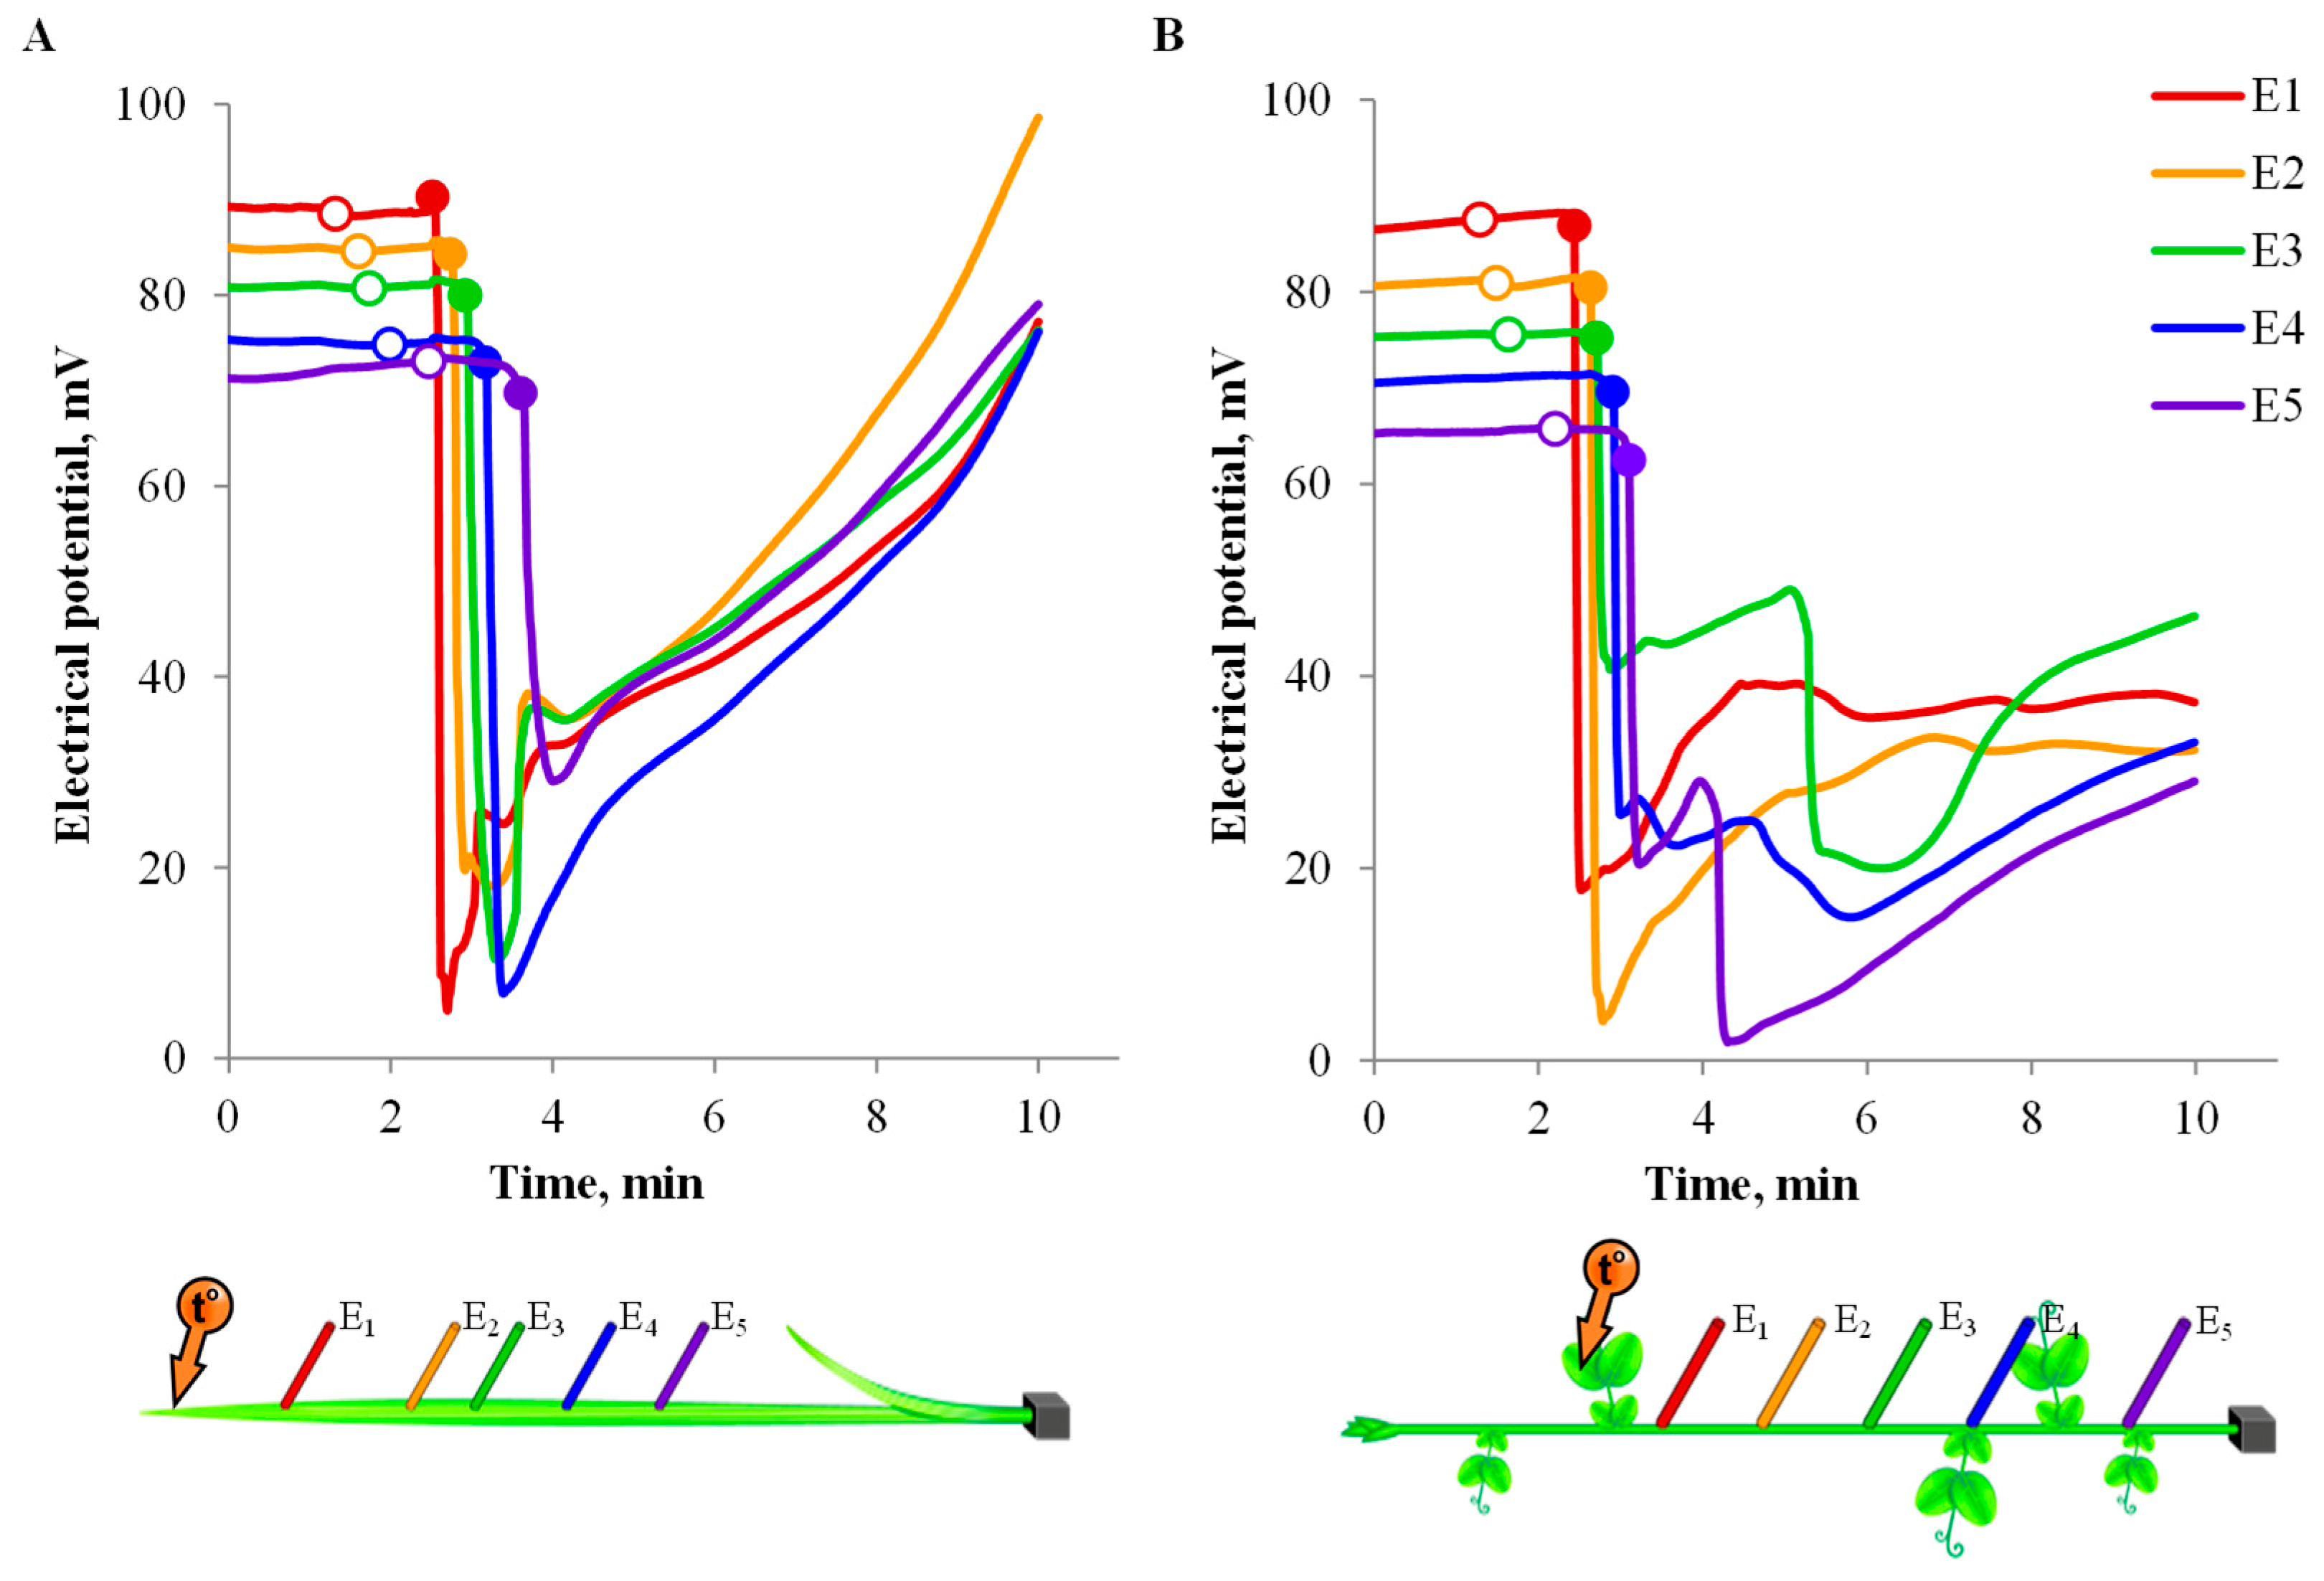
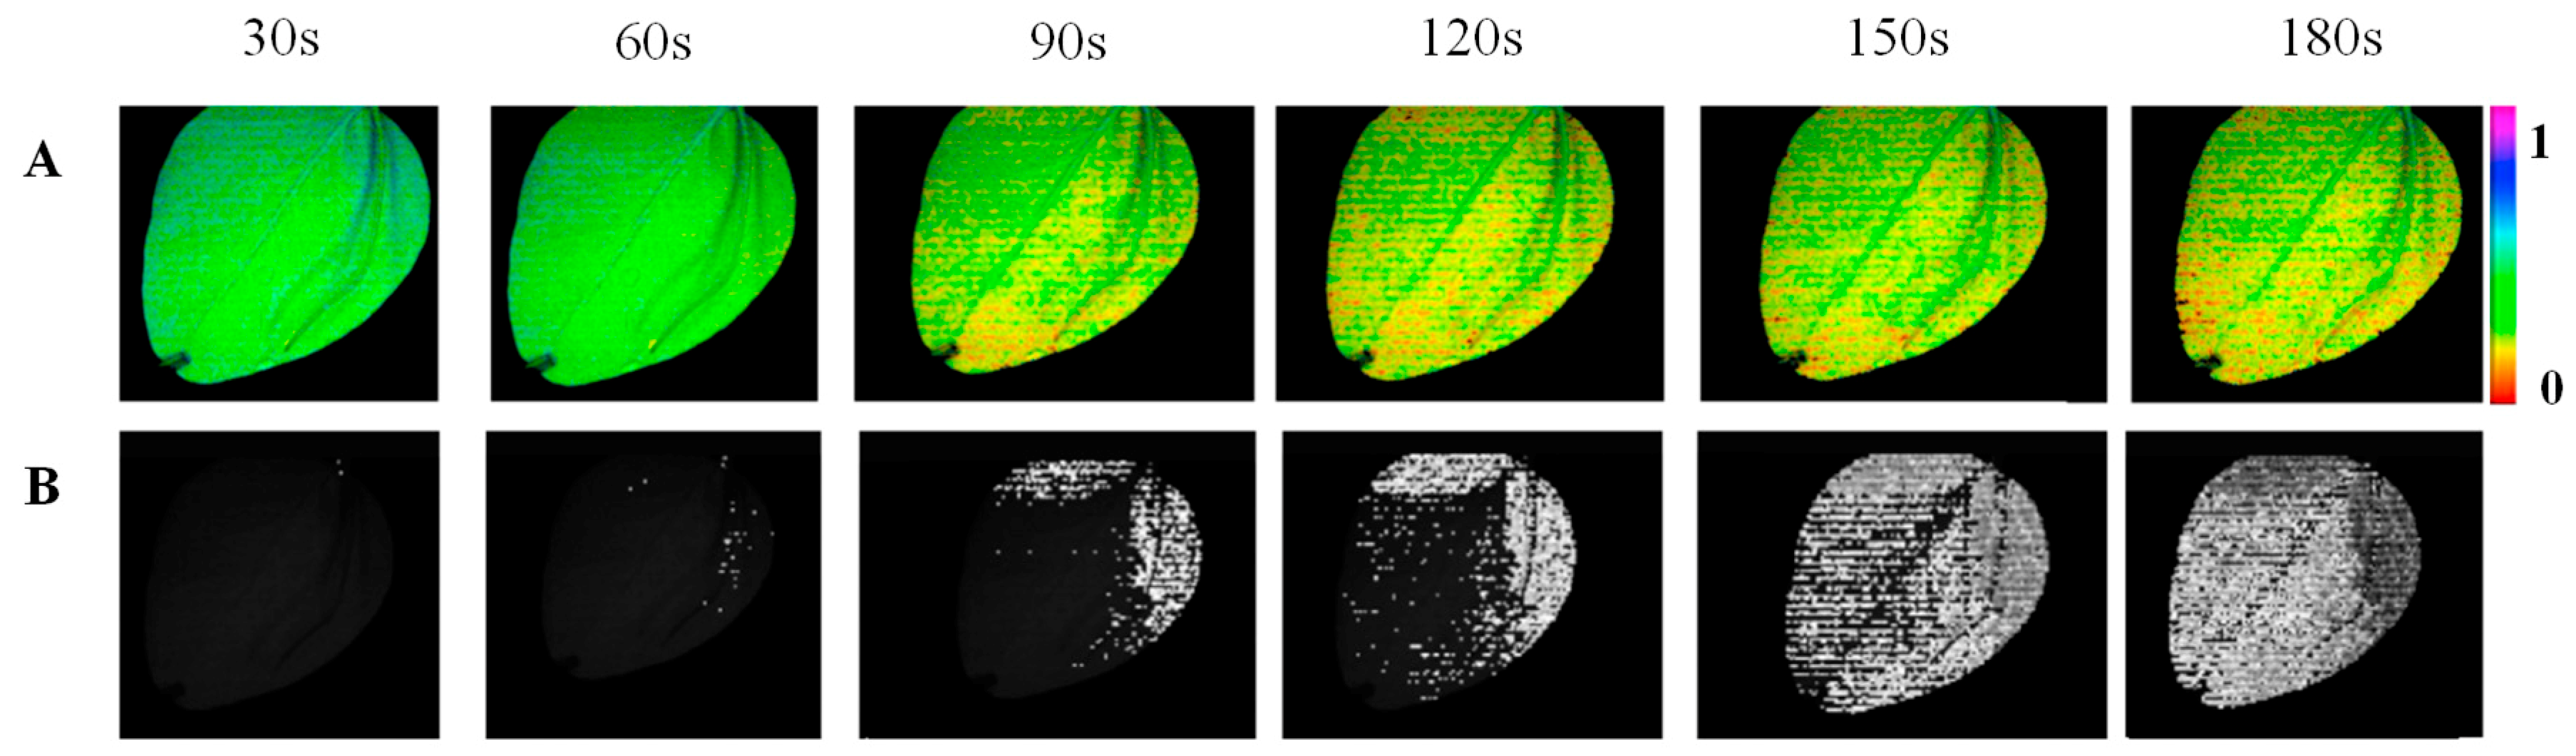
3.3. Spatio-Temporal Mapping of the Photosynthetic Activity
4. Discussion
5. Conclusions
Supplementary Materials
Author Contributions
Funding
Conflicts of Interest
References
- Mazars, C.; Thuleau, P.; Lamotte, O.; Bourque, S. Cross-talk between ROS and calcium in regulation of nuclear activities. Mol. Plant 2010, 3, 706–718. [Google Scholar] [CrossRef] [PubMed]
- Gilroy, S.; Białasek, M.; Suzuki, N.; Górecka, M.; Devireddy, A.R.; Karpiński, S.; Mittler, R. ROS, calcium, and electric signals: Key mediators of rapid systemic signaling in plants. Plant Physiol. 2016, 171, 1606–1615. [Google Scholar] [CrossRef] [PubMed]
- Sukhov, V.; Sukhova, E.; Vodeneev, V. Long-distance electrical signals as a link between the localaction of stressors and the systemic physiological responses in higher plants. Prog. Biophys. Mol. Biol. 2019, 146, 63–84. [Google Scholar] [CrossRef] [PubMed]
- Takahashi, F.; Shinozaki, K. Long-distance signaling in plant stress response. Curr. Opin. Plant Biol. 2019, 47, 106–111. [Google Scholar] [CrossRef]
- Gallé, A.; Lautner, S.; Flexas, J.; Fromm, J. Environmental stimuli and physiological responses: The current view on electrical signaling. Environ. Exp. Bot. 2015, 114, 15–21. [Google Scholar] [CrossRef]
- Huber, A.; Bauerle, T. Long-distance plant signaling pathways in response to multiple stressors: The gap in knowledge. J. Exp. Bot. 2016, 67, 2063–2079. [Google Scholar] [CrossRef]
- Szechyńska-Hebda, M.; Lewandowska, M.; Karpiński, S. Electrical signaling, photosynthesis and systemic acquired acclimation. Front. Physiol. 2017, 14, 684. [Google Scholar] [CrossRef]
- Vodeneev, V.; Akinchits, E.; Sukhov, V. Variation potential in higher plants: Mechanisms of generation and propagation. Plant Signal. Behav. 2015, 10, e1057365. [Google Scholar] [CrossRef]
- Hedrich, R.; Salvador-Recatalà, V.; Dreyer, I. Electrical wiring and long-distance plant communication. Trends Plant Sci. 2016, 21, 376–387. [Google Scholar] [CrossRef]
- Rhodes, J.; Thain, J.; Wildon, D. Evidence for physically distinct systemic signalling pathways in the wounded tomato plant. Ann. Bot. 1999, 84, 109–116. [Google Scholar] [CrossRef]
- Vodeneev, V.; Mudrilov, M.; Akinchits, E.; Balalaeva, I.; Sukhov, V. Parameters of electrical signals and photosynthetic responses induced by them in pea seedlings depend on the nature of stimulus. Funct. Plant Biol. 2018, 45, 160–170. [Google Scholar] [CrossRef]
- Sukhov, V. Electrical signals as mechanism of photosynthesis regulation in plants. Photosynth. Res. 2016, 130, 373–387. [Google Scholar] [CrossRef] [PubMed]
- Stahlberg, R.; Cleland, R.E.; Van Volkenburgh, E. Slow wave potentials—A propagating electrical signal unique to higher plants. In Communication in Plants: Neuronal Aspects of Plant Life; Baluska, F., Mancuso, S., Volkmann, D., Eds.; Springer-Verlag Berlin Heidelberg: Heidelberg, Germany, 2006; pp. 291–308. [Google Scholar]
- Katicheva, L.; Sukhov, V.; Akinchits, E.; Vodeneev, V. Ionic nature of burn-induced variation potential in wheat leaves. Plant Cell Physiol. 2014, 55, 1511–1519. [Google Scholar] [CrossRef] [PubMed]
- Evans, M.; Morris, R. Chemical agents transported by xylem mass flow propagate variation potentials. Plant J. 2017, 91, 1029–1037. [Google Scholar] [CrossRef]
- Fromm, J.; Lautner, S. Electrical signals and their physiological significance in plants. Plant Cell Environ. 2007, 30, 249–257. [Google Scholar] [CrossRef]
- Koziolek, C.H.; Gram, T.H.; Schreiber, U. Transient knockout of photosynthesis mediated by electrical signals. New Phytol. 2004, 161, 715–722. [Google Scholar] [CrossRef]
- Lautner, S.; Grams, T.E.; Matyssek, R.; Fromm, J. Characteristics of electrical signals in poplar and responses in photosynthesis. Plant Physiol. 2005, 138, 2200–2209. [Google Scholar] [CrossRef]
- Grams, T.; Lauther, S.; Felle, H.H.; Matyssek, R.; Fromm, J. Heat-induced electrical signals affect cytoplasmic and apoplastic pH as well as photosynthesis during propagation through the maize leaf. Plant Cell Environ. 2009, 32, 319–326. [Google Scholar] [CrossRef]
- Retivin, V.; Opritov, V.; Lobov, S.; Tarakanov, S.; Khudyakov, V. Changes in the resistance of photosynthesizing cotyledon cells of pumpkin seedlings to cooling and heating, as induced by the stimulation of the root system with KCl solution. Russ. J. Plant Physiol. 1999, 46, 689–696. [Google Scholar]
- Sukhov, V.; Surova, L.; Sherstneva, O.; Vodeneev, V. Influence of variation potential on resistance of the photosynthetic machinery to heating in pea. Physiol. Plant 2014, 152, 773–783. [Google Scholar] [CrossRef]
- Sukhov, V.; Surova, L.; Sherstneva, O.; Katicheva, L.; Vodeneev, V. Variation potential influence on photosynthetic cyclic electron flow in pea. Front. Plant Sci. 2015, 7, 766. [Google Scholar] [CrossRef] [PubMed]
- Sukhov, V.; Surova, L.; Sherstneva, O.; Bushueva, A.; Vodeneev, V. Variation potential induces decreased PSI damage and increased PSII damage under high external temperatures in pea. Funct. Plant Biol. 2015, 42, 727–736. [Google Scholar] [CrossRef]
- Surova, L.; Sherstneva, O.; Vodeneev, V.; Sukhov, V. Variation potential propagation decreases heat-related damage of pea photosystem I by 2 different pathways. Plant Signal. Behav. 2016, 11, e1145334. [Google Scholar] [CrossRef] [PubMed]
- Zandalinas, S.I.; Mittler, R.; Balfagón, D.; Arbona, V.; Gómez-Cadenas, A. Plant adaptations to the combination of drought and high temperatures. Physiol. Plant 2018, 162, 2–12. [Google Scholar] [CrossRef] [PubMed]
- Ashraf, M.; Harris, P.J.C. Photosynthesis under stressful environments: An overview. Photosynthetica 2013, 51, 163–190. [Google Scholar] [CrossRef]
- Zhao, D.J.; Wang, Z.Y.; Huang, L.; Jia, Y.P.; Leng, J.Q. Spatio-temporal mapping of variation potentials in leaves of Helianthus annuus L. seedlings in situ using multi-electrode array. Sci. Rep. 2014, 4, 5435. [Google Scholar] [CrossRef] [PubMed]
- Astafieva, N. Wavelet-analysis: Basic theory and application examples. Phys.-Uspekhi 1996, 39, 1085–1108. [Google Scholar]
- Addison, P. Wavelet transforms and the ECG: A review. Phys. Meas. 2005, 26, 155–199. [Google Scholar] [CrossRef]
- Keil, A.; Stolarova, M.; Heim, S.; Gruber, T.; Müller, M.M. Temporary stability of high-frequency brain oscillations in the human EEG. Brain Topogr. 2003, 16, 101–110. [Google Scholar] [CrossRef]
- Kim, K.H.; Kim, S.J. A Wavelet-based method for action potential detection from extracellular neural signal recording with low signal-to-noise ratio. IEEE Trans. Biomed. Eng. 2003, 50, 999–1011. [Google Scholar]
- Quotb, A.; Bornat, Y.; Renaud, S. Wavelet transform for real-time detection of action potentials in neural signals. Front. Neuroeng. 2011, 4, 7. [Google Scholar] [CrossRef] [PubMed]
- Hramov, A.; Koronovskii, A.; Makarov, V.; Pavlov, A.; Sitnikova, E. Wavelets in Neuroscience; Springer-Verlag: Berlin/Heidelberg, Germany, 2015; Volume 16, p. 318. [Google Scholar]
- Keitt, T.H.; Fischer, J. Detection of scale-specific community dynamics using wavelets. Ecology 2006, 87, 2895–2904. [Google Scholar] [CrossRef]
- Lió, P. Wavelets in bioinformatics and computational biology: State of art and perspective. Bioinform. Rev. 2003, 19, 2–9. [Google Scholar] [CrossRef] [PubMed]
- Haimovich, A.D.; Byrne, B.; Ramaswamy, R.; Welsh, W.J. Wavelet analysis of DNA walks. J. Comput. Biol. 2006, 13, 1289–1298. [Google Scholar] [CrossRef] [PubMed]
- Wang, H.F.; Huo, Z.G.; Zhou, G.S.; Liao, Q.H.; Feng, H.K.; Wu, L. Estimating leaf SPAD values of freeze-damaged winter wheat using continuous wavelet analysis. Plant Physiol. Biochem. 2016, 98, 39–45. [Google Scholar] [CrossRef] [PubMed]
- Cheng, T.; Rivard, B.; Sánchez-Azofeifa, A.G.; Féret, J.B.; Jacquemoud, S.; Ustin, S.L. Predicting leaf gravimetric water content from foliar reflectance across a range of plant species using continuous wavelet analysis. J. Plant Physiol. 2012, 169, 1134–1142. [Google Scholar] [CrossRef] [PubMed]
- Zhang, J.C.; Lin, Y.; Wang, J.H.; Huang, W.J.; Chen, L.P.; Zhang, D.Y. Spectroscopic leaf level detection of powdery mildew for winter wheat using continuous wavelet analysis. J. Integr. Agric. 2012, 11, 1474–1484. [Google Scholar] [CrossRef]
- Duarte-Galvan, C.; Romero-Troncoso, R.J.; Torres-Pacheco, I.; Guevara-Gonzalez, R.G.; Fernandez-Jaramillo, A.A.; Contreras-Medina, L.M.; Carrillo-Serrano, R.V.; Millan-Almaraz, J.R. FPGA-based smart sensor for drought stress detection in tomato plants using novel physiological variables and discrete wavelet transform. Sensors (Basel) 2014, 14, 18650–18669. [Google Scholar] [CrossRef]
- Blackburn, G.A.; Ferwerda, J.G. Retrieval of chlorophyll concentration from leaf reflectance spectra using wavelet analysis. Remote Sens. Environ. 2008, 112, 1614–1632. [Google Scholar] [CrossRef]
- Furon, A.C.; Wagner-Riddle, C.; Ryan Smith, C.; Warland, J.S. Wavelet analysis of wintertime and spring thaw CO2 and N2O fluxes from agricultural fields. Agric. For. Meteorol. 2008, 148, 1305–1317. [Google Scholar] [CrossRef]
- Von Caemmerer, S.; Farquhar, G.D. Some relationships between the photochemistry and the gas exchange of leaves. Planta 1981, 153, 376–387. [Google Scholar] [CrossRef] [PubMed]
- Klughammer, C.; Schreiber, U. Complementary PS II quantum yields calculated from simple fluorescence parameters measured by PAM fluorometry and the saturation pulse method. PAM Appl. Notes 2008, 1, 27–35. [Google Scholar]
- Maxwell, K.; Johnson, G.N. Chlorophyll fluorescence—A practical guide. J. Exp. Bot. 2000, 51, 659–668. [Google Scholar] [CrossRef] [PubMed]
- Rioll, O.; Vetterli, M. Wavelets and signal processing. IEEE Signal Process. Mag. 1991, 8, 14–38. [Google Scholar] [CrossRef]
- Bruce, L.M.; Morgan, C.; Larsen, S. Automated detection of subpixel hyperspectral targets with continuous and discrete wavelet transforms. IEEE Trans. Geosci. Remote Sens. 2001, 39, 2217–2226. [Google Scholar] [CrossRef]
- Bland, J.M.; Altman, D.G. Measuring agreement in method comparison studies. Stat. Methods Med. Res. 1999, 8, 135–160. [Google Scholar] [CrossRef]
- Giavarina, D. Understanding bland altman analysis. Biochem. Med. (Zagreb) 2015, 25, 141–151. [Google Scholar] [CrossRef]
- Grams, T.; Koziolek, C.H.; Lauther, S.; Matyssek, R.; Fromm, J. Distinct roles of electric and hydraulic signals on the reaction of leaf gas exchange upon re-irrigation in Zea mays L. Plant Cell Environ. 2007, 30, 79–84. [Google Scholar] [CrossRef]
- Sukhov, V.; Orlova, L.; Mysyagin, S.; Sinitsina, J.; Vodeneev, V. Analysis of the photosynthetic response induced by variation potential in geranium. Planta 2012, 235, 703–712. [Google Scholar] [CrossRef]
- Sukhova, E.; Mudrilov, M.; Vodeneev, V.; Sukhov, V. Influence of the variation potential on photosynthetic flows of light energy and electrons in pea. Photosynth. Res. 2018, 136, 215–228. [Google Scholar] [CrossRef]
- Gallé, A.; Lautner, S.; Flexas, J.; Ribas-Carbo, M.; Hanson, D.; Roesgen, J.; Fromm, J. Photosynthetic responses of soybean (Glycine max L.) to heat-induced electrical signalling are predominantly governed by modifications of mesophyll conductance for CO2. Plant Cell Environ. 2013, 36, 542–552. [Google Scholar]
- Fromm, J.; Hajirezaei, M.R.; Becker, V.K.; Lautner, S. Electrical signaling along the phloem and its physiological responses in the maize leaf. Front. Plant Sci. 2013, 4, 239. [Google Scholar] [CrossRef] [PubMed]
- Senhadji, L.; Carrault, G.; Bellanger, J.J.; Passariello, G. Comparing wavelet transforms for recognizing cardiac patterns. Eng. Med. Biol. Mag. 1995, 14, 167–173. [Google Scholar] [CrossRef]
- Dinh, H.A.N.; Kumar, D.K.; Pah, N.D.; Burton, P. Wavelets for QRS detection. In Proceedings of the 23rd Annual International Conference of the IEEE Engineering in Medicine and Biology Society, Istanbul, Turkey, 25–28 October 2001. [Google Scholar]
- Selin, A.; Turunen, J.; Tanttu, J.T. Wavelets in recognition of bird sounds. EURASIP J. Adv. Signal Process. 2007, e051806. [Google Scholar] [CrossRef]
- Lau, K.M.; Weng, H. Climate signal detection using wavelet transform: How to make a time series sing. Bull. Am. Meteorol. Soc. 1995, 76, 2391–2402. [Google Scholar] [CrossRef]
- Csillag, F.; Kabos, S. Wavelets, boundaries, and the spatial analysis of landscape pattern. Écoscience 2002, 9, 177–190. [Google Scholar] [CrossRef]
- Bulychev, A.; Komarova, A. Long-distance signal transmission and regulation of photosynthesis in characean cells. Biochemistry (Moscow) 2014, 79, 273–281. [Google Scholar] [CrossRef]
- Sukhov, V.; Sherstneva, O.; Surova, L.; Katicheva, L.; Vodeneev, V. Proton cellular influx as a probable mechanism of variation potential influence on photosynthesis in pea. Plant Cell Environ. 2014, 37, 2532–2541. [Google Scholar] [CrossRef]
- Sherstneva, O.; Surova, L.; Vodeneev, V.; Plotnikova, Y.; Bushueva, A.; Sukhov, V. The role of the intra- and extracellular protons in the photosynthetic response induced by the variation potential in pea seedlings. Biochem. Mosc. Suppl. Ser. A 2016, 10, 60–67. [Google Scholar] [CrossRef]
- Chatterjee, S.K.; Das, S.; Maharatna, K.; Masi, E.; Santopolo, L.; Mancuso, S.; Vitaletti, A. Exploring strategies for classification of external stimuli using statistical features of the plant electrical response. J. R. Soc. Interface 2015, 12, e20141225. [Google Scholar] [CrossRef]
- Tian, L.; Meng, Q.; Wang, L.; Dong, J.; Wu, H. Research on the effect of electrical signals on growth of sansevieria under Light-Emitting Diode (LED) lighting environment. PLoS ONE 2015, 10, e0131838. [Google Scholar] [CrossRef] [PubMed]
- Yang, J.; Du, L.; Gong, W.; Shi, S.; Sun, J.; Chen, B. Potential of vegetation indices combined with laser-induced fluorescence parameters for monitoring leaf nitrogen content in paddy rice. PLoS ONE 2018, 13, e0191068. [Google Scholar] [CrossRef] [PubMed]
- Guo, Y.; Zhou, Y.; Tan, J. Wavelet analysis of pulse-amplitude-modulated chlorophyll fluorescence for differentiation of plant samples. J. Theor. Biol. 2015, 370, 116–120. [Google Scholar] [CrossRef] [PubMed]
- Pereira, D.R.; Papa, G.P.; Saraiva, G.F.R.; Souza, G.M. Automatic classification of plant electrophysiological responses to environmental stimuli using machine learning and interval arithmetic. Comput. Electron. Agric. 2018, 145, 35–42. [Google Scholar] [CrossRef]
- Chen, Y.; Zhao, D.J.; Wang, Z.Y.; Wang, Z.Y.; Tang, G.; Huang, L. Plant electrical signal classification based on Waveform. Algorithms 2016, 9, 70. [Google Scholar] [CrossRef]
- Chatterjee, S.K.; Malik, O.; Gupta, S. Chemical sensing employing plant electrical signal response-classification of stimuli using curve fitting coefficients as features. Biosensors (Basel) 2018, 8, 83. [Google Scholar] [CrossRef]
- Gamon, J.A.; Peñuelas, J.; Field, C.B. A narrow-waveband spectral index that tracks diurnal changes in photosynthetic efficiency. Remote Sens. Environ. 1992, 41, 35–44. [Google Scholar] [CrossRef]
- Peñuelas, J.; Filella, I.; Gamon, J.A. Assessment of photosynthetic radiation-use efficiency with spectral reflectance. New Phytol. 1995, 131, 291–296. [Google Scholar] [CrossRef]
- Sukhova, E.; Sukhov, V. Analysis of light-induced changes in the photochemical reflectance index (PRI) in leaves of pea, wheat, and pumpkin using pulses of green-yellow measuring light. Remote Sens. 2019, 11, 810. [Google Scholar] [CrossRef]
- Sukhov, V.; Sukhova, E.; Gromova, E.; Surova, L.; Nerush, V.; Vodeneev, V. The electrical signals-induced systemic photosynthetic response is accompanied with changes in photochemical reflectance index in pea. Funct. Plant Biol. 2019, 46, 328–338. [Google Scholar] [CrossRef]
- Garbulsky, M.F.; Peñuelas, J.; Gamon, J.; Inoue, Y.; Filella, I. The photochemical reflectance index (PRI) and the remote sensing of leaf, canopy and ecosystem radiation use efficiencies. A review and meta-analysis. Remote Sens. Environ. 2011, 115, 281–297. [Google Scholar] [CrossRef]
- Zhang, C.; Filella, I.; Garbulsky, M.F.; Peñuelas, J. Affecting factors and recent improvements of the photochemical reflectance index (PRI) for remotely sensing foliar, canopy and ecosystemic radiation-use efficiencies. Remote Sens. 2016, 8, 677. [Google Scholar] [CrossRef]
- Sukhova, E.; Sukhov, V. Connection of the photochemical reflectance index (PRI) with the photosystem II quantum yield and nonphotochemical quenching can be dependent on variations of photosynthetic parameters among investigated plants: A meta-analysis. Remote Sens. 2018, 10, 771. [Google Scholar] [CrossRef]


© 2019 by the authors. Licensee MDPI, Basel, Switzerland. This article is an open access article distributed under the terms and conditions of the Creative Commons Attribution (CC BY) license (http://creativecommons.org/licenses/by/4.0/).
Share and Cite
Mudrilov, M.; Katicheva, L.; Ladeynova, M.; Balalaeva, I.; Sukhov, V.; Vodeneev, V. Automatic Determination of the Parameters of Electrical Signals and Functional Responses of Plants Using the Wavelet Transformation Method. Agriculture 2020, 10, 7. https://doi.org/10.3390/agriculture10010007
Mudrilov M, Katicheva L, Ladeynova M, Balalaeva I, Sukhov V, Vodeneev V. Automatic Determination of the Parameters of Electrical Signals and Functional Responses of Plants Using the Wavelet Transformation Method. Agriculture. 2020; 10(1):7. https://doi.org/10.3390/agriculture10010007
Chicago/Turabian StyleMudrilov, Maxim, Lyubov Katicheva, Maria Ladeynova, Irina Balalaeva, Vladimir Sukhov, and Vladimir Vodeneev. 2020. "Automatic Determination of the Parameters of Electrical Signals and Functional Responses of Plants Using the Wavelet Transformation Method" Agriculture 10, no. 1: 7. https://doi.org/10.3390/agriculture10010007
APA StyleMudrilov, M., Katicheva, L., Ladeynova, M., Balalaeva, I., Sukhov, V., & Vodeneev, V. (2020). Automatic Determination of the Parameters of Electrical Signals and Functional Responses of Plants Using the Wavelet Transformation Method. Agriculture, 10(1), 7. https://doi.org/10.3390/agriculture10010007