Predicting Pain Trajectories in the One Year Following Breast Cancer Diagnosis—An Observational Study


 and
and
Abstract
1. Introduction
2. Methods
2.1. Study Design
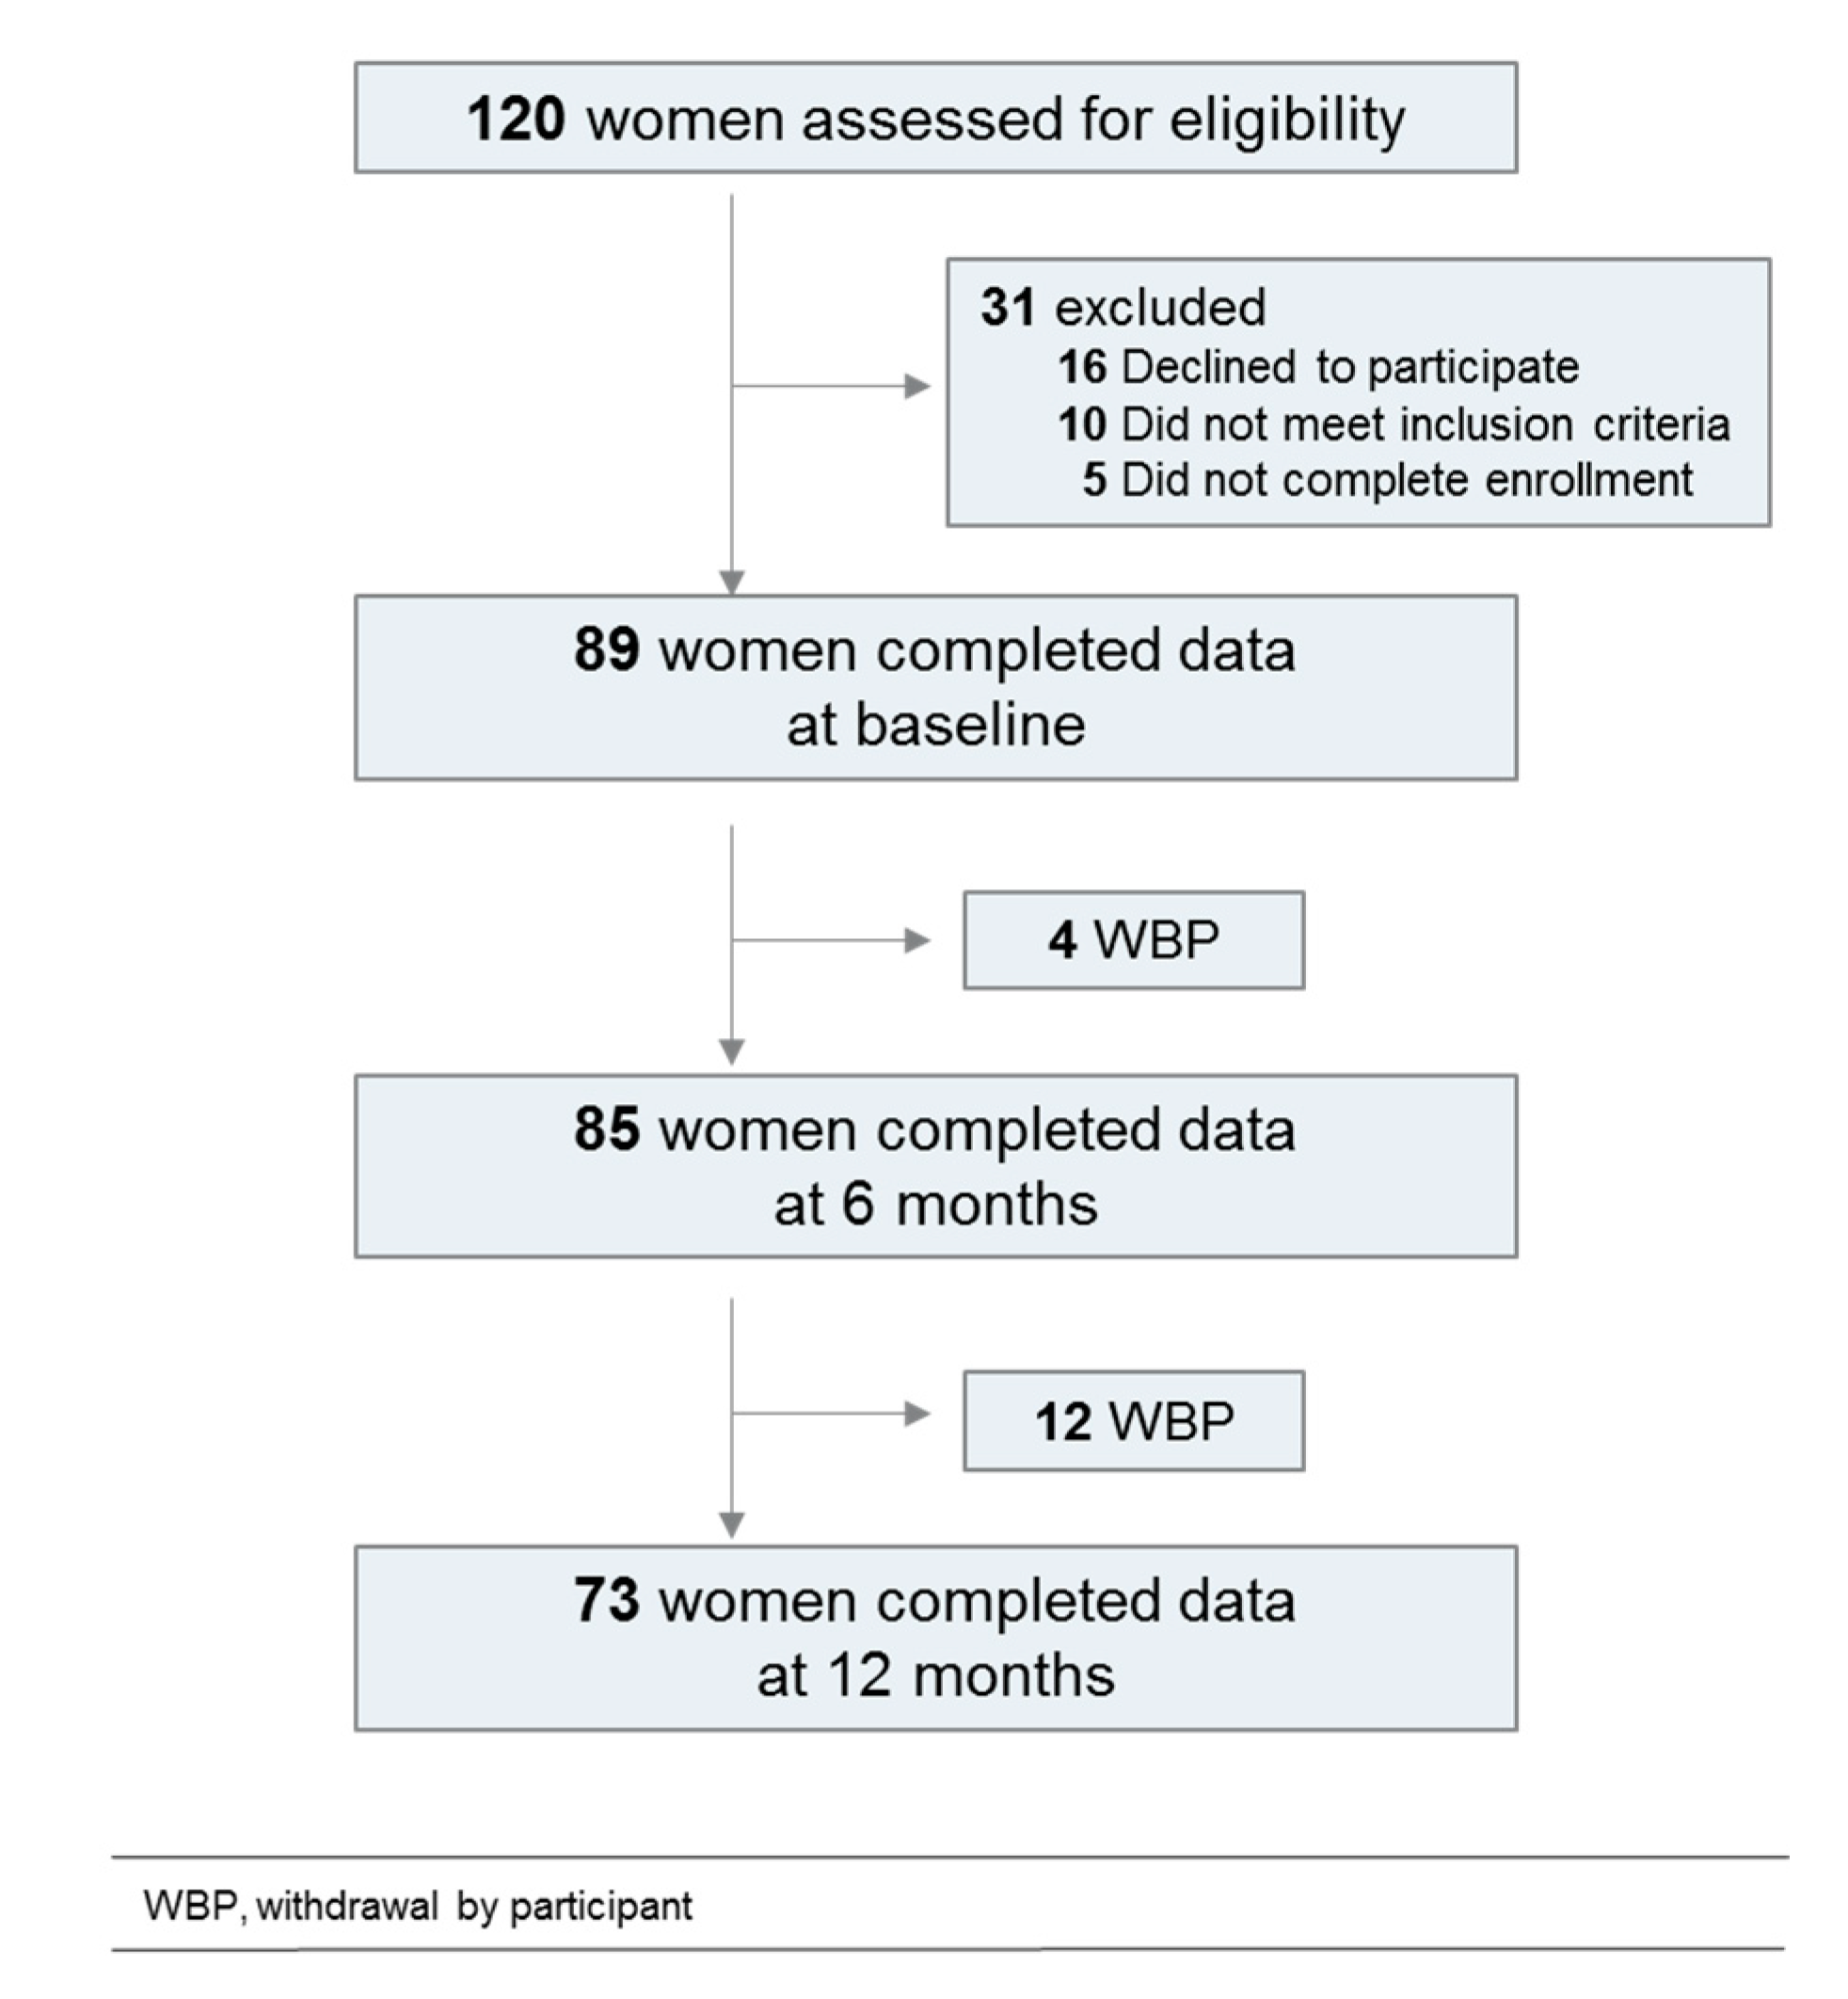
2.2. Participants
2.2.1. Pain Measurement
2.2.2. Cognitive Function
2.2.3. Emotional Function
2.2.4. Quality of Life and Precariousness
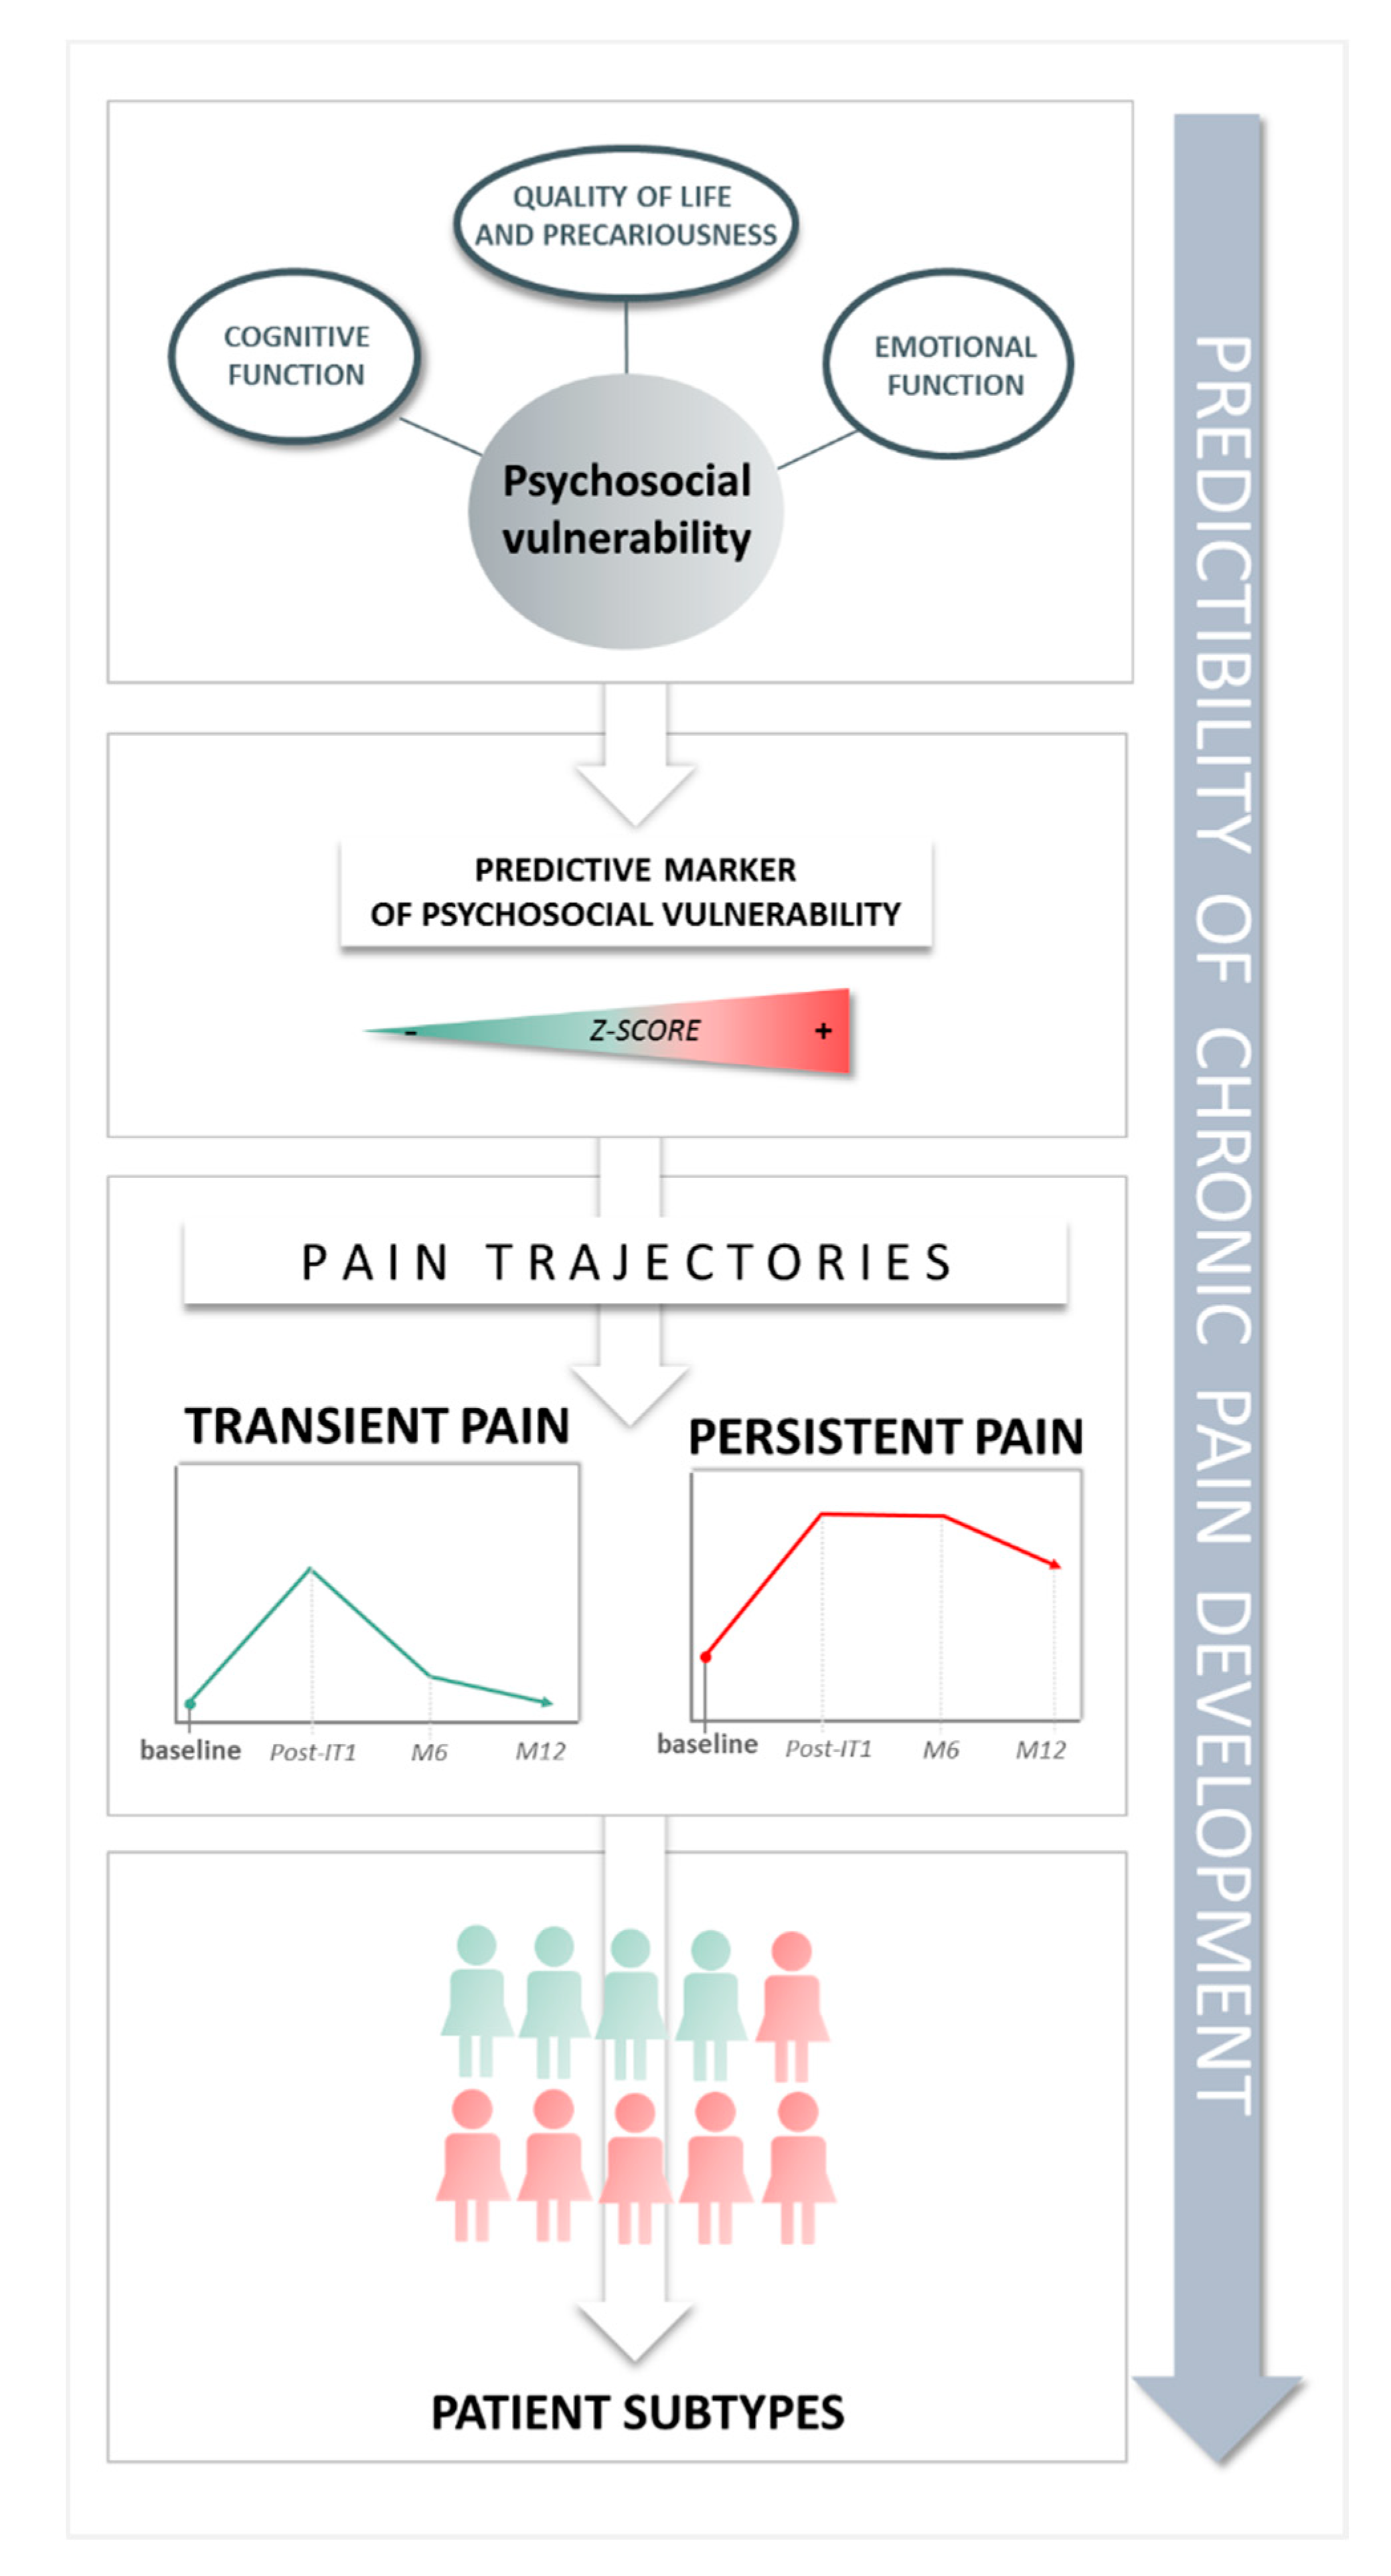
2.2.5. Psychosocial Vulnerability
2.3. Statistical Analysis
3. Results
3.1. Longitudinal Analysis
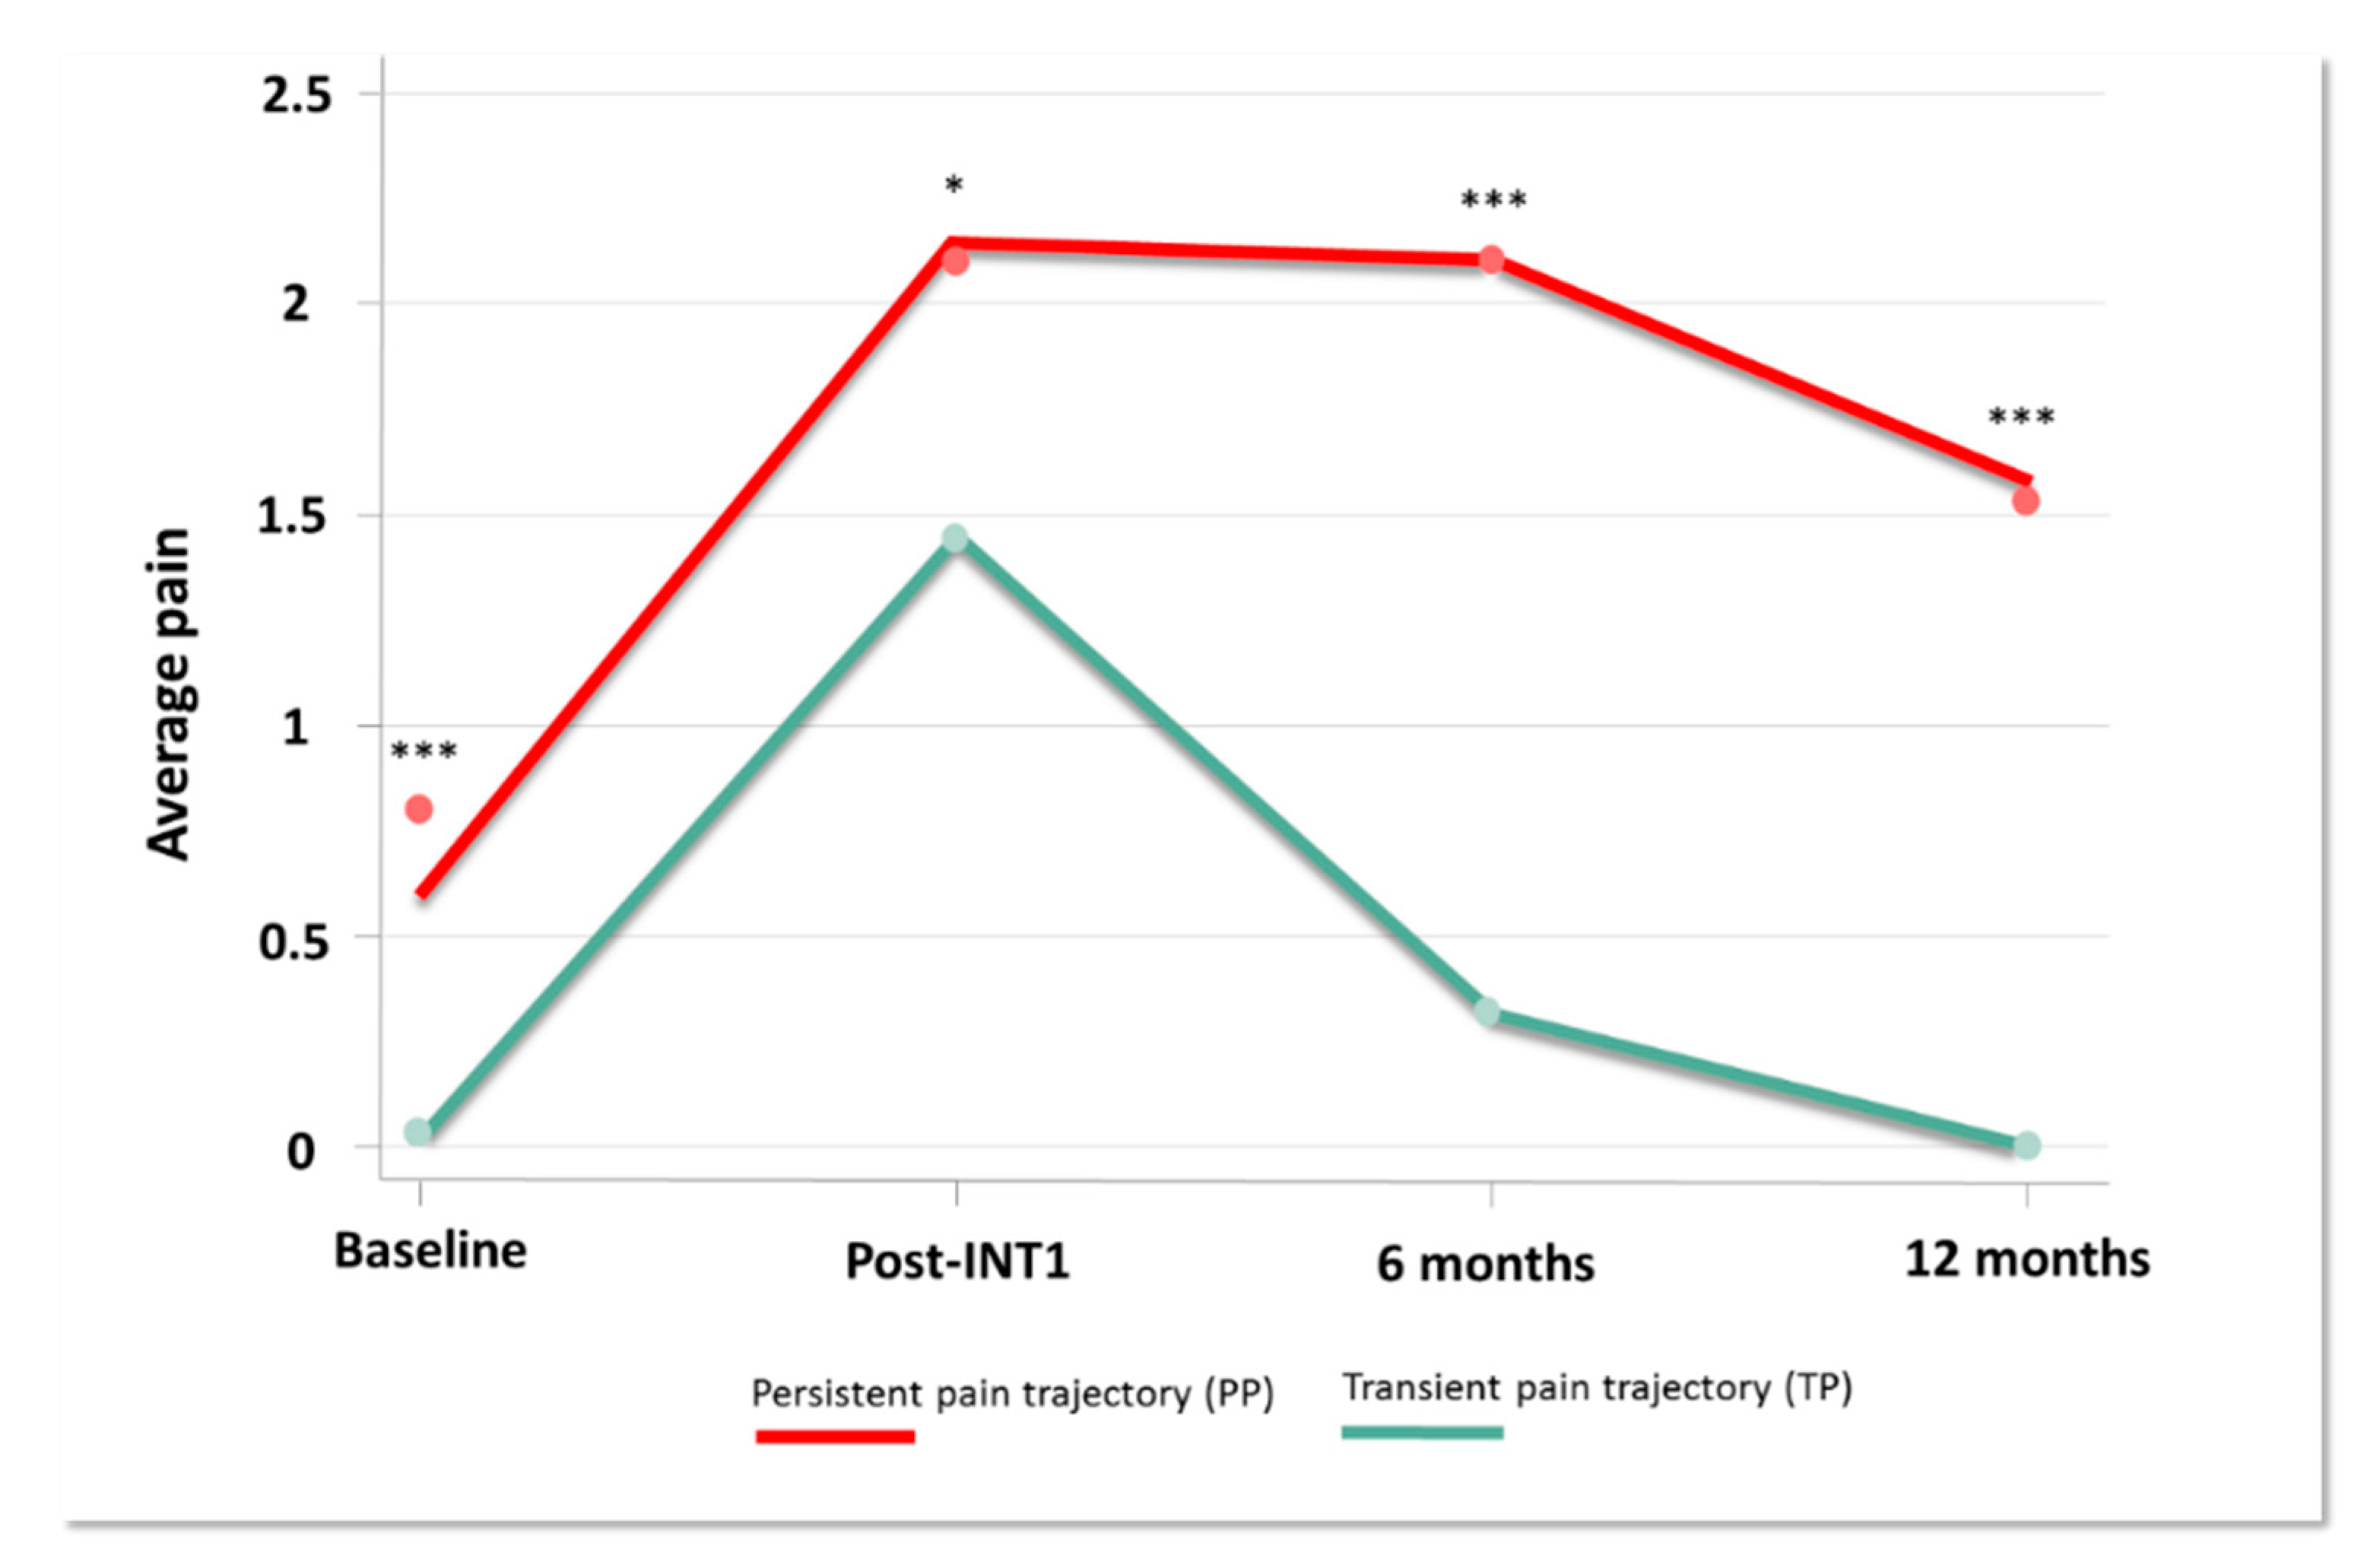
3.2. Pain Trajectories
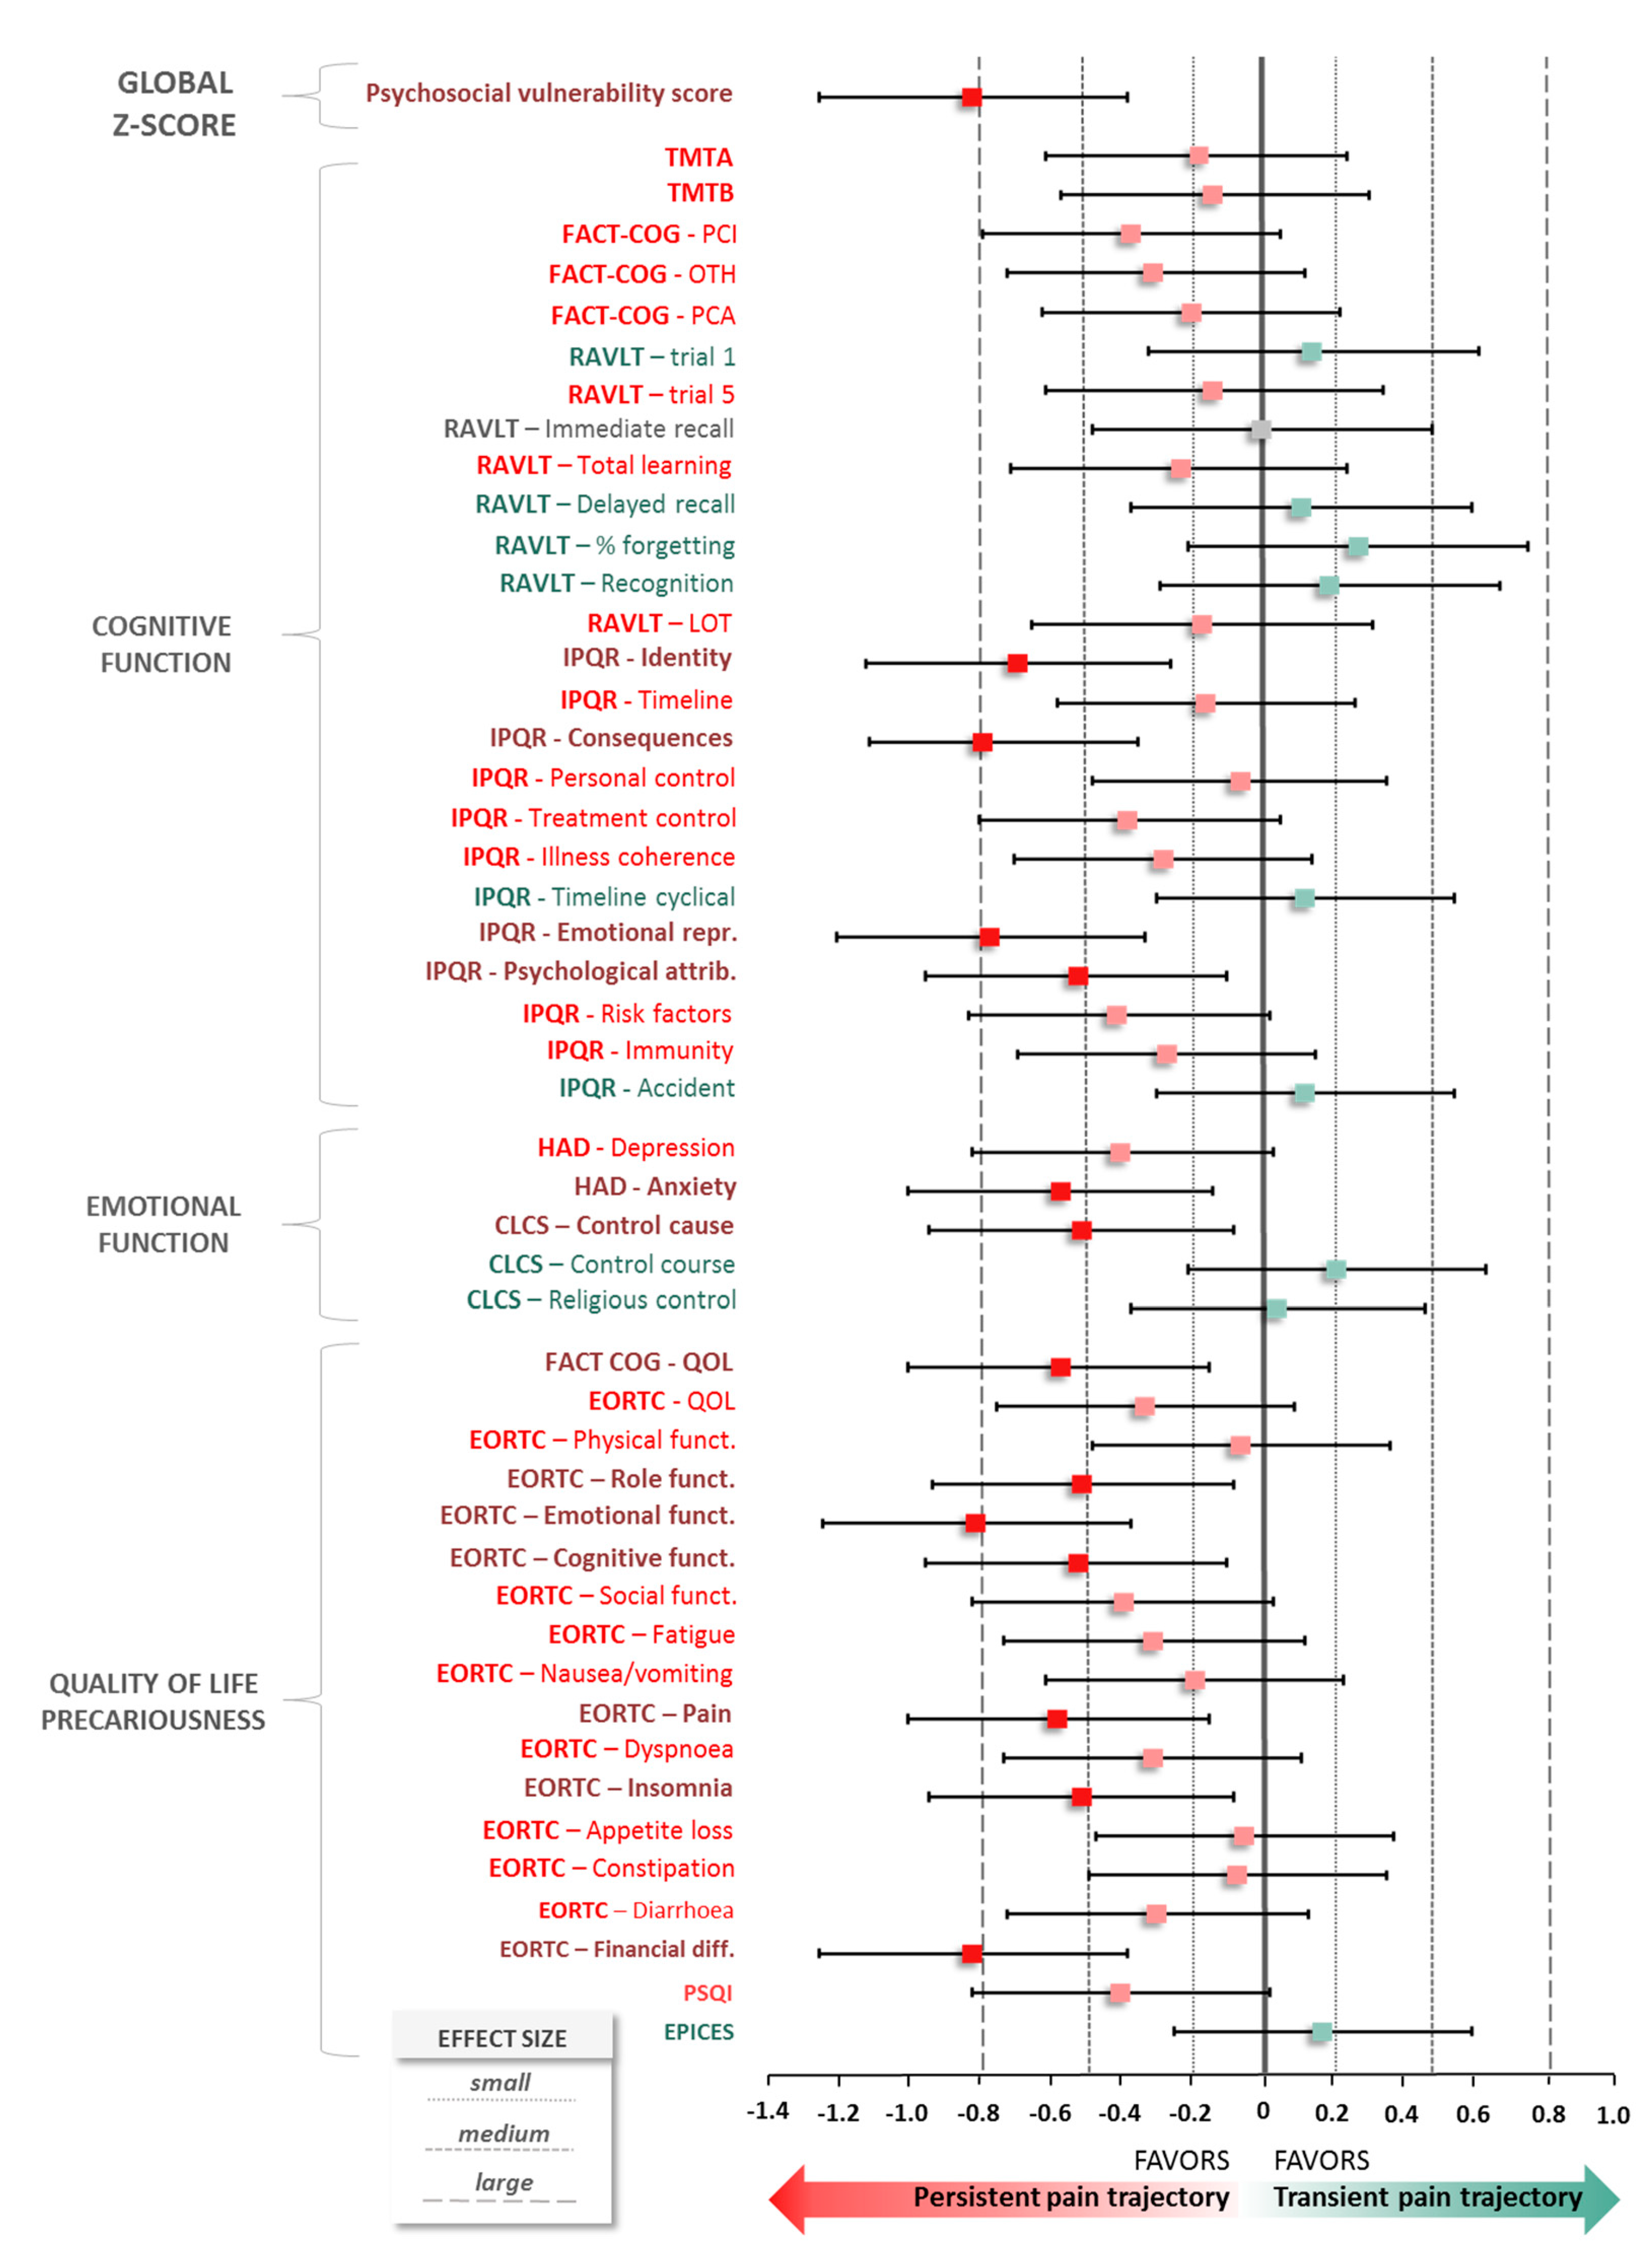
3.3. Standardized Scores (Z-SCORE)—Psychosocial Vumnerability
4. Discussion
Supplementary Materials
Author Contributions
Funding
Acknowledgments
Conflicts of Interest
References
- Jemal, A.; Ward, E.; Johnson, C.; Cronin, K.; Ma, J.; Ryerson, B.; Mariotto, A.; Lake, A.; Wilson, W.; Sherman, R.; et al. Annual Report to the Nation on the Status of Cancer, 1975–2014, Featuring Survival. J. Natl. Cancer Inst. 2017, 109. [Google Scholar] [CrossRef] [PubMed]
- Siegel, R.; Miller, K.; Ahmedin Jemal, A. Cancer Statistics, 2020. CA Cancer J. Clin. 2020, 70, 7–30. [Google Scholar] [CrossRef] [PubMed]
- Gartner, R.; Jensen, M.B.; Nielsen, J.; Ewertz, M.; Kroman, N.; Kehlet, H. Prevalence of and factors associated with persistent pain following breast cancer surgery. JAMA 2009, 302, 1985–1992. [Google Scholar] [CrossRef] [PubMed]
- Pereira, S.; Fontes, F.; Sonin, T.; Dias, T.; Fragoso, M. Are psychological predictors of chronic postsurgical pain dependent on the surgical model? A comparison of total knee arthroplasty and breast surgery for cancer. J. Pain Symptom Manag. 2017, 54, 877–888. [Google Scholar] [CrossRef] [PubMed]
- Sipilä, R.; Haasio, L.; Meretoja, T.; Ripatti, S.; Estlander, A.M.; Kalso, E. Does expecting more pain make it more intense? Factors associated with the first week pain trajectories after breast cancer surgery. Pain 2017, 158, 922–930. [Google Scholar] [CrossRef]
- Miaskowski, C.; Cooper, B.; Paul, S.M.; West, C.; Langford, D.; Levine, J.D.; Abrams, G.; Hamolsky, D.; Dunn, L.; Dodd, M.; et al. Identification of patient subgroups and risk factors for persistent breast pain following breast cancer surgery. J. Pain 2012, 13, 1172–1187. [Google Scholar] [CrossRef]
- Miaskowski, C.; Paul, S.M.; Cooper, B.; West, C.; Levine, J.D.; Elboim, C.; Hamolsky, D.; Abrams, G.; Luce, J.; Dhruva, A.; et al. Identification of patient subgroups and risk factors for persistent arm/shoulder pain following breast cancer surgery. Eur. J. Oncol. Nurs. 2014, 18, 242–253. [Google Scholar] [CrossRef]
- Chapman, C.R.; Donaldson, G.W.; Davis, J.J.; Bradshaw, D.H. Improving individual measurement of postoperative pain: The pain trajectory. J. Pain 2011, 12, 257–262. [Google Scholar] [CrossRef]
- Ip, H.Y.; Abrishami, A.; Peng, P.W.; Wong, J.; Chung, F. Predictors of postoperative pain and analgesic consumption: A qualitative systematic review. Anesthesiology 2009, 111, 657–677. [Google Scholar] [CrossRef]
- Katz, J.; Poleshuck, E.L.; Andrus, C.H.; Hogan, L.A.; Jung, B.F.; Kulick, D.I.; Dworkin, R.H. Risk factors for acute pain and its persistence following breast cancer surgery. Pain 2005, 119, 16–25. [Google Scholar] [CrossRef]
- Pinto, P.R.; McIntyre, T.; Ferrero, R.; Almeida, A.; Araujo-Soares, V. Risk factors for moderate and severe persistent pain in patients undergoing total knee and hip arthroplasty: A prospective predictive study. PLoS ONE 2013, 8, e73917. [Google Scholar] [CrossRef] [PubMed]
- Kyranou, M.; Puntillo, K.; Aouizerat, B.E.; Dunn, L.B.; Paul, S.M.; Cooper, B.A.; West, C.; Dodd, M.; Elboim, C.; Miaskowski, C. Trajectories of Depressive Symptoms in Women Prior to and for Six Months After Breast Cancer Surgery. J. Appl. Biobehav. Res. 2014, 19, 79–105. [Google Scholar] [CrossRef] [PubMed]
- Bao, T.; Basal, C.; Seluzicki, C.; Li, S.; Seidman, A.; Mao, J. Long-term chemotherapy-induced peripheral neuropathy among breast cancer survivors: Prevalence, risk factors, and fall risk. Breast Cancer Res. Treat. 2016, 159, 327–333. [Google Scholar] [CrossRef]
- Hershman, D.; Till, C.; Wright, J.; Awad, D.; Ramsey, S.; Barlow, W.; Minasian, L.; Unger, J. Comorbidities and Risk of Chemotherapy-Induced Peripheral Neuropathy among Participants 65 Years or Older in Southwest Oncology Group Clinical Trials. J. Clin. Oncol. 2016, 34, 3014–3022. [Google Scholar] [CrossRef] [PubMed]
- Whisenant, M.; Wong, B.; Mitchell, S.; Beck, S.; Mooney, K. Symptom Trajectories Are Associated With Co-occurring Symptoms during Chemotherapy for Breast Cancer. J. Pain Symptom Manag. 2019, 57, 183–189. [Google Scholar] [CrossRef]
- Vardy, J.; Wong, K.; Yi, Q.L.; Park, A.; Maruff, P.; Wagner, L.; Tannock, I. Assessing Cognitive Function in Cancer Patients. Support. Care Cancer 2006, 14, 1111–1118. [Google Scholar] [CrossRef]
- Le Fel, J.; Daireaux, A.; Vandenbosshe, S.; Heutte, N.; Rigal, O.; Rovira, K.; Joly, F.; Roy, V. Impact of Cancer Treatments on Cognitive Functions: The Patients’ View, Their Expectation and Their Interest in Participating to Cognitive Rehabilitation Workshops. Bull. Cancer 2013, 100, 223–229. [Google Scholar] [CrossRef]
- Hedayati, E.; Johnsson, A.; Alinaghizadeh, H.; Schedin, A.; Nyman, H.; Albertsson, M. Cognitive, Psychosocial, Somatic and Treatment Factors Predicting Return to Work After Breast Cancer Treatment. Scand. J. Caring Sci. 2012, 27, 380–387. [Google Scholar] [CrossRef]
- Hodgson, K.; Hutchinson, A.; Wilson, C.; Nettelbeck, T. A Meta-Analysis of the Effects of Chemotherapy on Cognition in Patients with Cancer. Cancer Treat. Rev. 2013, 39, 297–304. [Google Scholar] [CrossRef]
- Eccleston, C. The attentional control of pain: Methodological and theoretical concerns. Pain 1995, 63, 3–10. [Google Scholar] [CrossRef]
- Morel, V.; Pickering, G. Impact de la douleur sur les processus cognitifs chez l’homme. Douleur Analgésie 2013, 26, 11–16. [Google Scholar] [CrossRef]
- Pickering, G.; Pereira, B.; Clère, F.; Sorel, M.; de Montgazon, G.; Navez, M.; Picard, P.; Roux, D.; Véronique, M.; Salimani, R.; et al. Cognitive Function in Older Patients with Postherpetic Neuralgia. Pain Pract. 2014, 14, E1–E7. [Google Scholar] [CrossRef] [PubMed]
- Sharpe, L.; Ianiello, M.; Dear, B.F.; Nicholson Perry, K.; Refshauge, K.; Nicholas, M.K. Is there a potential role for attention bias modification in pain patients? Results of 2 randomised, controlled trials. Pain 2012, 153, 722–731. [Google Scholar] [CrossRef] [PubMed]
- Solberg Nes, L.; Roach, A.R.; Segerstrom, S.C. Executive Functions, Self-Regulation, and Chronic Pain: A Review. Ann. Behav. Med. 2009, 37, 173–183. [Google Scholar] [CrossRef] [PubMed]
- Hansen, M.; Horjales-Araujo, E.; Dahl, J. Associations between Psychological Variables and Pain in Experimental Pain Models. A Systematic Review. Acta Anaesthesiol. Scand. 2015, 59, 1094–1102. [Google Scholar] [CrossRef] [PubMed]
- Struijs, S.; Lamers, F.; Spinhoven, P.; van der Does, W.; Penninx, B. The Predictive Specificity of Psychological Vulnerability Markers for the Course of Affective Disorders. J. Psychiatr. Res. 2018, 103, 10–17. [Google Scholar] [CrossRef]
- Hinrichs-Rocker, A.; Schulz, K.; Jarvinen, I.; Lefering, R.; Simanski, C.; Neugebauer, E.A. Psychosocial predictors and correlates for chronic post-surgical pain (CPSP)—A systematic review. Eur. J. Pain 2009, 13, 719–730. [Google Scholar] [CrossRef]
- Anderson, S.G.; Narayanan, R.P.; Malipatil, N.S.; Roberts, H.; Dunn, G.; Heald, A.H. Socioeconomic deprivation independently predicts painful diabetic neuropathy in type 2 diabetes. Exp. Clin. Endocrinol. Diabetes 2015, 123, 423–427. [Google Scholar] [CrossRef]
- Enel, P.; Retornaz, F.; Ravaux, I.; Jaureguiberry, J.P.; Philibert, P.; Allegre, T.; Chadapaud, S.; Cohen-Valensi, R.; Granet-Brunello, P.; VISAGE Study Group; et al. Factors associated with social deprivation among older persons living with HIV. AIDS Care 2019, 31, 809–815. [Google Scholar] [CrossRef]
- Bouhassira, D.; Attal, N.; Alchaar, H.; Boureau, F.; Brochet, B.; Bruxelle, J. Comparison of pain syndromes associated with nervous or somatic lesions and development of a new neuropathic pain diagnostic questionnaire (DN4). Pain 2005, 114, 29–36. [Google Scholar] [CrossRef]
- Reitan, R.M. Validity of the trail making test as an indicator of organic brain damage. Percept. Mot. Skills 1958, 8, 271–276. [Google Scholar] [CrossRef]
- Wagner, L.; Sweet, J.; Butt, Z.; Lai, J.; Cella, D. Measuring patient self-reported cognitive function: Development of the functional assessment of cancer therapy-cognitive function instrument. J. Support. Oncol. 2009, 7, W32–W39. [Google Scholar]
- Joly, F.; Lange, M.; Rigal, O.; Correia, H.; Giffard, B.; Beaumont, J.L.; Clisant, S.; Wagner, M. French version of the Functional Assessment of Cancer Therapy–Cognitive Function (FACT-Cog) version 3. Support. Care Cancer 2012, 20, 3297–3305. [Google Scholar] [CrossRef] [PubMed]
- Rey, A. L’examen Clinique en Psychologie; Presses Universitaires de France: Paris, France, 1964. [Google Scholar]
- Moradi, E.; Hallikainen, I.; Hänninen, T.; Tohka, J. Alzheimer’s Disease Neuroimaging Initiative. Rey’s Auditory Verbal Learning Test Scores Can Be Predicted from Whole Brain MRI in Alzheimer’s Disease. Neuroimage Clin. 2016, 13, 415–427. [Google Scholar] [CrossRef]
- Moss-Morris, R.; Weinman, J.; Petrie, K.; Horne, R.; Cameron, L.; Buick, D. The Revised Illness Perception Questionnaire (IPQ-R). Psychol. Health 2002, 17, 1–16. [Google Scholar] [CrossRef]
- Ashley, L.; Smith, A.; Keding, A.; Jones, H.; Velikova, G.; Wright, P. Psychometric Evaluation of the Revised Illness Perception Questionnaire (IPQ-R) in Cancer Patients: Confirmatory Factor Analysis and Rasch Analysis. J. Psychosom. Res. 2013, 75, 556–562. [Google Scholar] [CrossRef]
- Dempster, M.; McCorry, N.; Brennan, E.; Donnelly, M.; Liam Murray, L.; Johnston, B. Psychological distress among survivors of esophageal cancer: The role of illness cognitions and coping. Dis. Esophagus 2012, 25, 222–227. [Google Scholar] [CrossRef]
- Zigmond, A.S.; Snaith, R.P. The hospital anxiety and depression scale. Acta Psychiatr. Scand. 1983, 67, 361–370. [Google Scholar] [CrossRef]
- Cousson-Gélie, F.; Irachabal, S.; Bruchon-Schweitzer, M.; Dilhuydy, J.M.; Lakdja, F. Dimensions of cancer locus of control scale as predictors of psychological adjustment and survival in breast cancer patients. Psychol. Rep. 2005, 97, 699–711. [Google Scholar] [CrossRef]
- Pruyn, J.; Van Der Borne, H.; De Reuver, R.M.; De Boer, M.F.; Bosman, L.J.; Ter Pelkwijk, M.A. De locus of control-schaal voor kankerpatienten (The locus of control scale for cancer patients). Tijdschr. Voor Soc. Gezondheidszorj 1988, 66, 404–408. [Google Scholar]
- Aaronson, N.K.; Ahmedzai, S.; Bergman, B.; Bullinger, M.; Cull, A.; Duez, N.J.; Filiberti, A.; Flechtner, H.; Fleishman, S.B.; de Haes, J.C.J.M.; et al. The European Organization for Research and Treatment of Cancer QLQ-C30: A quality-of-life instrument for use in international clinical trials in oncology. J. Natl. Cancer Inst. 1993, 85, 365–376. [Google Scholar] [CrossRef] [PubMed]
- Fayers, P.M.; Aaronson, N.K.; Bjordal, K.; Groenvold, M.; Curran, D.; Bottomley, A.; On Behalf of the EORTC Quality of Life Group. The EORTC QLQ-C30 Scoring Manual, 3rd ed.; European Organisation for Research and Treatment of Cancer: Brussels, Belgium, 2001. [Google Scholar]
- Buysse, D.J.; Reynolds, C.F.; Monk, T.H.; Berman, S.R.; Kupfer, D.J. The Pittsburgh Sleep Quality Index: A new instrument for psychiatric practice and research. Psychiatr. Res. 1989, 28, 193–213. [Google Scholar] [CrossRef]
- Sass, C.; Moulin, J.-J.; Guéguen, R.; Abric, L.; Dauphinot, V.; Dupré, C. Le score Epices: Un score individuel de précarité. Construction du score et mesure des relations avec des données de santé, dans une population de 197 389 personnes. Bull. Épidémiologique Hebd. 2006, 14, 93–96. [Google Scholar]
- O’Brien, P.C. Procedures for comparing samples with multiple endpoints. Biometrics 1984, 40, 1079–1087. [Google Scholar] [CrossRef] [PubMed]
- Statistical Power Analysis for the Behavioral Sciences, 2nd ed.; Lawrence Erlbaum: Hillsdale, NJ, USA, 1988.
- Nagin, D.S.; Odgers, C.L. Group-based trajectory modeling in clinical research. Annu. Rev. Clin. Psychol. 2010, 6, 109–138. [Google Scholar] [CrossRef] [PubMed]
- Avis, N.; Levine, B.; Case, D.L.; Naftalis, E.; Van Zee, K.J. Trajectories of Depressive Symptoms Following Breast Cancer Diagnosis. Cancer Epidemiol. Biomarkers Prev. 2015, 24, 1789–1795. [Google Scholar] [CrossRef]
- Fontes, F.; Severo, M.; Gonçalves, M.; Pereira, S.; Lunet, N. Trajectories of sleep quality during the first three years after breast cancer diagnosis. Sleep Med. 2017, 34, 193–199. [Google Scholar] [CrossRef]
- Okamoto, A.; Yamasaki, M.; Yokota, I.; Mori, M.; Matsuda, M.; Yamaguchi, Y.; Yamakita, S.; Ueno, H.; Sawa, T.; Taguchi, T.; et al. Classification of acute pain trajectory after breast cancer surgery identifies patients at risk for persistent pain: A prospective observational study. J. Pain Res. 2018, 11, 2197–2206. [Google Scholar] [CrossRef]
- Juhl, A.A.; Christiansen, P.; Damsgaard, T.E. Persistent pain after breast cancer treatment: A questionnaire-based study on the prevalence, associated treatment variables, and pain type. J. Breast Can. 2016, 19, 447–454. [Google Scholar] [CrossRef]
- Andersen, K.G.; Kehlet, H. Persistent pain after breast cancer treatment: A critical review of risk factors and strategies for prevention. J. Pain 2011, 12, 725–746. [Google Scholar] [CrossRef]
- Leonhart, R.; Tang, L.; Pang, Y.; Li, J.; Song, L.; Fischer, I.; Koch, M.; Wuensch, A.; Fritzsche, K.; Schaefert, R. Physical and psychological correlates of high somatic symptom severity in Chinese breast cancer patients. Psycho Oncol. 2017, 26, 656–663. [Google Scholar] [CrossRef] [PubMed]
- Millar, K.; Purushotham, A.; McLatchie, E.; George, D.; Murray, G. 1-year prospective study of individual variation in distress, and illness perceptions, after treatment for breast cancer. J. Psychosom. Res. 2005, 58, 335–342. [Google Scholar] [CrossRef] [PubMed]
- Lee, Y.; Baek, J.M.; Jeon, Y.W.; Im, E.O. Illness Perception and Sense of Well-Being in Breast Cancer Patients. Patient Prefer. Adherence 2019, 13, 1557–1567. [Google Scholar] [CrossRef] [PubMed]
- Somerset, W.; Stout, S.; Miller, A.; Musselman, D. Breast Cancer and Depression. Oncol. (Williston Park) 2004, 18, 1021–1034. [Google Scholar]
- Tsaras, K.; Papathanasiou, I.; Mitsi, D.; Veneti, A.; Kelesi, M.; Zyga, S.; Fradelos, E. Assessment of Depression and Anxiety in Breast Cancer Patients: Prevalence and Associated Factors. Asian Pac. J. Cacner Prev. 2018, 19, 1661–1669. [Google Scholar]
- de Figueiredo Carvalho, S.; Pinheiro Bezerra, I.; Freitas, T.; da Silva Rodrigues, R.; Chaves de Carvalho, I.; Brasil, A.; Telésforo Celestino Júnior, F.; Bezerra Diniz, L.; Paz-Cox, A.; de Abreu, L. Prevalence of major depression in patients with breast cancer. J. Hum. Growth Dev. 2015, 25, 68–74. [Google Scholar] [CrossRef]
- Vahdaninia, M.; Omidvari, S.; Montazeri, A. What Do Predict Anxiety and Depression in Breast Cancer Patients? A Follow-Up Study. Soc. Psychiatr. Epidemiol. 2010, 45, 355–361. [Google Scholar] [CrossRef]
- Maass, S.; Roorda, C.; Berendsen, A.; Verhaak, P.; de Bock, G. The prevalence of long-term symptoms of depression and anxiety after breast cancer treatment: A systematic review. Maturitas 2015, 82, 100–108. [Google Scholar] [CrossRef]
- Gibek, K.; Sacha, T. Comparison of health locus of control in oncological and non-oncological patients. Contemp Oncol. (Pozn) 2019, 23, 115–120. [Google Scholar] [CrossRef]
- Hamood, R.; Hamood, H.; Merhasin, I.; Keinan-Boker, L. Chronic pain and other symptoms among breast cancer survivors: Prevalence, predictors, and effects on quality of life. Breast Cancer Res. Treat. 2018, 167, 157–169. [Google Scholar] [CrossRef]
- Boyko, E. Observational Research—Opportunities and Limitations. J. Diabetes Complicat. 2013, 27, 642–648. [Google Scholar] [CrossRef] [PubMed]


| n (%) | |
|---|---|
| Age (mean ± SD) | 59.3 ± 10.7 |
| Stages * | |
| I | 19 (23.6) |
| II | 44 (50.6) |
| III | 7 (11.2) |
| IV | 3 (3.4) |
| Living environment | |
| Rural | 43 (49) |
| Urban | 27 (31) |
| Semi-urban | 18 (20) |
| Activity | |
| Inactive | 71 (80) |
| Active | 18 (20) |
| Education | |
| Low | 5 (5) |
| Medium | 62 (70) |
| High | 22 (25) |
| Medical history | |
| Locomotor/Rheumatologic | 7 (8) |
| Neurological/Psychiatric | 4 (5) |
| Gynecology | 4 (5) |
| Cardiovascular | 2 (2) |
| ORL | 1 (1) |
| Dermatology | 1 (1) |
| Allergy | 1 (1) |
| Concomitant treatments at baseline (n treatment/n patient (%)) | |
| Antidepressants | 10/9 (10) |
| Anxiolytics | 9/8 (9) |
| Hypnotics | 4/4 (5) |
| Weak opiate | 3/3 (3) |
| Paracetamol-NSAIDs | 2/2 (2) |
| Antipsychotics | 1/1 (1) |
| Coanalgesics | 1/1 (1) |
| Therapeutic intervention on the year | |
| Surgery | 111 (41) |
| Radiotherapy | 68 (25) |
| Hormone therapy | 57 (21) |
| Chemotherapy | 30 (11) |
| Target therapy | 7 (3) |
© 2020 by the authors. Licensee MDPI, Basel, Switzerland. This article is an open access article distributed under the terms and conditions of the Creative Commons Attribution (CC BY) license (http://creativecommons.org/licenses/by/4.0/).
Share and Cite
Voute, M.; Morel, V.; Joly, D.; Villatte, C.; Martin, E.; Durando, X.; Pereira, B.; Pickering, G. Predicting Pain Trajectories in the One Year Following Breast Cancer Diagnosis—An Observational Study. J. Clin. Med. 2020, 9, 1907. https://doi.org/10.3390/jcm9061907
Voute M, Morel V, Joly D, Villatte C, Martin E, Durando X, Pereira B, Pickering G. Predicting Pain Trajectories in the One Year Following Breast Cancer Diagnosis—An Observational Study. Journal of Clinical Medicine. 2020; 9(6):1907. https://doi.org/10.3390/jcm9061907
Chicago/Turabian StyleVoute, Marion, Véronique Morel, Dominique Joly, Christine Villatte, Elodie Martin, Xavier Durando, Bruno Pereira, and Gisèle Pickering. 2020. "Predicting Pain Trajectories in the One Year Following Breast Cancer Diagnosis—An Observational Study" Journal of Clinical Medicine 9, no. 6: 1907. https://doi.org/10.3390/jcm9061907
APA StyleVoute, M., Morel, V., Joly, D., Villatte, C., Martin, E., Durando, X., Pereira, B., & Pickering, G. (2020). Predicting Pain Trajectories in the One Year Following Breast Cancer Diagnosis—An Observational Study. Journal of Clinical Medicine, 9(6), 1907. https://doi.org/10.3390/jcm9061907