Widespread Introduction of a High-Sensitivity Troponin Assay: Assessing the Impact on Patients and Health Services

 , and
, and
Abstract
1. Introduction
2. Experimental Section
2.1. Study Design and Setting
2.2. Participants
2.3. Intervention
2.4. Measurements
2.5. Outcomes
2.6. Data Analysis
3. Results
4. Discussion
5. Conclusions
Author Contributions
Funding
Conflicts of Interest
Appendix A. Endpoint Codes
Appendix B

| Site Number | Number of Patients | Pre-Intervention | Post-Intervention | Difference (95% CI) |
|---|---|---|---|---|
| 1 | 6475 | 8.7 (5.1–41.8) | 8.2 (5.2–48.5) | −0.4 (−1.0 to 0.1) |
| 2 | 10,598 | 16.6 (4.9–46.9) | 12.2 (5.4–41.6) | −4.4 (−6.0 to −2.9) |
| 3 | 2022 | 22.0 (6.7–98.0) | 7.6 (4.7–25.8) | −14.4 (−18.8 to −10.0) |
| 4 | 8096 | 11.4 (6.8–43.5) | 8.7 (5.9–33.3) | −2.7 (−3.3 to −2.1) |
| 5 | 6946 | 21.2 (5.1–71.8) | 21.6 (5.6–69.2) | 0.4 (−2.0 to 2.7) |
| 6 | 5020 | 13.7 (5.0–33.2) | 7.8 (5.2–28.2) | −5.9 (−7.4 to −4.5) |
| 7 | 6559 | 9.6 (5.3–28.8) | 7.9 (5.0–28.5) | −1.6 (−2.3 to −1.0) |
| 8 | 6390 | 11.0 (4.2–26.6) | 6.8 (4.5–25.6) | −4.2 (−5.4 to −3.1) |
| 9 | 11,339 | 11.7 (5.5–51.8) | 9.9 (5.2–50.0) | −1.8 (−3.1 to −0.6) |
| 10 | 4138 | 12.0 (4.3–38.8) | 9.3 (4.8–32.4) | −2.7 (−4.6 to −0.8) |
| 11 | 6151 | 6.8 (3.8–42.0) | 6.7 (4.8–27.8) | −0.1 (−0.6 to 0.4) |
| 12 * | 5956 | 9.3 (5.0–33.0) | 9.5 (4.9–42.5) | 0.2 (−0.7 to 1.2) |
| 13 * | 7583 | 10.9 (4.3–47.0) | 9.5 (4.6–47.0) | −1.4 (−3.2 to 0.3) |
| 14 * | 1244 | 6.9 (3.3–29.1) | 6.9 (3.5–31.1) | 0.1 (−1.7 to 1.8) |
| 15 * | 6958 | 9.4 (5.8–39.2) | 8.3 (5.5–45.9) | −1.1 (−1.6 to −0.6) |
| 16 * | 4643 | 14.5 (5.1–62.0) | 10.8 (5.2–47.9) | −3.8 (−5.8 to −1.8) |
| 17 * | 2765 | 9.2 (4.5–24.7) | 7.6 (4.4–22.6) | −1.7 (−2.9 to −0.5) |
| 18 * | 6159 | 8.6 (5.2–36.2) | 6.9 (5.1–41.7) | −1.6 (−1.9 to −1.3) |
| 19 * | 3944 | 15.0 (5.8–62.1) | 12.2 (5.1–61.3) | −2.8 (−5.6 to −0.2) |
| 20 * | 4754 | 19.3 (5.3–79.9) | 19.5 (5.1–79.2) | 0.2 (−2.1 to 2.5) |
| 21 * | 6617 | 13.0 (4.9–45.0) | 15.2 (5.4–45.7) | 2.3 (0.2 to 4.3) |
References
- Nawar, E.W.; Niska, R.W.; Xu, J. National hospital ambulatory medical care survey: 2005 emergency department summary. Adv. Data 2007, 389, 1–32. [Google Scholar]
- Anderson, J.L.; Morrow, D.A. Acute Myocardial Infarction. N. Engl. J. Med. 2017, 376, 2053–2064. [Google Scholar] [CrossRef] [PubMed]
- Cullen, L.; Greenslade, J.H.; Merollini, K.; Graves, N.; Hammett, C.J.; Hawkins, T.; Than, M.; Brown, A.F.T.; Huang, C.B.; Panahi, S.E.; et al. Cost and outcomes of assessing patients with chest pain in an Australian Emergency Department. Med. J. Aust. 2015, 202, 427–432. [Google Scholar] [CrossRef] [PubMed]
- Thygesen, S.K.; Alpert, S.J.; Jaffe, R.A.; Chaitman, J.B.; Bax, A.J.; Morrow, D.D.; White, X.H.; Chettibi, J.M.; Hayrapetyan, K.H.; Roithinger, E.F.; et al. Fourth universal definition of myocardial infarction (2018). Circulation 2018, 138, e618–e651. [Google Scholar] [CrossRef] [PubMed]
- Apple, F.S.; Collinson, P.O. Analytical characteristics of high-sensitivity cardiac troponin assays. Clin. Chem. 2012, 58, 54–61. [Google Scholar] [CrossRef] [PubMed]
- Thygesen, K.; Mair, J.; Giannitsis, E.; Mueller, C.; Lindahl, B.; Blankenberg, S.; Huber, K.; Plebani, M.; Biasucci, L.M.; Tubaro, M.; et al. How to use high-sensitivity cardiac troponins in acute cardiac care. Eur. Heart J. 2012, 33, 2252–2257. [Google Scholar] [CrossRef] [PubMed]
- Chew, D.P.; Scott, I.A.; Cullen, L.; French, J.K.; Briffa, T.G.; Tideman, P.A.; Woodruffe, S.; Kerr, A.; Branagan, M.; Aylward, P.E.; et al. National Heart Foundation of Australia and Cardiac Society of Australia and New Zealand: Australian clinical guidelines for the management of Acute Coronary Syndromes 2016. Heart Lung Circ. 2016, 25, 895–951. [Google Scholar] [CrossRef] [PubMed]
- Roffi, M.; Patrono, C.; Collet, J.P.; Mueller, C.; Valgimigli, M.; Andreotti, F.; Bax, J.J.; Borger, M.A.; Brotons, C.; Chew, D.P.; et al. 2015 ESC Guidelines for the management of acute coronary syndromes in patients presenting without persistent ST-segment elevation: Task force for the management of Acute Coronary Syndromes in patients presenting without persistent ST-segment elevation of the European Society of Cardiology (ESC). Eur. Heart J. 2016, 37, 267–315. [Google Scholar] [PubMed]
- Shah, A.S.V.; Anand, A.; Strachan, F.E.; Ferry, A.V.; Lee, K.K.; Chapman, A.R.; Sandeman, D.; Stables, C.L.; Adamson, P.D.; Andrews, J.P.M.; et al. High-sensitivity troponin in the evaluation of patients with suspected acute coronary syndrome: A stepped-wedge, cluster-randomised controlled trial. Lancet 2018, 392, 919–928. [Google Scholar] [CrossRef]
- Twerenbold, R.; Jaeger, C.; Rubini Gimenez, M.; Wildi, K.; Reichlin, T.; Nestelberger, T.; Boeddinghaus, J.; Grimm, K.; Puelacher, C.; Moehring, B.; et al. Impact of high-sensitivity cardiac troponin on use of coronary angiography, cardiac stress testing, and time to discharge in suspected acute myocardial infarction. Eur. Heart J. 2016, 37, 3324–3332. [Google Scholar] [CrossRef] [PubMed]
- Doust, J.; Glasziou, P. High-sensitivity troponin highlights the need for new methods to evaluate diagnostic tests. Circ. Cardiovasc. Qual. Outcomes 2018, 11, e004468. [Google Scholar] [CrossRef] [PubMed]
- Agewall, S.; Giannitsis, E.; Jernberg, T.; Katus, H. Troponin elevation in coronary vs. non-coronary disease. Eur. Heart J. 2011, 32, 404–411. [Google Scholar] [CrossRef] [PubMed]
- Bandstein, N.; Wikman, A.; Ljung, R.; Holzmann, M.J. Survival and resource utilization in patients with chest pain evaluated with cardiac troponin T compared with high-sensitivity cardiac troponin T. Int. J. Cardiol. 2017, 245, 43–48. [Google Scholar] [CrossRef] [PubMed]
- Queensland Health. The Health of Queenslanders 2018. Report of the Chief Health Officer Queensland; Queensland Government: Brisbane, Australia, 2018.
- Australian Institute of Health and Welfare. Emergency Department Care 2017–2018: Australian Hospital Statistics; Health Services Series No. 89. Cat No. HSE 216; AIHW: Canberra, Australia, 2018.
- Analytical Characteristics of Commercial Cardiac Troponin I and T Assays Declared by the Manufacturer. Available online: http://www.ifcc.org/media/276661/IFCC%20Troponin%20Tables%20ng_L%20DRAFT%20Update%20NOVEMBER%202014.pdf (accessed on 3 February 2020).
- High Sensitivity Cardiac Troponin I and T Assay Analytical Characteristics Designed by Manufacturer. Available online: http://www.ifcc.org/media/477656/high-sensitivity-cardiac-troponin-i-and-t-assay-analytical-characteristics-designated-by-manufacturer-v012019.pdf (accessed on 3 February 2020).
- Cullen, L.; Greenslade, J.; Hawkins, T.; Hammett, C.; O'Kane, S.; Ryan, K.; Parker, K.; Schluter, J.; Dalton, E.; Brown, A.F.; et al. IMProved assessment of chest pain trial (IMPACT): An intervention study of a new accelerated protocol for patients with possible acute coronary syndrome. Med. J. Aust. 2017, 207, 195–200. [Google Scholar] [CrossRef] [PubMed]
- Greenslade, J.H.; Ho, A.; Hawkins, T.; Parsonage, W.; Crilly, J.; Cullen, L. Examining the translational success of an initiative to accelerate the assessment of chest pain for patients in an Australian emergency department: A pre-post study. BMC Health Serv. Res. 2020, 20, 419. [Google Scholar] [CrossRef] [PubMed]
- CCEMG-EPPI-Centre Cost Converter. Available online: http://eppi.ioe.ac.uk/costconversion/default.aspx (accessed on 31 January 2020).
- Odqvist, M.; Andersson, P.O.; Tygesen, H.; Eggers, K.M.; Holzmann, M.J. High-sensitivity troponins and outcomes after myocardial infarction. J. Am. Coll. Cardiol. 2018, 71, 2616–2624. [Google Scholar] [CrossRef] [PubMed]
- Sullivan, C.; Staib, A.; Khanna, S.; Good, N.M.; Boyle, J.; Cattell, R.; Heiniger, L.; Griffin, B.R.; Bell, A.; Scott, I.A. The National Emergency Access Target (NEAT) and the 4-hour rule: Time to review the target. Med. J. Aust. 2016, 204, 354. [Google Scholar] [CrossRef] [PubMed]
- Than, M.P.; Pickering, J.W.; Dryden, J.M.; Lord, S.J.; Aitken, S.A.; Aldous, S.J.; Allan, K.E.; Ardagh, M.W.; Bonning, J.W.N.; Callender, R.; et al. ICare-ACS (Improving care processes for patients with suspected Acute Coronary Syndrome): A study of cross-system implementation of a national clinical pathway. Circulation 2018, 137, 354–363. [Google Scholar] [CrossRef] [PubMed]
- Eggers, K.M.; Lindahl, B.; Melki, D.; Jernberg, T. Consequences of implementing a cardiac troponin assay with improved sensitivity at Swedish coronary care units: An analysis from the SWEDEHEART registry. Eur. Heart J. 2016, 37, 2417–2424. [Google Scholar] [CrossRef] [PubMed]
- Bandstein, N.; Ljung, R.; Lundback, M.; Johansson, M.; Holzmann, M.J. Trends in admissions for chest pain after the introduction of high-sensitivity cardiac troponin T. Int. J. Cardiol. 2017, 240, 1–7. [Google Scholar] [CrossRef] [PubMed]


| Pre-Implementation (n = 63,335) | Post-Implementation (n = 61,022) | |
|---|---|---|
| Mean age (SD) | 61.0 (18.5) | 59.6 (18.4) |
| Male sex, n (%) | 32,287 (51.0%) | 31,104 (51.0%) |
| Triage category, n (%) | ||
| 1—Immediate assessment and treatment | 1325 (2.1%) | 1204 (2.0%) |
| 2—Assessment and treatment within 10 min | 36,310 (57.3%) | 36,205 (59.3%) |
| 3—Assessment and treatment start within 30 min | 23,347 (36.9%) | 21,314 (34.9%) |
| 4—Assessment and treatment start within 60 min | 2289 (3.6%) | 2229 (3.7%) |
| 5—Assessment and treatment start within 120 min | 63 (0.1%) | 70 (0.1%) |
| Arrival by ambulance, n (%) | 39,144 (61.8%) | 37,419 (61.3%) |
| Pre-Implementation | Post-Implementation | Difference (95% CI) | Adjusted Difference * (95% CI) | |
|---|---|---|---|---|
| Overall Cohort | n= 63,335 | n= 61,022 | ||
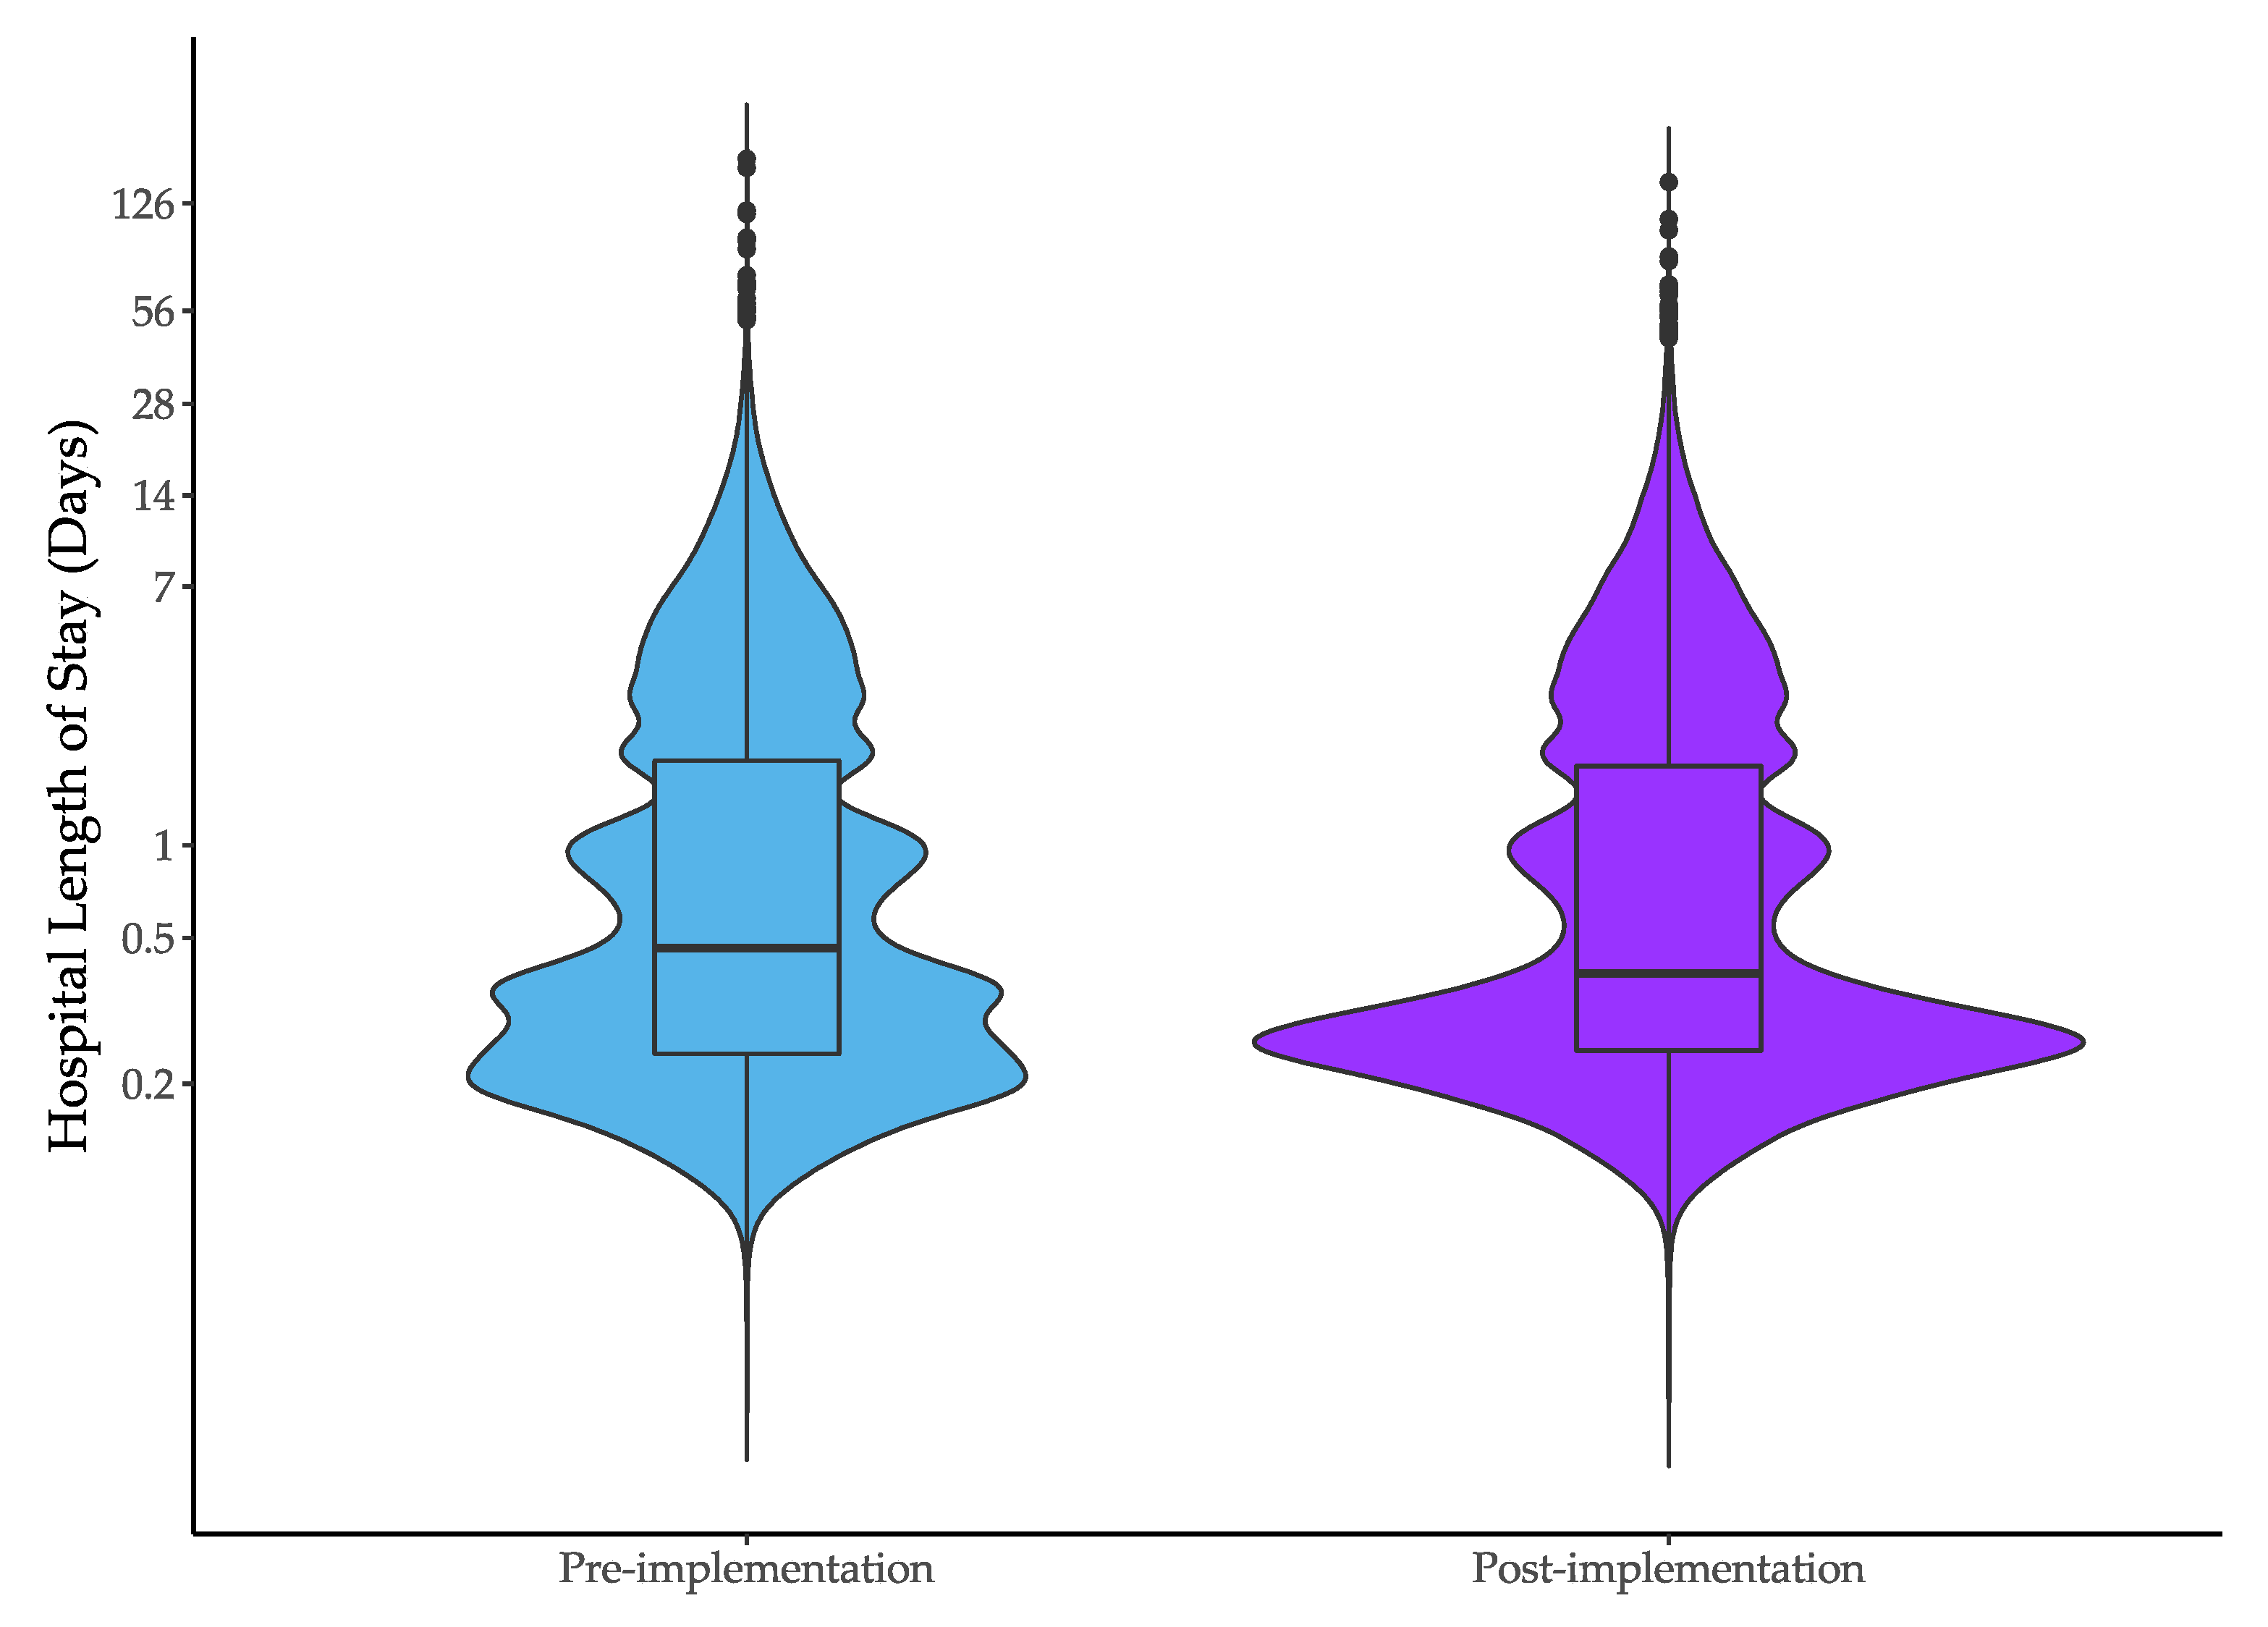
| Median hospital length of stay (IQR), hours | 11.1 (5.0 to 45.4) | 9.1 (5.1 to 43.7) | −1.9 (−2.9 to −1.0) | −0.7 (−1.3 to −0.1) |
| Median ED length of stay (IQR), hours | 4.0 (2.9 to 6.0) | 4.0 (2.8–6.0) | 0.0 (−0.1 to 0.2) | 0.0 (−0.1 to 0.2) |
| Median hospital length of stay for patients managed in ED or short stay units (IQR), hours | 8.6 (4.6–25.6) | 7.4 (4.9–25.7) | −1.2 (−1.6 to −0.8) | −0.7 (−1.1 to −0.2) |
| Females | n= 31,048 | n= 29,913 | ||
| Median hospital length of stay (IQR), hours | 10.0 (4.9 to 38.8) | 8.5 (5.1 to 38.1) | −1.5 (−2.3 to −0.8) | −0.3 (−1.1 to 0.4) |
| Males | n= 32,287 | n= 31,104 | ||
| Median hospital length of stay (IQR), hours | 12.4 (5.1 to 50.2) | 10.1 (5.1 to 47.7) | −2.3 (−3.5 to −1.2) | −1.1 (−1.7 to −0.6) |
| Pre-Implementation | Post-Implementation | Difference (95% CI) | Adjusted Difference * (95% CI) | |
|---|---|---|---|---|
| Overall cohort | n= 63,335 | n= 61,022 | ||
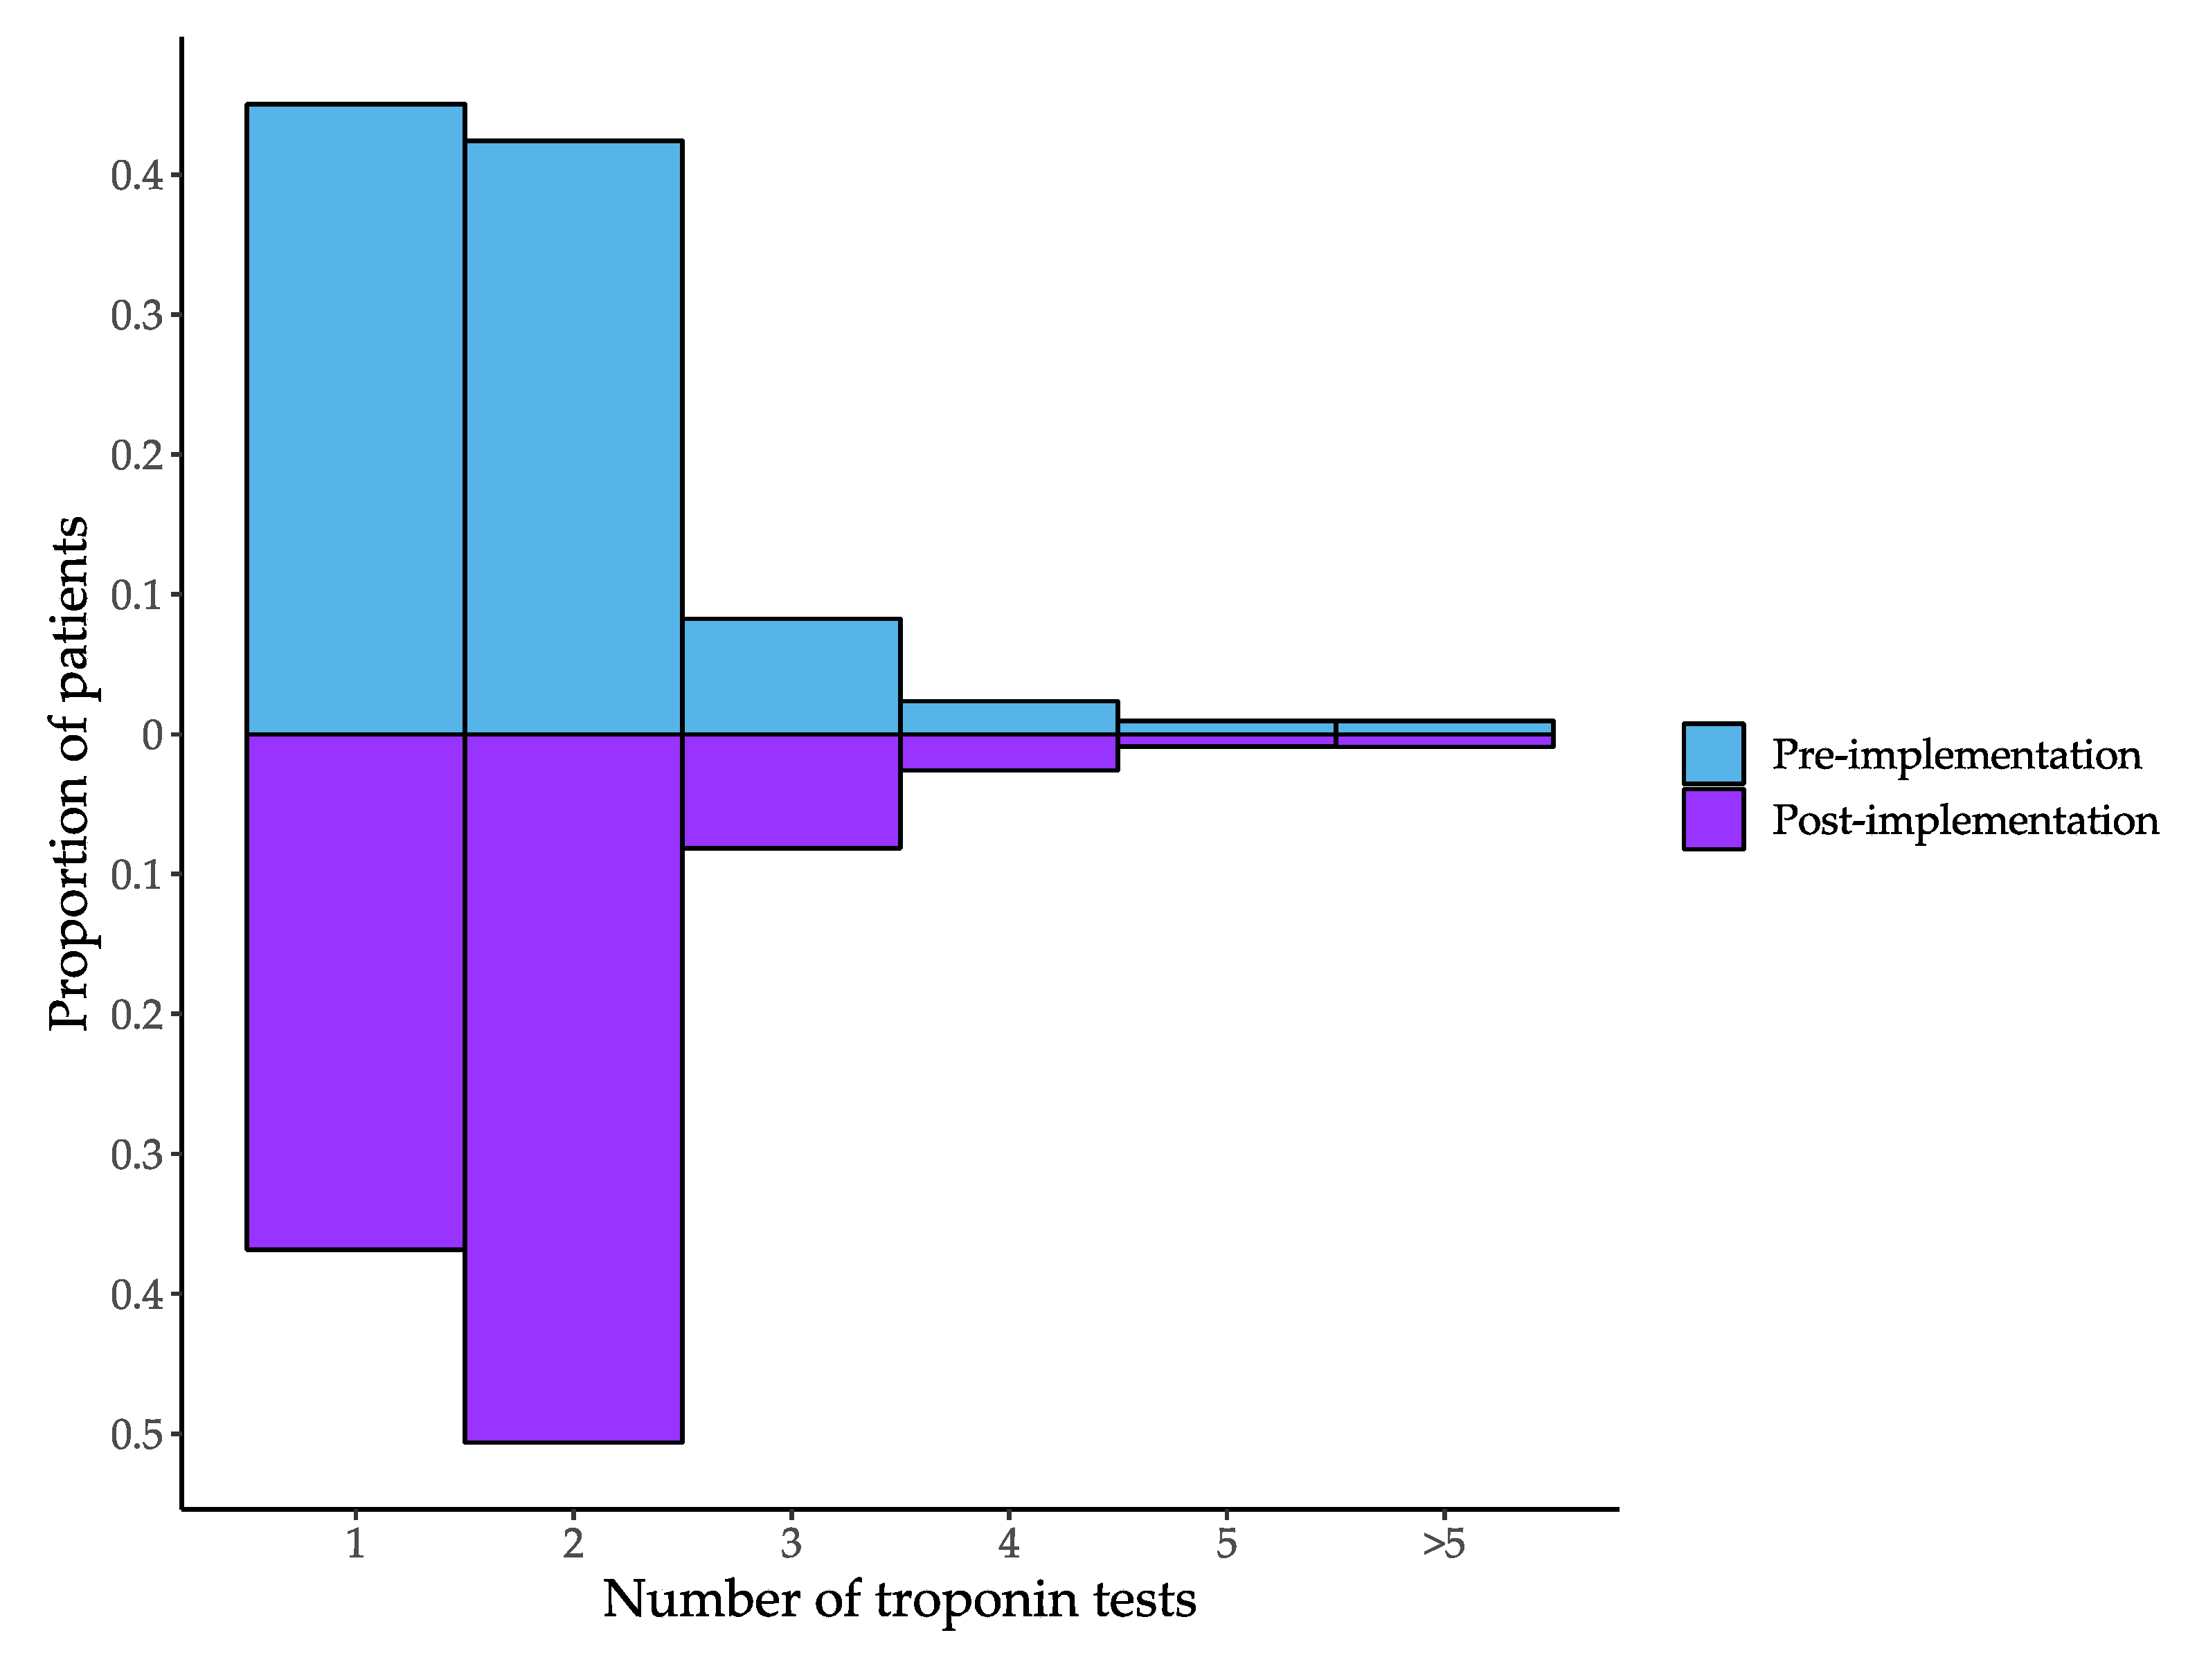
| Single troponin within 48 h | 29,553 (46.7%) | 22,958 (37.6%) | −9.0% (−10.9 to −7.2%) | −7.4 (−9.4 to −5.4%) |
| Presentation Troponin >99th percentile | 6970 (11.0%) | 11,374 (18.7%) | 7.6 (7.0 to 8.3%) | 6.7% (5.8 to 7.6%) |
| Any troponin within 12 h > 99th percentile | 7919 (12.5%) | 12,735 (20.9%) | 8.4% (7.7 to 9.0%) | 7.5% (6.6 to 8.4%) |
| Females | n= 31,048 | n= 29,913 | ||
| Single troponin within 48 h | 14,948 (48.1%) | 11,252 (37.6%) | −10.5% (−12.6 to −8.4%) | −9.4% (−11.8 to −7.0%) |
| Presentation Troponin > 99th percentile | 2716 (8.8%) | 6099 (20.4%) | 11.6% (10.7 to 12.6%) | 10.7 (9.7 to 11.8%) |
| Any troponin within 12 h > 99th percentile | 3120 (10.1%) | 6711 (22.5%) | 12.4% (11.5−13.3%) | 11.3% (10.3 to 12.2%) |
| Males | n= 32,287 | n= 31,104 | ||
| Single troponin within 48 h | 14,605 (45.2%) | 11,702 (37.6%) | −7.6% (−9.3 to −5.9%) | −5.5% (−7.8 to −3.2%) |
| Presentation Troponin > 99th percentile | 4254 (13.2%) | 5275 (17.0%) | 3.8% (3.0 to 4.5%) | 2.7% (1.6 to 3.8%) |
| Any troponin within 12 h > 99th percentile | 4799 (14.9%) | 6021 (19.4%) | 4.5% (3.8 to 5.2%) | 3.6% (2.4 to 4.9%) |
| Pre-Implementation | Post-Implementation | Difference (95% CI) | Adjusted Difference * (95% CI) | |
|---|---|---|---|---|
| Overall cohort | n= 63,335 | n= 61,022 | ||
| ED diagnosis of AMI | 685 (1.1%) | 899 (1.5%) | 0.4% (0.1 to 0.7%) | 0.0% (−0.2 to 0.3%) |
| Hospital diagnosis of AMI | 3328 (5.3%) | 3232 (5.3%) | 0.0% (−0.2 to 0.3%) | 0.0% (−0.3 to 0.4%) |
| Admission to cardiology ward | 4283 (6.8%) | 3498 (5.7%) | −1.0% (−1.8 to −0.3) | 0.0% (−0.8 to 0.8%) |
| Invasive cardiac procedures | 2540 (4.0%) | 2391 (3.9%) | −0.1% (−0.3 to 0.1%) | 0.3% (−0.1 to 0.7%) |
| Females | n= 31,048 | n= 29,913 | ||
| ED diagnosis of AMI | 225 (0.7%) | 350 (1.2%) | 0.4% (0.1 to 0.8%) | 0.1% (−0.1 to 0.3%) |
| Hospital diagnosis of AMI | 1272 (4.1%) | 1257 (4.2%) | 0.1% (−0.3 to 0.5%) | 0.4% (−0.1 to 0.8%) |
| Admission to cardiology ward | 1662 (5.4%) | 1378 (4.6%) | −0.7% (−1.5 to −0.0%) | 0.2% (−0.9 to 1.2%) |
| Invasive cardiac procedures | 861 (2.8%) | 784 (2.6%) | −0.2% (−0.5 to 0.2%) | 0.4% (−0.1 to 0.9%) |
| Males | n= 32,287 | n= 31,104 | ||
| ED diagnosis of AMI | 460 (1.4%) | 549 (1.8%) | 0.3% (0.0 to 0.7%) | −0.1% (−0.5 to 0.3%) |
| Hospital diagnosis of AMI | 2056 (6.4%) | 1975 (6.4%) | 0.0% (−0.4 to 0.4%) | −0.4% (−1.1 to 0.3%) |
| Admission to cardiology ward | 2621 (8.1%) | 2120 (6.8%) | −1.3% (−2.0 to −0.6) | −0.2% (−1.0 to 0.7%) |
| Invasive cardiac procedures | 1679 (5.2%) | 1607 (5.2%) | 0.0% (−0.3 to 0.3%) | 0.1% (−0.6 to 0.8%) |
© 2020 by the authors. Licensee MDPI, Basel, Switzerland. This article is an open access article distributed under the terms and conditions of the Creative Commons Attribution (CC BY) license (http://creativecommons.org/licenses/by/4.0/).
Share and Cite
Greenslade, J.H.; Parsonage, W.; Foran, L.; McCormack, L.; Ashover, S.; Milburn, T.; Berndt, S.; Than, M.; Brain, D.; Cullen, L. Widespread Introduction of a High-Sensitivity Troponin Assay: Assessing the Impact on Patients and Health Services. J. Clin. Med. 2020, 9, 1883. https://doi.org/10.3390/jcm9061883
Greenslade JH, Parsonage W, Foran L, McCormack L, Ashover S, Milburn T, Berndt S, Than M, Brain D, Cullen L. Widespread Introduction of a High-Sensitivity Troponin Assay: Assessing the Impact on Patients and Health Services. Journal of Clinical Medicine. 2020; 9(6):1883. https://doi.org/10.3390/jcm9061883
Chicago/Turabian StyleGreenslade, Jaimi H., William Parsonage, Laura Foran, Louise McCormack, Sarah Ashover, Tanya Milburn, Sara Berndt, Martin Than, David Brain, and Louise Cullen. 2020. "Widespread Introduction of a High-Sensitivity Troponin Assay: Assessing the Impact on Patients and Health Services" Journal of Clinical Medicine 9, no. 6: 1883. https://doi.org/10.3390/jcm9061883
APA StyleGreenslade, J. H., Parsonage, W., Foran, L., McCormack, L., Ashover, S., Milburn, T., Berndt, S., Than, M., Brain, D., & Cullen, L. (2020). Widespread Introduction of a High-Sensitivity Troponin Assay: Assessing the Impact on Patients and Health Services. Journal of Clinical Medicine, 9(6), 1883. https://doi.org/10.3390/jcm9061883