The Enemy Which Sealed the World: Effects of COVID-19 Diffusion on the Psychological State of the Italian Population


Abstract
1. Introduction
2. Methods
2.1. Study Design and Participants
2.2. Ethical Standards
3. Outcomes
3.1. Demographic Questionnaire and COVID Related Information
3.2. Symptom Checklist-90 (SCL-90)
3.3. State-Trait Anxiety Inventory (STAI-Y)
3.4. Mood Scales
3.5. Impact of Event Scale- Revised(IES-R)
3.6. Statistical Analysis
4. Results
4.1. The Difference in Psychological Outcomes between North, Central, and South Italy
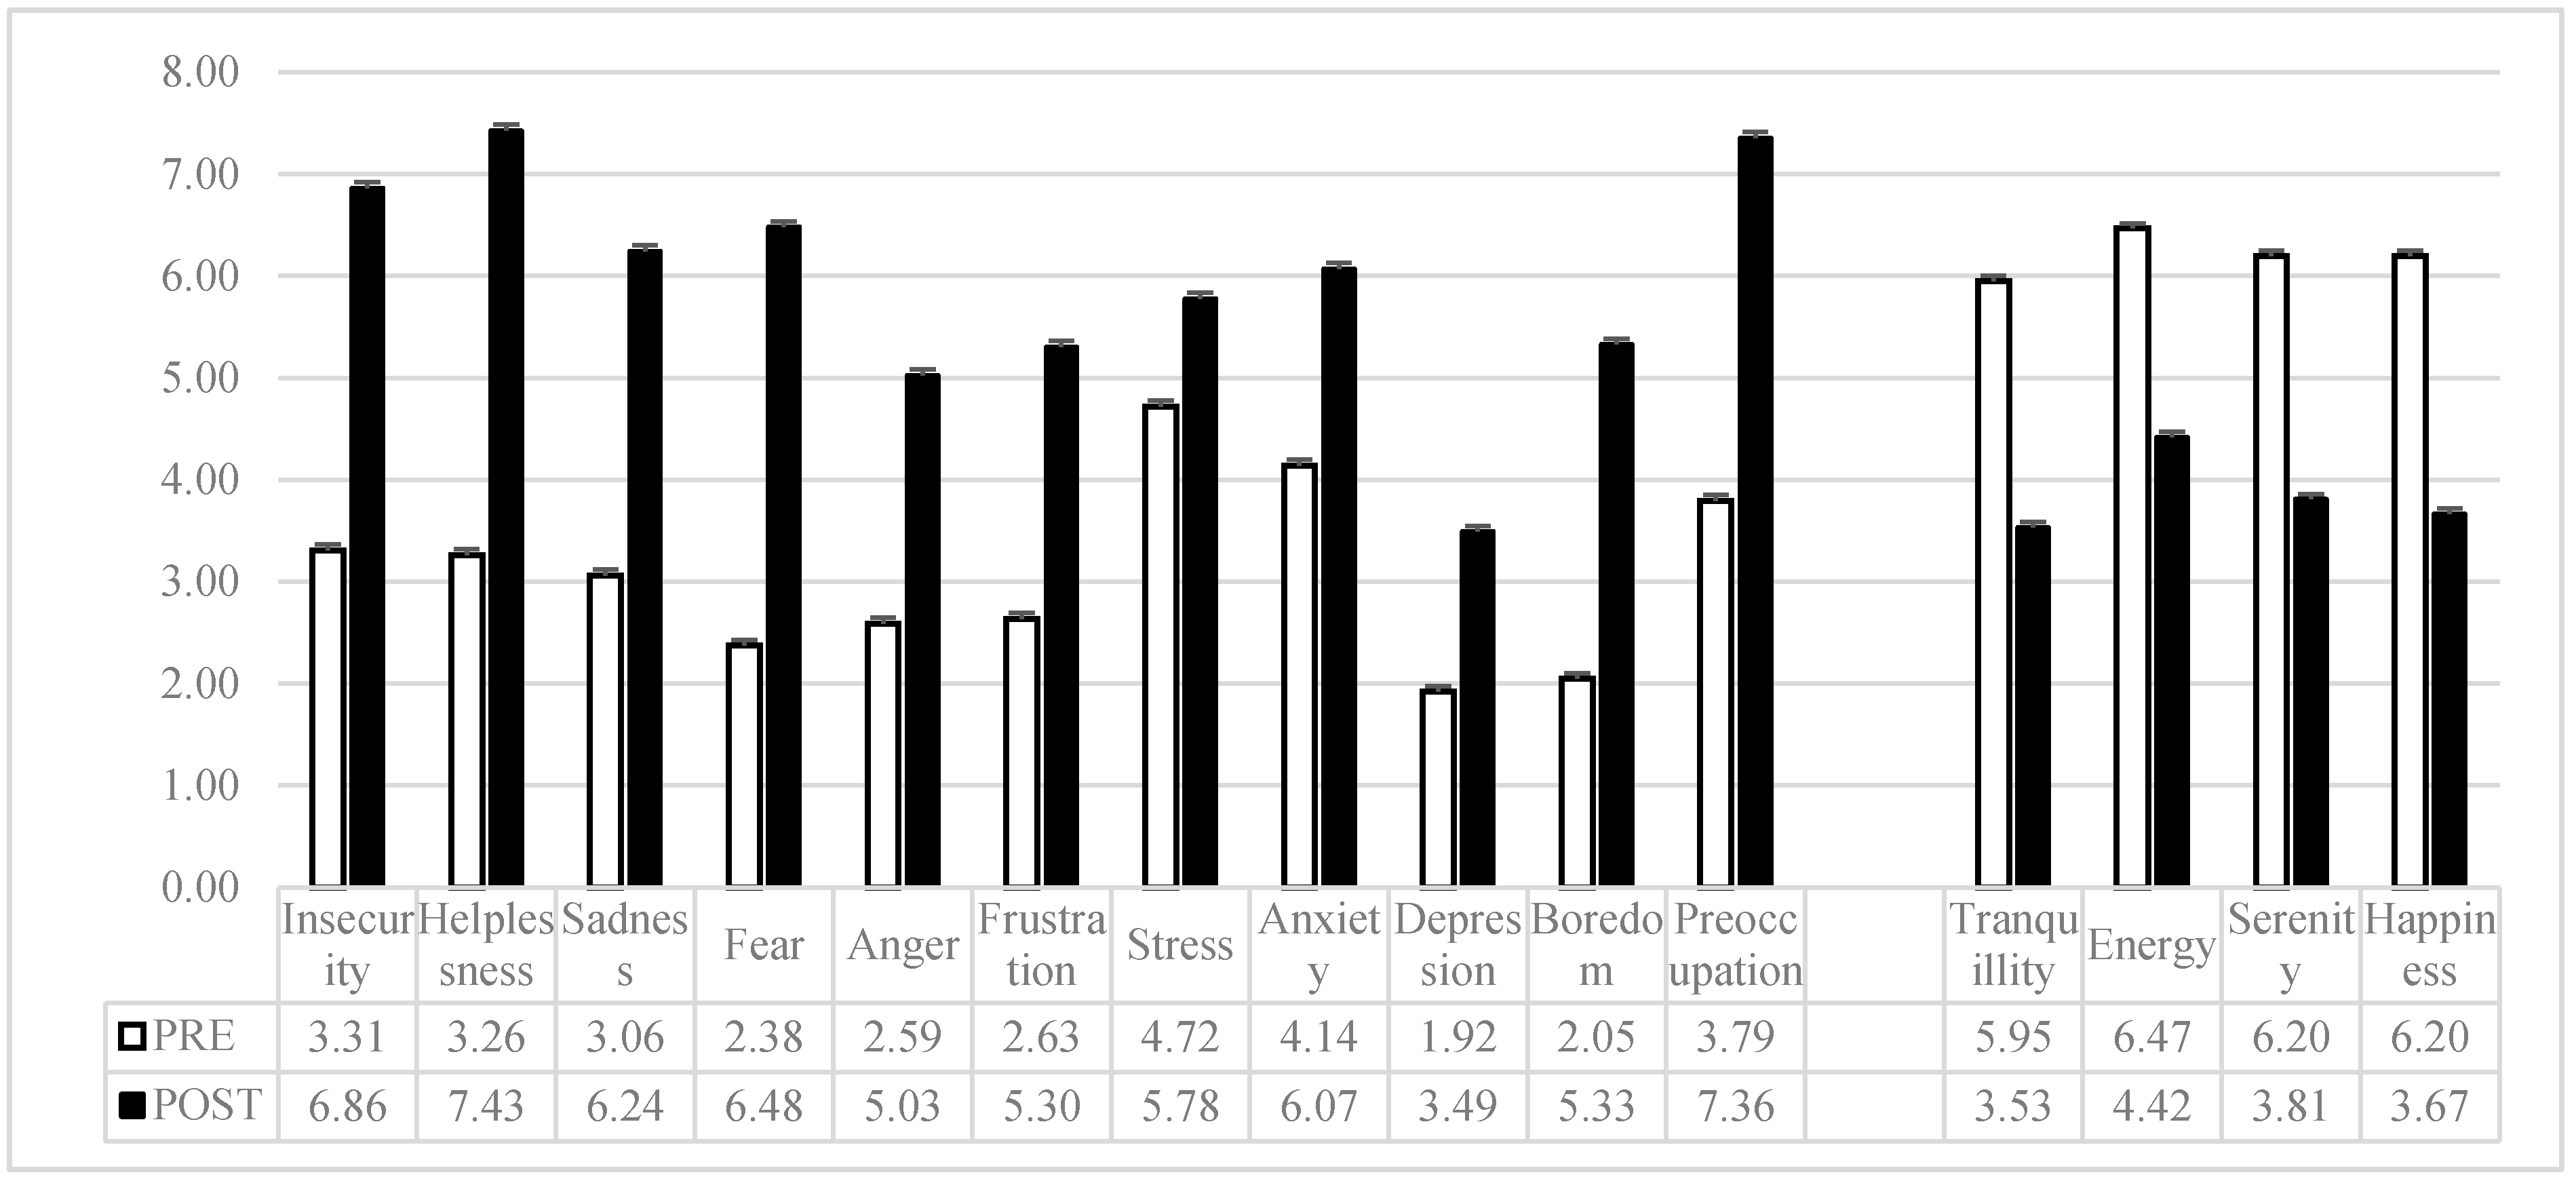
4.2. The Impact of the COVID-19 Emergency on Self-Reported Mood
4.3. Prevalence and Risk Factors of Psychological Distress during the COVID-19 Pandemic
5. Discussion
Author Contributions
Funding
Acknowledgments
Conflicts of Interest
References
- World Health Organization. Coronavirus Disease (COVID-2019) Situation Reports. Available online: https://www.who.int/emergencies/diseases/novel-coronavirus-2019/situation-reports/ (accessed on 8 April 2020).
- Istituto Superiore di Sanità. Epicentro. Coronavirus. Available online: https://www.epicentro.iss.it/coronavirus/ (accessed on 8 April 2020).
- Brooks, S.K.; Webster, R.K.; Smith, L.E. The psychological impact of quarantine and how to reduce it: Rapid review of the evidence. Lancet 2020, 395, 912–920. [Google Scholar] [CrossRef]
- Hossain, M.M.; Sultana, A.; Purohit, N. Mental health outcomes of quarantine and isolation for infection prevention: A systematic umbrella review of the global evidence. Epidemiol. Health 2020, e2020038. Available online: https://papers.ssrn.com/sol3/papers.cfm?abstract_id=3561265 (accessed on 8 April 2020). [CrossRef]
- Yu, H.; Li, M.; Li, Z.; Xiang, W.; Yuan, Y.; Liu, Y.; Li, Z.; Xiong, Z. Coping Style, Social Support and Psychological Distress in the General Chinese Population in the Early Stages of the COVID-2019 Epidemic. SSRN Electron. J. 2020. [Google Scholar] [CrossRef]
- Cao, W.; Fang, Z.; Hou, G.; Han, M.; Xu, X.; Dong, J.; Zheng, J. The psychological impact of the COVID-19 epidemic on college students in China. Psychiatry Res. Neuroimaging 2020, 287, 112934. [Google Scholar] [CrossRef] [PubMed]
- Sun, L.; Sun, Z.; Wu, L.; Zhu, Z.; Zhang, F.; Shang, Z.; Jia, Y.; Gu, J.; Zhou, Y.; Wang, Y.; et al. Prevalence and Risk Factors of Acute Posttraumatic Stress Symptoms during the COVID-19 Outbreak in Wuhan, China. MedRxiv 2020. [Google Scholar] [CrossRef]
- Huang, Y.; Zhao, N. Generalized anxiety disorder, depressive symptoms and sleep quality during COVID-19 epidemic in China: A web-based cross-sectional survey. Psychiatry Res. 2020, 288, 112954. [Google Scholar] [CrossRef]
- Lai, J.; Ma, S.; Wang, Y.; Cai, Z.; Hu, J.; Wei, N.; Wu, J.; Du, H.; Chen, T.; Li, R.; et al. Factors Associated With Mental Health Outcomes Among Health Care Workers Exposed to Coronavirus Disease 2019. JAMA Netw. Open 2020, 3, e203976. [Google Scholar] [CrossRef]
- Derogatis, L.R.; Cleary, P.A. Confirmation of the dimensional structure of the SCL-90: A study in construct validation. J. Clin. Psychiatry 1977, 33, 981–989. [Google Scholar] [CrossRef]
- Cassano, G.B.; Conti, L.; Levine, J. SCL-90. In Repertorio Delle Scale di Valutazione in Psichiatria; SEE: Firenze, Italy, 1999; pp. 325–332. [Google Scholar]
- Holi, M.M.; Marttunen, M.; Aalberg, V. Comparison of the GHQ-36, the GHQ-12 and the SCL-90 as psychiatric screening instruments in the Finnish population. Nord. J. Psychiatry 2003, 57, 233–238. [Google Scholar] [CrossRef]
- Spielberger, C.D.; Gorsuch, R.L.; Lushene, R.; Vagg, P.R.; Jacobs, G.A. Manual for the State-Trait Anxiety Scale; Consulting Psychologists: Palo Alto, CA, USA, 1983. [Google Scholar]
- Kvaal, K.; Ulstein, I.; Nordhus, I.H.; Engedal, K. The Spielberger State-Trait Anxiety Inventory (STAI): The state scale in detecting mental disorders in geriatric patients. Int. J. Geriatr. Psychiatry 2005, 20, 629–634. [Google Scholar] [CrossRef] [PubMed]
- Pedrabissi, L.; Santinello, M. Verifica Della Validità Dello STAI forma Y di Spielberger; Giunti Organizzazioni Speciali: Firenze, Italy, 1989. [Google Scholar]
- Louangrath, P. Reliability and Validity of Survey Scales. Intern. J. Res. Method Soc. Sci. 2018, 4, 50–62. [Google Scholar]
- Curcio, G.; Casagrande, M.; Bertini, M. Sleepiness: Evaluating and quantifying methods. Int. J. Psychophysiol. 2001, 41, 251–263. [Google Scholar] [CrossRef]
- Hasson, D.; Arnetz, B.B. Validation and findings comparing VAS vs. Likert scales for psychosocial measurements. Int. Electron. J. Health Educ. 2005, 8, 178–192. [Google Scholar]
- Weiss, D.S.; Marmar, C.R. The impact of event scale—Revised. In Assessing Psychological Trauma and PTSD; Wilson, J.P., Keane, T.M., Eds.; Guilford Press: New York, NY, USA, 1997; pp. 399–411. [Google Scholar]
- Pietrantonio, F.; De Gennaro, L.; Di Paolo, M.C.; Solano, L. The Impact of Event Scale: Validation of an Italian version. J. Psychosom. Res. 2003, 5, 389–393. [Google Scholar] [CrossRef]
- Creamer, M.; Bell, R.; Failla, S. Psychometric properties of the Impact of Event Scale—Revised. Behav. Res. Ther. 2003, 41, 1489–1496. [Google Scholar] [CrossRef] [PubMed]
- Corno, G.; Molinari, G.; Baños, R. Assessing positive and negative experiences: Validation of a new measure of well-being in an Italian population. Riv. Psichiatr. 2016, 51, 110–115. [Google Scholar] [PubMed]
- Ashbaugh, A.R.; Houle-Johnson, S.; Herbert, C.; El-Hage, W.; Brunet, A. Psychometric Validation of the English and French Versions of the Posttraumatic Stress Disorder Checklist for DSM-5 (PCL-5). PLoS ONE 2016, 11, e0161645. [Google Scholar] [CrossRef] [PubMed]
- Favieri, F.; Forte, G.; Tambelli, R.; Casagrande, M. The Italians in the Time of Coronavirus: Psychosocial Aspects of Unexpected COVID-19 Pandemic. SSRN Electron. J. 2020. [Google Scholar] [CrossRef]
- Casagrande, M.; Favieri, F.; Tambelli, R.; Forte, G. The enemy who sealed the world: Effects quarantine due to the COVID-19 on sleep quality, anxiety, and psychological distress in the Italian population. Sleep Med. 2020. Available online: https://www.sciencedirect.com/science/article/pii/S1389945720302136 (accessed on 12 May 2020).
- Wang, C.; Pan, R.; Wan, X.; Tan, Y.; Xu, L.; Ho, C.S.; Ho, R.C.M. Immediate Psychological Responses and Associated Factors during the Initial Stage of the 2019 Coronavirus Disease (COVID-19) Epidemic among the General Population in China. Int. J. Environ. Res. Public Health 2020, 17, 1729. [Google Scholar] [CrossRef] [PubMed]
- Tian, F.; Li, H.; Tian, S.; Yang, J.; Shao, J.; Tian, C. Psychological symptoms of ordinary Chinese citizens based on SCL-90 during the level I emergency response to COVID-19. Psychiatry Res. Neuroimaging 2020, 288, 112992. [Google Scholar] [CrossRef]
- Chen, C.-S.; Wu, H.-Y.; Yang, P.; Yen, C.-F. Psychological Distress of Nurses in Taiwan Who Worked During the Outbreak of SARS. Psychiatr. Serv. 2005, 56, 76–79. [Google Scholar] [CrossRef] [PubMed]
- Hall, R.C.; Hall, R.C.; Chapman, M.J. The 1995 Kikwit Ebola outbreak: Lessons hospitals and physicians can apply to future viral epidemics. Gen. Hosp. Psychiatry 2008, 30, 446–452. [Google Scholar] [CrossRef] [PubMed]
- Rubin, G.J.; Potts, H.; Michie, S. The impact of communications about swine flu (influenza A H1N1v) on public responses to the outbreak: Results from 36 national telephone surveys in the UK. Health Technol. Assess. 2010, 14, 183–266. [Google Scholar] [CrossRef] [PubMed]
- Van Bortel, T.; Basnayake, A.; Wurie, F.; Jambai, M.; Koroma, A.S.; Muana, A.T.; Hann, K.; Eaton, J.; Martin, S.; Nellums, L.B. Psychosocial effects of an Ebola outbreak at individual, community and international levels. Bull. World Health Organ. 2016, 94, 210–214. [Google Scholar] [CrossRef] [PubMed]
- Keita, A.K.; the PostEboGui Study Group; Taverne, B.; Savané, S.S.; March, L.; Doukoure, M.; Sow, M.S.; Touré, A.; Etard, J.F.; Barry, M. Depressive symptoms among survivors of Ebola virus disease in Conakry (Guinea): Preliminary results of the PostEboGui cohort. BMC Psychiatry 2017, 17, 1–9. [Google Scholar] [CrossRef]
- Su, T.-P.; Lien, T.-C.; Yang, C.-Y.; Su, Y.L.; Wang, J.-H.; Tsai, S.-L.; Yin, J.-C. Prevalence of psychiatric morbidity and psychological adaptation of the nurses in a structured SARS caring unit during outbreak: A prospective and periodic assessment study in Taiwan. J. Psychiatr. Res. 2007, 41, 119–130. [Google Scholar] [CrossRef]
- Casagrande, M.; Mingarelli, A.; Guarino, A.; Favieri, F.; Boncompagni, I.; Germanò, R.; Germanò, G.; Forte, G. Alexithymia: A facet of uncontrolled hypertension. Int. J. Psychophysiol. 2019, 146, 180–189. [Google Scholar] [CrossRef] [PubMed]
- Casagrande, M.; Boncompagni, I.; Mingarelli, A.; Favieri, F.; Forte, G.; Germanò, R.; Germanò, G.; Guarino, A. Coping styles in individuals with hypertension of varying severity. Stress Health 2019, 35, 560–568. [Google Scholar] [CrossRef] [PubMed]
- Casagrande, M.; Boncompagni, I.; Forte, G.; Guarino, A.; Favieri, F. Emotion and overeating behavior: Effects of alexithymia and emotional regulation on overweight and obesity. Eat. Weight. Disord. 2019, 1–13. [Google Scholar] [CrossRef]
- Casagrande, M.; Favieri, F.; Guarino, A.; Di Pace, E.; Langher, V.; Germanò, G.; Forte, G. The Night Effect of Anger: Relationship with Nocturnal Blood Pressure Dipping. Int. J. Environ. Res. Public Health 2020, 17, 2705. [Google Scholar] [CrossRef]


| Overall Sample (n = 2.291) | North Italy (n = 541) | Central Italy (n = 574) | South Italy (n = 1.176) | |
|---|---|---|---|---|
| Gender, n (%) | ||||
| Male | 580 (25.3) | 107 (18.4) | 121 (20.9) | 352 (60.7) |
| Female | 1708 (74.6) | 434 (25.4) | 451 (26.4) | 823 (48.2) |
| Other | 3 (0.1) | - | 2 (66.7) | 1 (33.3) |
| Age, n (%) | ||||
| 18–29 years old | 1571 (68.6) | 342 (21.8) | 374 (23.8) | 855 (54.4) |
| 30–49 years old | 485 (21.2) | 156 (32.2) | 130 (26.8) | 199 (41.0) |
| >50 years old | 235 (10.3) | 43 (18.3) | 70 (29.8) | 122 (51.9) |
| Education, n (%) | ||||
| Until middle School | 99 (4.4) | 22 (22.2) | 18 (18.2) | 59 (59.6) |
| High School | 1136 (49.6) | 265 (23.3) | 242 (21.3) | 629 (55.4) |
| Undergraduate | ||||
| Health care | 246 (10.7) | 49 (19.9) | 80 (32.5) | 117 (47.6) |
| Other | 660 (28.8) | 174 (26.4) | 165 (25.0) | 321 (48.6) |
| Post-graduated | ||||
| Health care | 63 (2.7) | 10 (15.9) | 28 (44.4) | 25 (39.7) |
| Other | 87 (3.8) | 21 (24.1) | 41 (47.1) | 25 (28.7) |
| Occupation, n (%) | ||||
| Student | 1073 (46.8) | 207 (19.3) | 272 (25.3) | 594 (55.4) |
| Employed | 688 (30.0) | 227 (33.0) | 162 (23.5) | 299 (43.5) |
| Unemployed | 279 (12.2) | 52 (18.6) | 61 (21.9) | 166 (59.5) |
| Self-Employed | 222 (9.7) | 50 (22.5) | 64 (28.9) | 108 (48.6) |
| Retired | 29 (1.3) | 5 (17.2) | 15 (51.7) | 9 (31.1) |
| Number of inhabitants in own city, n (%) | ||||
| <2.000 | 124 (5.4) | 28 (22.6) | 17 (13.7) | 79 (63.7) |
| 2.000–10.000 | 453 (19.8) | 130 (28.7) | 81 (17.9) | 242 (53.4) |
| 10.000–100.000 | 937 (40.9) | 199 (21.2) | 174 (18.6) | 564 (60.2) |
| >100.000 | 777 (33.9) | 184 (23.7) | 302 (38.9) | 291 (37.5) |
| Quarantine Experience, n (%) | ||||
| Alone | 234 (10.2) | 74 (31.6) | 59 (25.2) | 101 (43.2) |
| Others | 2.057 (89.8) | 467 (22.7) | 515 (25.0) | 1.075 (52.3) |
| Infection by the virus | ||||
| Yes | 9 (0.4) | 2 (22.2) | 2 (22.2) | 5 (55.6) |
| No | 1707 (74.5) | 374 (21.6) | 409 (23.6) | 951 (54.8) |
| Do not know | 575 (25.1) | 192 (33.4) | 163 (28.4) | 220 (38.3) |
| Direct contact with people infected by COVID-19 | ||||
| Yes | 40 (1.7) | 28 (70.0) | 6 (15.0) | 6 (15.0) |
| No | 1441 (62.9) | 274 (19.0) | 337 (23.4) | 830 (58.6) |
| Do not know | 810 (35.4) | 239 (29.5) | 231 (28.5) | 340 (42.0) |
| Knowledge of people infected by COVID-19 | ||||
| Yes | 550 (24.0) | 237 (43.1) | 126 (22.9) | 187 (30.4) |
| No | 1741 (76.0) | 304 (17.5) | 448 (25.7) | 989 (56.8) |
| Knowledge of people in ICU due to COVID-19 | ||||
| Yes | 177 (7.7) | 87 (49.2) | 39 (22.0) | 51 (28.8) |
| No | 2114 (92.3) | 454 (21.5) | 535 (25.3) | 1.125 (53.2) |
| Knowledge of people died due to COVID-19 | ||||
| Yes | 112 (4.9) | 66 (58.9) | 21 (18.8) | 25 (22.3) |
| No | 2179 (95.1) | 475 (21.8) | 553 (25.4) | 1151 (58.2) |
| Respondents’ Data | General Population’s Data | t Student | p | |
|---|---|---|---|---|
| Anxiety (STAI) | ||||
| State of Anxiety | Males: 44.28 (11.98) Females: 52.62 (12.06) | Males: 39.03 (10.00) Females: 44.32 (12.75) | t Males: 4.49 t Females: 9.64 | p Males: <0.0001 p Females: <0.0001 |
| Trait of Anxiety | Males: 40.12 (10.80) Females: 44.41 (11.15) | Males: 39.82 (7.62) Females: 45.30 (9.42) | t Males: <1 t Females: 1.44 | p Males: 0.77 p Females: 0.25 |
| Psychopathological Symptomatology (SCL-90) | ||||
| Somatization | 0.71 (0.71) | 0.67 (0.55) | <1 | 0.32 |
| Obsessive-Compulsive | 0.91 (0.78) | 0.82 (0.57) | 2.04 | <0.05 |
| Interpersonal Sensitivity | 0.58 (0.64) | 0.74 (0.55) | 4.36 | <0.0001 |
| Depression | 1.01 (0.81) | 0.73 (0.55) | 6.14 | <0.0001 |
| Anxiety | 0.86 (0.75) | 0.53 (0.49) | 7.83 | <0.0001 |
| Anger-Hostility | 0.65 (0.65) | 0.58 (0.53) | 1.89 | <0.05 |
| Phobic Anxiety | 0.58 (0.70) | 0.24 (0.39) | 8.71 | <0.0001 |
| Paranoid Ideation | 0.57 (0.62) | 0.53 (0.58) | 1.11 | 0.26 |
| Psychoticism | 0.44 (0.53) | 0.31 (0.48) | 4.25 | <0.0001 |
| Sleep Disturbance | 0.37 (0.36) | - | - | - |
| Global Index Severity | 0.74 (0.59) | 0.60 (0.44) | 4.18 | <0.0001 |
| Post-Traumatic Stress Disorder Screening (IES) | ||||
| PTSD Total | 22.39 (18.08) | 20.6 (19.4) | 2.42 | <0.05 |
| Overall Sample | North Italy | Central Italy | South Italy | F | p | |
|---|---|---|---|---|---|---|
| Anxiety (STAI) | ||||||
| State of Anxiety | 50.51 (12.53) | 51.58 (12.72) | 50.10 (11.77) | 50.21 (12.47) | 2.62 | 0.07 |
| Trait of Anxiety | 43.32 (11.21) | 43.76 (11.4) | 43.40 (10.53) | 43.08 (11.15) | <1 | 0.50 |
| Psychopathological Symptomatology (SCL-90) | ||||||
| Somatization | 0.71 (0.71) | 0.73 (0.74) | 0.72 (0.69) | 0.70 (0.71) | <1 | 0.68 |
| Obsessive-Compulsive | 0.91 (0.78) | 0.90 (0.80) | 0.88 (0.73) | 0.92 (0.79) | <1 | 0.58 |
| Interpersonal Sensitivity | 0.58 (0.64) | 0.60 (0.64) | 0.55 (0.62) | 0.58 (0.66) | <1 | 0.37 |
| Depression | 1.01 (0.81) | 1.08 (0.83) | 1.01 (0.78) | 0.98 (0.82) | 2.52 | 0.08 |
| Anxiety | 0.86 (0.75) | 0.91 (0.80) | 0.84 (0.72) | 0.84 (0.75) | 1.90 | 0.15 |
| Anger-Hostility | 0.65 (0.65) | 0.59 (0.59) | 0.65 (0.69) | 0.66 (0.64) | 2.40 | 0.10 |
| Phobic Anxiety | 0.58 (0.70) | 0.59 (0.69) | 0.58 (0.71) | 0.59 (0.71) | <1 | 0.90 |
| Paranoid Ideation | 0.57 (0.62) | 0.54 (0.62) | 0.55 (0.62) | 0.60 (0.68) | 2.10 | 0.12 |
| Psychoticism | 0.44 (0.53) | 0.43 (0.50) | 0.43 (0.51) | 0.43 (0.55) | <1 | 0.74 |
| Sleep Disturbance | 0.37 (0.36) | 0.41 (0.38) | 0.38 (0.36) | 0.35 (0.35) | 4.55 | <0.01 |
| Global Severity Index | 0.74 (0.59) | 0.76 (0.59) | 0.73 (0.56) | 0.74 (0.61) | <1 | 0.66 |
| Post-Traumatic Stress Disorder Screening (IES-R) | ||||||
| Intrusion | 1.01 (0.91) | 1.0 (0.92) | 1.03 (0.91) | 0.98 (0.90) | 1.04 | 0.35 |
| Avoidance | 1.05 (0.83) | 1.07 (0.81) | 1.05 (0.80) | 1.05 (0.85) | <1 | 0.91 |
| Hyperarousal | 0.97 (0.93) | 0.99 (0.91) | 1.00 (0.91) | 0.9 (0.94) | <1 | 0.57 |
| Total Subscales | 3.04 (2.48) | 3.11 (2.45) | 3.08 (2.43) | 2.99 (2.51) | <1 | 0.61 |
| PTSD Total | 22.39 (18.08) | 22.91 (17.88) | 22.62 (17.72) | 22.04 (18.37) | <1 | 0.61 |
| Mood before the COVID-19 Emergency | Mood during the COVID-19 Emergency | F(1,2290) | p | pη2 | |
|---|---|---|---|---|---|
| Insecurity | 3.31 (2.81) | 6.86 (2.62) | 2584.89 | <0.0001 | 0.53 |
| Helplessness | 3.26 (3.18) | 7.43 (2.68) | 3018.68 | <0.0001 | 0.57 |
| Sadness | 3.06 (2.76) | 6.24 (2.72) | 2128.68 | <0.0001 | 0.48 |
| Fear | 2.38 (2.64) | 6.48 (2.74) | 3869.14 | <0.0001 | 0.63 |
| Anger | 2.59 (2.80) | 5.03 (3.29) | 1071.69 | <0.0001 | 0.32 |
| Frustration | 2.63 (2.81) | 5.30 (3.24) | 1380.20 | <0.0001 | 0.38 |
| Stress | 4.72 (2.91) | 5.78 (3.06) | 191.53 | <0.0001 | 0.08 |
| Anxiety | 4.14 (3.03) | 6.07 (3.04) | 856.91 | <0.0001 | 0.27 |
| Depression | 1.92 (2.55) | 3.49 (3.18) | 731.68 | <0.0001 | 0.24 |
| Boredom | 2.05 (2.51) | 5.33 (3.29) | 2052.99 | <0.0001 | 0.47 |
| Preoccupation | 3.79 (2.72) | 7.36 (2.37) | 2994.75 | <0.0001 | 0.57 |
| Tranquility | 5.95 (2.43) | 3.53 (2.42) | 1506.60 | <0.0001 | 0.40 |
| Energy | 6.47 (2.39) | 4.42 (2.59) | 1152.18 | <0.0001 | 0.33 |
| Serenity | 6.20 (2.40) | 3.81 (2.29) | 1639.44 | <0.0001 | 0.42 |
| Happiness | 6.20 (2.49) | 3.67 (2.33) | 1992.88 | <0.0001 | 0.47 |
| High Psychopathology | High Anxiety Symptoms | High PTSD | |||||||
|---|---|---|---|---|---|---|---|---|---|
| Prevalence in the overall sample, n (%) | 719 (31.38) | 852 (37.19) | 635 (27.72) | ||||||
| B | OR (95% CI) | p | B | OR (95% CI) | p | B | OR (95% CI) | p | |
| Gender, n (%) | |||||||||
| Male | Reference | Reference | Reference | ||||||
| Female | 0.84 | 2.32 (1.85–2.92) | <0.0001 | 1.13 | 3.10 (2.47–3.89) | <0.0001 | 0.87 | 2.39 (1.88–3.05) | <0.0001 |
| Age, n (%) | |||||||||
| 18–29 years old | 0.74 | 2.10 (1.50–2.95) | <0.0001 | 0.38 | 1.47 (1.09–1.98) | <0.01 | 0.54 | 1.71 (1.21–2.41) | <0.01 |
| 30–49 years old | 0.52 | 1.68 (1.16–2.46) | <0.01 | 0.52 | 1.68 (1.20–2.35) | <0.01 | 0.51 | 1.66 (1.14–2.43) | <0.01 |
| >50 years old | Reference | Reference | Reference | ||||||
| Education, n (%) | |||||||||
| Until middle School | Reference | Reference | Reference | ||||||
| High School | 0.25 | 1.28 (0.81–2.02) | 0.29 | 0.52 | 1.67 (1.07–2.67) | <0.05 | 0.14 | 1.15 (0.71–1.85) | 0.57 |
| Undergraduate | |||||||||
| Other | 0.16 | 1.18 (0.74–1.88) | 0.50 | 0.52 | 1.68 (1.05–2.68) | <0.05 | 0.36 | 1.43 (0.88–2.33) | 0.15 |
| Health Care | −0.07 | 0.93 (0.55–1.57) | 0.78 | 0.21 | 1.24 (0.74–2.08) | 0.42 | −0.13 | 0.88 (0.51–1.52) | 0.65 |
| Post-graduated | |||||||||
| Other | 0.13 | 1.14 (0.61–2.14) | 0.68 | 0.54 | 1.71 (0.92–3.17) | 0.10 | 0.45 | 1.56 (0.82–2.96) | 0.17 |
| Health Care | −10.00 | 0.37 (0.16–0.87) | <0.05 | 0.07 | 1.07 (0.53–2.16) | 0.86 | 0.06 | 1.06 (0.51–2.21) | 0.87 |
| Occupation, n (%) | |||||||||
| Student | Reference | Reference | Reference | ||||||
| Employed | −0.41 | 0.67 (0.54–0.82) | <0.0001 | −0.13 | 0.88 (0.72–1.07) | 0.20 | −0.17 | 0.85 (0.68–1.05) | 0.13 |
| Unemployed | −0.08 | 0.92 (0.70- 1.21) | 0.55 | 0.20 | 1.22 (0.93–1.59) | 0.15 | 0.03 | 1.03 (0.77–1.38) | 0.83 |
| Self-Employed | −0.38 | 0.68 (0.49–0.94) | <0.05 | −0.16 | 0.85 (0.63–1.15) | 0.30 | −0.20 | 0.82 (0.59–1.15) | 0.25 |
| Retired | −0.96 | 0.38 (0.15–1.01) | <0.05 | −0.15 | 0.86 (0.40–1.87) | 0.71 | −0.25 | 0.78 (0.33–1.84) | 0.56 |
| Territorial Area | |||||||||
| North Italy | 0.12 | 1.13 (0.91–1.40) | 0.28 | 0.14 | 1.15 (0.94–1.42) | 0.19 | 0.17 | 1.18 (0.95–1.48) | 0.14 |
| Central Italy | −0.05 | 0.95 (0.77–1.18) | 0.65 | 0.03 | 1.03 (0.84–1.27) | 0.77 | 0.04 | 1.04 (0.83–1.31) | 0.72 |
| South Italy | Reference | Reference | Reference | ||||||
| Number of inhabitants, n (%) | |||||||||
| <2.000 | Reference | Reference | Reference | ||||||
| 2.000–10.000 | 0.34 | 1.40 (0.91–2.17) | 0.13 | 0.27 | 1.31 (0.87−1.96) | 0.20 | −0.07 | 0.93 (0.60–1.46) | 0.76 |
| 10.000–100.000 | 0.13 | 1.14 (0.75–1.73) | 0.54 | −0.06 | 0.94 (0.64–1.39) | 0.76 | 0.04 | 1.04 (0.70–1.59) | 0.84 |
| >100.000 | 0.09 | 1.09 (0.72–1.66) | 0.69 | −0.18 | 0.83 (0.56–1.23) | 0.36 | 0.03 | 1.03 (0.68–1.58) | 0.88 |
| Quarantine Experience, n (%) | |||||||||
| Alone | 0.03 | 0.97 (0.72–1.30) | 0.83 | −0.27 | 0.76 (0.57–1.02) | 0.06 | 0.003 | 1.00 (0.74–1.36) | 0.98 |
| Others | Reference | Reference | Reference | ||||||
| Infection by the virus | |||||||||
| Yes | −0.41 | 0.67 (0.14–3.22) | 0.61 | 0.82 | 2.26 (0.60–8.45) | 0.23 | −1.07 | 0.34 (0.04–2.74) | 0.31 |
| Do not Know | 0.26 | 1.29 (1.06–1.58) | <0.01 | 0.25 | 1.29 (1.06–1.56) | <0.01 | 0.20 | 1.22 (0.99–1.50) | 0.06 |
| No | Reference | Reference | Reference | ||||||
| Direct contact with people infected by COVID-19 | |||||||||
| Yes | 0.16 | 1.17 (0.60–2.29) | 0.65 | 0.32 | 1.38 (0.73–2.60) | 0.32 | 0.22 | 1.24 (0.62–2.47) | 0.54 |
| Do not Know | 0.28 | 1.33 (1.10–1.59) | <0.01 | 0.26 | 1.30 (1.09–1.55) | <0.01 | 0.27 | 1.32 (1.09–1.59) | <0.01 |
| No | Reference | Reference | Reference | ||||||
| Knowledge of people infected by COVID-19 | |||||||||
| Yes | 0.22 | 1.25 (1.02–1.53) | <0.05 | 0.06 | 1.06 (0.87–1.29) | 0.58 | 0.30 | 1.34 (1.09–1.66) | <0.01 |
| No | Reference | Reference | Reference | ||||||
| Knowledge of people in ICU for COVID-19 | |||||||||
| Yes | 0.23 | 1.26 (0.92–1.74) | 0.16 | 0.04 | 0.95 (0.69–1.31) | 0.77 | 0.37 | 1.45 (1.00–2.00) | <0.05 |
| No | Reference | Reference | Reference | ||||||
| Knowledge of people died for COVID-19 | |||||||||
| Yes | 0.48 | 1.62 (1.10–2.39) | <0.01 | 0.21 | 1.23 (0.84–1.81) | 0.28 | 0.63 | 1.88 (1.28–2.77) | <0.001 |
| No | Reference | Reference | Reference | ||||||
© 2020 by the authors. Licensee MDPI, Basel, Switzerland. This article is an open access article distributed under the terms and conditions of the Creative Commons Attribution (CC BY) license (http://creativecommons.org/licenses/by/4.0/).
Share and Cite
Forte, G.; Favieri, F.; Tambelli, R.; Casagrande, M. The Enemy Which Sealed the World: Effects of COVID-19 Diffusion on the Psychological State of the Italian Population. J. Clin. Med. 2020, 9, 1802. https://doi.org/10.3390/jcm9061802
Forte G, Favieri F, Tambelli R, Casagrande M. The Enemy Which Sealed the World: Effects of COVID-19 Diffusion on the Psychological State of the Italian Population. Journal of Clinical Medicine. 2020; 9(6):1802. https://doi.org/10.3390/jcm9061802
Chicago/Turabian StyleForte, Giuseppe, Francesca Favieri, Renata Tambelli, and Maria Casagrande. 2020. "The Enemy Which Sealed the World: Effects of COVID-19 Diffusion on the Psychological State of the Italian Population" Journal of Clinical Medicine 9, no. 6: 1802. https://doi.org/10.3390/jcm9061802
APA StyleForte, G., Favieri, F., Tambelli, R., & Casagrande, M. (2020). The Enemy Which Sealed the World: Effects of COVID-19 Diffusion on the Psychological State of the Italian Population. Journal of Clinical Medicine, 9(6), 1802. https://doi.org/10.3390/jcm9061802