Effect of Evolocumab on Vulnerable Coronary Plaques: A Serial Coronary Computed Tomography Angiography Study


Abstract
1. Introduction
2. Methods
2.1. Ethical Approval
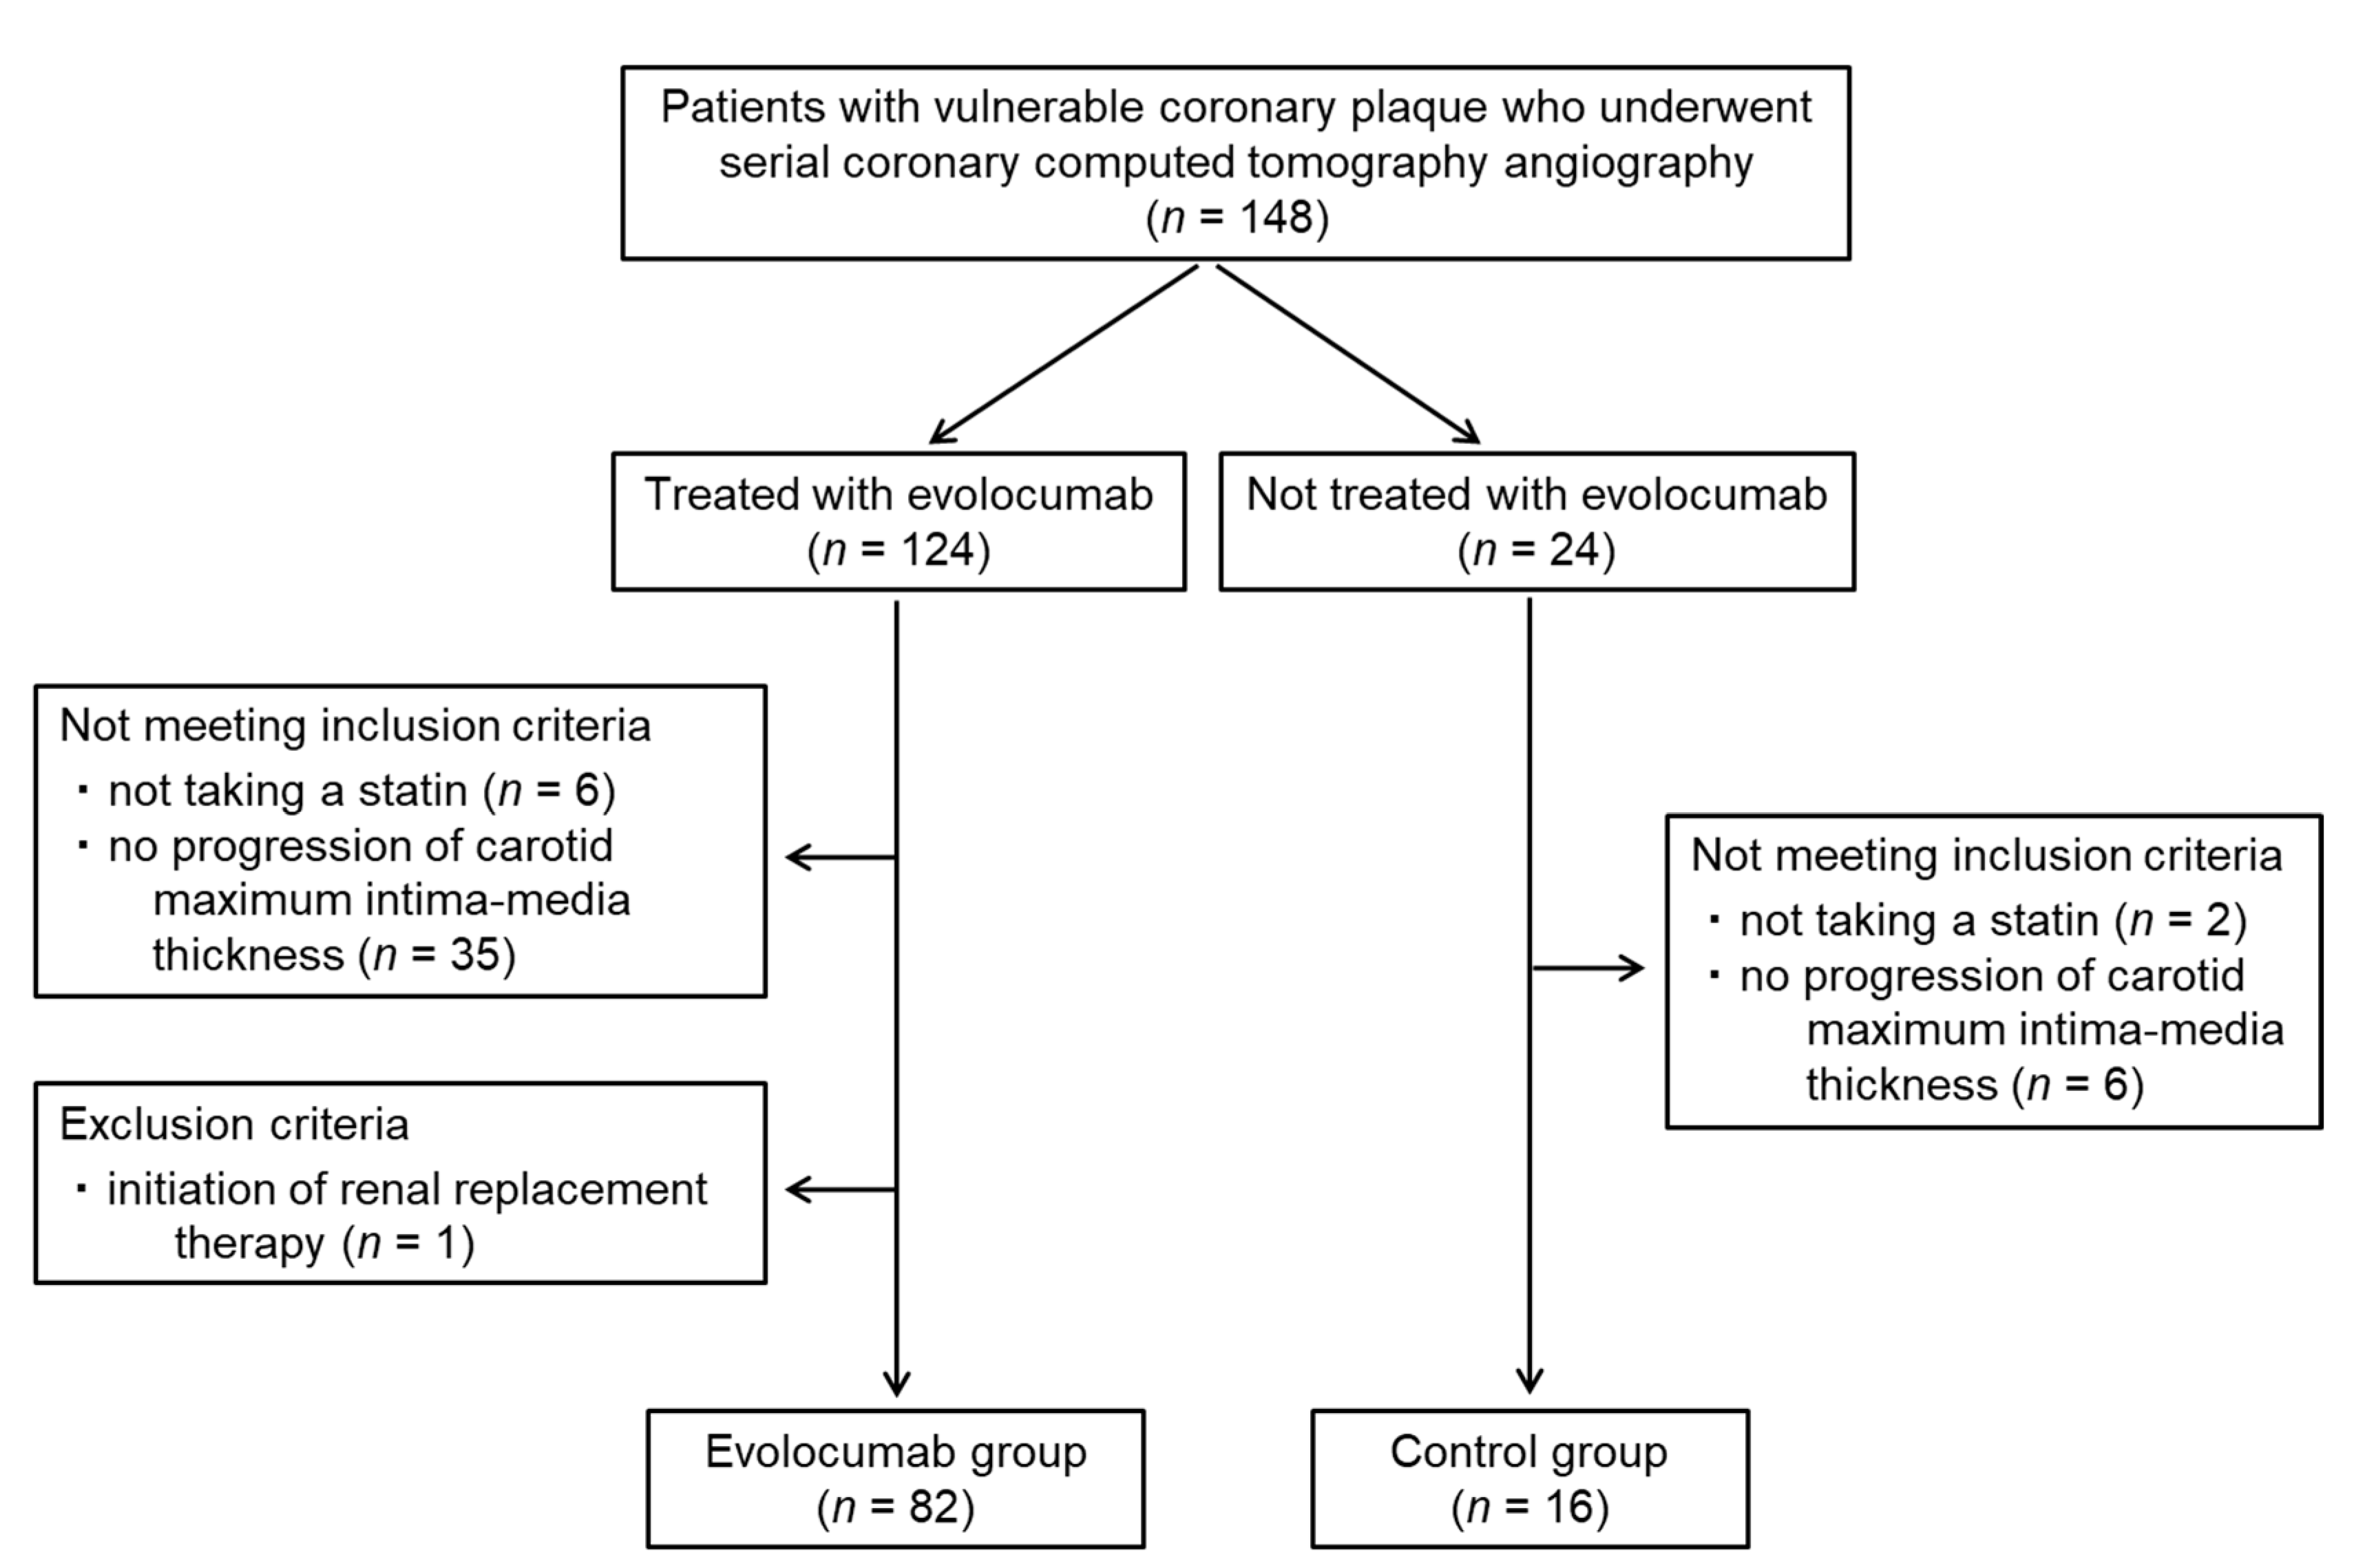
2.2. Patients
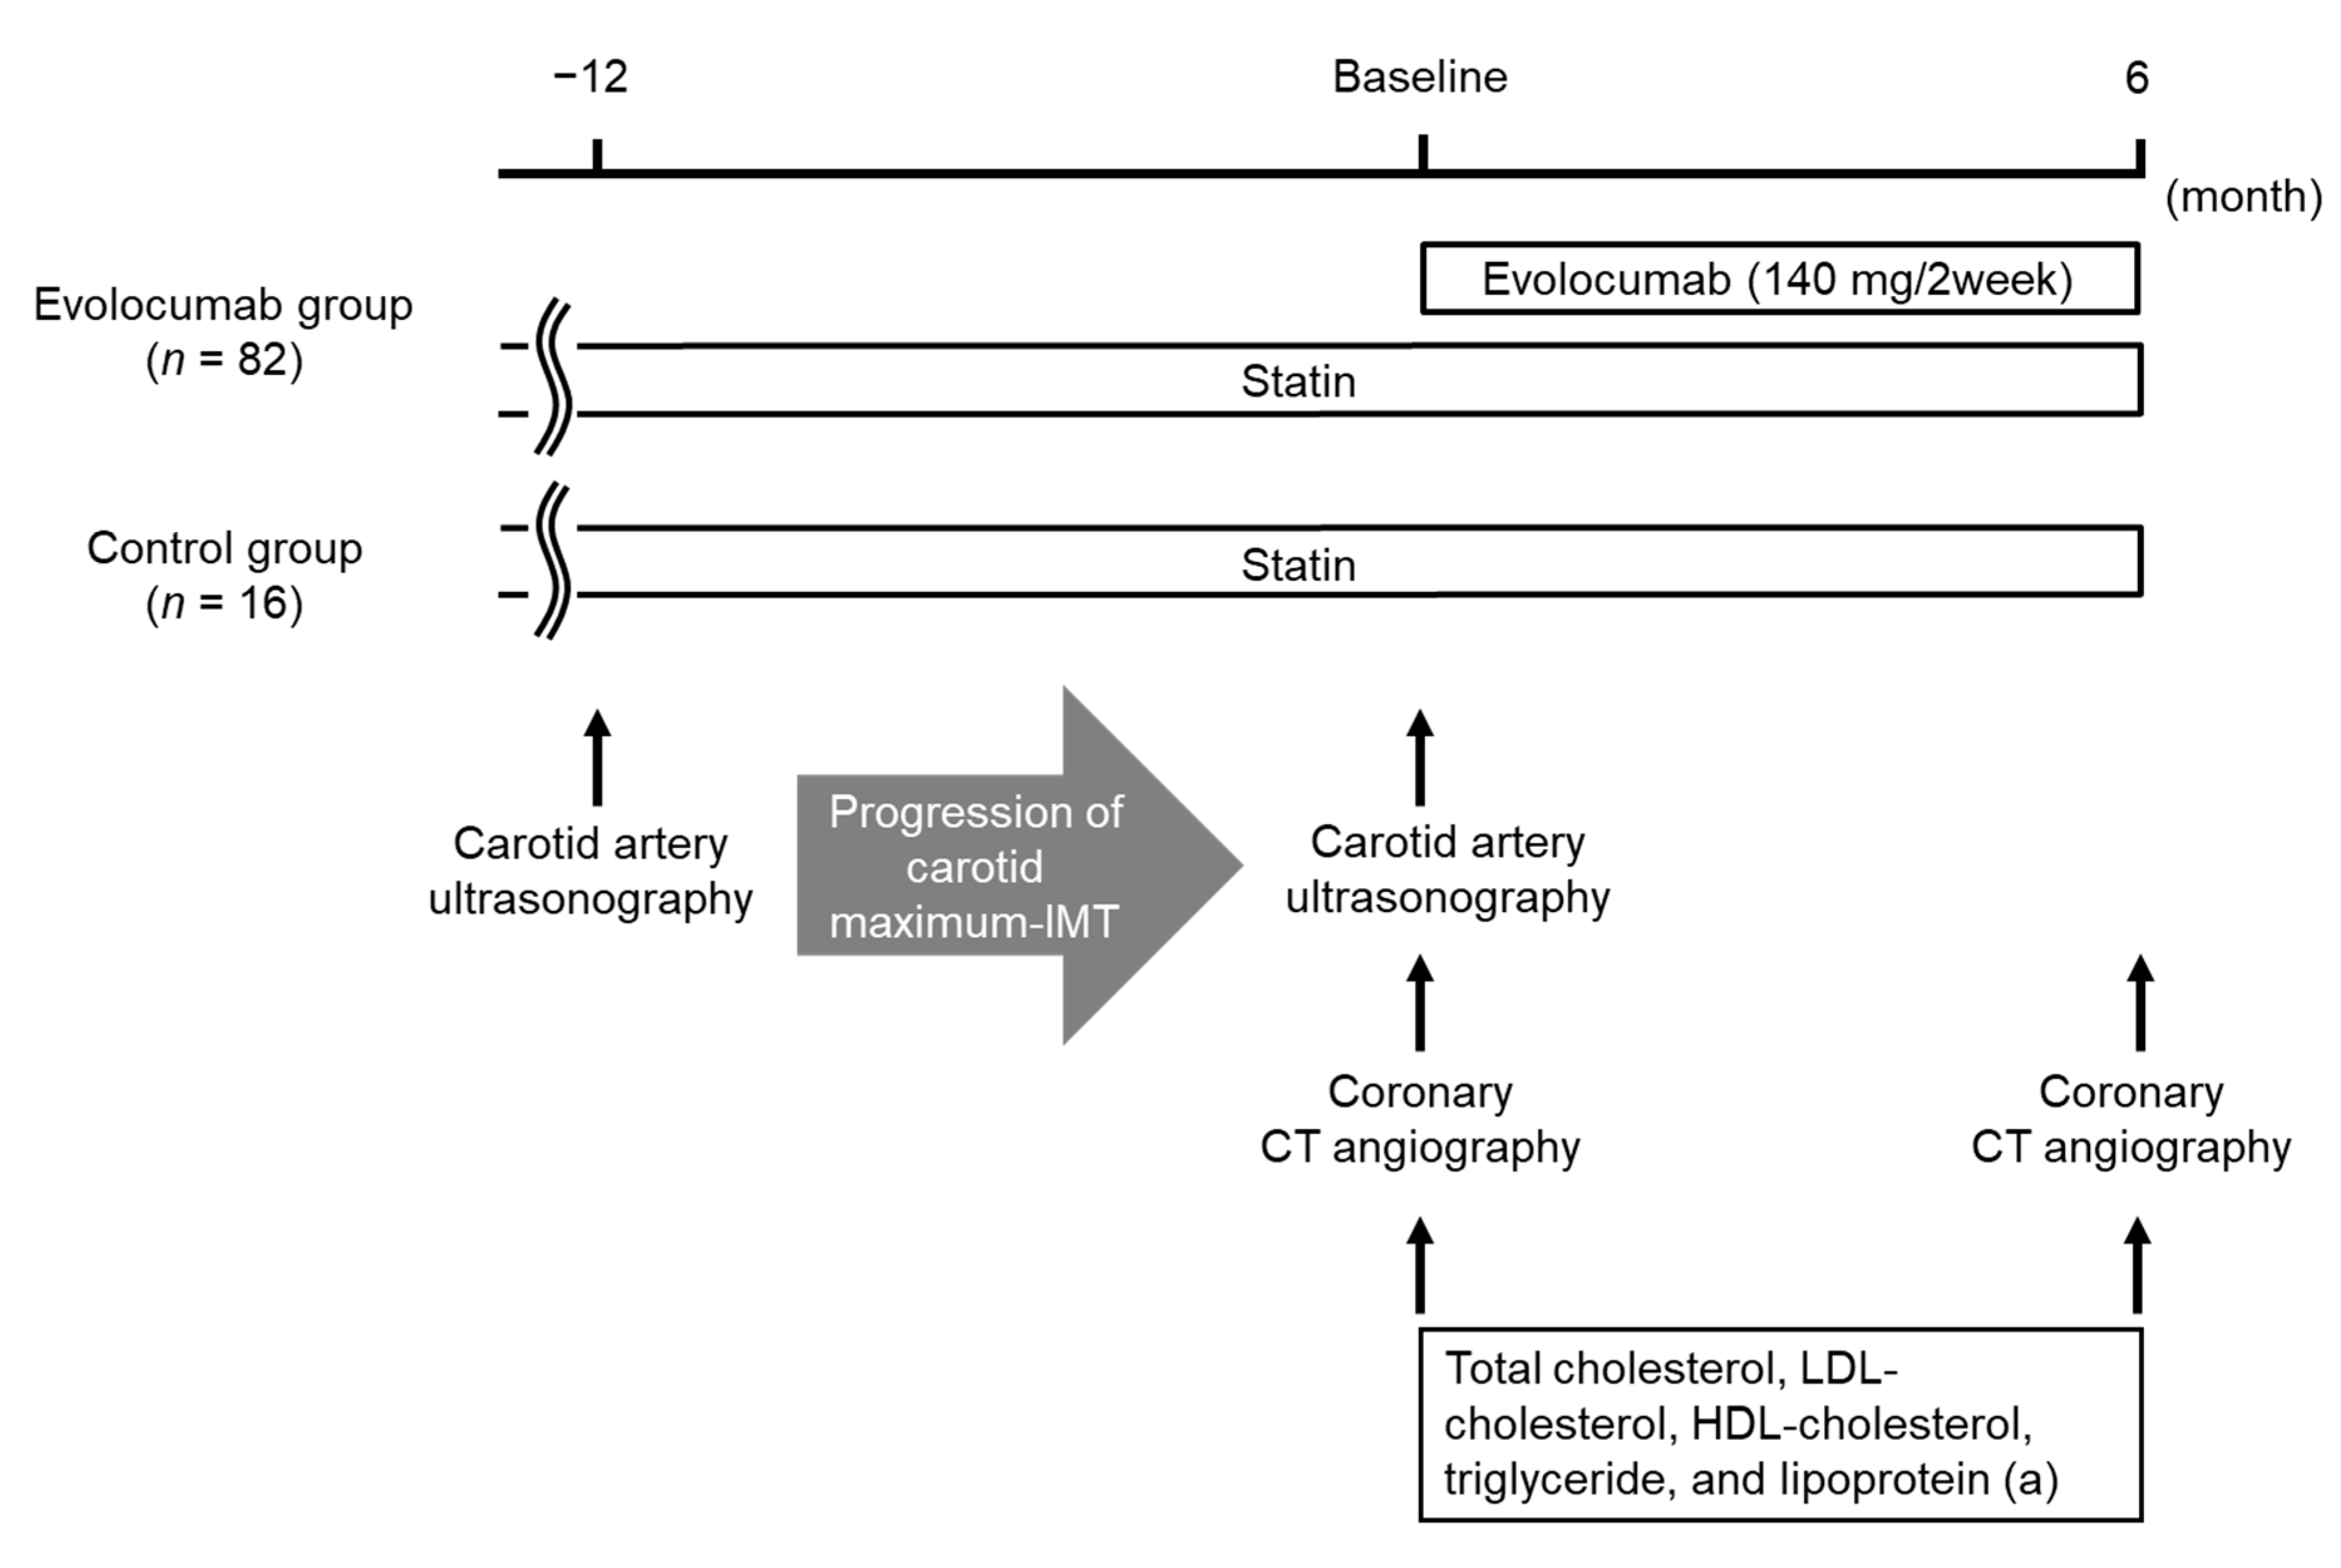
2.3. Study Design
2.4. Laboratory Methods
2.5. Measurement of Carotid IMT by Ultrasonography
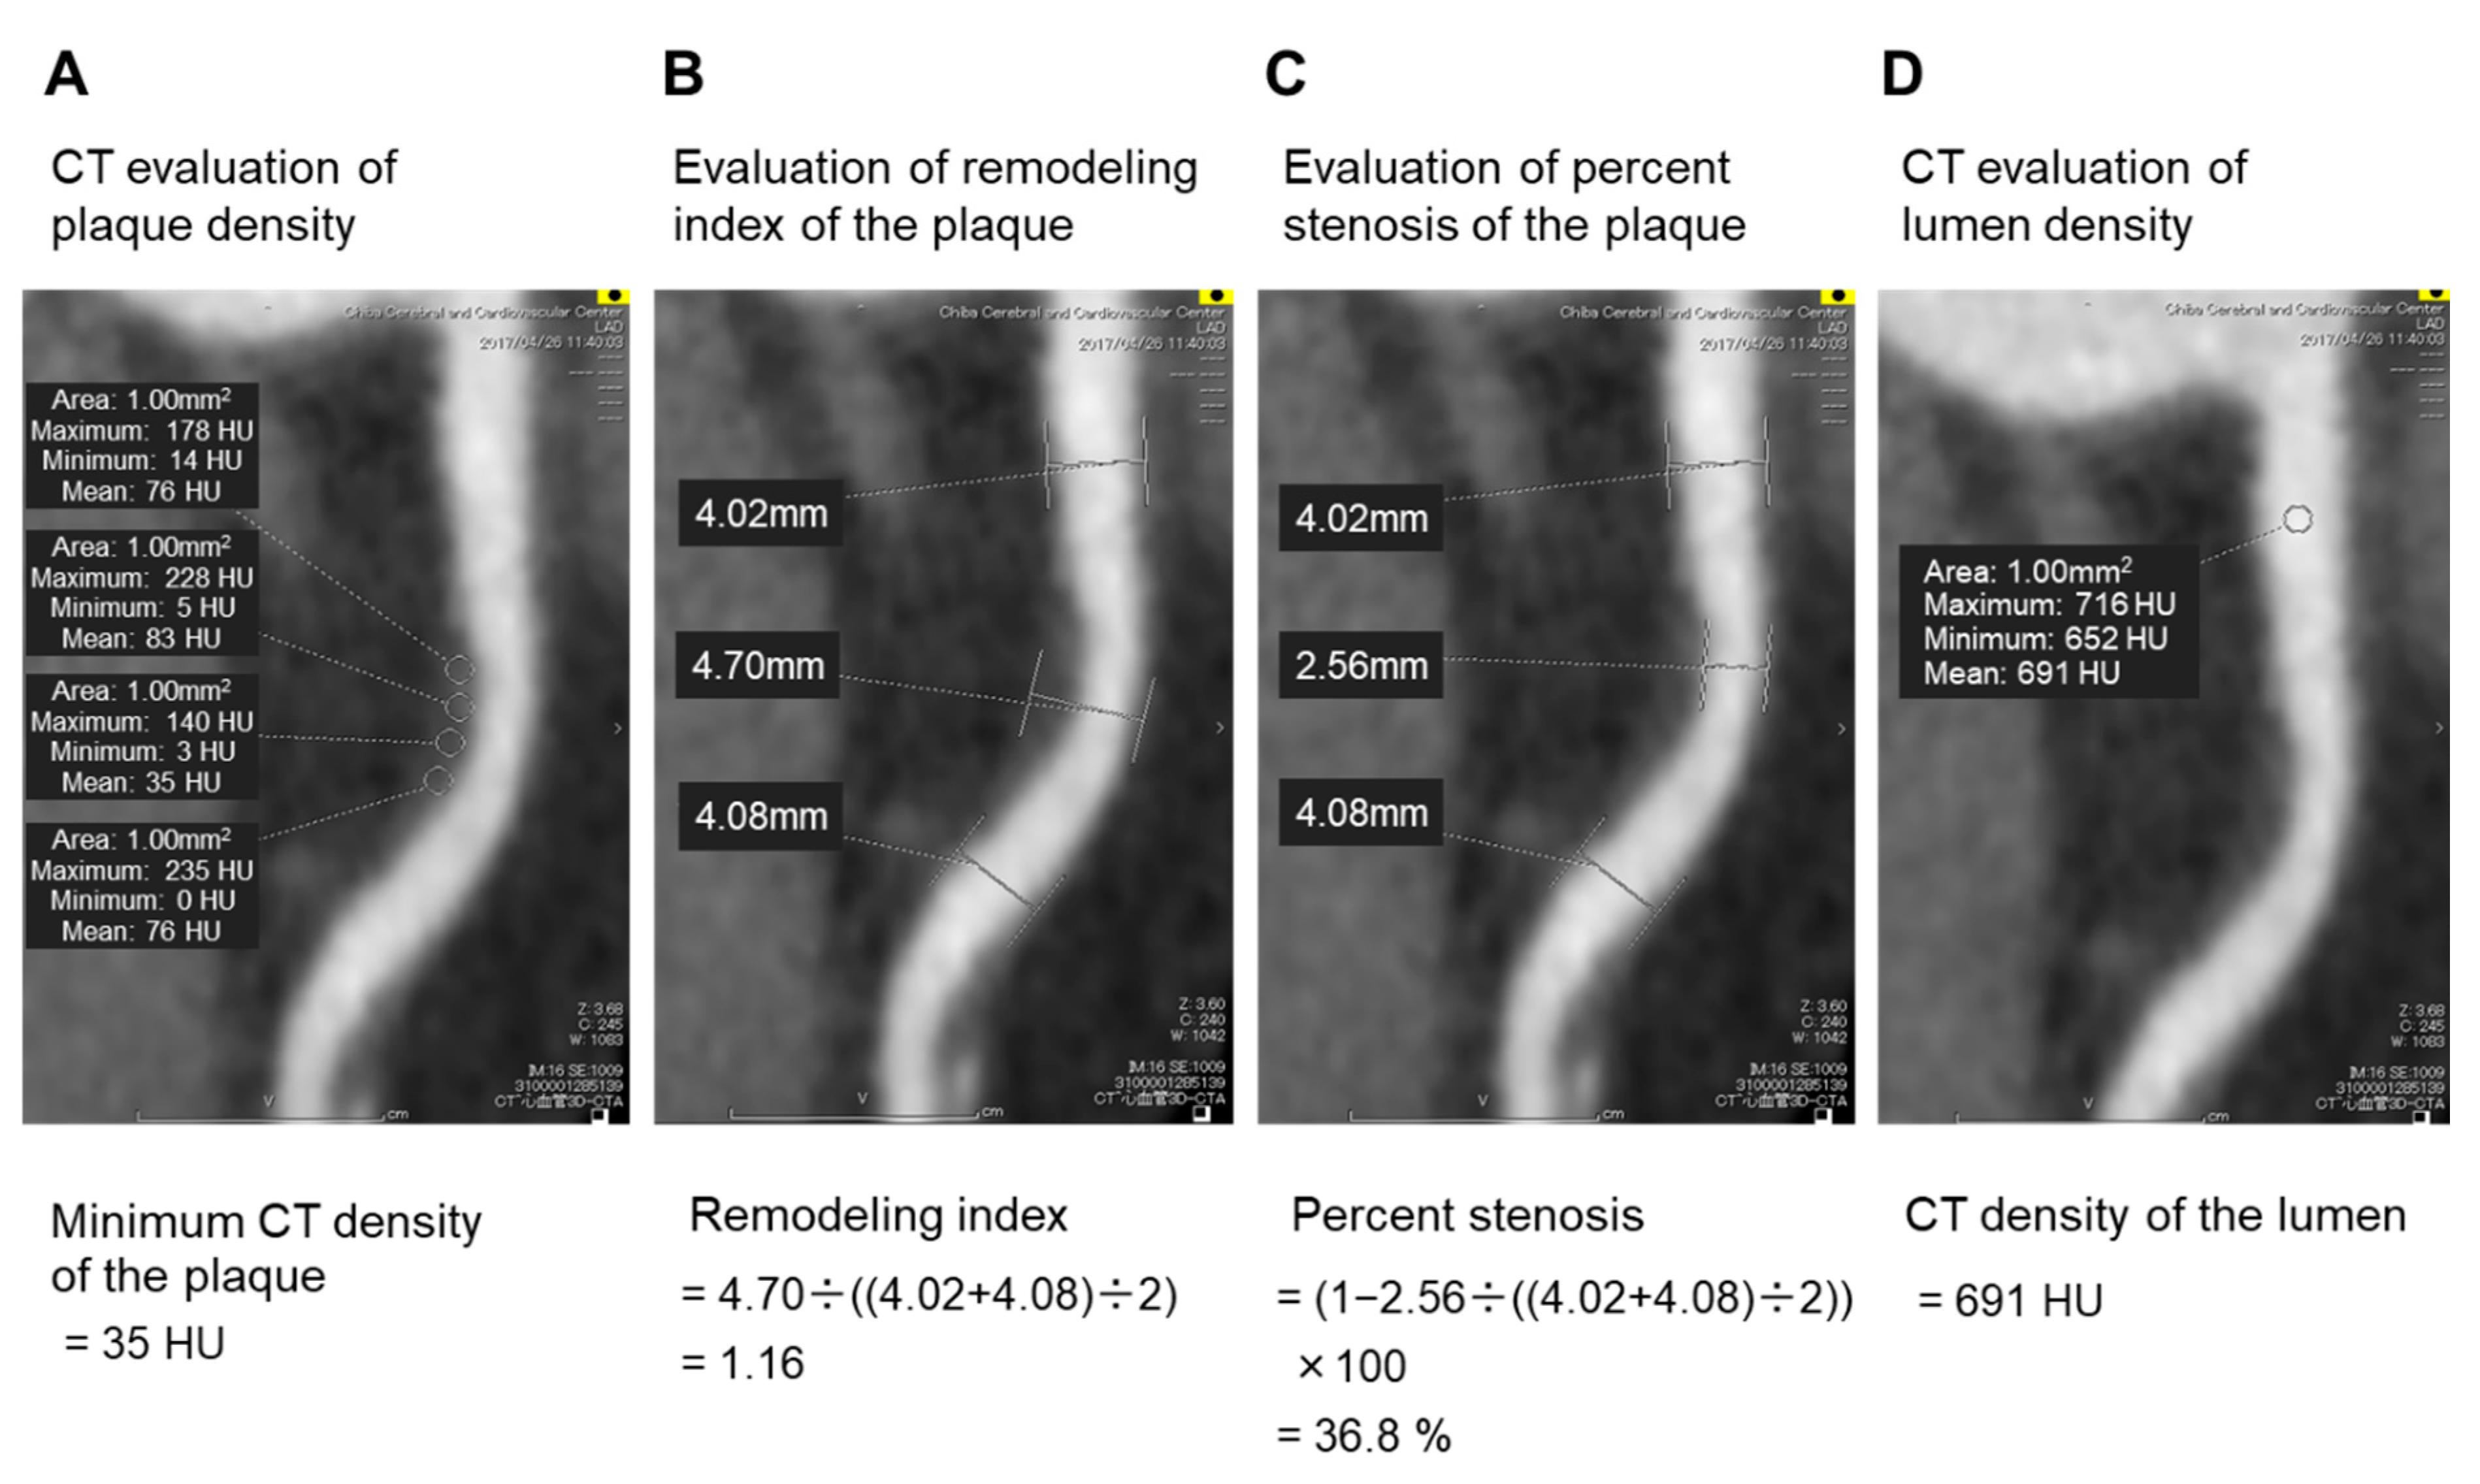
2.6. Assessment of Coronary Plaques Using Coronary CT Angiography
2.7. Statistics
3. Results
3.1. Patient Characteristics
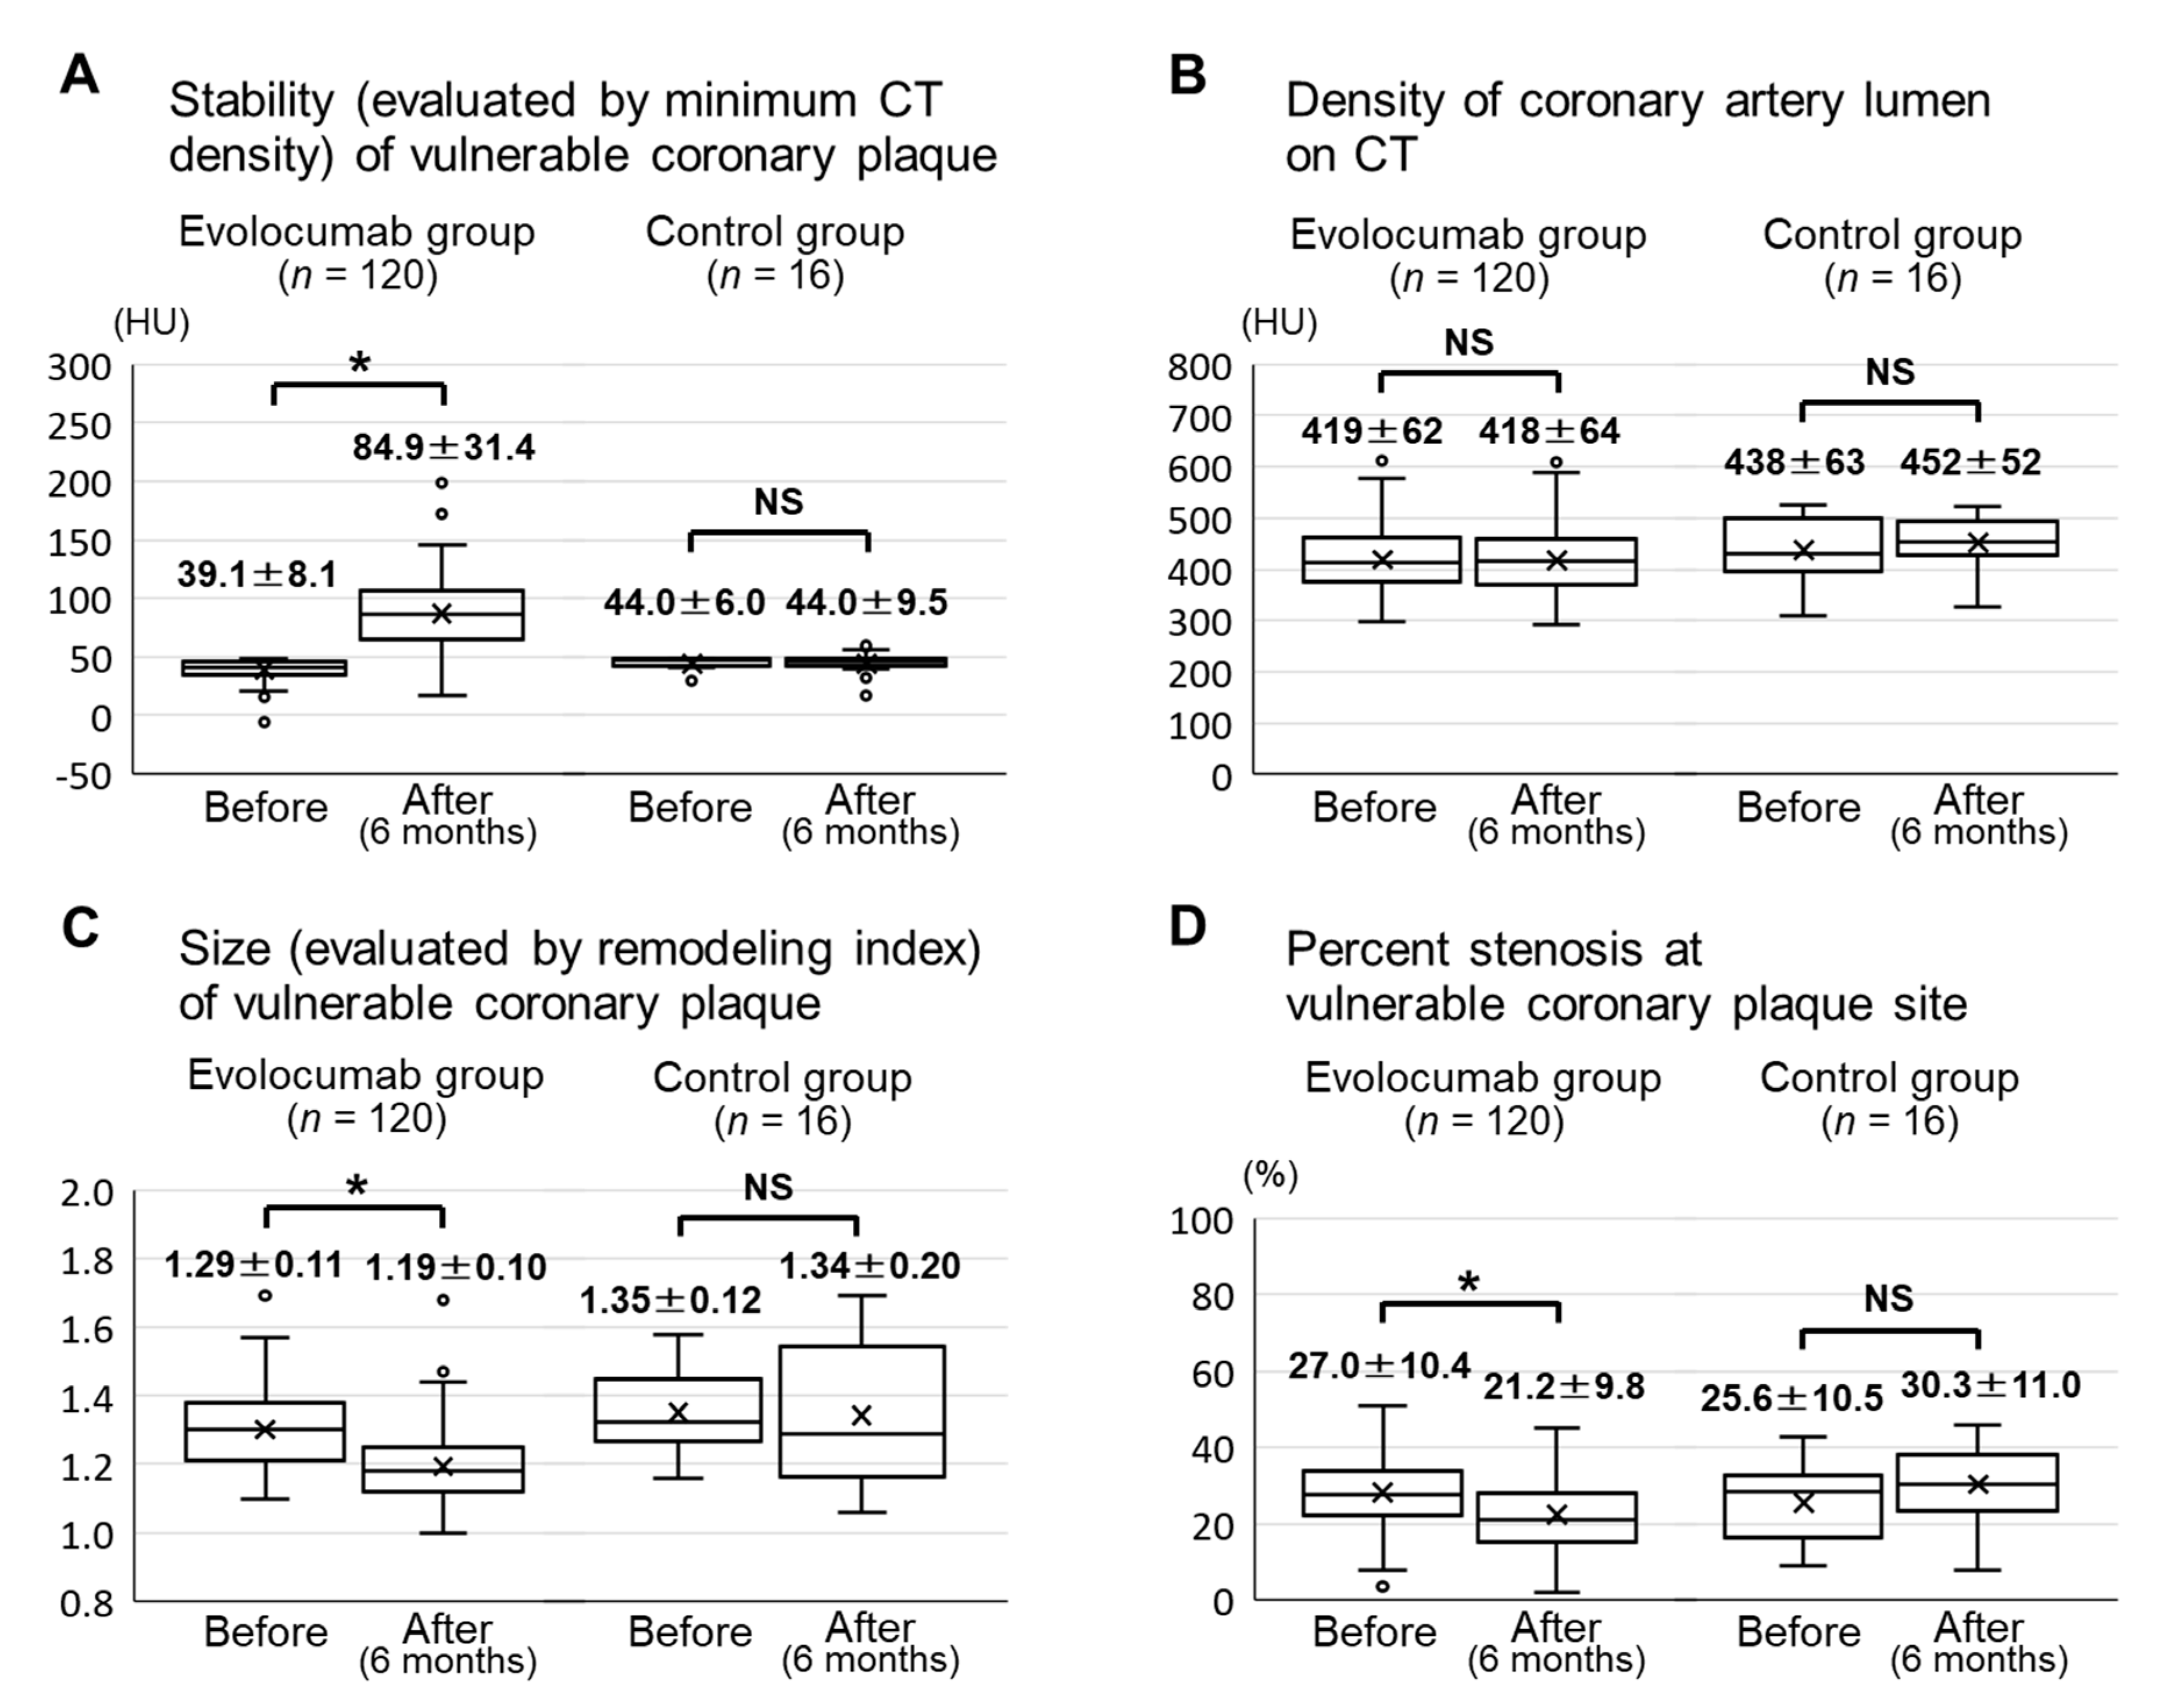
3.2. Effects of Evolocumab on Vulnerable Coronary Plaques, Assessed Using CT Angiography
3.3. Factors Associated with the Change in Stability and Size of Vulnerable Coronary Plaques
3.4. Changes in Lipid Parameters
3.5. Changes in Other Laboratory Parameters and Adverse Effects
4. Discussion
Author Contributions
Funding
Acknowledgments
Conflicts of Interest
References
- Sanchis-Gomar, F.; Perez-Quilis, C.; Leischik, R.; Lucia, A. Epidemiology of coronary heart disease and acute coronary syndrome. Ann. Transl. Med. 2016, 4, 256. [Google Scholar] [CrossRef] [PubMed]
- Naghavi, M.; Libby, P.; Falk, E.; Casscells, S.W.; Litovsky, S.; Rumberger, J.; Badimon, J.J.; Stefanadis, C.; Moreno, P.; Pasterkamp, G.; et al. From vulnerable plaque to vulnerable patient: A call for new definitions and risk assessment strategies: Part I. Circulation 2003, 108, 1664–1672. [Google Scholar] [CrossRef] [PubMed]
- Motoyama, S.; Ito, H.; Sarai, M.; Kondo, T.; Kawai, H.; Nagahara, Y.; Harigaya, H.; Kan, S.; Anno, H.; Takahashi, H.; et al. Plaque Characterization by Coronary Computed Tomography Angiography and the Likelihood of Acute Coronary Events in Mid-Term Follow-Up. J. Am. Coll. Cardiol. 2015, 66, 337–346. [Google Scholar] [CrossRef]
- Marwan, M.; Taher, M.A.; El Meniawy, K.; Awadallah, H.; Pflederer, T.; Schuhback, A.; Ropers, D.; Daniel, W.G.; Achenbach, S. In vivo CT detection of lipid-rich coronary artery atherosclerotic plaques using quantitative histogram analysis: A head to head comparison with IVUS. Atherosclerosis 2011, 215, 110–115. [Google Scholar] [CrossRef]
- Schlett, C.L.; Maurovich-Horvat, P.; Ferencik, M.; Alkadhi, H.; Stolzmann, P.; Scheffel, H.; Seifarth, H.; Nakano, M.; Do, S.; Vorpahl, M.; et al. Histogram analysis of lipid-core plaques in coronary computed tomographic angiography: Ex Vivo validation against histology. Investig. Radiol. 2013, 48, 646–653. [Google Scholar] [CrossRef] [PubMed]
- Andelius, L.; Mortensen, M.B.; Norgaard, B.L.; Abdulla, J. Impact of statin therapy on coronary plaque burden and composition assessed by coronary computed tomographic angiography: A systematic review and meta-analysis. Eur. Heart J. Cardiovasc. Imaging 2018, 19, 850–858. [Google Scholar] [CrossRef] [PubMed]
- Jellinger, P.S.; Handelsman, Y.; Rosenblit, P.D.; Bloomgarden, Z.T.; Fonseca, V.A.; Garber, A.J.; Grunberger, G.; Guerin, C.K.; Bell, D.S.H.; Mechanick, J.I.; et al. American Association of Clinical Endocrinologists and American College of Endocrinology Guidelines for Management of Dyslipidemia and Prevention of Cardiovascular Disease. Endocr. Pract. 2017, 23, 1–87. [Google Scholar] [CrossRef]
- Bayturan, O.; Kapadia, S.; Nicholls, S.J.; Tuzcu, E.M.; Shao, M.; Uno, K.; Shreevatsa, A.; Lavoie, A.J.; Wolski, K.; Schoenhagen, P.; et al. Clinical predictors of plaque progression despite very low levels of low-density lipoprotein cholesterol. J. Am. Coll. Cardiol. 2010, 55, 2736–2742. [Google Scholar] [CrossRef]
- Sabatine, M.S.; Giugliano, R.P.; Wiviott, S.D.; Raal, F.J.; Blom, D.J.; Robinson, J.; Ballantyne, C.M.; Somaratne, R.; Legg, J.; Wasserman, S.M.; et al. Efficacy and safety of evolocumab in reducing lipids and cardiovascular events. N. Engl. J. Med. 2015, 372, 1500–1509. [Google Scholar] [CrossRef]
- Kiyosue, A.; Honarpour, N.; Kurtz, C.; Xue, A.; Wasserman, S.M.; Hirayama, A. A Phase 3 Study of Evolocumab (AMG 145) in Statin-Treated Japanese Patients at High Cardiovascular Risk. Am. J. Cardiol. 2016, 117, 40–47. [Google Scholar] [CrossRef]
- Nicholls, S.J.; Puri, R.; Anderson, T.; Ballantyne, C.M.; Cho, L.; Kastelein, J.J.; Koenig, W.; Somaratne, R.; Kassahun, H.; Yang, J.; et al. Effect of Evolocumab on Progression of Coronary Disease in Statin-Treated Patients: The GLAGOV Randomized Clinical Trial. JAMA 2016, 316, 2373–2384. [Google Scholar] [CrossRef]
- Ahmadi, A.; Argulian, E.; Leipsic, J.; Newby, D.E.; Narula, J. From Subclinical Atherosclerosis to Plaque Progression and Acute Coronary Events: JACC State-of-the-Art Review. J. Am. Coll. Cardiol. 2019, 74, 1608–1617. [Google Scholar] [CrossRef]
- Matsuo, S.; Imai, E.; Horio, M.; Yasuda, Y.; Tomita, K.; Nitta, K.; Yamagata, K.; Tomino, Y.; Yokoyama, H.; Hishida, A.; et al. Revised equations for estimated GFR from serum creatinine in Japan. Am. J. Kidney Dis. 2009, 53, 982–992. [Google Scholar] [CrossRef] [PubMed]
- Pignoli, P.; Tremoli, E.; Poli, A.; Oreste, P.; Paoletti, R. Intimal plus medial thickness of the arterial wall: A direct measurement with ultrasound imaging. Circulation 1986, 74, 1399–1406. [Google Scholar] [CrossRef] [PubMed]
- Nair, S.B.; Malik, R.; Khattar, R.S. Carotid intima-media thickness: Ultrasound measurement, prognostic value and role in clinical practice. Postgrad. Med. J. 2012, 88, 694–699. [Google Scholar] [CrossRef]
- Ogata, T.; Yasaka, M.; Yamagishi, M.; Seguchi, O.; Nagatsuka, K.; Minematsu, K. Atherosclerosis found on carotid ultrasonography is associated with atherosclerosis on coronary intravascular ultrasonography. J. Ultrasound Med. 2005, 24, 469–474. [Google Scholar] [CrossRef] [PubMed]
- Hodis, H.N.; Mack, W.J.; LaBree, L.; Selzer, R.H.; Liu, C.R.; Liu, C.H.; Azen, S.P. The role of carotid arterial intima-media thickness in predicting clinical coronary events. Ann. Intern. Med. 1998, 128, 262–269. [Google Scholar] [CrossRef]
- Hirano, M.; Nakamura, T.; Kitta, Y.; Takishima, I.; Deyama, J.; Kobayashi, T.; Fujioka, D.; Saito, Y.; Watanabe, K.; Watanabe, Y.; et al. Short-term progression of maximum intima-media thickness of carotid plaque is associated with future coronary events in patients with coronary artery disease. Atherosclerosis 2011, 215, 507–512. [Google Scholar] [CrossRef]
- Cademartiri, F.; Mollet, N.R.; Runza, G.; Bruining, N.; Hamers, R.; Somers, P.; Knaapen, M.; Verheye, S.; Midiri, M.; Krestin, G.P.; et al. Influence of intracoronary attenuation on coronary plaque measurements using multislice computed tomography: Observations in an ex vivo model of coronary computed tomography angiography. Eur. Radiol. 2005, 15, 1426–1431. [Google Scholar] [CrossRef]
- Tomizawa, N.; Inoh, S.; Nojo, T.; Nakamura, S. Relationship of hepatic steatosis severity and coronary artery disease characteristics assessed by coronary CT angiography. Int. J. Cardiovasc. Imaging 2016, 32 (Suppl. S1), 73–82. [Google Scholar] [CrossRef]
- Motoyama, S.; Sarai, M.; Harigaya, H.; Anno, H.; Inoue, K.; Hara, T.; Naruse, H.; Ishii, J.; Hishida, H.; Wong, N.D.; et al. Computed tomographic angiography characteristics of atherosclerotic plaques subsequently resulting in acute coronary syndrome. J. Am. Coll. Cardiol. 2009, 54, 49–57. [Google Scholar] [CrossRef] [PubMed]
- Soeda, T.; Uemura, S.; Morikawa, Y.; Ishigami, K.; Okayama, S.; Hee, S.J.; Nishida, T.; Onoue, K.; Somekawa, S.; Takeda, Y.; et al. Diagnostic accuracy of dual-source computed tomography in the characterization of coronary atherosclerotic plaques: Comparison with intravascular optical coherence tomography. Int. J. Cardiol. 2011, 148, 313–318. [Google Scholar] [CrossRef] [PubMed]
- Komatsu, S.; Hirayama, A.; Omori, Y.; Ueda, Y.; Mizote, I.; Fujisawa, Y.; Kiyomoto, M.; Higashide, T.; Kodama, K. Detection of coronary plaque by computed tomography with a novel plaque analysis system, ‘Plaque Map’, and comparison with intravascular ultrasound and angioscopy. Circ. J. 2005, 69, 72–77. [Google Scholar] [CrossRef] [PubMed]
- Cheng, V.; Gutstein, A.; Wolak, A.; Suzuki, Y.; Dey, D.; Gransar, H.; Thomson, L.E.; Hayes, S.W.; Friedman, J.D.; Berman, D.S. Moving beyond binary grading of coronary arterial stenoses on coronary computed tomographic angiography: Insights for the imager and referring clinician. JACC Cardiovasc. Imaging 2008, 1, 460–471. [Google Scholar] [CrossRef]
- Libby, P. Inflammation in atherosclerosis. Nature 2002, 420, 868–874. [Google Scholar] [CrossRef]
- Benedek, T.; Jako, B.; Benedek, I. Plaque quantification by coronary CT and intravascular ultrasound identifies a low CT density core as a marker of plaque instability in acute coronary syndromes. Int. Heart J. 2014, 55, 22–28. [Google Scholar] [CrossRef]
- Zarins, C.K.; Weisenberg, E.; Kolettis, G.; Stankunavicius, R.; Glagov, S. Differential enlargement of artery segments in response to enlarging atherosclerotic plaques. J. Vasc. Surg. 1988, 7, 386–394. [Google Scholar] [CrossRef]
- Abdeldayem, E.H.; Ibrahim, A.S.; Ahmed, A.M.; Genedi, E.S.; Tantawy, W.H. Positive remodeling index by MSCT coronary angiography: A prognostic factor for early detection of plaque rupture and vulnerability. Egypt. J. Radiol. Nucl. Med. 2015, 46, 13–24. [Google Scholar] [CrossRef]
- Raffel, O.C.; Merchant, F.M.; Tearney, G.J.; Chia, S.; Gauthier, D.D.; Pomerantsev, E.; Mizuno, K.; Bouma, B.E.; Jang, I.K. In vivo association between positive coronary artery remodelling and coronary plaque characteristics assessed by intravascular optical coherence tomography. Eur. Heart J. 2008, 29, 1721–1728. [Google Scholar] [CrossRef]
- Thondapu, V.; Bourantas, C.V.; Foin, N.; Jang, I.K.; Serruys, P.W.; Barlis, P. Biomechanical stress in coronary atherosclerosis: Emerging insights from computational modelling. Eur. Heart J. 2017, 38, 81–92. [Google Scholar] [CrossRef]
- Zeb, I.; Li, D.; Nasir, K.; Malpeso, J.; Batool, A.; Flores, F.; Dailing, C.; Karlsberg, R.P.; Budoff, M. Effect of statin treatment on coronary plaque progression—A serial coronary CT angiography study. Atherosclerosis 2013, 231, 198–204. [Google Scholar] [CrossRef] [PubMed]
- Soeda, T.; Uemura, S.; Okayama, S.; Kawakami, R.; Sugawara, Y.; Nakagawa, H.; Matsumoto, T.; Sung, J.H.; Nishida, T.; Senoo, A.; et al. Intensive lipid-lowering therapy with rosuvastatin stabilizes lipid-rich coronary plaques. -Evaluation using dual-source computed tomography. Circ. J. 2011, 75, 2621–2627. [Google Scholar] [CrossRef] [PubMed]
- Ross, R. Atherosclerosis--an inflammatory disease. N. Engl. J. Med. 1999, 340, 115–126. [Google Scholar] [CrossRef]
- Karagiannis, A.D.; Liu, M.; Toth, P.P.; Zhao, S.; Agrawal, D.K.; Libby, P.; Chatzizisis, Y.S. Pleiotropic Anti-atherosclerotic Effects of PCSK9 InhibitorsFrom Molecular Biology to Clinical Translation. Curr. Atheroscler. Rep. 2018, 20, 20. [Google Scholar] [CrossRef] [PubMed]
- Peterson, A.S.; Fong, L.G.; Young, S.G. PCSK9 function and physiology. J. Lipid Res. 2008, 49, 1152–1156. [Google Scholar] [CrossRef]
- Adorni, M.P.; Cipollari, E.; Favari, E.; Zanotti, I.; Zimetti, F.; Corsini, A.; Ricci, C.; Bernini, F.; Ferri, N. Inhibitory effect of PCSK9 on Abca1 protein expression and cholesterol efflux in macrophages. Atherosclerosis 2017, 256, 1–6. [Google Scholar] [CrossRef] [PubMed]
- Kasichayanula, S.; Grover, A.; Emery, M.G.; Gibbs, M.A.; Somaratne, R.; Wasserman, S.M.; Gibbs, J.P. Clinical Pharmacokinetics and Pharmacodynamics of Evolocumab, a PCSK9 Inhibitor. Clin. Pharmacokinet. 2018, 57, 769–779. [Google Scholar] [CrossRef] [PubMed]


| Evolocumab Group (n = 82) | Control Group (n = 16) | p-Value | ||
|---|---|---|---|---|
| Age (years) | 73.4 ± 8.3 | 70.4 ± 10.2 | 0.23 | |
| Male sex (number, %) | 56 (68.3) | 12 (75.0) | 0.77 | |
| Body mass index (kg/m2) | 24.8 ± 3.6 | 23.8 ± 3.4 | 0.32 | |
| Systolic blood pressure (mmHg) | 134.1 ± 15.3 | 135.1 ± 10.5 | 0.79 | |
| Diastolic blood pressure (mmHg) | 78.7 ± 9.1 | 80.8 ± 8.6 | 0.40 | |
| Hypertension (number, %) | 64 (78.0) | 11 (68.8) | 0.52 | |
| Diabetes mellitus (number, %) | 43 (52.4) | 6 (37.5) | 0.41 | |
| Familial hypercholesterolemia (number, %) | 0 (0.0) | 0 (0.0) | --- | |
| Previous myocardial infarction (number, %) | 6 (7.3) | 0 (0.0) | 0.59 | |
| Severe carotid artery stenosis (number, %) | 2 (2.4) | 0 (0.0) | 1.00 | |
| Past or current smoking (number, %) | 51 (62.2) | 7 (43.8) | 0.27 | |
| Statin (number, %) | 82 (100) | 16 (100) | --- | |
| Ezetimibe (number, %) | 11 (13.4) | 2 (12.5) | 1.00 | |
| Probucol (number, %) | 3 (3.7) | 3 (18.8) | 0.05 | |
| Eicosapentaenoic acid (number, %) | 67 (81.7) | 9 (56.3) | 0.045 | |
| Antiplatelet agent (number, %) | 36 (43.9) | 4 (25.0) | 0.18 | |
| Renin-angiotensin system inhibitor (number, %) | 40 (48.8) | 6 (37.5) | 0.59 | |
| β-blocker (number, %) | 8 (9.8) | 0 (0.0) | 0.35 | |
| Calcium channel blocker (number, %) | 40 (48.8) | 8 (50.0) | 1.00 | |
| Diuretic (number, %) | 4 (4.9) | 1 (6.3) | 1.00 | |
| Metformin (number, %) | 16 (19.5) | 4 (25.0) | 0.73 | |
| Sodium glucose transporter-2 inhibitor (number, %) | 3 (3.7) | 0 (0.0) | 1.00 | |
| Dipeptidyl peptidase 4 inhibitor (number, %) | 16 (19.5) | 3 (18.8) | 1.00 | |
| Glucagon-like peptide-1 receptor agonist (number, %) | 16 (19.5) | 1 (6.3) | 0.29 | |
| Insulin (number, %) | 12 (14.6) | 2 (12.5) | 1.00 | |
| Mean IMT of carotid artery (mm) | 1.3 ± 0.2 | 1.1 ± 0.2 | 0.004 | |
| Maximum IMT of carotid artery (mm) | 2.4 ± 0.8 | 2.2 ± 0.7 | 0.38 | |
| Coronary vulnerable plaque (number) | 120 | 16 | ||
| Location of coronary vulnerable plaque | Left anterior descending artery (number, %) | 44 (36.7) | 10 (62.5) | 0.11 |
| Left circumflex artery (number, %) | 23 (19.2) | 0 (0.0) | ||
| Left main trunk (number, %) | 5 (4.1) | 1 (6.3) | ||
| Right coronary artery (number, %) | 48 (40.0) | 5 (31.3) | ||
| Statin | Dose (mg/day) | Evolocumab Group (Number, %) | Control Group (Number, %) |
|---|---|---|---|
| Atorvastatin | 5 | 10 (12.2) | 3 (18.8) |
| 10 | 8 (9.8) | 2 (12.5) | |
| 15 | 1 (1.2) | 0 (0.0) | |
| 20 | 0 (0.0) | 0 (0.0) | |
| Pitavastatin | 1 | 1 (1.2) | 0 (0.0) |
| 2 | 1 (1.2) | 0 (0.0) | |
| Pravastatin | 5 | 1 (1.2) | 0 (0.0) |
| 10 | 6 (7.3) | 2 (12.5) | |
| Rosuvastatin | 2.5 | 8 (9.8) | 3 (18.8) |
| 5 | 23 (28.0) | 4 (25.0) | |
| 7.5 | 5 (6.1) | 1 (6.3) | |
| 10 | 8 (9.8) | 0 (0.0) | |
| 15 | 3 (3.7) | 0 (0.0) | |
| 20 | 7 (8.5) | 1 (6.3) |
| Variables | Simple Linear Regression Analysis | Multivariate Linear Regression Analysis (p < 0.10) | |||
|---|---|---|---|---|---|
| Standard Coefficient | p Value | Standard Coefficient | p Value | ||
| Age (years) | −0.068 | 0.47 | |||
| Male sex (yes vs. no) | 0.020 | 0.83 | |||
| Body mass index (kg/m2) | −0.024 | 0.80 | |||
| Systolic blood pressure (mmHg) | −0.050 | 0.59 | |||
| Diastolic blood pressure (mmHg) | 0.140 | 0.14 | |||
| HDL-cholesterol (mg/dL) | 0.015 | 0.88 | |||
| Change in HDL-cholesterol (mg/dL) | 0.142 | 0.13 | |||
| LDL-cholesterol (mg/dL) | 0.007 | 0.94 | |||
| Change in LDL-cholesterol (mg/dL) | 0.034 | 0.72 | |||
| LDL-cholesterol < 70 mg/dL (yes vs. no) | 0.039 | 0.68 | |||
| Log-triglyceride (mg/dL) | −0.022 | 0.81 | |||
| Change in log-triglyceride (mg/dL) | −0.070 | 0.46 | |||
| Log-lipoprotein (a) (mg/dL) | −0.077 | 0.43 | |||
| Change in log-lipoprotein (a) (mg/dL) | −0.019 | 0.84 | |||
| Eicosapentaenoic acid to arachidonic acid ratio | 0.012 | 0.90 | |||
| Uric acid (mg/dL) | 0.079 | 0.41 | |||
| Change in uric acid (mg/dL) | 0.007 | 0.94 | |||
| HbA1c (%) | −0.062 | 0.52 | |||
| Change in HbA1c (%) | 0.115 | 0.22 | |||
| eGFR (mL/min/1.73 m2) | −0.047 | 0.62 | |||
| Change in eGFR (mL/min/1.73 m2) | 0.011 | 0.91 | |||
| Log-urine albumin/creatinine ratio (mg/gCr) | −0.035 | 0.72 | |||
| Hypertension (yes vs. no) | −0.083 | 0.38 | |||
| Diabetes mellitus (yes vs. no) | 0.073 | 0.44 | |||
| Previous myocardial infarction (yes vs. no) | 0.184 | 0.049 | 0.193 | 0.12 | |
| Past or current smoking (yes vs. no) | 0.129 | 0.17 | |||
| Statin (yes vs. no) | 0.000 | −−− | |||
| Ezetimibe (yes vs. no) | 0.073 | 0.44 | |||
| Probucol (yes vs. no) | 0.145 | 0.12 | |||
| Eicosapentaenoic acid (yes vs. no) | −0.003 | 0.98 | |||
| Antiplatelet agent (yes vs. no) | −0.040 | 0.67 | |||
| Renin–angiotensin system inhibitor (yes vs. no) | −0.060 | 0.53 | |||
| β-blocker (yes vs. no) | −0.051 | 0.59 | |||
| Calcium channel blocker (yes vs. no) | −0.086 | 0.36 | |||
| Diuretic (yes vs. no) | 0.036 | 0.70 | |||
| Metformin (yes vs. no) | −0.156 | 0.10 | |||
| Sodium glucose transporter-2 inhibitor (yes vs. no) | 0.045 | 0.63 | |||
| Dipeptidyl peptidase 4 inhibitor (yes vs. no) | −0.024 | 0.80 | |||
| Glucagon-like peptide-1 receptor agonist (yes vs. no) | −0.129 | 0.17 | |||
| Insulin (yes vs. no) | 0.010 | 0.91 | |||
| Location of coronary vulnerable plaque (right coronary artery is the reference group) | Left anterior descending artery | 0.166 | 0.08 | 0.239 | 0.06 |
| Left circumflex artery | 0.061 | 0.52 | |||
| Left main trunk | 0.003 | 0.98 | |||
| Mean IMT of carotid artery (mm) | 0.179 | 0.06 | 0.041 | 0.74 | |
| Maximum IMT of carotid artery (mm) | 0.118 | 0.21 | |||
| Baseline minimum CT density of coronary plaque (HU) | −0.188 | 0.045 | −0.029 | 0.81 | |
| Baseline remodeling index of coronary plaque | 0.018 | 0.85 | |||
| Baseline percent stenosis at vulnerable coronary plaque site (%) | −0.393 | 0.002 | −0.391 | 0.002 | |
| Variables | Simple Linear Regression Analysis | Multivariate Linear Regression Analysis (p < 0.10) | |||
|---|---|---|---|---|---|
| Standard Coefficient | p Value | Standard Coefficient | p Value | ||
| Age (years) | 0.182 | 0.05 | 0.122 | 0.14 | |
| Male sex (yes vs. no) | 0.020 | 0.83 | |||
| Body mass index (kg/m2) | 0.054 | 0.57 | |||
| Systolic blood pressure (mmHg) | 0.008 | 0.93 | |||
| Diastolic blood pressure (mmHg) | −0.036 | 0.70 | |||
| HDL-cholesterol (mg/dL) | −0.056 | 0.55 | |||
| Change in HDL-cholesterol (mg/dL) | 0.048 | 0.61 | |||
| LDL-cholesterol (mg/dL) | 0.118 | 0.21 | |||
| Change in LDL-cholesterol (mg/dL) | −0.287 | 0.002 | −0.143 | 0.22 | |
| LDL-cholesterol < 70 mg/dL (yes vs. no) | −0.186 | 0.048 | 0.036 | 0.75 | |
| Log-triglyceride (mg/dL) | 0.044 | 0.65 | |||
| Change in log-triglyceride (mg/dL) | 0.040 | 0.67 | |||
| Log-lipoprotein (a) (mg/dL) | 0.061 | 0.53 | |||
| Change in log-lipoprotein (a) (mg/dL) | 0.030 | 0.76 | |||
| Eicosapentaenoic acid to arachidonic acid ratio | −0.117 | 0.22 | |||
| Uric acid (mg/dL) | −0.056 | 0.55 | |||
| Change in uric acid (mg/dL) | 0.114 | 0.23 | |||
| HbA1c (%) | 0.215 | 0.023 | 0.132 | 0.14 | |
| Change in HbA1c (%) | −0.190 | 0.043 | −0.093 | 0.25 | |
| eGFR (mL/min/1.73 m2) | 0.097 | 0.31 | |||
| Change in eGFR (mL/min/1.73 m2) | 0.021 | 0.82 | |||
| Log-urine albumin/creatinine ratio (mg/gCr) | 0.071 | 0.47 | |||
| Hypertension (yes vs. no) | 0.132 | 0.16 | |||
| Diabetes mellitus (yes vs. no) | −0.137 | 0.15 | |||
| Previous myocardial infarction (yes vs. no) | 0.085 | 0.37 | |||
| Past or current smoking (yes vs. no) | 0.081 | 0.39 | |||
| Statin (yes vs. no) | 0.000 | −−− | |||
| Ezetimibe (yes vs. no) | −0.154 | 0.10 | |||
| Probucol (yes vs. no) | −0.091 | 0.34 | |||
| Eicosapentaenoic acid (yes vs. no) | 0.006 | 0.95 | |||
| Antiplatelet agent (yes vs. no) | 0.148 | 0.12 | |||
| Renin–angiotensin system inhibitor (yes vs. no) | 0.202 | 0.031 | 0.126 | 0.15 | |
| β-blocker (yes vs. no) | −0.007 | 0.94 | |||
| Calcium channel blocker (yes vs. no) | −0.018 | 0.85 | |||
| Diuretic (yes vs. no) | −0.151 | 0.11 | |||
| Metformin (yes vs. no) | 0.020 | 0.84 | |||
| Sodium glucose transporter-2 inhibitor (yes vs. no) | 0.013 | 0.89 | |||
| Dipeptidyl peptidase 4 inhibitor (yes vs. no) | −0.147 | 0.12 | |||
| Glucagon-like peptide-1 receptor agonist (yes vs. no) | 0.041 | 0.67 | |||
| Insulin (yes vs. no) | 0.090 | 0.34 | |||
| Location of coronary vulnerable plaque (right coronary artery is the reference group) | Left anterior descending artery | −0.035 | 0.71 | ||
| Left circumflex artery | 0.084 | 0.37 | |||
| Left main trunk | −0.007 | 0.94 | |||
| Mean IMT of carotid artery (mm) | 0.054 | 0.57 | |||
| Maximum IMT of carotid artery (mm) | 0.038 | 0.69 | |||
| Baseline minimum CT density of coronary plaque (HU) | −0.017 | 0.86 | |||
| Baseline remodeling index of coronary plaque | −0.421 | <0.001 | −0.368 | <0.001 | |
| Baseline percent stenosis at vulnerable coronary plaque site (%) | 0.169 | 0.21 | |||
| Evolocumab Group (n = 82) | Control Group (n = 16) | |||||
|---|---|---|---|---|---|---|
| Baseline | 6 Month | p Value | Baseline | 6 Month | p Value | |
| Total cholesterol (mg/dL) | 149.9 ± 28.5 | 92.5 ± 22.4 | <0.001 | 174.3 ± 38.3 | 145.9 ± 22.6 | 0.021 |
| LDL-cholesterol (mg/dL) | 70.4 ± 21.5 | 19.3 ± 16.0 | <0.001 | 80.5 ± 28.4 | 68.6 ± 20.5 | 0.09 |
| HDL-cholesterol (mg/dL) | 53.2 ± 12.6 | 55.7 ± 13.3 | <0.001 | 61.6 ± 12.7 | 56.8 ± 13.2 | 0.10 |
| Triglycerides (mg/dL) | 111 (81–156) | 84 (62–120) | <0.001 | 101 (69–138) | 84 (55–158) | 0.25 |
| Lipoprotein(a) (mg/dL) | 14 (6–26) | 5 (2–14) | <0.001 | 16 (8–26) | 17 (6–29) | 0.44 |
| Uric acid (mg/dL) | 4.8 ± 1.0 | 4.7 ± 0.9 | 0.47 | 5.2 ± 1.1 | 5.0 ± 0.9 | 0.22 |
| HbA1c (%) | 6.3 ± 0.8 | 6.4 ± 0.9 | 0.09 | 6.3 ± 1.1 | 6.2 ± 0.6 | 0.62 |
| eGFR (mL/min/1.73 m2) | 68.1 ± 14.8 | 67.8 ± 14.5 | 0.79 | 77.2 ± 13.2 | 76.0 ± 13.9 | 0.45 |
| Urine albumin/creatinine ratio (mg/gCr) | 9.2 (5.1–28.9) | 9.4 (4.9–32.0) | 0.66 | 25.0 (9.0–66.9) | 26.4 (7.3–37.9) | 0.76 |
| Alanine aminotransferase (IU/L) | 21 (15–31) | 20 (15–30) | 0.95 | 18 (13–28) | 15 (13–19) | 0.19 |
| Creatine phosphokinase (IU/L) | 116 (80–177) | 118 (90–169) | 0.18 | 110 (92–151) | 117 (88–234) | 0.75 |
Publisher’s Note: MDPI stays neutral with regard to jurisdictional claims in published maps and institutional affiliations. |
© 2020 by the authors. Licensee MDPI, Basel, Switzerland. This article is an open access article distributed under the terms and conditions of the Creative Commons Attribution (CC BY) license (http://creativecommons.org/licenses/by/4.0/).
Share and Cite
Hirai, K.; Imamura, S.; Hirai, A.; Ookawara, S.; Morishita, Y. Effect of Evolocumab on Vulnerable Coronary Plaques: A Serial Coronary Computed Tomography Angiography Study. J. Clin. Med. 2020, 9, 3338. https://doi.org/10.3390/jcm9103338
Hirai K, Imamura S, Hirai A, Ookawara S, Morishita Y. Effect of Evolocumab on Vulnerable Coronary Plaques: A Serial Coronary Computed Tomography Angiography Study. Journal of Clinical Medicine. 2020; 9(10):3338. https://doi.org/10.3390/jcm9103338
Chicago/Turabian StyleHirai, Keiji, Shigeki Imamura, Aizan Hirai, Susumu Ookawara, and Yoshiyuki Morishita. 2020. "Effect of Evolocumab on Vulnerable Coronary Plaques: A Serial Coronary Computed Tomography Angiography Study" Journal of Clinical Medicine 9, no. 10: 3338. https://doi.org/10.3390/jcm9103338
APA StyleHirai, K., Imamura, S., Hirai, A., Ookawara, S., & Morishita, Y. (2020). Effect of Evolocumab on Vulnerable Coronary Plaques: A Serial Coronary Computed Tomography Angiography Study. Journal of Clinical Medicine, 9(10), 3338. https://doi.org/10.3390/jcm9103338