Alterations in Alzheimer’s Disease-Associated Gene Expression in Severe Obstructive Sleep Apnea Patients


 , , ,
, , ,  ,
, 
Abstract
1. Introduction
2. Methods
2.1. Ethical Considerations
2.2. Participants
2.3. RNA Isolation of the Study
2.4. Bioinformatics Analysis
2.5. Statistical Analysis
3. Results
3.1. Participant Characteristics
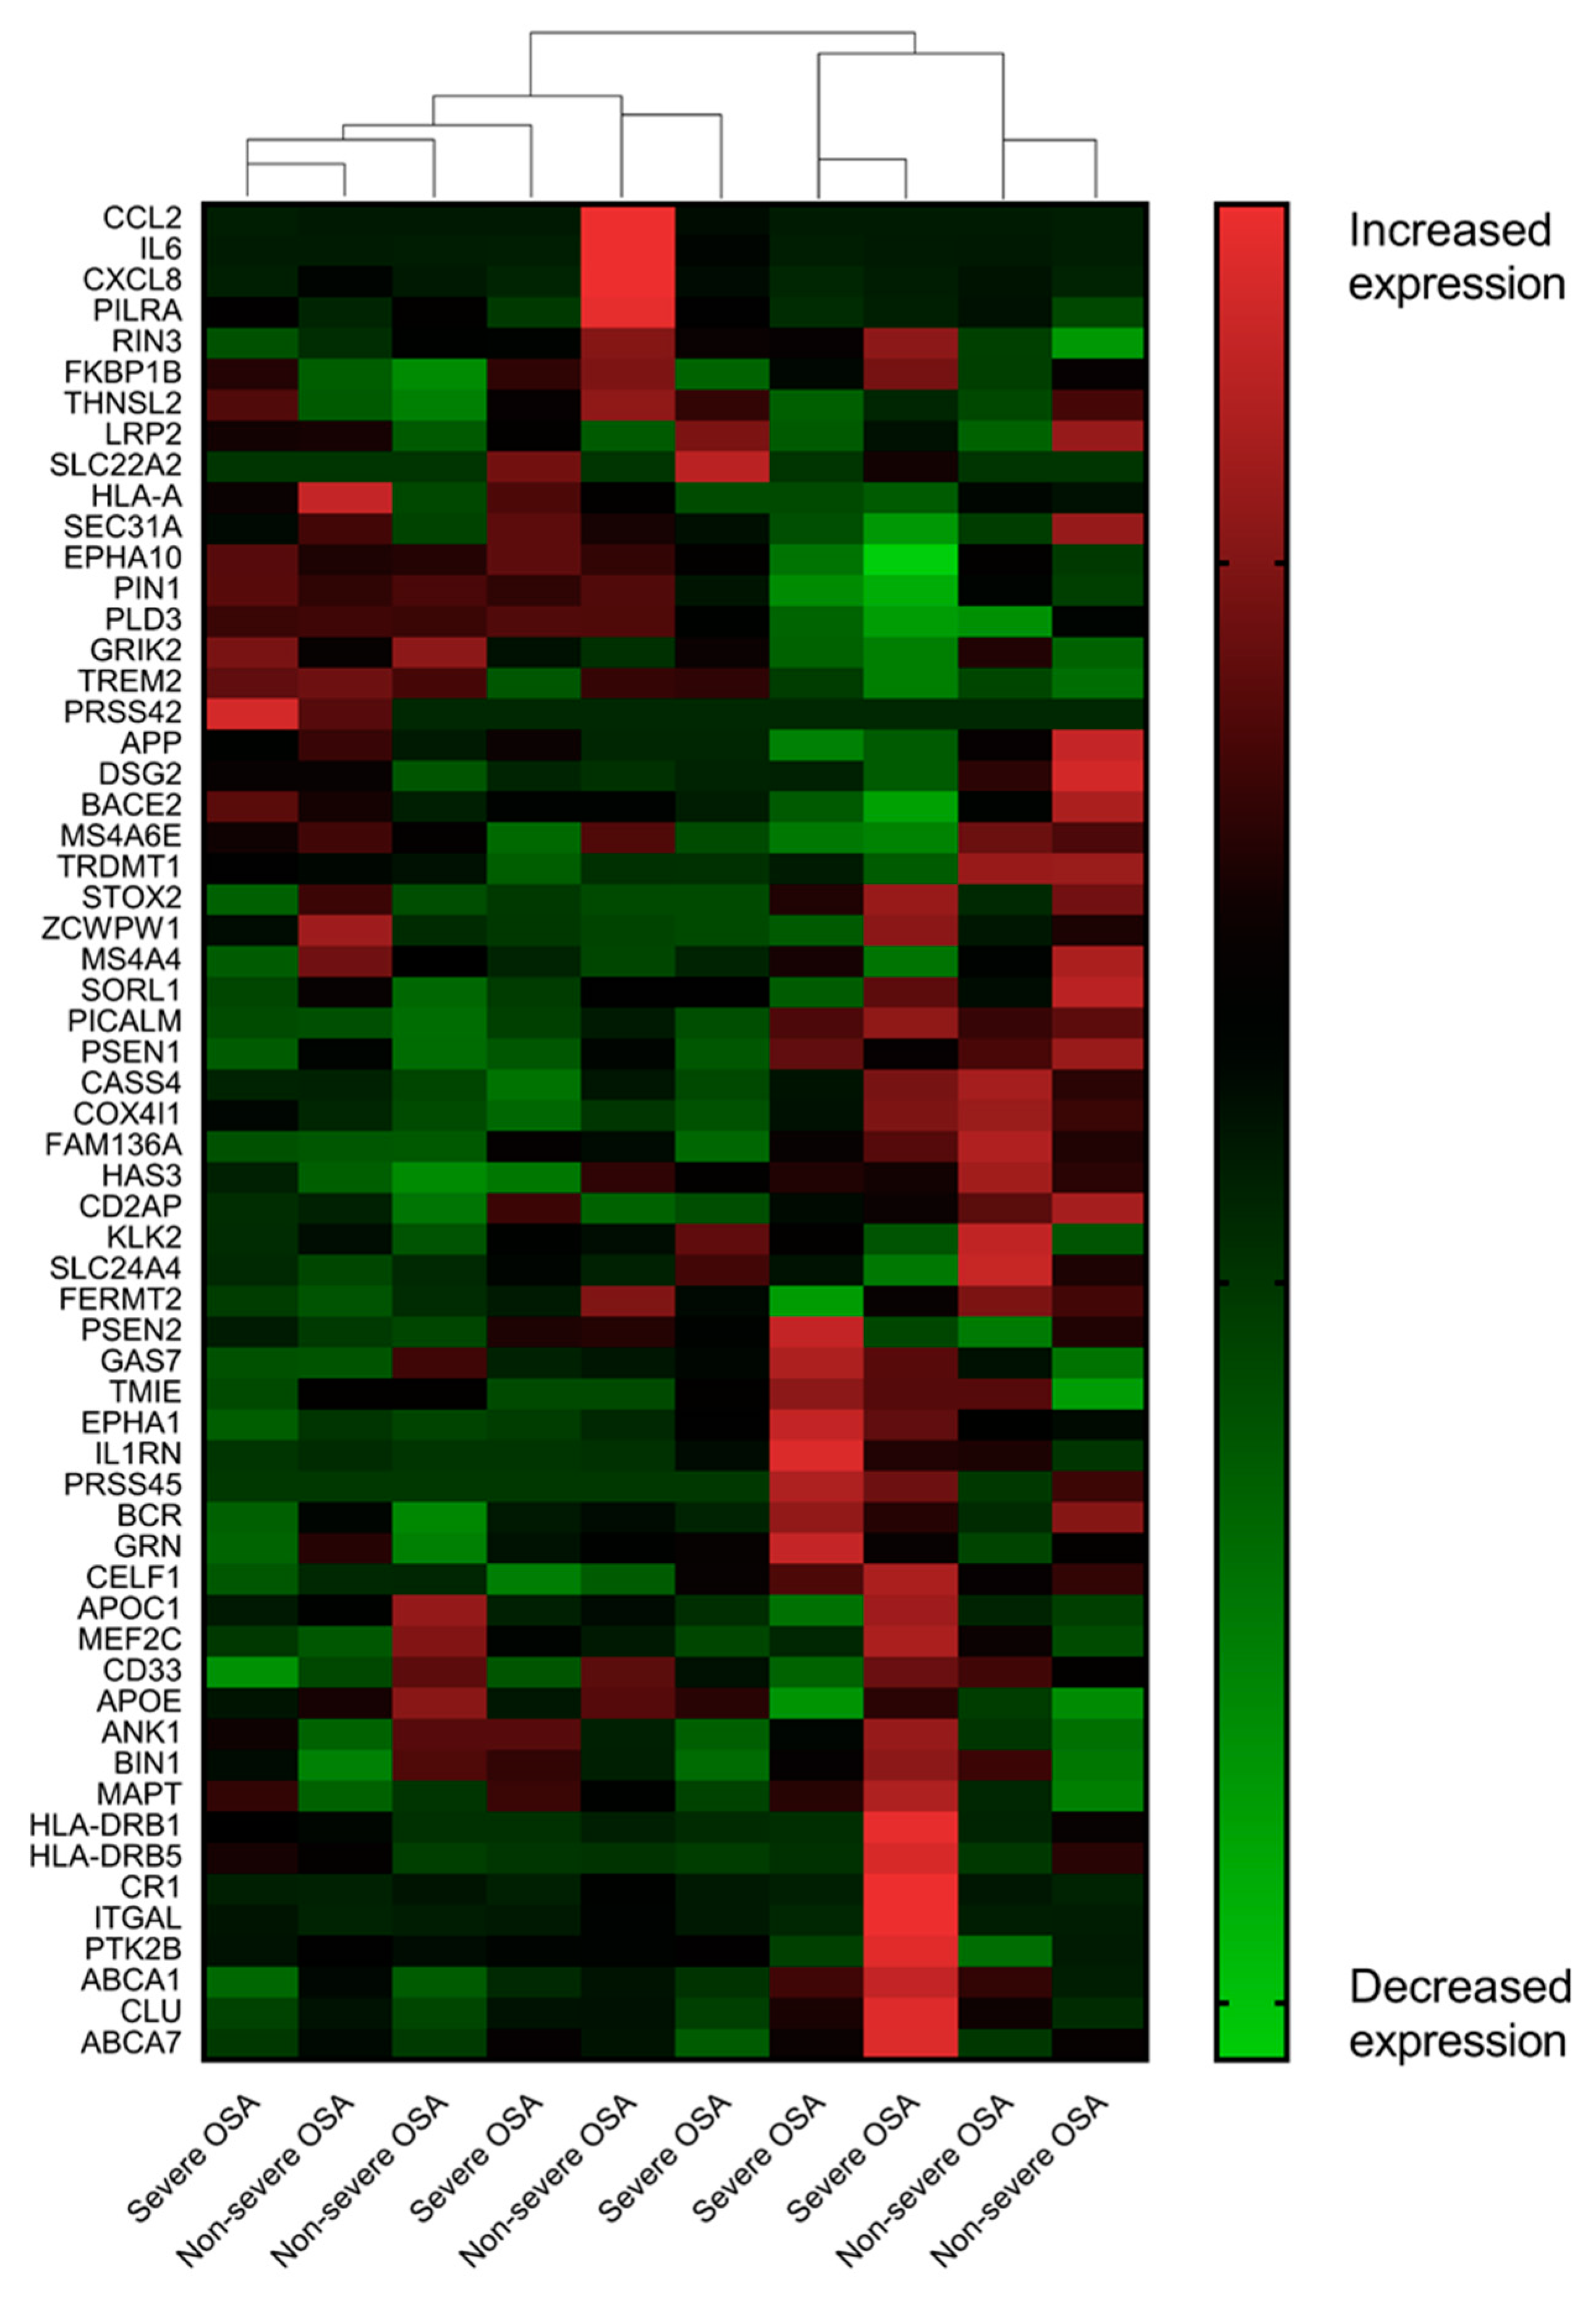
3.2. AD-Associated Transcriptomic Expression in the Uvular Tissue of the Patients with Severe OSA
4. Discussion
5. Conclusions
Supplementary Materials
Author Contributions
Funding
Acknowledgments
Conflicts of Interest
References
- Rosenzweig, I.; Glasser, M.; Polsek, D.; Leschziner, G.D.; Williams, S.C.R.; Morrell, M.J. Sleep apnoea and the brain: A complex relationship. Lancet Respir. Med. 2015, 3, 404–414. [Google Scholar] [CrossRef]
- Pan, W.; Kastin, A.J. Can sleep apnea cause Alzheimer’s disease? Neurosci. Biobehav. Rev. 2014, 47, 656–669. [Google Scholar] [CrossRef] [PubMed]
- Chang, W.P.; Liu, M.E.; Chang, W.C.; Yang, A.C.; Ku, Y.C.; Pai, J.T.; Huang, H.L.; Tsai, S.J. Sleep apnea and the risk of dementia: A population-based 5-year follow-up study in Taiwan. PLoS ONE 2013, 8, e78655. [Google Scholar] [CrossRef] [PubMed]
- Lee, J.E.; Yang, S.W.; Ju, Y.J.; Ki, S.K.; Chun, K.H. Sleep-disordered breathing and Alzheimer’s disease: A nationwide cohort study. Psychiatry Res. 2019, 273, 624–630. [Google Scholar] [CrossRef] [PubMed]
- Bubu, O.M.; Brannick, M.; Mortimer, J.; Umasabor-Bubu, O.; Sebastiao, Y.V.; Wen, Y.; Schwartz, S.; Borenstein, A.R.; Wu, Y.; Morgan, D.; et al. Sleep, Cognitive impairment, and Alzheimer’s disease: A Systematic Review and Meta-Analysis. Sleep 2017, 40. [Google Scholar] [CrossRef] [PubMed]
- Shi, L.; Chen, S.-J.; Ma, M.-Y.; Bao, Y.-P.; Han, Y.; Wang, Y.-M.; Shi, J.; Vitiello, M.V.; Lu, L. Sleep disturbances increase the risk of dementia: A systematic review and meta-analysis. Sleep Med. Rev. 2018, 40, 4–16. [Google Scholar] [CrossRef] [PubMed]
- Macedo, A.C.; Balouch, S.; Tabet, N. Is Sleep Disruption a Risk Factor for Alzheimer’s Disease? J. Alzheimer’s Dis. 2017, 58, 993–1002. [Google Scholar] [CrossRef] [PubMed]
- Guffanti, A.; Simchovitz, A.; Soreq, H. Emerging bioinformatics approaches for analysis of NGS-derived coding and non-coding RNAs in neurodegenerative diseases. Front. Cell. Neurosci. 2014, 8, 89. [Google Scholar] [CrossRef] [PubMed]
- Cruchaga, C.; Karch, C.M.; Jin, S.C.; Benitez, B.A.; Cai, Y.; Guerreiro, R.; Harari, O.; Norton, J.; Budde, J.; Bertelsen, S.; et al. Rare coding variants in the phospholipase D3 gene confer risk for Alzheimer’s disease. Nature 2014, 505, 550–554. [Google Scholar] [CrossRef] [PubMed]
- Gant, J.C.; Blalock, E.M.; Chen, K.C.; Kadish, I.; Porter, N.M.; Norris, C.M.; Thibault, O.; Landfield, P.W. FK506-binding protein 1b/12.6: A key to aging-related hippocampal Ca2+ dysregulation? Eur. J. Pharmacol. 2014, 739, 74–82. [Google Scholar] [CrossRef] [PubMed][Green Version]
- Sun, Q.; Xie, N.; Tang, B.; Li, R.; Shen, Y. Alzheimer’s Disease: From Genetic Variants to the Distinct Pathological Mechanisms. Front. Mol. Neurosci. 2017, 10, 319. [Google Scholar] [CrossRef] [PubMed]
- Alzheimer’s Association. 2015 Alzheimer’s disease facts and figures. Alzheimer’s Dement. 2015, 11, 332–384. [Google Scholar] [CrossRef]
- Hollingworth, P.; Harold, D.; Sims, R.; Gerrish, A.; Lambert, J.C.; Carrasquillo, M.M.; Abraham, R.; Hamshere, M.L.; Pahwa, J.S.; Moskvina, V.; et al. Common variants at ABCA7, MS4A6A/MS4A4E, EPHA1, CD33 and CD2AP are associated with Alzheimer’s disease. Nat. Genet. 2011, 43, 429–435. [Google Scholar] [CrossRef] [PubMed]
- Wavrant-De Vrieze, F.; Compton, D.; Womick, M.; Arepalli, S.; Adighibe, O.; Li, L.; Perez-Tur, J.; Hardy, J. ABCA1 polymorphisms and Alzheimer’s disease. Neurosci. Lett. 2007, 416, 180–183. [Google Scholar] [CrossRef] [PubMed]
- Chi, S.; Song, J.H.; Tan, M.S.; Zhang, W.; Wang, Z.X.; Jiang, T.; Tan, L.; Yu, J.T. Association of Single-Nucleotide Polymorphism in ANK1 with Late-Onset Alzheimer’s Disease in Han Chinese. Mol. Neurobiol. 2016, 53, 6476–6481. [Google Scholar] [CrossRef] [PubMed]
- Patel, T.; Brookes, K.J.; Turton, J.; Chaudhury, S.; Guetta-Baranes, T.; Guerreiro, R.; Bras, J.; Hernandez, D.; Singleton, A.; Francis, P.T.; et al. Whole-exome sequencing of the BDR cohort: evidence to support the role of the PILRA gene in Alzheimer’s disease. Neuropathol. Appl. Neurobiol. 2017. [Google Scholar] [CrossRef] [PubMed]
- Liu, C.C.; Liu, C.C.; Kanekiyo, T.; Xu, H.; Bu, G. Apolipoprotein E and Alzheimer disease: Risk, mechanisms and therapy. Nat. Rev. Neurol. 2013, 9, 106–118. [Google Scholar] [CrossRef] [PubMed]
- Yu, M.; Liu, Y.; Shen, J.; Lv, D.; Zhang, J. Meta-analysis of BACE1 gene rs638405 polymorphism and the risk of Alzheimer’s disease in Caucasion and Asian population. Neurosci. Lett. 2016, 616, 189–196. [Google Scholar] [CrossRef]
- Seshadri, S.; Fitzpatrick, A.L.; Ikram, M.A.; DeStefano, A.L.; Gudnason, V.; Boada, M.; Bis, J.C.; Smith, A.V.; Carassquillo, M.M.; Lambert, J.C.; et al. Genome-wide analysis of genetic loci associated with Alzheimer disease. JAMA 2010, 303, 1832–1840. [Google Scholar] [CrossRef] [PubMed]
- Lambert, J.C.; Ibrahim-Verbaas, C.A.; Harold, D.; Naj, A.C.; Sims, R.; Bellenguez, C.; DeStafano, A.L.; Bis, J.C.; Beecham, G.W.; Grenier-Boley, B.; et al. Meta-analysis of 74,046 individuals identifies 11 new susceptibility loci for Alzheimer’s disease. Nat. Genet. 2013, 45, 1452–1458. [Google Scholar] [CrossRef] [PubMed]
- Flex, A.; Giovannini, S.; Biscetti, F.; Liperoti, R.; Spalletta, G.; Straface, G.; Landi, F.; Angelini, F.; Caltagirone, C.; Ghirlanda, G.; et al. Effect of proinflammatory gene polymorphisms on the risk of Alzheimer’s disease. Neurodegener. Dis. 2014, 13, 230–236. [Google Scholar] [CrossRef] [PubMed]
- Naj, A.C.; Jun, G.; Beecham, G.W.; Wang, L.S.; Vardarajan, B.N.; Buros, J.; Gallins, P.J.; Buxbaum, J.D.; Jarvik, G.P.; Crane, P.K.; et al. Common variants at MS4A4/MS4A6E, CD2AP, CD33 and EPHA1 are associated with late-onset Alzheimer’s disease. Nat. Genet. 2011, 43, 436–441. [Google Scholar] [CrossRef] [PubMed]
- Harold, D.; Abraham, R.; Hollingworth, P.; Sims, R.; Gerrish, A.; Hamshere, M.L.; Pahwa, J.S.; Moskvina, V.; Dowzell, K.; Williams, A.; et al. Genome-wide association study identifies variants at CLU and PICALM associated with Alzheimer’s disease. Nat. Genet. 2009, 41, 1088–1093. [Google Scholar] [CrossRef] [PubMed]
- Lambert, J.C.; Heath, S.; Even, G.; Campion, D.; Sleegers, K.; Hiltunen, M.; Combarros, O.; Zelenika, D.; Bullido, M.J.; Tavernier, B.; et al. Genome-wide association study identifies variants at CLU and CR1 associated with Alzheimer’s disease. Nat. Genet. 2009, 41, 1094–1099. [Google Scholar] [CrossRef] [PubMed]
- Lu, J.; Wang, K.; Rodova, M.; Esteves, R.; Berry, D.; Lezi, E.; Crafter, A.; Barrett, M.; Cardoso, S.M.; Onyango, I.; et al. Polymorphic variation in cytochrome oxidase subunit genes. J. Alzheimer’s Dis. 2010, 21, 141–154. [Google Scholar] [CrossRef] [PubMed]
- Lalli, M.A.; Garcia, G.; Madrigal, L.; Arcos-Burgos, M.; Arcila, M.L.; Kosik, K.S.; Lopera, F. Exploratory data from complete genomes of familial alzheimer disease age-at-onset outliers. Hum. Mutat. 2012, 33, 1630–1634. [Google Scholar] [CrossRef] [PubMed]
- Srinivasan, K.; Friedman, B.A.; Larson, J.L.; Lauffer, B.E.; Goldstein, L.D.; Appling, L.L.; Borneo, J.; Poon, C.; Ho, T.; Cai, F.; et al. Untangling the brain’s neuroinflammatory and neurodegenerative transcriptional responses. Nat. Commun. 2016, 7, 11295. [Google Scholar] [CrossRef]
- Jin, S.C.; Pastor, P.; Cooper, B.; Cervantes, S.; Benitez, B.A.; Razquin, C.; Goate, A.; Ibero-American Alzheimer Disease Genetics Group Researchers; Cruchaga, C. Pooled-DNA sequencing identifies novel causative variants in PSEN1, GRN and MAPT in a clinical early-onset and familial Alzheimer’s disease Ibero-American cohort. Alzheimer’s Res. 2012, 4, 34. [Google Scholar] [CrossRef]
- Rasmussen, L.; Delabio, R.; Horiguchi, L.; Mizumoto, I.; Terazaki, C.R.; Mazzotti, D.; Bertolucci, P.H.; Pinhel, M.A.; Souza, D.; Krieger, H.; et al. Association between interleukin 6 gene haplotype and Alzheimer’s disease: A Brazilian case-control study. J Alzheimer’s Dis. 2013, 36, 733–738. [Google Scholar] [CrossRef]
- Wang, L.L.; Pan, X.L.; Wang, Y.; Tang, H.D.; Deng, Y.L.; Ren, R.J.; Xu, W.; Ma, J.F.; Wang, G.; Chen, S.D. A single nucleotide polymorphism in LRP2 is associated with susceptibility to Alzheimer’s disease in the Chinese population. Clin. Chim. Acta 2011, 412, 268–270. [Google Scholar] [CrossRef]
- Chandrasekaran, K.; Giordano, T.; Brady, D.R.; Stoll, J.; Martin, L.J.; Rapoport, S.I. Impairment in mitochondrial cytochrome oxidase gene expression in Alzheimer disease. Mol. Brain Res. 1994, 24, 336–340. [Google Scholar] [CrossRef]
- Arosio, B.; Bulbarelli, A.; Bastias Candia, S.; Lonati, E.; Mastronardi, L.; Romualdi, P.; Candeletti, S.; Gussago, C.; Galimberti, D.; Scarpini, E.; et al. Pin1 contribution to Alzheimer’s disease: Transcriptional and epigenetic mechanisms in patients with late-onset Alzheimer’s disease. Neurodegener. Dis. 2012, 10, 207–211. [Google Scholar] [CrossRef] [PubMed]
- Guerreiro, R.; Wojtas, A.; Bras, J.; Carrasquillo, M.; Rogaeva, E.; Majounie, E.; Cruchaga, C.; Sassi, C.; Kauwe, J.S.; Younkin, S.; et al. TREM2 variants in Alzheimer’s disease. N. Engl. J. Med. 2013, 368, 117–127. [Google Scholar] [CrossRef] [PubMed]
- Tarkowski, E.; Liljeroth, A.-M.; Nilsson, Å.; Minthon, L.; Blennow, K. Decreased Levels of Intrathecal Interleukin 1 Receptor Antagonist in Alzheimer’s Disease. Dement. Geriatr. Cogn. Disord. 2001, 12, 314–317. [Google Scholar] [CrossRef] [PubMed]
- Ashutosh; Kou, W.; Cotter, R.; Borgmann, K.; Wu, L.; Persidsky, R.; Sakhuja, N.; Ghorpade, A. CXCL8 protects human neurons from amyloid-beta-induced neurotoxicity: Relevance to Alzheimer’s disease. Biochem. Biophys. Res. Commun. 2011, 412, 565–571. [Google Scholar] [CrossRef] [PubMed]
- Listi, F.; Candore, G.; Balistreri, C.R.; Grimaldi, M.P.; Orlando, V.; Vasto, S.; Colonna-Romano, G.; Lio, D.; Licastro, F.; Franceschi, C.; et al. Association between the HLA-A2 allele and Alzheimer disease. Rejuvenation Res. 2006, 9, 99–101. [Google Scholar] [CrossRef]
- Jones, L.; Harold, D.; Williams, J. Genetic evidence for the involvement of lipid metabolism in Alzheimer’s disease. Biochim. Biophys. Acta 2010, 1801, 754–761. [Google Scholar] [CrossRef] [PubMed]
- Yun, C.-H.; Lee, H.-Y.; Lee, S.K.; Kim, H.; Seo, H.S.; Bang, S.; Kim, S.E.; Greve, D.N.; Au, R.; Shin, C. Amyloid burden in obstructive sleep apnea. J. Alzheimer’s Dis. 2017, 59, 21–29. [Google Scholar] [CrossRef]
- Ju, Y.E.S.; Finn, M.B.; Sutphen, C.L.; Herries, E.M.; Jerome, G.M.; Ladenson, J.H.; Crimmins, D.L.; Fagan, A.M.; Holtzman, D.M. Obstructive sleep apnea decreases central nervous system-derived proteins in the cerebrospinal fluid. Ann. Neurol. 2016, 80, 154–159. [Google Scholar] [CrossRef]
- Osorio, R.S.; Ayappa, I.; Mantua, J.; Gumb, T.; Varga, A.; Mooney, A.M.; Burschtin, O.E.; Taxin, Z.; During, E.; Spector, N. The interaction between sleep-disordered breathing and apolipoprotein E genotype on cerebrospinal fluid biomarkers for Alzheimer’s disease in cognitively normal elderly individuals. Neurobiol. Aging 2014, 35, 1318–1324. [Google Scholar] [CrossRef]
- Bubu, O.M.; Pirraglia, E.; Andrade, A.G.; Sharma, R.A.; Gimenez-Badia, S.; Umasabor-Bubu, O.Q.; Hogan, M.M.; Shim, A.M.; Mukhtar, F.; Sharma, N. Obstructive sleep apnea and longitudinal Alzheimer’s disease biomarker changes. Sleep 2019, 42, zsz048. [Google Scholar] [CrossRef] [PubMed]
- Liguori, C.; Mercuri, N.B.; Izzi, F.; Romigi, A.; Cordella, A.; Sancesario, G.; Placidi, F. Obstructive sleep apnea is associated with early but possibly modifiable Alzheimer’s disease biomarkers changes. Sleep 2017, 40, zsx011. [Google Scholar] [CrossRef] [PubMed]
- Maimon, N.; Hanly, P.J. Does snoring intensity correlate with the severity of obstructive sleep apnea? J. Clin. Sleep Med. 2010, 6, 475–478. [Google Scholar] [PubMed]
- Folstein, M.F.; Folstein, S.E.; McHugh, P.R. “Mini-mental state”. J. Psychiatr. Res. 1975, 12, 189–198. [Google Scholar] [CrossRef]
- Wang, Z.; Gerstein, M.; Snyder, M. RNA-Seq: A revolutionary tool for transcriptomics. Nat. Rev. Genet. 2009, 10, 57–63. [Google Scholar] [CrossRef] [PubMed]
- Li, B.; Dewey, C.N. RSEM: Accurate transcript quantification from RNA-Seq data with or without a reference genome. BMC Bioinform. 2011, 12, 323. [Google Scholar] [CrossRef] [PubMed]
- Audic, S.; Claverie, J.M. The significance of digital gene expression profiles. Genome Res. 1997, 7, 986–995. [Google Scholar] [CrossRef] [PubMed]
- Benjamini, Y.; Yekutieli, D. The control of the false discovery rate in multiple testing under dependency. Ann Stat. 2001, 29, 1165–1188. [Google Scholar] [CrossRef]
- Huang, W.; Sherman, B.T.; Lempicki, R.A. Systematic and integrative analysis of large gene lists using DAVID bioinformatics resources. Nat. Protoc. 2009, 4, 44–57. [Google Scholar] [CrossRef]
- Kanehisa, M.; Araki, M.; Goto, S.; Hattori, M.; Hirakawa, M.; Itoh, M.; Katayama, T.; Kawashima, S.; Okuda, S.; Tokimatsu, T.; et al. KEGG for linking genomes to life and the environment. Nucleic Acids Res. 2008, 36, D480–D484. [Google Scholar] [CrossRef]
- Dong, H.K.; Gim, J.A.; Yeo, S.H.; Kim, H.S. Integrated late onset Alzheimer’s disease (LOAD) susceptibility genes: Cholesterol metabolism and trafficking perspectives. Gene 2017, 597, 10–16. [Google Scholar] [CrossRef] [PubMed]
- Payao, S.L.; Goncalves, G.M.; de Labio, R.W.; Horiguchi, L.; Mizumoto, I.; Rasmussen, L.T.; de Souza Pinhel, M.A.; Silva Souza, D.R.; Bechara, M.D.; Chen, E.; et al. Association of interleukin 1beta polymorphisms and haplotypes with Alzheimer’s disease. J. Neuroimmunol. 2012, 247, 59–62. [Google Scholar] [CrossRef] [PubMed]
- Zhong, A.; Xiong, X.; Shi, M.; Xu, H. Roles of interleukin (IL)-6 gene polymorphisms, serum IL-6 levels, and treatment in obstructive sleep apnea: A meta-analysis. Sleep Breath 2016, 20, 719–731. [Google Scholar] [CrossRef] [PubMed]
- Chuang, L.P.; Chen, N.H.; Lin, Y.; Ko, W.S.; Pang, J.H. Increased MCP-1 gene expression in monocytes of severe OSA patients and under intermittent hypoxia. Sleep Breath 2016, 20, 425–433. [Google Scholar] [CrossRef] [PubMed]
- Honma, T.; Hatta, K.; Hitomi, Y.; Kambayashi, Y.; Hibino, Y.; Konoshita, T.; Nakamura, H. Increased systemic inflammatory interleukin-1ss and interleukin-6 during agitation as predictors of Alzheimer’s disease. Int. J. Geriatr. Psychiatry 2013, 28, 233–241. [Google Scholar] [CrossRef] [PubMed]
- Galimberti, D.; Fenoglio, C.; Lovati, C.; Venturelli, E.; Guidi, I.; Corra, B.; Scalabrini, D.; Clerici, F.; Mariani, C.; Bresolin, N.; et al. Serum MCP-1 levels are increased in mild cognitive impairment and mild Alzheimer’s disease. Neurobiol. Aging 2006, 27, 1763–1768. [Google Scholar] [CrossRef] [PubMed]
- Tan, Z.S.; Beiser, A.S.; Vasan, R.S.; Roubenoff, R.; Dinarello, C.A.; Harris, T.B.; Benjamin, E.J.; Au, R.; Kiel, D.P.; Wolf, P.A.; et al. Inflammatory markers and the risk of Alzheimer disease: The Framingham Study. Neurology 2007, 68, 1902–1908. [Google Scholar] [CrossRef]
- Sattlecker, M.; Khondoker, M.; Proitsi, P.; Williams, S.; Soininen, H.; Kloszewska, I.; Mecocci, P.; Tsolaki, M.; Vellas, B.; Lovestone, S.; et al. Longitudinal Protein Changes in Blood Plasma Associated with the Rate of Cognitive Decline in Alzheimer’s Disease. J. Alzheimer’s Dis. 2016, 49, 1105–1114. [Google Scholar] [CrossRef]
- Pennisi, M.; Crupi, R.; Di Paola, R.; Ontario, M.L.; Bella, R.; Calabrese, E.J.; Crea, R.; Cuzzocrea, S.; Calabrese, V. Inflammasomes, hormesis, and antioxidants in neuroinflammation: Role of NRLP3 in Alzheimer disease. J. Neurosci. Res. 2017, 95, 1360–1372. [Google Scholar] [CrossRef]
- Emamian, F.; Khazaie, H.; Tahmasian, M.; Leschziner, G.D.; Morrell, M.J.; Hsiung, G.Y.; Rosenzweig, I.; Sepehry, A.A. The Association Between Obstructive Sleep Apnea and Alzheimer’s Disease: A Meta-Analysis Perspective. Front. Aging Neurosci. 2016, 8, 78. [Google Scholar] [CrossRef]
- Ancoli-Israel, S.; Klauber, M.R.; Butters, N.; Parker, L.; Kripke, D.F. Dementia in Institutionalized Elderly: Relation to Sleep Apnea. J. Am. Geriatr. Soc. 1991, 39, 258–263. [Google Scholar] [CrossRef] [PubMed]


| Variables | Severe OSA | Non-Severe OSA | Effect Size | p-Value |
|---|---|---|---|---|
| Patients | n = 5 | n = 5 | ||
| Age (years), mean (SD) | 34.6 (4.2) | 41.2 (12.0) | 0.73 | 0.07 |
| Male sex, n (%) | 5 (100) | 4 (80) | >0.99 | |
| BMI (kg/m2), mean (SD) | 26.4 (3.2) | 25.5 (2.9) | 0.30 | 0.07 |
| AHI (events/h), mean (SD) | 60.6 (21.2) | 7.0 (4.3) | 3.50 | <0.001 |
| Minimum SpO2 (%), mean (SD) | 79.0 (6.0) | 85.2 (2.3) | 1.37 | 0.06 |
| Time SpO2 < 85% (%), mean (SD) | 1.66 (2.3) | 0.04 (0.04) | 1.00 | 0.15 |
| Gene Symbol | Expression | Log2(Fold Change) | Regulation | Probability | |
|---|---|---|---|---|---|
| Severe OSA | Non-Severe OSA | ||||
| Early-onset Alzheimer’s disease | |||||
| APP | 382.418 | 587.644 | −0.619 | Down | 0.503 |
| PSEN1 | 12.776 | 14.876 | −0.220 | Down | 0.286 |
| PSEN2 | 7.204 | 6.208 | 0.215 | Up | 0.265 |
| FKBP1B | 3.786 | 4.126 | −0.124 | Down | 0.216 |
| Late-onset Alzheimer’s disease | |||||
| CCL2 | 12.992 | 116.716 | −3.167 | Down | 0.868 a |
| IL6 | 2.854 | 33.06 | −3.534 | Down | 0.857 a |
| CXCL8 | 2.042 | 20.058 | −3.296 | Down | 0.824 a |
| HLA-A | 1.272 | 14.006 | −3.460 | Down | 0.811 a |
| IL1RN | 239.35 | 57.236 | 2.064 | Up | 0.806 a |
| CLU | 490.412 | 308.192 | 0.670 | Up | 0.522 |
| BIN1 | 23.218 | 18.884 | 0.298 | Up | 0.335 |
| APOE | 24.526 | 29.308 | −0.257 | Down | 0.318 |
| SORL1 | 8.136 | 9.338 | −0.199 | Down | 0.267 |
| PICALM | 56.394 | 52.512 | 0.103 | Up | 0.233 |
| Term | Count | Percentage | p-Value | Adjusted p-Value |
|---|---|---|---|---|
| Malaria | 3 | 0.8 | <0.001 | 0.007 a |
| NOD-like receptor signaling pathway | 3 | 0.8 | <0.001 | 0.005 a |
| Rheumatoid arthritis | 3 | 0.8 | <0.001 | 0.008 a |
| Chagas disease | 3 | 0.8 | <0.001 | 0.008 a |
| Influenza A | 3 | 0.8 | 0.002 | 0.02 a |
| Herpes simplex infection | 3 | 0.8 | 0.002 | 0.02 a |
| Cytokine–cytokine receptor interaction | 3 | 0.8 | 0.003 | 0.02 a |
| Graft-versus-host disease | 2 | 0.5 | 0.01 | 0.09 |
| Legionellosis | 2 | 0.5 | 0.02 | 0.12 |
| Pertussis | 2 | 0.5 | 0.03 | 0.15 |
| Salmonella infection | 2 | 0.5 | 0.04 | 0.15 |
| Amoebiasis | 2 | 0.5 | 0.045 | 0.18 |
| TNF signaling pathway | 2 | 0.5 | 0.045 | 0.18 |
| Toll-like receptor signaling pathway | 2 | 0.5 | 0.045 | 0.18 |
| Hepatitis B | 2 | 0.5 | 0.06 | 0.22 |
| Non-alcoholic fatty liver disease | 2 | 0.5 | 0.06 | 0.21 |
| Transcriptional misregulation in cancer | 2 | 0.5 | 0.07 | 0.22 |
| Chemokine signaling pathway | 2 | 0.5 | 0.08 | 0.23 |
© 2019 by the authors. Licensee MDPI, Basel, Switzerland. This article is an open access article distributed under the terms and conditions of the Creative Commons Attribution (CC BY) license (http://creativecommons.org/licenses/by/4.0/).
Share and Cite
Li, H.-Y.; Tsai, M.-S.; Huang, C.-G.; Wang, R.Y.L.; Chuang, L.-P.; Chen, N.-H.; Liu, C.-H.; Hsu, C.-M.; Cheng, W.-N.; Lee, L.-A. Alterations in Alzheimer’s Disease-Associated Gene Expression in Severe Obstructive Sleep Apnea Patients. J. Clin. Med. 2019, 8, 1361. https://doi.org/10.3390/jcm8091361
Li H-Y, Tsai M-S, Huang C-G, Wang RYL, Chuang L-P, Chen N-H, Liu C-H, Hsu C-M, Cheng W-N, Lee L-A. Alterations in Alzheimer’s Disease-Associated Gene Expression in Severe Obstructive Sleep Apnea Patients. Journal of Clinical Medicine. 2019; 8(9):1361. https://doi.org/10.3390/jcm8091361
Chicago/Turabian StyleLi, Hsueh-Yu, Ming-Shao Tsai, Chung-Guei Huang, Robert Y. L. Wang, Li-Pang Chuang, Ning-Hung Chen, Chi-Hung Liu, Cheng-Ming Hsu, Wen-Nuan Cheng, and Li-Ang Lee. 2019. "Alterations in Alzheimer’s Disease-Associated Gene Expression in Severe Obstructive Sleep Apnea Patients" Journal of Clinical Medicine 8, no. 9: 1361. https://doi.org/10.3390/jcm8091361
APA StyleLi, H.-Y., Tsai, M.-S., Huang, C.-G., Wang, R. Y. L., Chuang, L.-P., Chen, N.-H., Liu, C.-H., Hsu, C.-M., Cheng, W.-N., & Lee, L.-A. (2019). Alterations in Alzheimer’s Disease-Associated Gene Expression in Severe Obstructive Sleep Apnea Patients. Journal of Clinical Medicine, 8(9), 1361. https://doi.org/10.3390/jcm8091361