The Polymorphisms of the Peroxisome-Proliferator Activated Receptors’ Alfa Gene Modify the Aerobic Training Induced Changes of Cholesterol and Glucose


 , and
, and
Abstract
1. Introduction
2. Experimental Section
2.1. Ethics Statement
2.2. Participants
2.3. Training Intervention
2.4. Body Composition Measurements
2.5. Biochemical Analyses
2.6. Genetic Analyses
2.7. Statistical Analyses
3. Results
4. Discussion
5. Conclusions
Supplementary Materials
Author Contributions
Funding
Acknowledgments
Conflicts of Interest
References
- Desvergne, B.; Wahli, W. Peroxisome proliferator-activated receptors: Nuclear control of metabolism. Endocr. Rev. 1999, 20, 649–688. [Google Scholar] [PubMed]
- Auboeuf, D.; Rieusset, J.; Fajas, L.; Vallier, P.; Frering, V.; Riou, J.P.; Staels, B.; Auwerx, J.; Laville, M.; Vidal, H. Tissue distribution and quantification of the expression of mRNAs of peroxisome proliferator–activated receptors and liver X receptor-α in humans: No alteration in adipose tissue of obese and NIDDM patients. Diabetes 1997, 46, 1319–1327. [Google Scholar]
- Mukherjee, R.; Jow, L.; Croston, G.E.; Paterniti, J.R. Identification, characterization, and tissue distribution of human peroxisome proliferator-activated receptor (PPAR) isoforms PPARγ2 versus PPARγ1 and activation with retinoid X receptor agonists and antagonists. J. Biol. Chem. 1997, 272, 8071–8076. [Google Scholar] [CrossRef] [PubMed]
- Palmer, C.N.; Hsu, M.-H.; Griffin, K.J.; Raucy, J.L.; Johnson, E.F. Peroxisome proliferator activated receptor-α expression in human liver. Mol. Pharm. 1998, 53, 14–22. [Google Scholar] [CrossRef]
- Willson, T.M.; Wahli, W. Peroxisome proliferator-activated receptor agonists. Curr. Opin. Chem. Biol. 1997, 1, 235–241. [Google Scholar] [CrossRef]
- Dowell, P.; Peterson, V.J.; Zabriskie, T.M.; Leid, M. Ligand-induced peroxisome proliferator-activated receptor α conformational change. J. Biol. Chem. 1997, 272, 2013–2020. [Google Scholar] [CrossRef] [PubMed]
- Kliewer, S.A.; Sundseth, S.S.; Jones, S.A.; Brown, P.J.; Wisely, G.B.; Koble, C.S.; Devchand, P.; Wahli, W.; Willson, T.M.; Lenhard, J.M.; et al. Fatty acids and eicosanoids regulate gene expression through direct interactions with peroxisome proliferator-activated receptors α and γ. Proc. Natl. Acad. Sci. USA 1997, 94, 4318–4323. [Google Scholar] [CrossRef] [PubMed]
- Brown, P.J.; Smith-Oliver, T.A.; Charifson, P.S.; Tomkinson, N.C.; Fivush, A.M.; Sternbach, D.D.; Wade, L.E.; Orband-Miller, L.; Parks, D.J.; Blanchard, S.G.; et al. Identification of peroxisome proliferator-activated receptor ligands from a biased chemical library. Chem. Biol. 1997, 4, 909–918. [Google Scholar] [CrossRef][Green Version]
- Henke, B.R.; Blanchard, S.G.; Brackeen, M.F.; Brown, K.K.; Cobb, J.E.; Collins, J.L.; Harrington, W.W., Jr.; Hashim, M.A.; Hull-Ryde, E.A.; Kaldor, I.; et al. N-(2-benzoylphenyl)-L-tyrosine PPARγ agonists. 1. Discovery of a novel series of potent antihyperglycemic and antihyperlipidemic agents. J. Med. Chem. 1998, 41, 5020–5036. [Google Scholar] [CrossRef]
- Lehmann, J.M.; Moore, L.B.; Smith-Oliver, T.A.; Wilkison, W.O.; Willson, T.M.; Kliewer, S.A. An antidiabetic thiazolidinedione is a high affinity ligand for peroxisome proliferator-activated receptor γ (PPARγ). J. Biol. Chem. 1995, 270, 12953–12956. [Google Scholar] [CrossRef]
- Gearing, K.; Göttlicher, M.; Teboul, M.; Widmark, E.; Gustafsson, J.-A. Interaction of the peroxisome-proliferator-activated receptor and retinoid X receptor. Proc. Natl. Acad. Sci. USA 1993, 90, 1440–1444. [Google Scholar] [CrossRef]
- Keller, H.R.; Dreyer, C.; Medin, J.; Mahfoudi, A.; Ozato, K.; Wahli, W. Fatty acids and retinoids control lipid metabolism through activation of peroxisome proliferator-activated receptor-retinoid X receptor heterodimers. Proc. Natl. Acad. Sci. USA 1993, 90, 2160–2164. [Google Scholar] [CrossRef] [PubMed]
- Juge-Aubry, C.E.; Hammar, E.; Siegrist-Kaiser, C.; Pernin, A.; Takeshita, A.; Chin, W.W.; Burger, A.G.; Meier, C.A. Regulation of the transcriptional activity of the peroxisome proliferator-activated receptor α by phosphorylation of a ligand-independent trans-activating domain. J. Biol. Chem. 1999, 274, 10505–10510. [Google Scholar] [CrossRef] [PubMed]
- Sher, T.; Yi, H.F.; McBride, O.W.; Gonzalez, F.J. cDNA cloning, chromosomal mapping, and functional characterization of the human peroxisome proliferator activated receptor. Biochemistry 1993, 32, 5598–5604. [Google Scholar] [CrossRef] [PubMed]
- Hsu, M.-H.; Palmer, C.N.; Song, W.; Griffin, K.J.; Johnson, E.F. A carboxyl-terminal extension of the zinc finger domain contributes to the specificity and polarity of peroxisome proliferator-activated receptor DNA binding. J. Biol. Chem. 1998, 273, 27988–27997. [Google Scholar] [CrossRef]
- Flavell, D.; Torra, I.P.; Jamshidi, Y.; Evans, D.; Diamond, J.; Elkeles, R.; Bujac, S.R.; Miller, G.; Talmud, P.J.; Staels, B.; et al. Variation in the PPARα gene is associated with altered function in vitro and plasma lipid concentrations in Type II diabetic subjects. Diabetologia 2000, 43, 673–680. [Google Scholar] [CrossRef] [PubMed]
- Sapone, A.; Peters, J.M.; Sakai, S.; Tomita, S.; Papiha, S.S.; Dai, R.; Friedman, F.K.; Gonzalez, F.J. The human peroxisome proliferator-activated receptor α gene: identification and functional characterization of two natural allelic variants. Pharm. Genom 2000, 10, 321–333. [Google Scholar] [CrossRef]
- Vohl, M.-C.; Lepage, P.; Gaudet, D.; Brewer, C.G.; Bétard, C.; Perron, P.; Houde, G.; Cellier, C.; Faith, J.M.; Després, J.P.; et al. Molecular scanning of the human PPARα gene: Association of the L162V mutation with hyperapobetalipoproteinemia. J. Lipid Res. 2000, 41, 945–952. [Google Scholar]
- Elkeles, R.S.; Diamond, J.R.; Poulter, C.; Dhanjil, S.; Nicolaides, A.N.; Mahmood, S.; Richmond, W.; Mather, H.; Sharp, P.; Feher, M.D.; et al. Cardiovascular outcomes in type 2 diabetes: A double-blind placebo-controlled study of bezafibrate: The St. Mary’s, Ealing, Northwick Park Diabetes Cardiovascular Disease Prevention (SENDCAP) Study. Diabetes Care 1998, 21, 641–648. [Google Scholar] [CrossRef]
- Andrulionytė, L.; Kuulasmaa, T.; Chiasson, J.-L.; Laakso, M. Single Nucleotide Polymorphisms of the Peroxisome Proliferator–Activated Receptor-α Gene (PPARA) Influence the Conversion From Impaired Glucose Tolerance to Type 2 Diabetes: The STOP-NIDDM Trial. Diabetes 2007, 56, 1181–1186. [Google Scholar] [CrossRef][Green Version]
- Flavell, D.M.; Jamshidi, Y.; Hawe, E.; Pineda Torra, I.S.; Taskinen, M.-R.; Frick, M.H.; Nieminen, M.S.; Kesäniemi, Y.A.; Pasternack, A.; Staels, B.; et al. Peroxisome proliferator-activated receptor α gene variants influence progression of coronary atherosclerosis and risk of coronary artery disease. Circulation 2002, 105, 1440–1445. [Google Scholar] [CrossRef]
- Jamshidi, Y.; Montgomery, H.E.; Hense, H.-W.; Myerson, S.G.; Torra, I.P.; Staels, B.; World, M.J.; Doering, A.; Erdmann, J.; Hengstenberg, C.; et al. Peroxisome proliferator–activated receptor α gene regulates left ventricular growth in response to exercise and hypertension. Circulation 2002, 105, 950–955. [Google Scholar] [CrossRef] [PubMed]
- Barger, P.M.; Brandt, J.M.; Leone, T.C.; Weinheimer, C.J.; Kelly, D.P. Deactivation of peroxisome proliferator–activated receptor-α during cardiac hypertrophic growth. J. Clin. Investig. 2000, 105, 1723–1730. [Google Scholar] [CrossRef] [PubMed]
- Allard, M.; Schonekess, B.; Henning, S.; English, D.; Lopaschuk, G.D. Contribution of oxidative metabolism and glycolysis to ATP production in hypertrophied hearts. Am. J. Physiol. Heart Circ. Physiol. 1994, 267, H742–H750. [Google Scholar] [CrossRef] [PubMed]
- Sack, M.N.; Rader, T.A.; Park, S.; Bastin, J.; McCune, S.A.; Kelly, D.P. Fatty acid oxidation enzyme gene expression is downregulated in the failing heart. Circulation 1996, 94, 2837–2842. [Google Scholar] [CrossRef] [PubMed]
- Foucher, C.; Rattier, S.; Flavell, D.M.; Talmud, P.J.; Humphries, S.E.; Kastelein, J.J.; Ayyobi, A.; Pimstone, S.; Frohlich, J.; Ansquer, J.C.; et al. Response to micronized fenofibrate treatment is associated with the peroxisome–proliferator-activated receptors alpha G/C intron7 polymorphism in subjects with type 2 diabetes. Pharmacogenetics 2004, 14, 823–829. [Google Scholar] [CrossRef]
- Maciejewska, A.; Sawczuk, M.; Cieszczyk, P. Variation in the PPARalpha gene in Polish rowers. J. Sci. Med. Sport 2011, 14, 58–64. [Google Scholar] [CrossRef] [PubMed]
- Eynon, N.; Meckel, Y.; Sagiv, M.; Yamin, C.; Amir, R.; Sagiv, M.; Goldhammer, E.; Duarte, J.A.; Oliveira, J. Do PPARGC1A and PPARalpha polymorphisms influence sprint or endurance phenotypes? Scand. J. Med. Sci. Sports 2010, 20, e145–e150. [Google Scholar] [CrossRef]
- Ahmetov, I.I.; Mozhayskaya, I.A.; Flavell, D.M.; Astratenkova, I.V.; Komkova, A.I.; Lyubaeva, E.V.; Tarakin, P.P.; Shenkman, B.S.; Vdovina, A.B.; Netreba, A.I.; et al. PPARalpha gene variation and physical performance in Russian athletes. Eur. J. Appl. Physiol. 2006, 97, 103–108. [Google Scholar] [CrossRef]
- Little, J.; Higgins, J.P.; Ioannidis, J.P.; Moher, D.; Gagnon, F.; Von Elm, E.; Khoury, M.J.; Cohen, B.; Davey-Smith, G.; Grimshaw, J.; et al. STrengthening the REporting of Genetic Association studies (STREGA)—An extension of the STROBE statement. Genet. Epidemiol. 2009, 33, 581–598. [Google Scholar] [CrossRef]
- Hills, A.P.; Mokhtar, N.; Byrne, N.M. Assessment of physical activity and energy expenditure: An overview of objective measures. Front. Nutr. 2014, 16, 5. [Google Scholar] [CrossRef]
- Jarosz, M. Normy żywienia dla Populacji Polski; Institut Żywności I Żywienia: Warszawa, Poland, 2017. [Google Scholar]
- Zarebska, A.; Jastrzebski, Z.; Cieszczyk, P.; Leonska-Duniec, A.; Kotarska, K.; Kaczmarczyk, M.; Sawczuk, M.; Maciejewska-Karlowska, A. The Pro12Ala polymorphism of the peroxisome proliferator-activated receptor gamma gene modifies the association of physical activity and body mass changes in Polish women. PPAR Res. 2014, 2014, 1–7. [Google Scholar] [CrossRef] [PubMed]
- Zarebska, A.; Jastrzebski, Z.; Kaczmarczyk, M.; Ficek, K.; Maciejewska-Karlowska, A.; Sawczuk, M.; Leońska-Duniec, A.; Krol, P.; Cieszczyk, P.; Zmijewski, P.; et al. The GSTP1 c. 313A> G polymorphism modulates the cardiorespiratory response to aerobic training. Biol. Sport 2014, 31, 261–266. [Google Scholar] [CrossRef] [PubMed]
- Zarębska, A.; Jastrzębski, Z.; Moska, W.; Leońska-Duniec, A.; Kaczmarczyk, M.; Sawczuk, M.; Maciejewska-Skrendo, A.; Zmijewski, P.; Ficek, K.; Trybek, G.; et al. The AGT gene M235T polymorphism and response of power-related variables to aerobic training. J. Sports Sci. Med. 2016, 15, 616–624. [Google Scholar]
- De Angelis, M.; Vinciguerra, G.; Gasbarri, A.; Pacitti, C. Oxygen uptake, heart rate and blood lactate concentration during a normal training session of an aerobic dance class. Eur. J. Appl. Physiol. Occup. Physiol. 1998, 78, 121–127. [Google Scholar] [CrossRef] [PubMed]
- Leońska-Duniec, A.; Jastrzębski, Z.; Zarębska, A.; Maciejewska, A.; Ficek, K.; Cięszczyk, P. Assessing effect of interaction between the FTO A/T polymorphism (rs9939609) and physical activity on obesity-related traits. J. Sport Health Sci. 2018, 7, 459–464. [Google Scholar] [CrossRef] [PubMed]
- Larson-Hall, J. A Guide to Doing Statistics in Second Language Research Using SPSS. Ibérica 2010, 20, 167–204. [Google Scholar]
- Fikenzer, K.; Fikenzer, S.; Laufs, U.; Werner, C. Effects of endurance training on serum lipids. Vasc. Pharm. 2018, 101, 9–20. [Google Scholar] [CrossRef]
- Aellen, R.; Hollmann, W.; Boutellier, U. Effects of aerobic and anaerobic training on plasma lipoproteins. Int. J. Sports Med. 1993, 14, 396–400. [Google Scholar] [CrossRef]
- Kodama, S.; Tanaka, S.; Saito, K.; Shu, M.; Sone, Y.; Onitake, F.; Suzuki, E.; Shimano, H.; Yamamoto, S.; Kondo, K.; et al. Effect of aerobic exercise training on serum levels of high-density lipoprotein cholesterol: A meta-analysis. Arch. Intern. Med. 2007, 167, 999–1008. [Google Scholar] [CrossRef]
- Chen, E.S.; Mazzotti, D.R.; Furuya, T.K.; Cendoroglo, M.S.; Ramos, L.R.; Araujo, L.Q.; Burbano, R.R.; Smith Mde, A. Association of PPARα gene polymorphisms and lipid serum levels in a Brazilian elderly population. Exp. Mol. Pathol. 2010, 88, 197–201. [Google Scholar] [CrossRef]
- Doney, A.S.; Fischer, B.; Lee, S.P.; Morris, A.D.; Leese, G.; Palmer, C.N. Association of common variation in the PPARA gene with incident myocardial infarction in individuals with type 2 diabetes: A Go-DARTS study. Nucl. Recept. 2005, 3, 4. [Google Scholar] [CrossRef][Green Version]
- Cresci, S.; Jones, P.G.; Sucharov, C.C.; Marsh, S.; Lanfear, D.E.; Garsa, A.; Courtois, M.; Weinheimer, C.J.; Wu, J.; Province, M.A.; et al. Interaction between PPARA genotype and β-blocker treatment influences clinical outcomes following acute coronary syndromes. Pharmacogenomics 2008, 9, 1403–1417. [Google Scholar] [CrossRef] [PubMed]
- Rudkowska, I.; Verreault, M.; Barbier, O.; Vohl, M.-C. Differences in Transcriptional Activation by the Two Allelic (L162V Polymorphic) Variants of PPAR after Omega-3 Fatty Acids Treatment. Ppar. Res. 2009, 2009, 369602. [Google Scholar] [CrossRef] [PubMed]
- Berneis, K.; Rizzo, M. LDL size: Does it matter? Swiss. Med. Wkly. 2004, 134, 720–724. [Google Scholar] [PubMed]
- Caslake, M.; Packard, C.; Gaw, A.; Murray, E.; Griffin, B.; Vallance, B.; Shepherd, J. Fenofibrate and LDL metabolic heterogeneity in hypercholesterolemia. Arter. Thromb 1993, 13, 702–711. [Google Scholar] [CrossRef]
- Lacquemant, C.; Lepretre, F.; Torra, I.P.; Manraj, M.; Charpentier, G.; Ruiz, J.; Staels, B.; Froguel, P. Mutation screening of the PPARalpha, gene in type 2 diabetes associated with coronary heart disease. Diabetes Metab. 2000, 26, 393–402. [Google Scholar] [PubMed]
- Tai, E.; Demissie, S.; Cupples, L.; Corella, D.; Wilson, P.; Schaefer, E.; Ordovas, J.M. Association between the PPARA L162V polymorphism and plasma lipid levels: the Framingham Offspring Study. Arter. Thromb. Vasc. Biol. 2002, 22, 805–810. [Google Scholar] [CrossRef]
- Robitaille, J.; Brouillette, C.; Houde, A.; Lemieux, S.; Pérusse, L.; Tchernof, A.; Gaudet, D.; Vohl, M.-C. Association between the PPARα-L162V polymorphism and components of the metabolic syndrome. J. Hum. Gen. 2004, 49, 482. [Google Scholar]
- Sparsø, T.; Hussain, M.S.; Andersen, G.; Hainerova, I.; Borch-Johnsen, K.; Jørgensen, T.; Hansen, T.; Pedersen, O. Relationships between the functional PPARα Leu162Val polymorphism and obesity, type 2 diabetes, dyslipidaemia, and related quantitative traits in studies of 5799 middle-aged white people. Mol. Genet. Metab. 2007, 90, 205–209. [Google Scholar] [CrossRef]
- AlSaleh, A.; Frost, G.S.; Griffin, B.A.; Lovegrove, J.A.; Jebb, S.A.; Sanders, T.A.; O’Dell, S.D.; RISCK Study Investigators. PPARγ2 gene Pro12Ala and PPARα gene Leu162Val single nucleotide polymorphisms interact with dietary intake of fat in determination of plasma lipid concentrations. J. Nutr. Nutr. 2011, 4, 354–366. [Google Scholar] [CrossRef]
- Bouchard-Mercier, A.; Godin, G.; Lamarche, B.; Pérusse, L.; Vohl, M.-C. Effects of peroxisome proliferator-activated receptors, dietary fat intakes and gene–diet interactions on peak particle diameters of low-density lipoproteins. J. Nutr. Nutr. 2011, 4, 36–48. [Google Scholar] [CrossRef] [PubMed]
- Egert, S.; Kratz, M.; Kannenberg, F.; Fobker, M.; Wahrburg, U. Effects of high-fat and low-fat diets rich in monounsaturated fatty acids on serum lipids, LDL size and indices of lipid peroxidation in healthy non-obese men and women when consumed under controlled conditions. Eur. J. Nutr. 2011, 50, 71–79. [Google Scholar] [CrossRef] [PubMed]
- Lamarche, B.; Lemieux, I.; Despres, J. The small, dense LDL phenotype and the risk of coronary heart disease: Epidemiology, patho-physiology and therapeutic aspects. Diabetes Metab. 1999, 25, 199–212. [Google Scholar]
- Berneis, K.K.; Krauss, R.M. Metabolic origins and clinical significance of LDL heterogeneity. J. Lipid Res. 2002, 43, 1363–1379. [Google Scholar] [CrossRef] [PubMed]
- Jakob, T.; Nordmann, A.J.; Schandelmaier, S.; Ferreira-González, I.; Briel, M. Fibrates for primary prevention of cardiovascular disease events. Cochrane Database Syst. Rev. 2016, 11, CD009753. [Google Scholar] [CrossRef] [PubMed]
- Stastny, P.; Lehnert, M.; De Ste Croix, M.; Petr, M.; Svoboda, Z.; Maixnerova, E.; Varekova, R.; Botek, M.; Petrek, M.; Kocourkova, L.; et al. Effect of COL5A1, GDF5, and PPARA Genes on a Movement Screen and Neuromuscular Performance in Adolescent Team Sport Athletes. J. Strength Cond. Res. 2019. [Google Scholar] [CrossRef] [PubMed]
- Petr, M.; Stastny, P.; Pecha, O.; Šteffl, M.; Šeda, O.; Kohlíková, E. PPARA intron polymorphism associated with power performance in 30-s anaerobic Wingate Test. PLoS ONE 2014, 9, e107171. [Google Scholar] [CrossRef]


| Variable | GG (n = 109) | GC (n = 53) | CC (n = 6) | p Values for Genotypes | p Values for Allele × Training Interaction | |||||
|---|---|---|---|---|---|---|---|---|---|---|
| Before Training | After Training | Before Training | After Training | Before Training | After Training | Genotype | Training | GG vs. GC+CC | GG+GC vs. CC | |
| Body mass (kg) | 59.82 ± 7.45 | 59.12 ± 7.31 | 62.35 ± 7.93 | 61.51 ± 7.86 | 58.93 ± 6.92 | 58.27 ± 7.35 | 0.130 | 0.859 | 0.220 | 0.544 |
| BMI (kg/m2) | 21.36 ± 2.36 | 21.14 ± 2.30 | 22.06 ± 2.51 | 21.82 ± 2.48 | 21.47 ± 2.85 | 21.25 ± 2.87 | 0.226 | 0.984 | 0.964 | 0.510 |
| BMR (kJ) | 6027.11 ± 322.75 | 5988.31 ± 301.69 | 6117.87 ± 333.88 | 6087.24 ± 337.16 | 6035.00 ± 309.97 | 5970.17 ± 322.14 | 0.194 | 0.855 | 0.889 | 0.602 |
| Tissue impedance (Ohm) | 556.21 ± 64.49 | 542.09 ± 62.98 | 536.09 ± 62.33 | 524.34 ± 62.26 | 557.17 ± 50.41 | 543.50 ± 42.88 | 0.257 | 0.382 | 0.643 | 0.578 |
| FM (kg) | 14.42 ± 4.98 | 13.54 ± 4.97 | 15.67 ± 5.21 | 14.59 ± 5.35 | 14.32 ± 5.15 | 13.10 ± 5.53 | 0.565 | 0.647 | 0.955 | 0.979 |
| FFM (kg) | 45.38 ± 3.10 | 45.79 ± 3.06 | 46.45 ± 3.34 | 46.91 ± 3.58 | 44.62 ± 2.57 | 45.17 ± 2.38 | 0.084 | 0.936 | 0.874 | 0.491 |
| TBW (kg) | 33.32 ± 2.46 | 33.56 ± 2.28 | 33.84 ± 2.88 | 34.32 ± 2.69 | 32.67 ± 1.88 | 33.37 ± 1.51 | 0.229 | 0.481 | 0.813 | 0.429 |
| Total cholesterol (mg/dL) | 169.11 ± 22.86 | 167.16 ± 24.21 | 172.30 ± 29.33 | 170.53 ± 33.83 | 165.00 ± 10.18 | 172.67 ± 10.65 | 0.671 | 0.549 | 0.983 | 0.076 |
| TGL (mg/dL) | 81.90 ± 35.08 | 85.27 ± 36.75 | 76.15 ± 24.53 | 81.55 ± 32.75 | 85.50 ± 38.52 | 73.50 ± 15.54 | 0.825 | 0.475 | 0.679 | 0.414 |
| HDL (mg/dL) | 64.09 ± 12.29 | 61.21 ± 12.65 | 66.75 ± 15.18 | 60.86 ± 15.46 | 68.80 ± 14.95 | 62.28 ± 12.26 | 0.059 | 0.211 | 0.085 | 0.481 |
| LDL (mg/dL) | 88.54 ± 20.31 | 88.91 ± 20.34 | 90.26 ± 25.69 | 93.32 ± 29.70 | 79.17 ± 14.16 | 95.48 ± 15.35 | 0.648 | 0.025 | 0.171 | 0.033 |
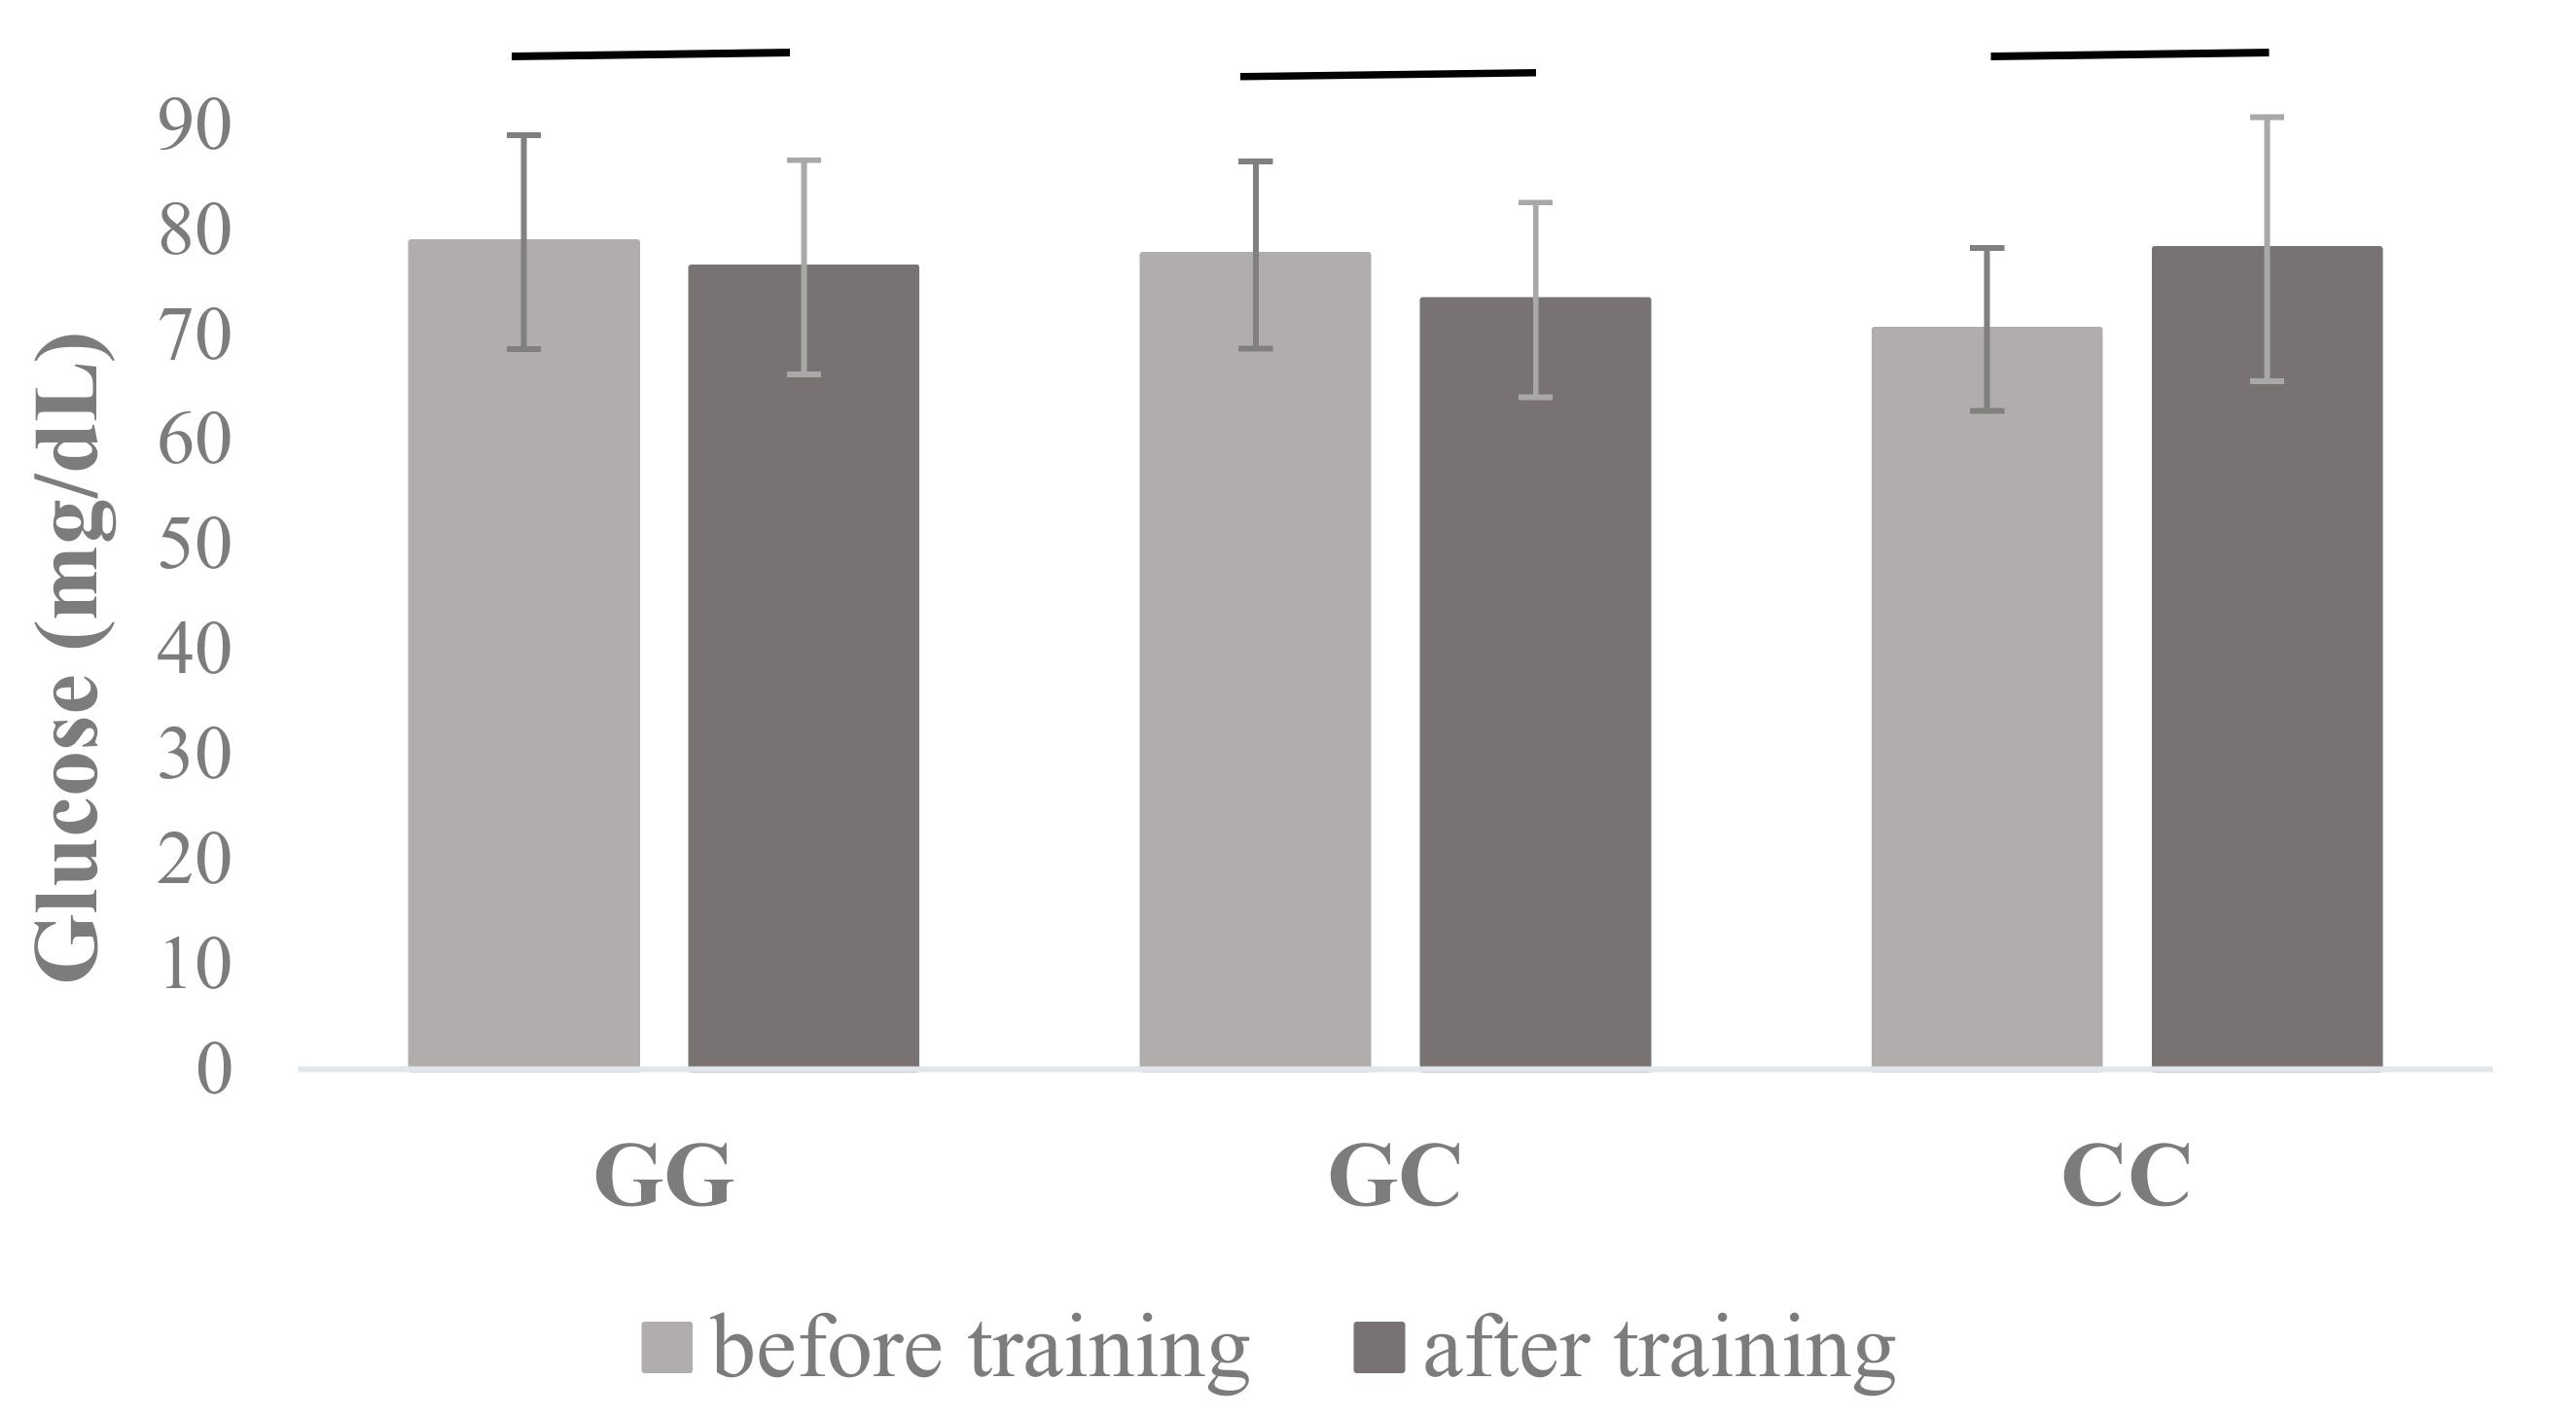
| Glucose (mg/dL) | 78.83 ± 10.20 | 76.44 ± 10.21 | 77.62 ± 8.92 | 73.34 ± 9.28 | 70.50 ± 7.76 | 78.17 ± 12.58 | 0.298 | 0.020 | 0.101 | 0.011 |
| Variable | CC (n = 154) | CG (n = 14) | p Values for Main Effects | |||
|---|---|---|---|---|---|---|
| Before Training | After Training | Before Training | After Training | Genotype | Training | |
| Body mass (kg) | 60.57 ± 7.69 | 59.90 ± 7.58 | 60.77 ± 7.37 | 59.21 ± 7.13 | 0.063 | 0.052 |
| BMI (kg/m2) | 21.55 ± 2.46 | 21.34 ± 2.39 | 22.03 ± 2.16 | 21.58 ± 2.39 | 0.0.64 | 0.099 |
| BMR (kJ) | 6055.80 ± 328.86 | 6021.35 ± 317.31 | 6058.43 ± 304.72 | 5991.64 ± 304.76 | 0.064 | 0.303 |
| Tissue impedance (Ohm) | 548.23 ± 62.99 | 535.32 ± 62.33 | 568.21 ± 71.46 | 549.93 ± 64.19 | 0.233 | 0.582 |
| FM (kg) | 14.73 ± 5.09 | 13.85 ± 5.10 | 15.63 ± 4.89 | 13.98 ± 5.34 | 0.098 | 0.163 |
| FFM (kg) | 45.77 ± 3.19 | 46.20 ± 3.25 | 44.79 ± 3.20 | 45.24 ± 3.15 | 0.716 | 0.090 |
| TBW (kg) | 33.52 ± 2.60 | 33.86 ± 2.41 | 32.81 ± 2.36 | 33.13 ± 2.32 | 0.096 | 0.950 |
| Total cholesterol (mg/dL) | 170.99 ± 24.67 | 169.36 ± 27.58 | 158.78 ± 23.55 | 158.07 ± 21.24 | 0.690 | 0.876 |
| TGL (mg/dL) | 80.86 ± 32.29 | 85.12 ± 35.55 | 73.14 ± 31.12 | 67.71 ± 22.64 | 0.900 | 0.294 |
| HDL (mg/dL) | 65.12 ± 13.51 | 61.78 ± 13.48 | 64.82 ± 11.83 | 54.03 ± 12.08 | 0.001 | 0.013 |
| LDL (mg/dL) | 89.60 ± 21.69 | 90.55 ± 23.39 | 79.43 ± 23.59 | 90.43 ± 26.16 | 0.259 | 0.587 |
| Glucose (mg/dL) | 78.41 ± 9.74 | 75.32 ± 10.02 | 75.36 ± 10.59 | 77.71 ± 10.67 | 0.795 | 0.053 |
© 2019 by the authors. Licensee MDPI, Basel, Switzerland. This article is an open access article distributed under the terms and conditions of the Creative Commons Attribution (CC BY) license (http://creativecommons.org/licenses/by/4.0/).
Share and Cite
Maciejewska-Skrendo, A.; Buryta, M.; Czarny, W.; Król, P.; Spieszny, M.; Stastny, P.; Petr, M.; Safranow, K.; Sawczuk, M. The Polymorphisms of the Peroxisome-Proliferator Activated Receptors’ Alfa Gene Modify the Aerobic Training Induced Changes of Cholesterol and Glucose. J. Clin. Med. 2019, 8, 1043. https://doi.org/10.3390/jcm8071043
Maciejewska-Skrendo A, Buryta M, Czarny W, Król P, Spieszny M, Stastny P, Petr M, Safranow K, Sawczuk M. The Polymorphisms of the Peroxisome-Proliferator Activated Receptors’ Alfa Gene Modify the Aerobic Training Induced Changes of Cholesterol and Glucose. Journal of Clinical Medicine. 2019; 8(7):1043. https://doi.org/10.3390/jcm8071043
Chicago/Turabian StyleMaciejewska-Skrendo, Agnieszka, Maciej Buryta, Wojciech Czarny, Pawel Król, Michal Spieszny, Petr Stastny, Miroslav Petr, Krzysztof Safranow, and Marek Sawczuk. 2019. "The Polymorphisms of the Peroxisome-Proliferator Activated Receptors’ Alfa Gene Modify the Aerobic Training Induced Changes of Cholesterol and Glucose" Journal of Clinical Medicine 8, no. 7: 1043. https://doi.org/10.3390/jcm8071043
APA StyleMaciejewska-Skrendo, A., Buryta, M., Czarny, W., Król, P., Spieszny, M., Stastny, P., Petr, M., Safranow, K., & Sawczuk, M. (2019). The Polymorphisms of the Peroxisome-Proliferator Activated Receptors’ Alfa Gene Modify the Aerobic Training Induced Changes of Cholesterol and Glucose. Journal of Clinical Medicine, 8(7), 1043. https://doi.org/10.3390/jcm8071043