Safety and Efficacy of Erythrocyte Encapsulated Thymidine Phosphorylase in Mitochondrial Neurogastrointestinal Encephalomyopathy

 ,
,  , , and
Abstract
1. Introduction
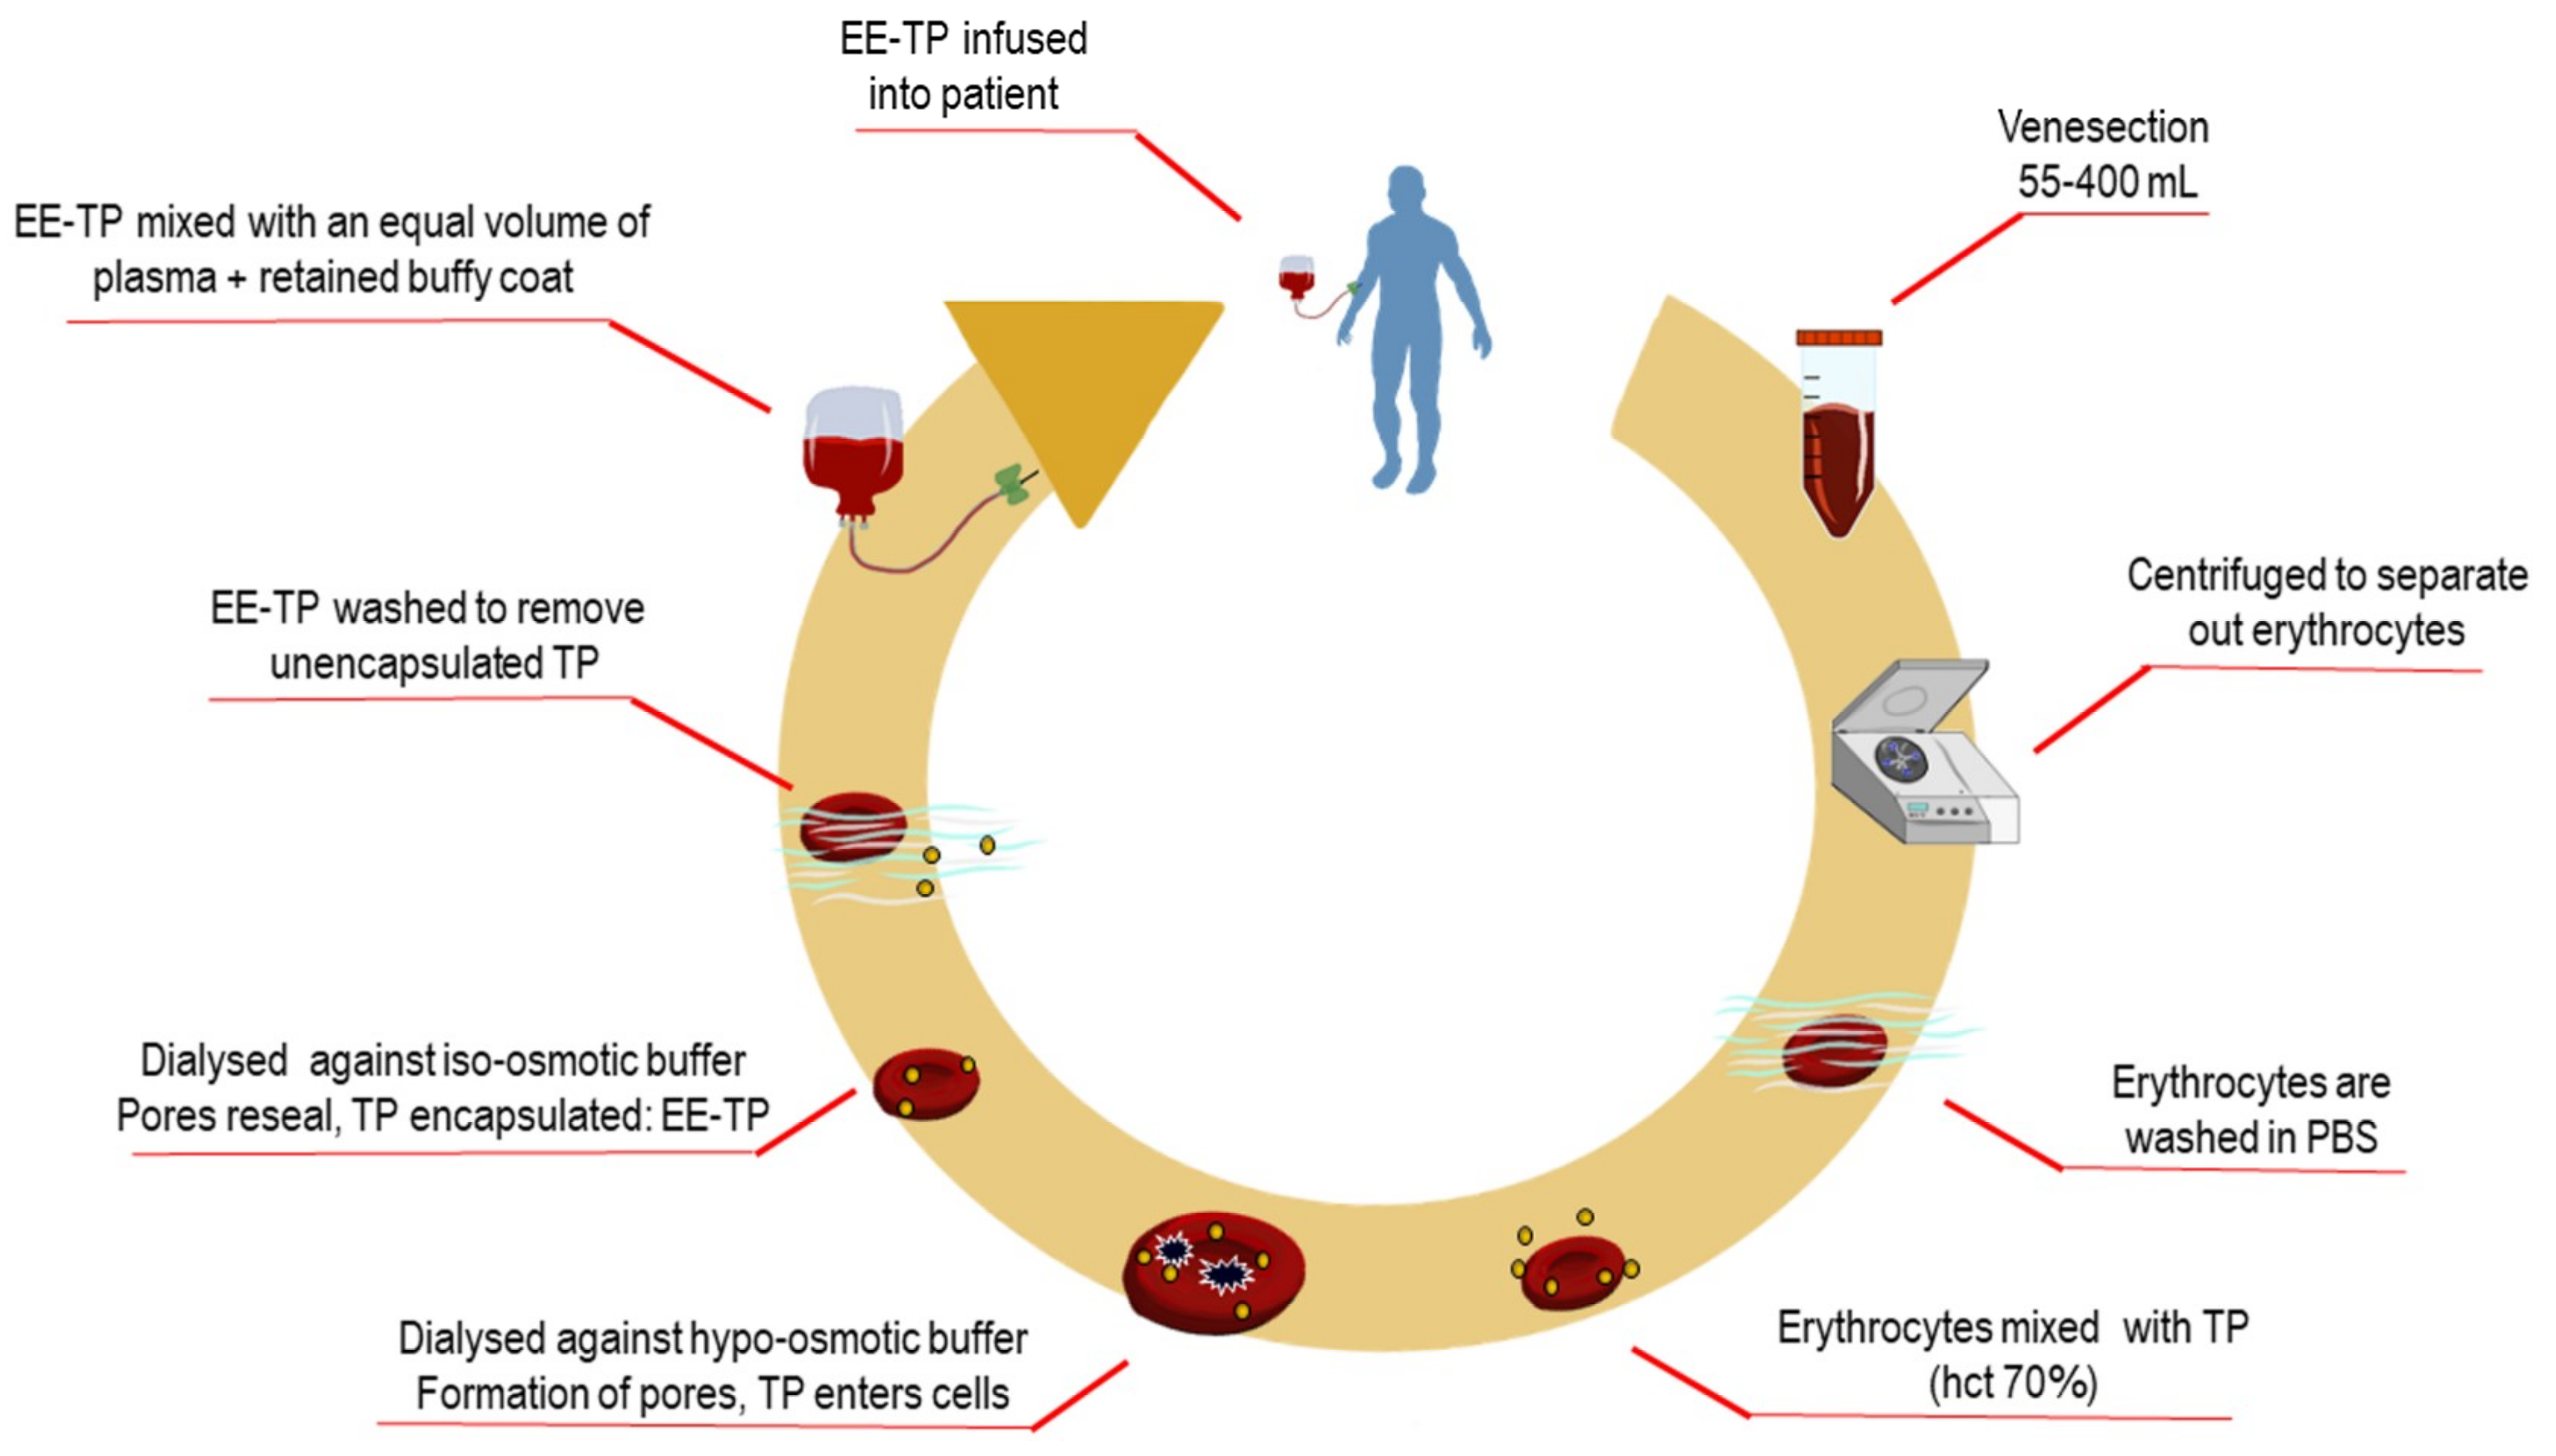
2. Experimental Section
3. Results
3.1. Patient Characteristics
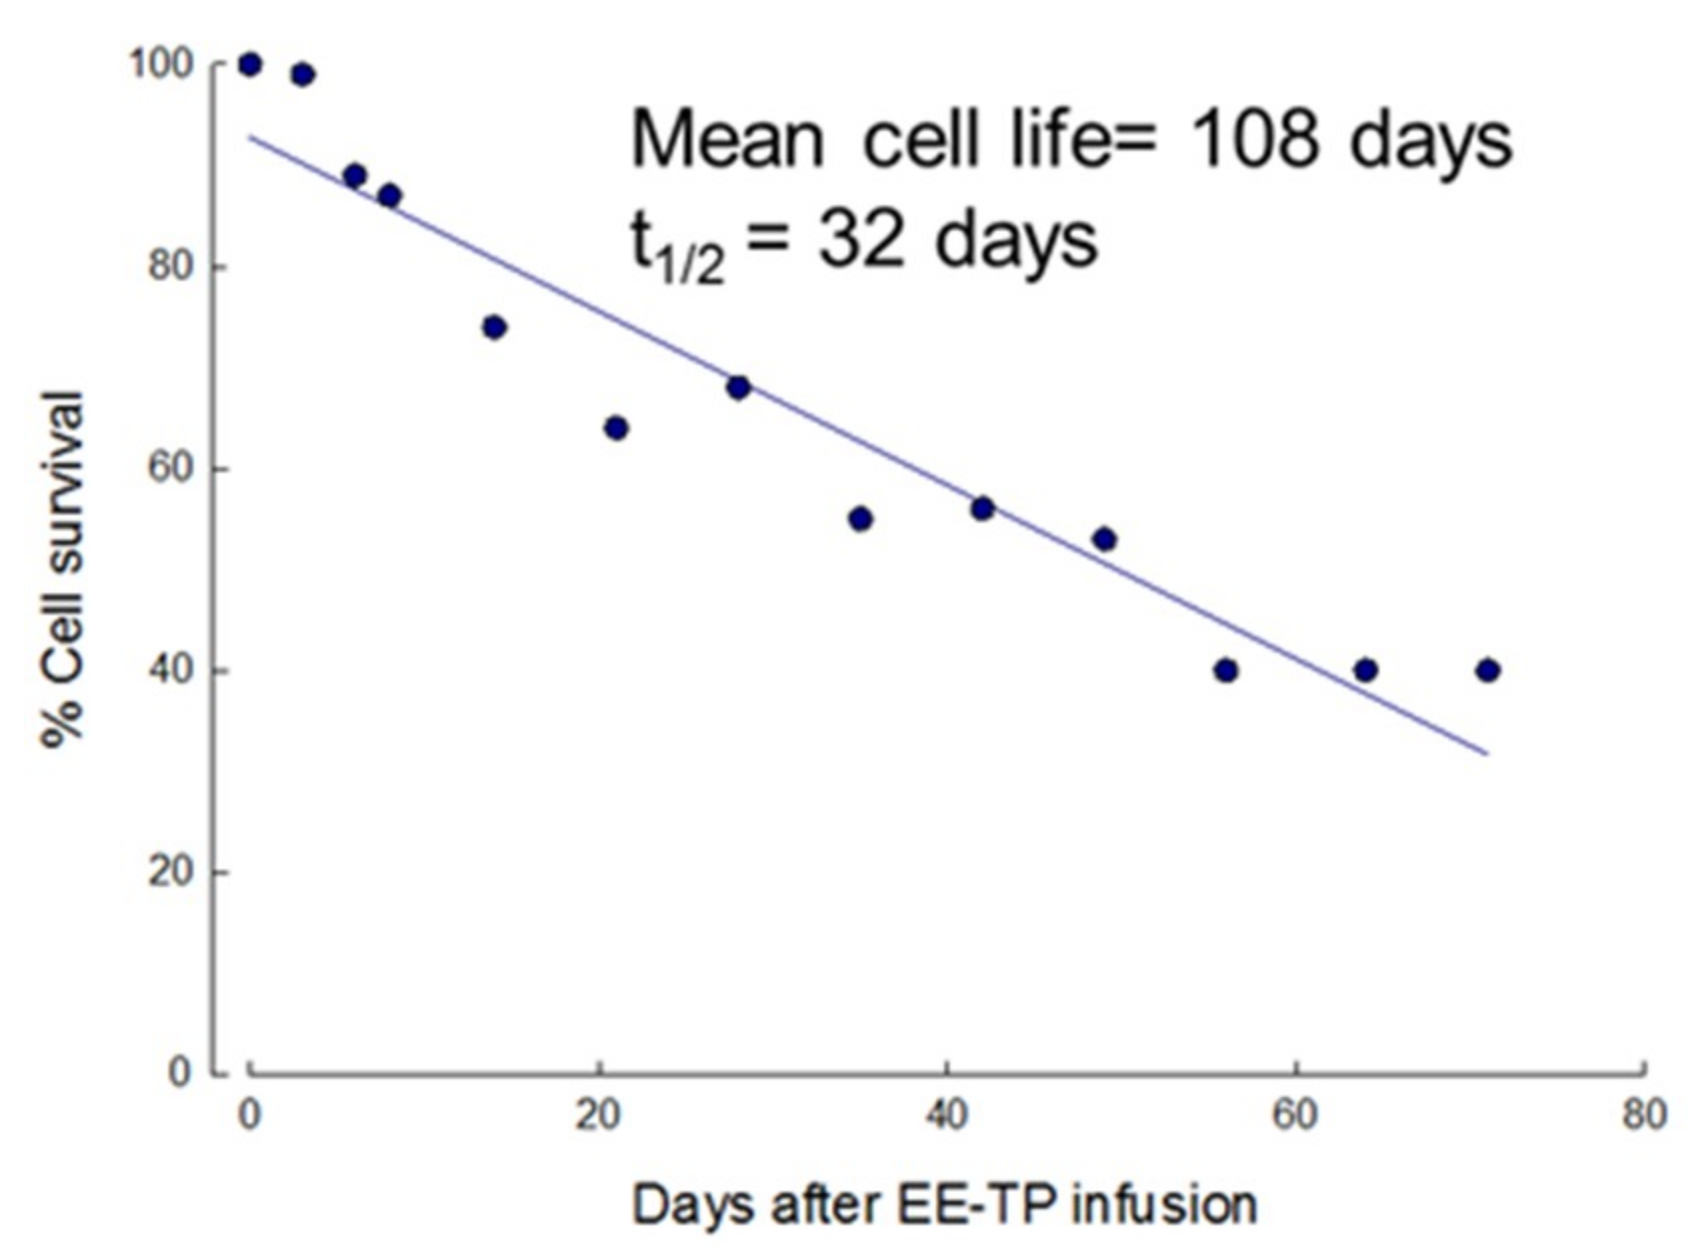
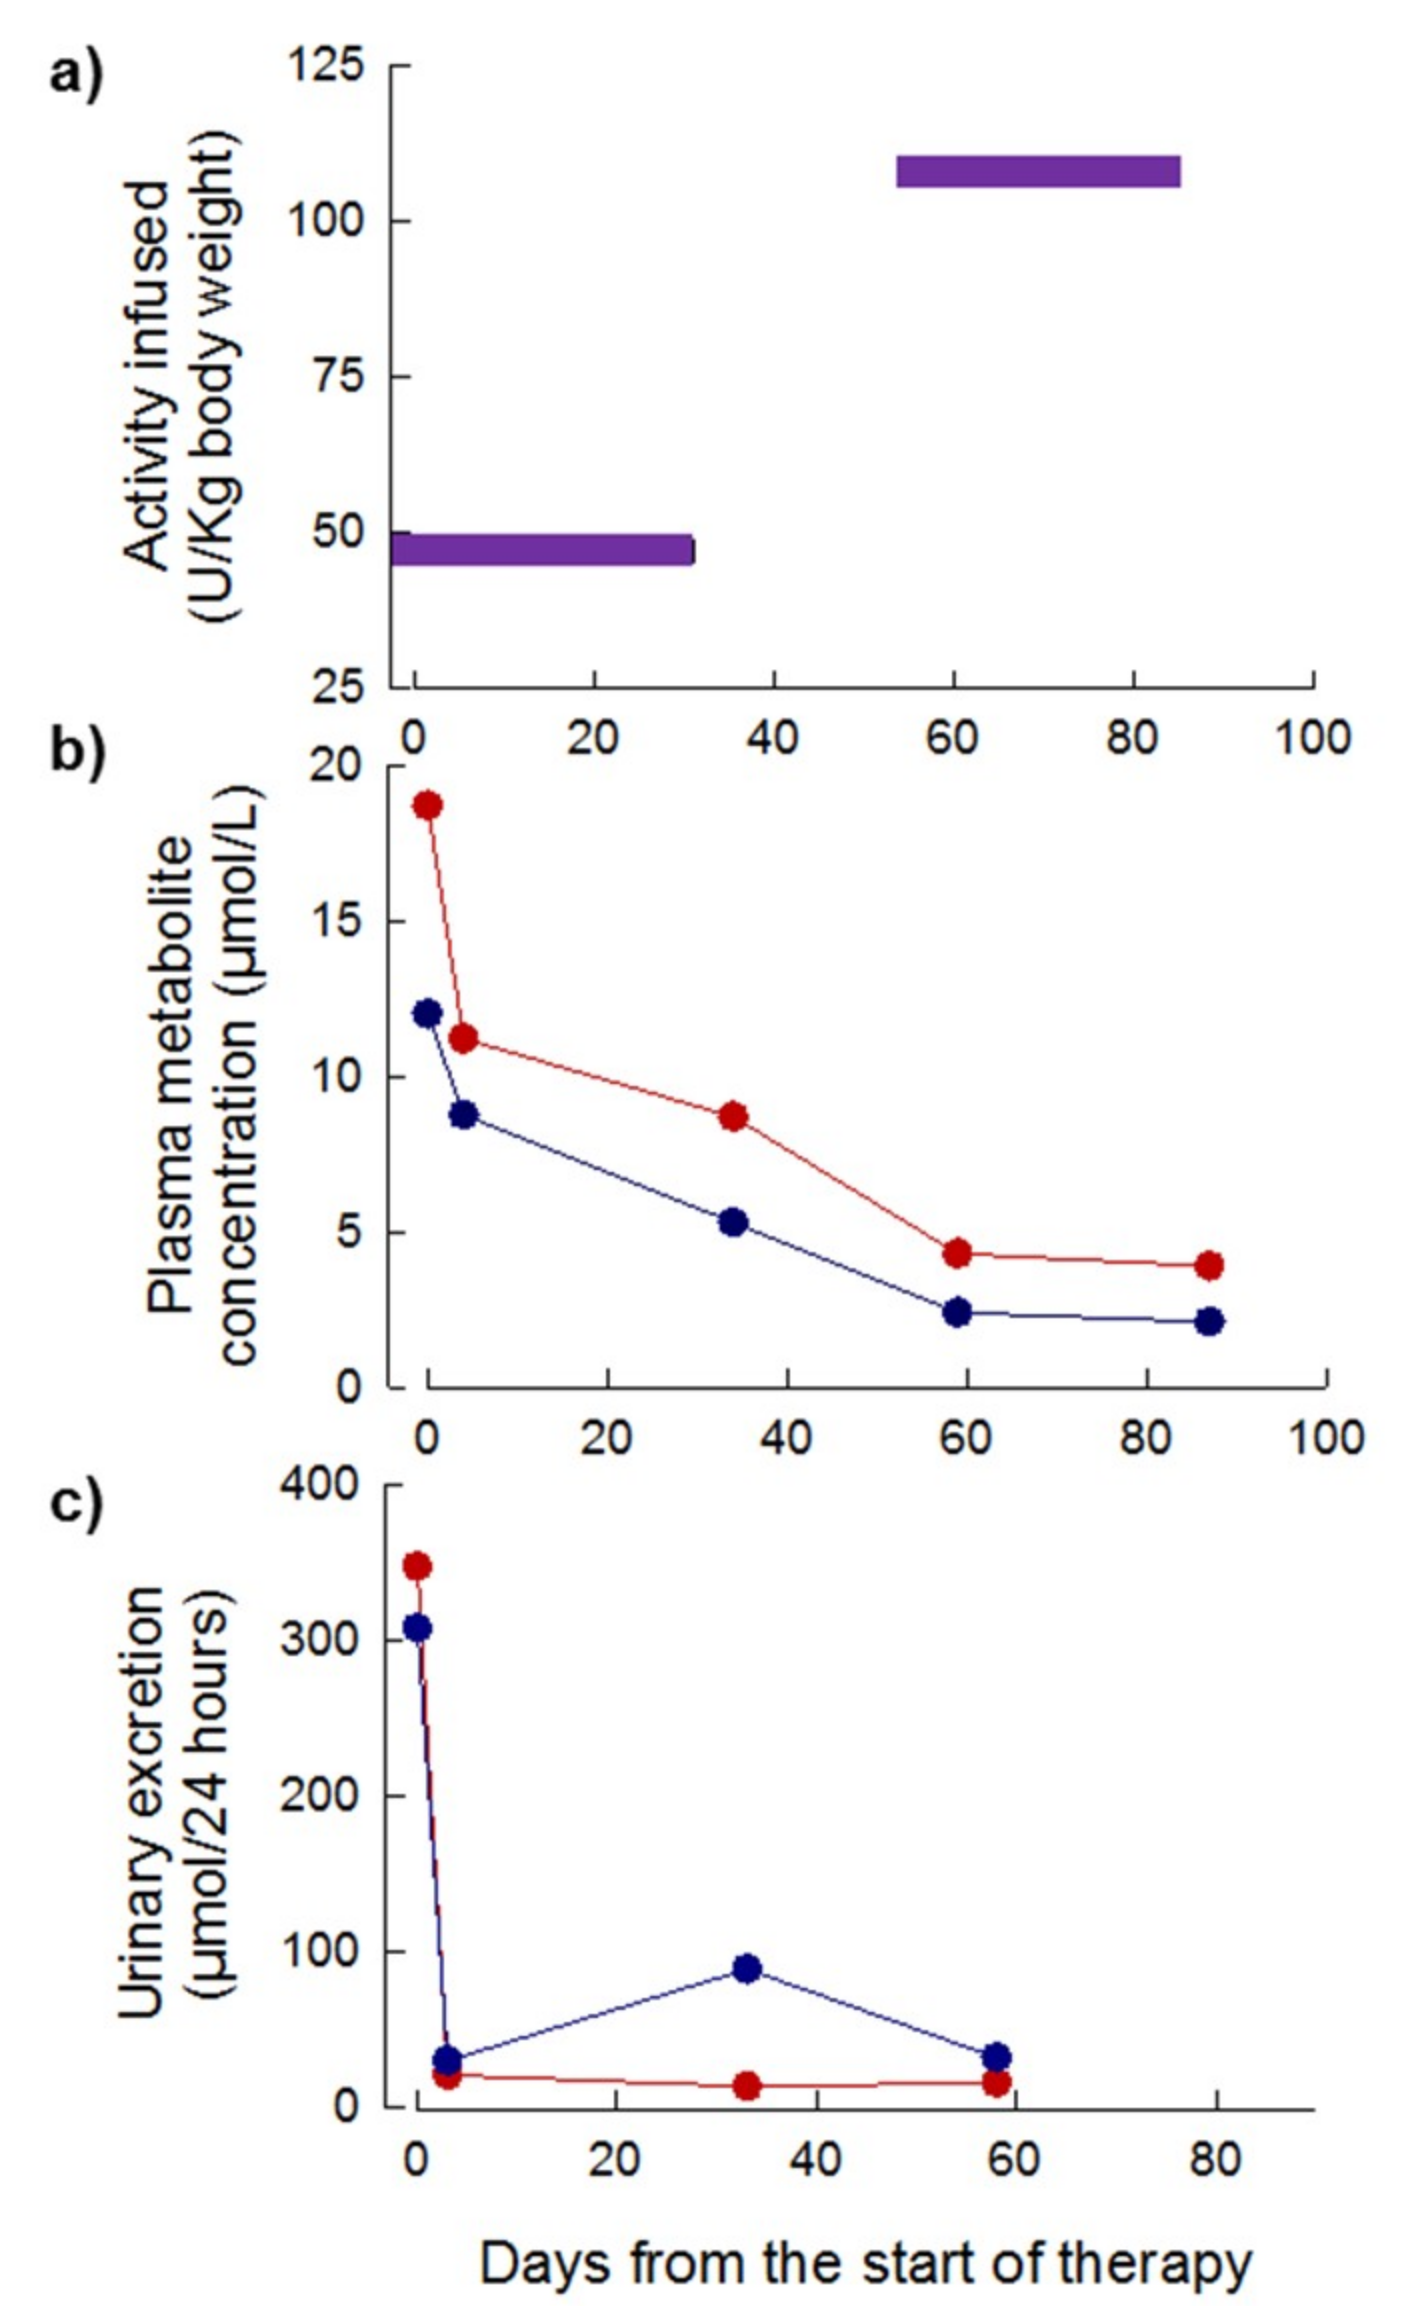
3.2. In Vivo Survival of EE-TP
3.3. Efficacy Outcomes
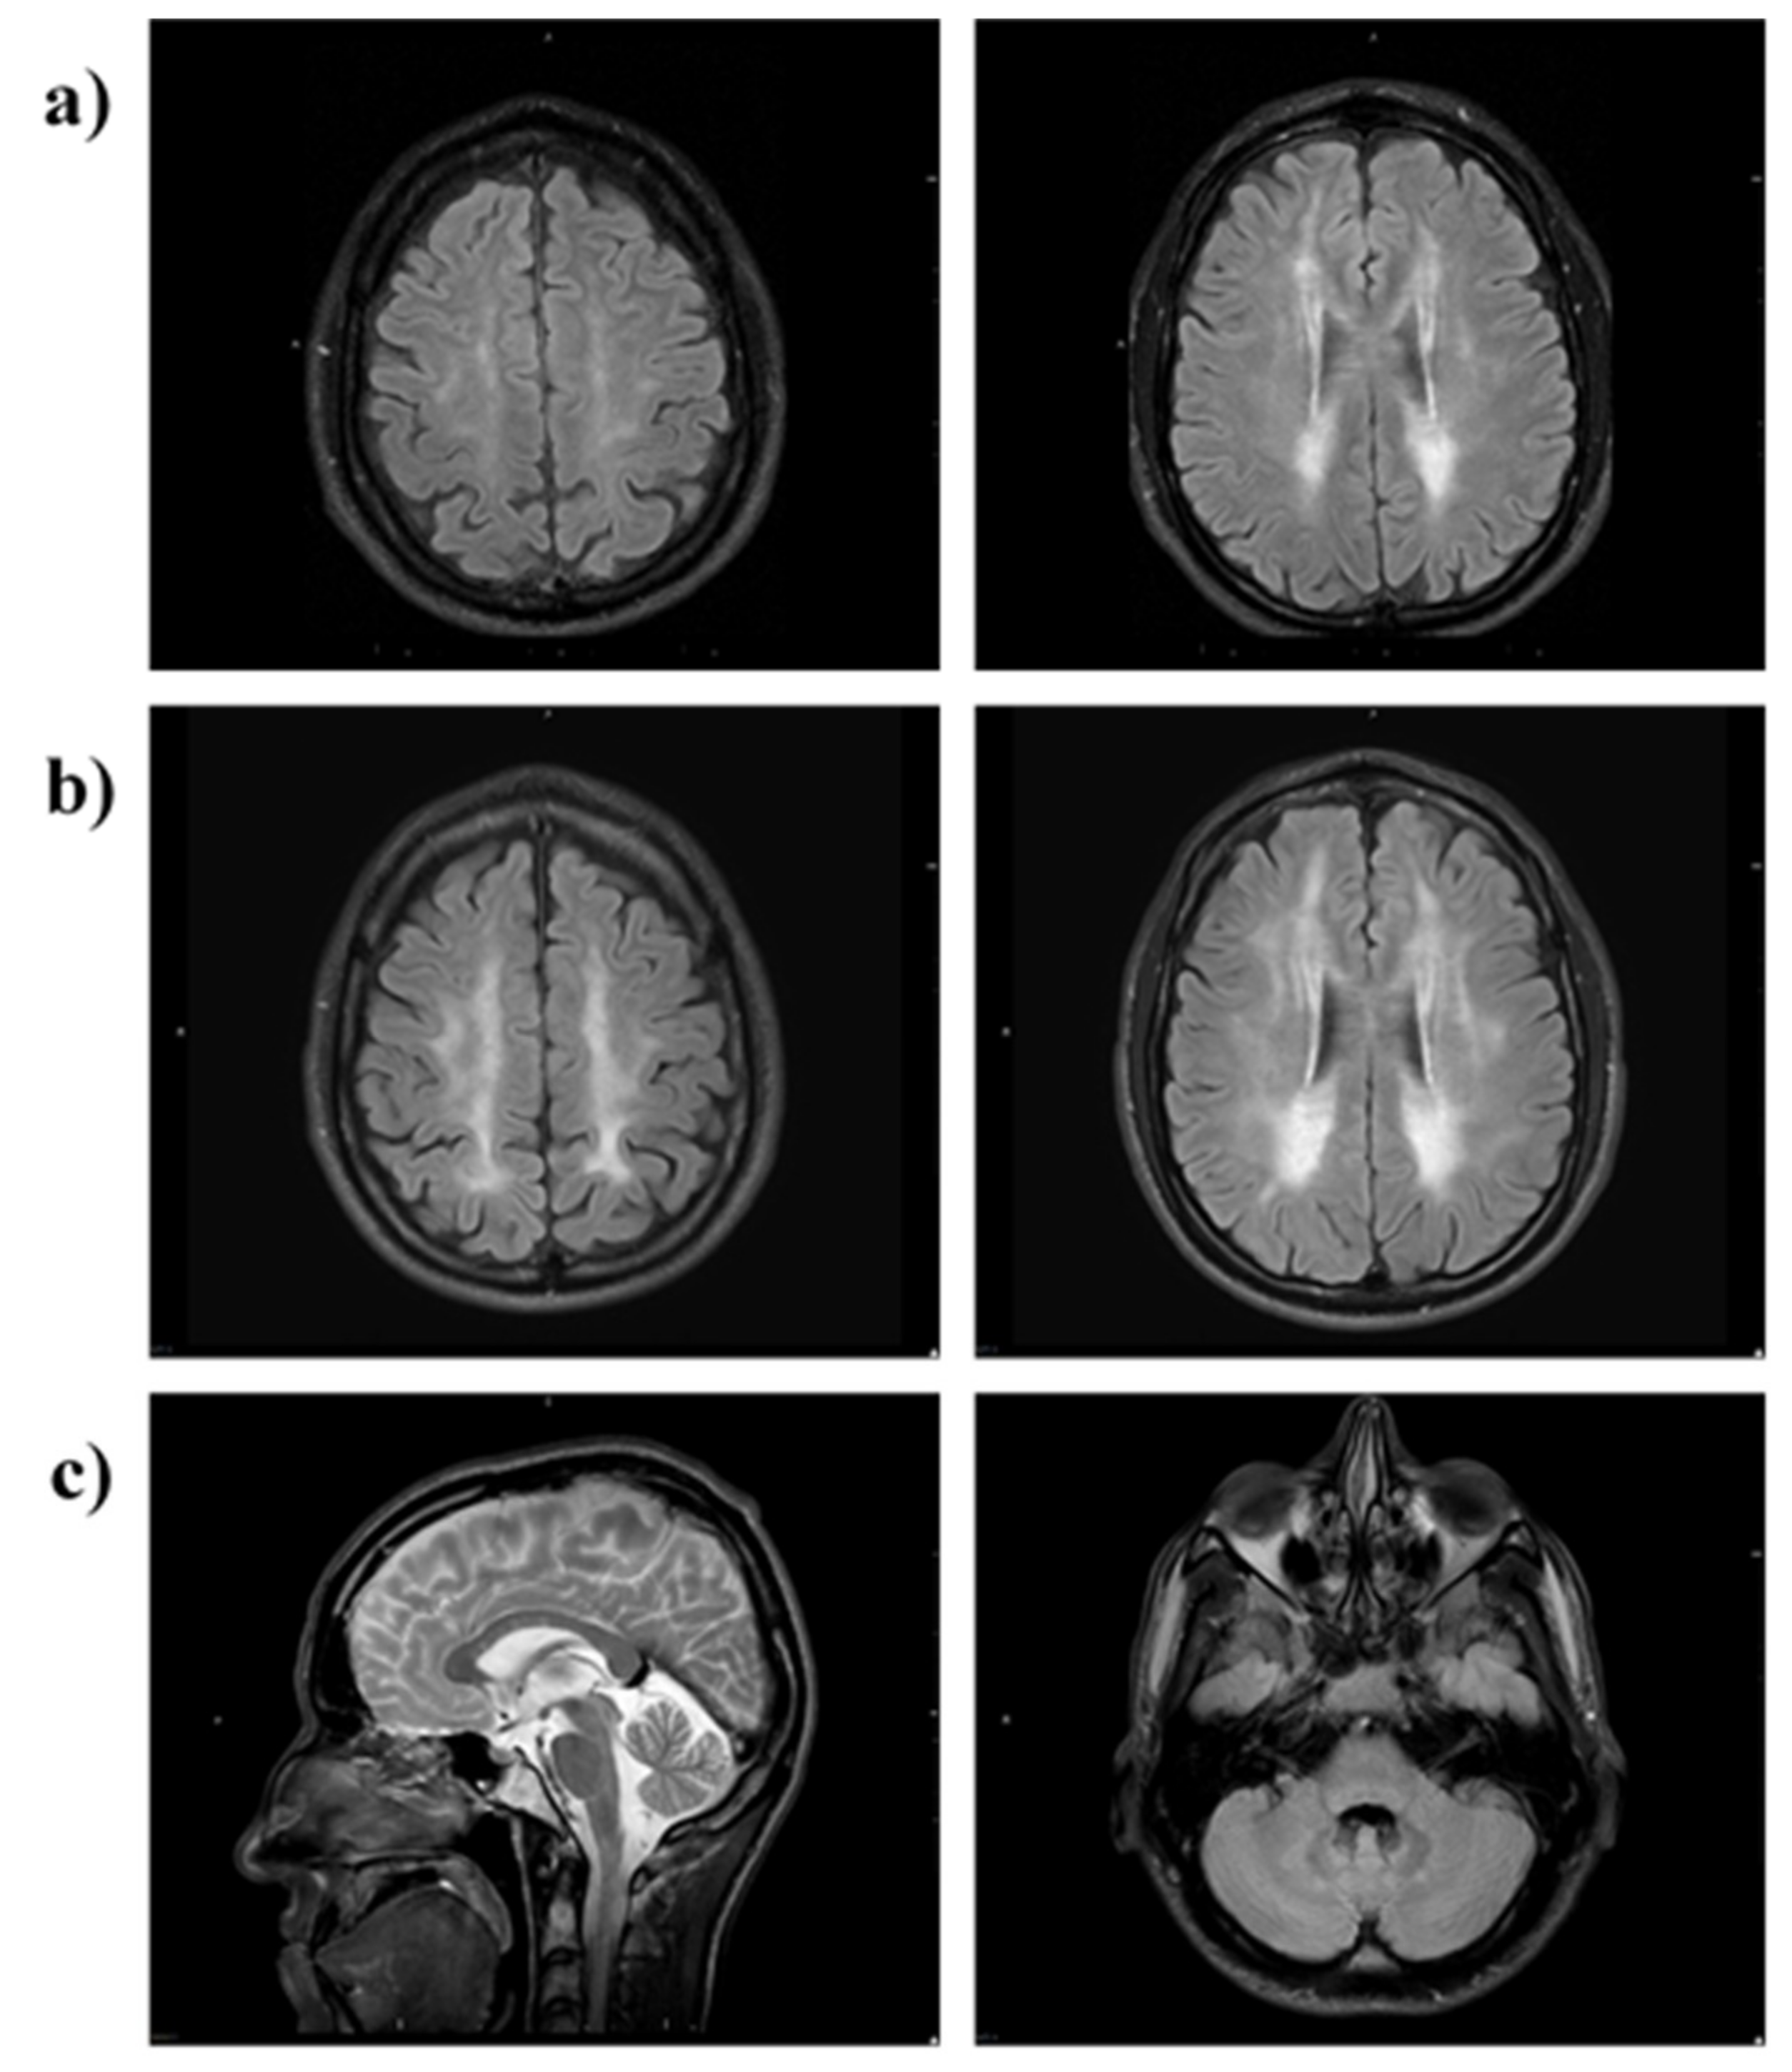
3.3.1. Patient 1
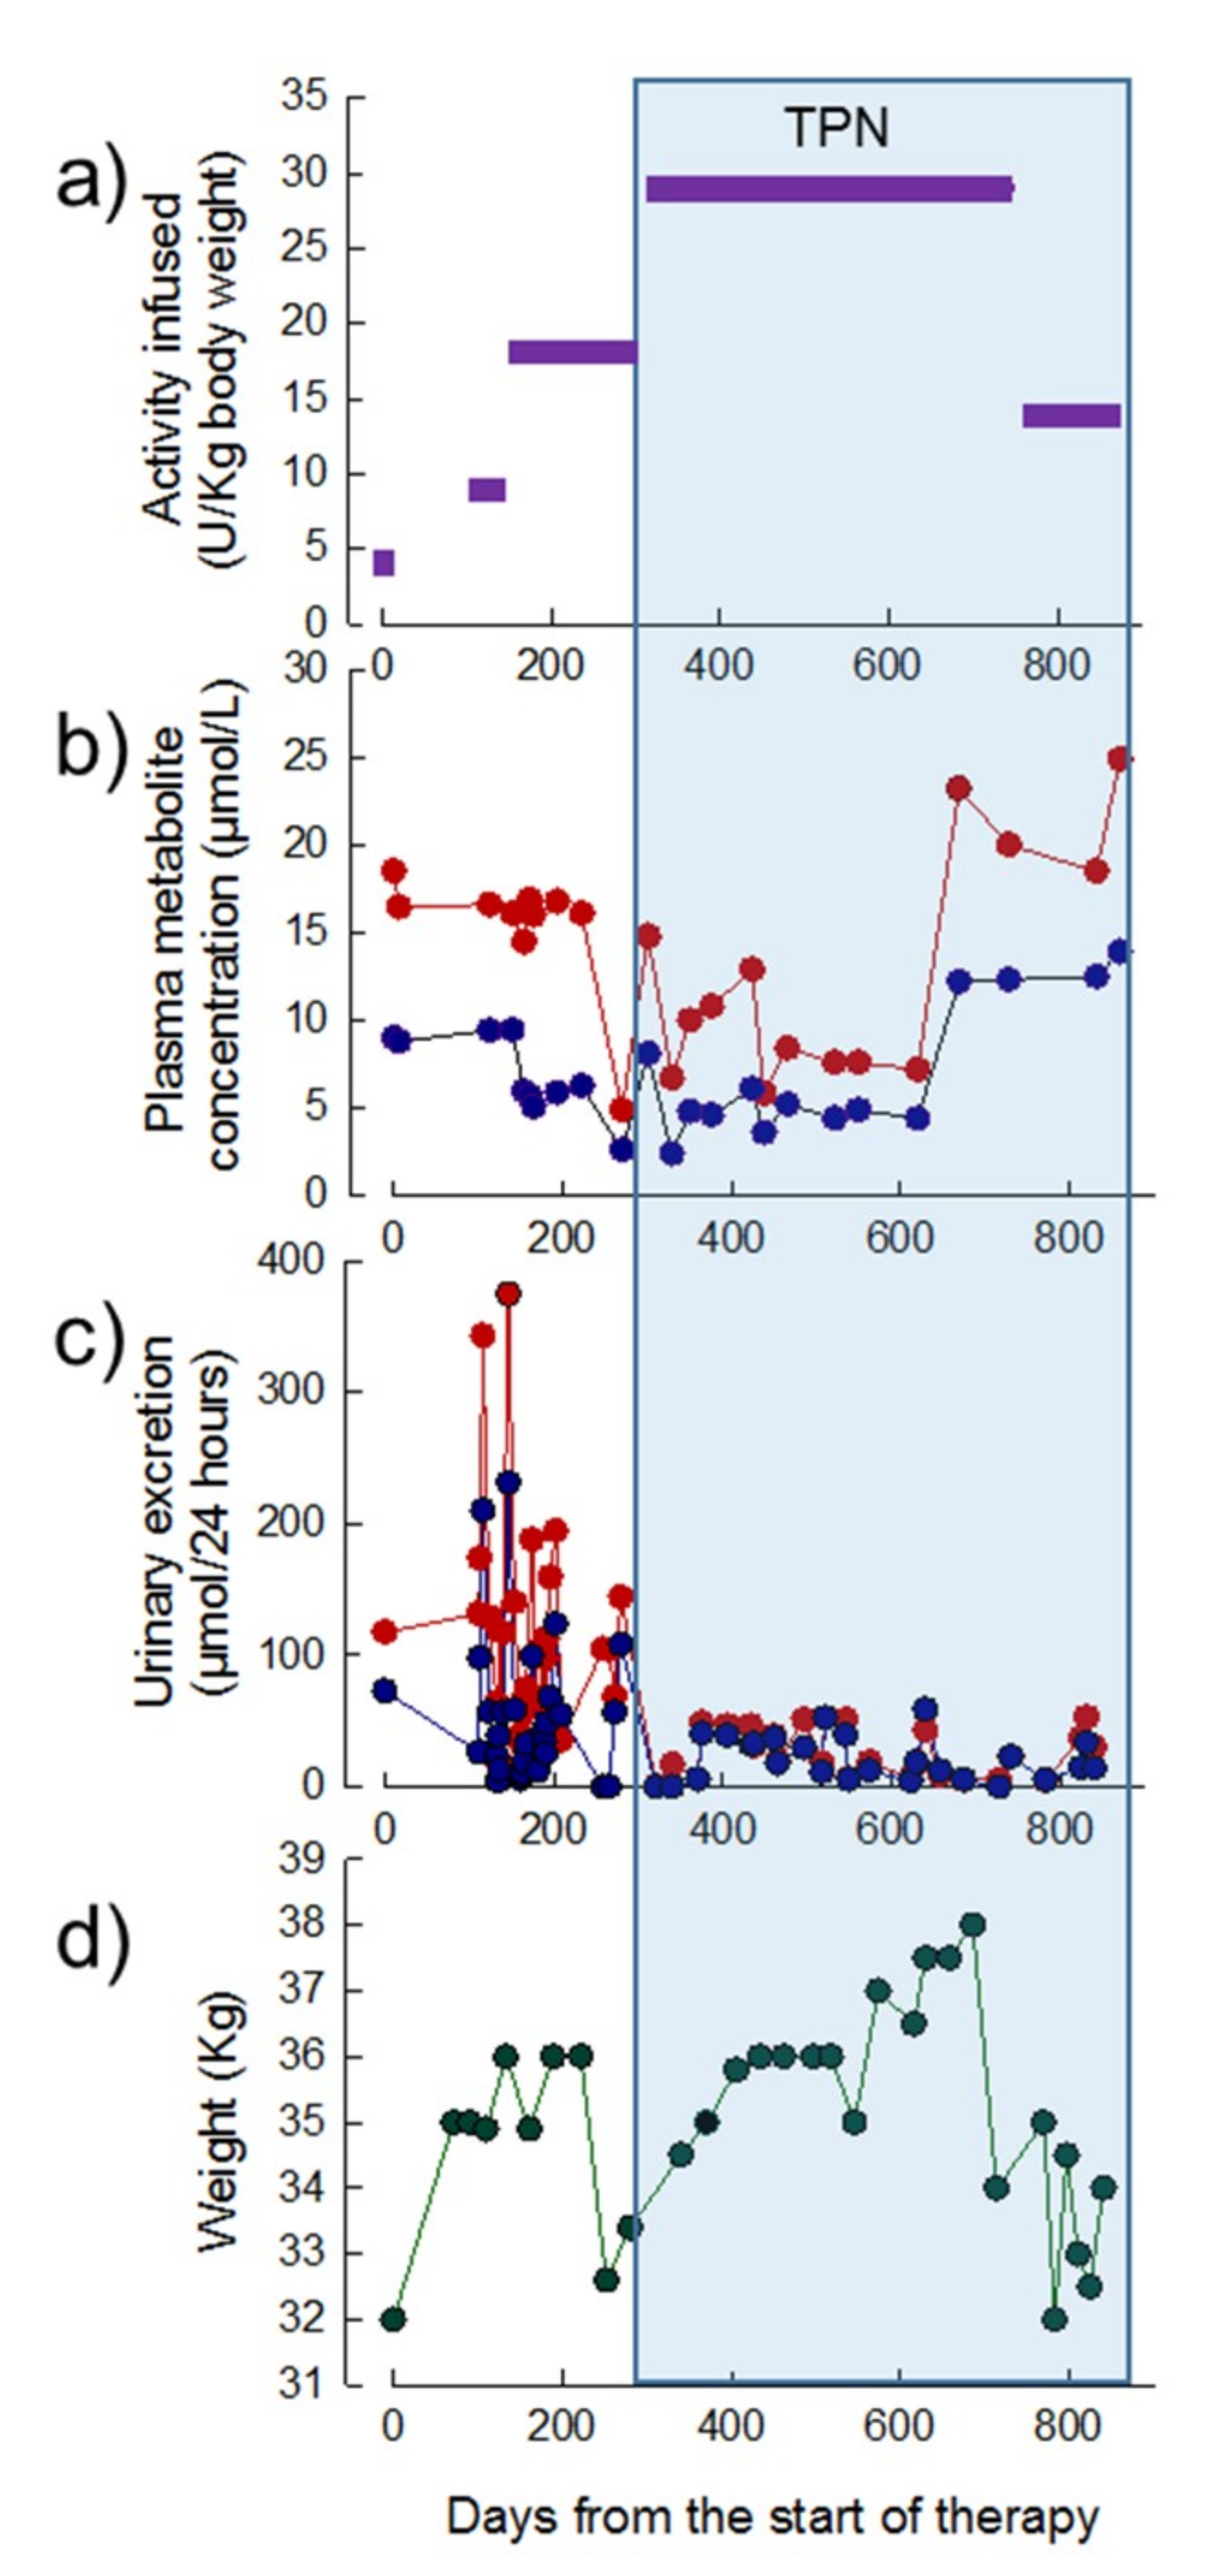
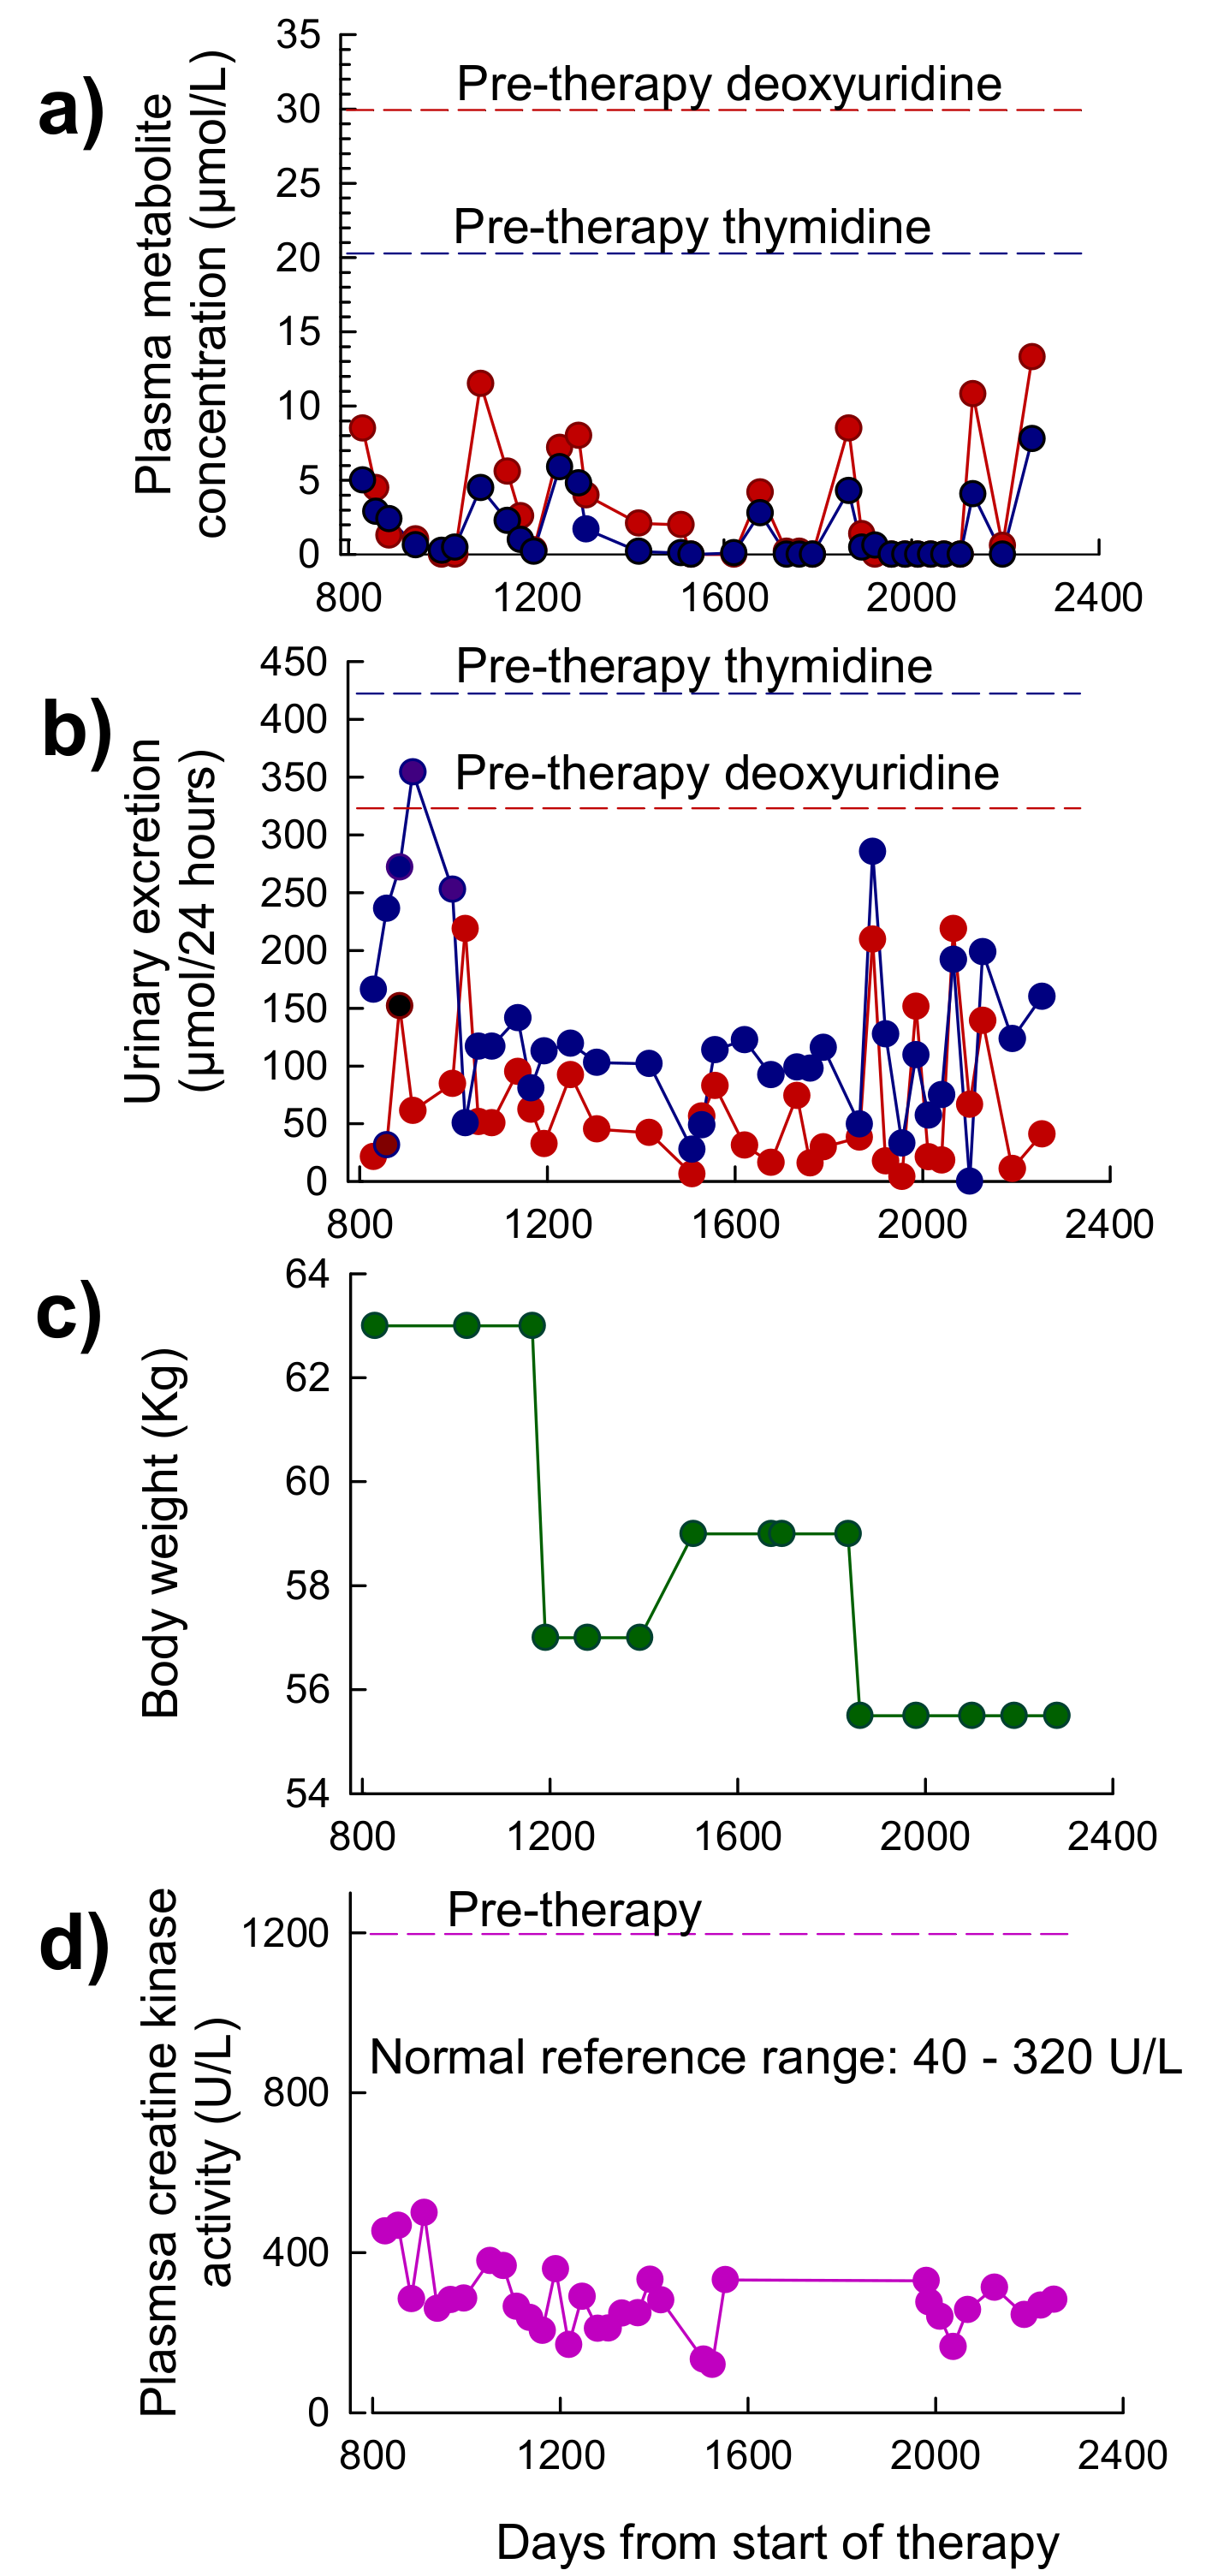
3.3.2. Patient 2
3.3.3. Patient 3
3.4. Safety
4. Discussion
5. Conclusions
6. Patents
Author Contributions
Funding
Acknowledgments
Conflicts of Interest
References
- Pacitti, D.; Levene, M.; Garone, C.; Nirmalananthan, N.; Bax, B.E. Mitochondrial Neurogastrointestinal Encephalomyopathy: Into the Fourth Decade, What We Have Learned So Far. Front. Genet. 2018, 9, 1–22. [Google Scholar] [CrossRef]
- Nishino, I.; Spinazzola, A.; Papadimitriou, A.; Hammans, S.; Steiner, I.; Hahn, C.D.; Connolly, A.M.; Verloes, A.; Guimarães, J.; Maillard, I.; et al. Mitochondrial Neurogastrointestinal Encephalomyopathy: An Autosomal Recessive Disorder due to Thymidine Phosphorylase Mutations. Ann. Neurol. 2000, 47, 792–800. [Google Scholar] [CrossRef]
- Nishino, I.; Spinazzola, A.; Hirano, M. Thymidine Phosphorylase Gene Mutations in MNGIE, a Human Mitochondrial Disorder. Science 1999, 283, 689–692. [Google Scholar] [CrossRef]
- Okamura, K.; Santa, T.; Nagae, K.; Omae, T. Congenital Oculoskeletal Myopathy with Abnormal Muscle and Liver Mitochondria. J. Neurol. Sci. 1976, 27, 79–91. [Google Scholar] [CrossRef]
- Hirano, M.; Silvestri, G.; Blake, D.M.; Lombes, A.; Minetti, C.; Bonilla, E.; Hays, A.P.; Lovelace, R.E.; Butler, I.; Bertorini, T.E. Mitochondrial Neurogastrointestinal Encephalomyopathy (MNGIE): Clinical, Biochemical, and Genetic Features of an Autosomal Recessive Mitochondrial Disorder. Neurology 1994, 44, 721–727. [Google Scholar] [CrossRef]
- Spinazzola, A.; Marti, R.; Nishino, I.; Andreu, A.L.; Naini, A.; Tadesse, S.; Pela, I.; Zammarchi, E.; Alice Donati, M.; Oliver, J.A.; et al. Altered Thymidine Metabolism due to Defects of Thymidine Phosphorylase. J. Biol. Chem. 2002, 277, 4128–4133. [Google Scholar] [CrossRef]
- Martí, R.; Nishigaki, Y.; Hirano, M. Elevated Plasma Deoxyuridine in Patients with Thymidine Phosphorylase Deficiency. Biochem. Biophys. Res. Commun. 2003, 303, 14–18. [Google Scholar] [CrossRef]
- Nishigaki, Y.; Martí, R.; Copeland, W.C.; Hirano, M. Site-Specific Somatic Mitochondrial DNA Point Mutations in Patients with Thymidine Phosphorylase Deficiency. J. Clin. Investig. 2003, 111, 1913–1921. [Google Scholar] [CrossRef]
- Nishigaki, Y.; Martí, R.; Hirano, M. ND5 Is a Hot-Spot for Multiple Atypical Mitochondrial DNA Deletions in Mitochondrial Neurogastrointestinal Encephalomyopathy. Hum. Mol. Genet. 2004, 13, 91–101. [Google Scholar] [CrossRef]
- Hirano, M.; Nishigaki, Y.; Martí, R. Mitochondrial Neurogastrointestinal Encephalomyopathy (MNGIE): A Disease of Two Genomes. Neurologist 2004, 10, 8–17. [Google Scholar] [CrossRef]
- Yavuz, H.; Özel, A.; Christensen, M.; Christensen, E.; Schwartz, M.; Elmaci, M.; Vissing, J. Treatment of Mitochondrial Neurogastrointestinal Encephalomyopathy with Dialysis. Arch. Neurol. 2007, 64, 435–438. [Google Scholar] [CrossRef]
- La Marca, G.; Malvagia, S.; Casetta, B.; Pasquini, E.; Pela, I.; Hirano, M.; Donati, M.A.; Zammarchi, E. Pre- and Post-Dialysis Quantitative Dosage of Thymidine in Urine and Plasma of a MNGIE Patient by Using HPLC-ESI-MS/MS. J. Mass Spectrom. 2006, 41, 586–592. [Google Scholar] [CrossRef] [PubMed]
- Lara, M.C.; Weiss, B.; Illa, I.; Madoz, P.; Massuet, L.; Andreu, A.L.; Valentino, M.L.; Anikster, Y.; Hirano, M.; Martí, R. Infusion of Platelets Transiently Reduces Nucleoside Overload in MNGIE. Neurology 2006, 67, 1461–1463. [Google Scholar] [CrossRef] [PubMed]
- Halter, J.; Schüpbach, W.M.M.; Casali, C.; Elhasid, R.; Fay, K.; Hammans, S.; Illa, I.; Kappeler, L.; Krähenbühl, S.; Lehmann, T.; et al. Allogeneic Hematopoietic SCT as Treatment Option for Patients with Mitochondrial Neurogastrointestinal Encephalomyopathy (MNGIE): A Consensus Conference Proposal for a Standardized Approach. Bone Marrow Transplant. 2011, 46, 330–337. [Google Scholar] [CrossRef] [PubMed]
- Filosto, M.; Scarpelli, M.; Tonin, P.; Lucchini, G.; Pavan, F.; Santus, F.; Parini, R.; Donati, M.A.; Cotelli, M.S.; Vielmi, V.; et al. Course and Management of Allogeneic Stem Cell Transplantation in Patients with Mitochondrial Neurogastrointestinal Encephalomyopathy. J. Neurol. 2012, 259, 2699–2706. [Google Scholar] [CrossRef] [PubMed]
- Hirano, M.; Martí, R.; Casali, C.; Tadesse, S.; Uldrick, T.; Fine, B.; Escolar, D.M.; Valentino, M.L.; Nishino, I.; Hesdorffer, C.; et al. Allogeneic Stem Cell Transplantation Corrects Biochemical Derangements in MNGIE. Neurology 2006, 67, 1458–1460. [Google Scholar] [CrossRef] [PubMed]
- Halter, J.P.; Michael, W.; Schüpbach, M.; Mandel, H.; Casali, C.; Orchard, K.; Collin, M.; Valcarcel, D.; Rovelli, A.; Filosto, M.; et al. Allogeneic Haematopoietic Stem Cell Transplantation for Mitochondrial Neurogastrointestinal Encephalomyopathy. Brain 2015, 138, 2847–2858. [Google Scholar] [CrossRef] [PubMed]
- Moran, N.F.; Bain, M.D.; Muqit, M.M.K.; Bax, B.E. Carrier Erythrocyte Entrapped Thymidine Phosphorylase Therapy for Mngie. Neurology 2008, 71, 686–688. [Google Scholar] [CrossRef]
- Bax, B.E.; Bain, M.D.; Scarpelli, M.; Filosto, M.; Tonin, P.; Moran, N. Clinical and Biochemical Improvements in a Patient with MNGIE Following Enzyme Replacement. Neurology 2013, 81, 1269–1271. [Google Scholar] [CrossRef]
- De Giorgio, R.; Pironi, L.; Rinaldi, R.; Boschetti, E.; Caporali, L.; Capristo, M.; Casali, C.; Cenacchi, G.; Contin, M.; D’Angelo, R.; et al. Liver Transplantation for Mitochondrial Neurogastrointestinal Encephalomyopathy. Ann. Neurol. 2016, 80, 448–455. [Google Scholar] [CrossRef]
- Godfrin, Y.; Horand, F.; Franco, R.; Dufour, E.; Kosenko, E.; Bax, B.E.; Banz, A.; Skorokhod, O.A.; Lanao, J.M.; Vitvitsky, V.; et al. International Seminar on the Red Blood Cells as Vehicles for Drugs. Expert Opin. Biol. Ther. 2012, 12, 127–133. [Google Scholar] [CrossRef] [PubMed]
- Bax, B.E.; Bain, M.D.; Talbot, P.J.; Parker-williams, E.J.; Chalmers, R.A. Survival of Human Carrier Erythrocytes in Vivo. Clin. Sci. 1999, 96, 171–178. [Google Scholar] [CrossRef]
- Fairbanks, L.D.; Levene, M.; Bax, B.E. Validation of a HPLC Method for the Measurement of Erythrocyte Encapsulated Thymidine Phosphorylase (EE-TP) Activity. J. Pharm. Biomed. Anal. 2013, 76, 8–12. [Google Scholar] [CrossRef] [PubMed]
- Levene, M.; Pacitti, D.; Gasson, C.; Hall, J.; Sellos-Moura, M.; Bax, B.E. Validation of an Immunoassay for Anti-Thymidine Phosphorylase Antibodies in Patients with MNGIE Treated with Enzyme Replacement Therapy. Mol. Ther. Methods Clin. Dev. 2018, 11, 1–8. [Google Scholar] [CrossRef] [PubMed]
- Barton, G.J.; Ponting, C.P.; Spraggon, G.; Finnis, C.; Sleep, D. Human Platelet-derived Endothelial Cell Growth Factor Is Homologous to Escherichia Coli Thymidine Phosphorylase. Protein Sci. 1992, 1, 688–690. [Google Scholar] [CrossRef] [PubMed]
- Maksane, S.; Guhasarkar, S.; Banerjee, R.; Dandekar, S. Evaluation of Surface Properties of Erythrocyte Membranes in Liver Diseases. Int. J. Res. Med. Sci. 2015, 3, 593. [Google Scholar] [CrossRef]
- Dahlan, W.; Richelle, M.; Kulapongse, S. Modification of Erythrocyte Membrane Lipid Composition Induced by a Single Intravenous Infusion of Phospholipid-triacylglycerol Emulsions in Man. Clin. Nutr. 1985, 6. [Google Scholar] [CrossRef]
- Innis, S.M. Alteration of Erythrocyte Lipid Composition Following Total Parenteral Nutrition in the Rat. J. Parenter. Enter. Nutr. 1989, 13, 47–50. [Google Scholar] [CrossRef]
- Garone, C.; Tadesse, S.; Hirano, M. Clinical and Genetic Spectrum of Mitochondrial Neurogastrointestinal Encephalomyopathy. Brain 2011, 134, 3326–3332. [Google Scholar] [CrossRef]
- Wang, J.; Chen, W.; Wang, F.; Wu, D.; Qian, J.; Kang, J.; Li, H.; Ma, E. Nutrition Therapy for Mitochondrial Neurogastrointestinal Encephalopathy with Homozygous Mutation of the TYMP Gene. Clin. Nutr. Res. 2015, 4, 132. [Google Scholar] [CrossRef]
- Yadak, R.; Cabrera-Pérez, R.; Torres-Torronteras, J.; Bugiani, M.; Haeck, J.C.; Huston, M.W.; Bogaerts, E.; Goffart, S.; Jacobs, E.H.; Stok, M.; et al. Preclinical Efficacy and Safety Evaluation of Hematopoietic Stem Cell Gene Therapy in a Mouse Model of MNGIE. Mol. Ther. Methods Clin. Dev. 2018, 8, 152–165. [Google Scholar] [CrossRef] [PubMed]
- Torres-Torronteras, J.; Cabrera-Pérez, R.; Barba, I.; Costa, C.; de Luna, N.; Andreu, A.L.; Barquinero, J.; Hirano, M.; Cámara, Y.; Martí, R. Long-Term Restoration of Thymidine Phosphorylase Function and Nucleoside Homeostasis Using Hematopoietic Gene Therapy in a Murine Model of Mitochondrial Neurogastrointestinal Encephalomyopathy. Hum. Gene Ther. 2016, 27, 656–667. [Google Scholar] [CrossRef] [PubMed]
- Scarpelli, M.; Ricciardi, G.K.; Beltramello, A.; Zocca, I.; Calabria, F.; Russignan, A.; Zappini, F.; Cotelli, M.S.; Padovani, A.; Tomelleri, G.; et al. The Role of Brain MRI in Mitochondrial Neurogastrointestinal Encephalomyopathy. Neuroradiol. J. 2013, 26, 520–530. [Google Scholar] [CrossRef] [PubMed]
- Szigeti, K.; Sule, N.; Adesina, A.M.; Armstrong, D.L.; Saifi, G.M.; Bonilla, E.; Hirano, M.; Lupski, J.R. Increased Blood-Brain Barrier Permeability with Thymidine Phosphorylase Deficiency. Ann. Neurol. 2004, 56, 881–886. [Google Scholar] [CrossRef] [PubMed]
- Gramegna, L.L.; Pisano, A.; Testa, C.; Manners, D.N.; D’Angelo, R.; Boschetti, E.; Giancola, F.; Pironi, L.; Caporali, L.; Capristo, M.; et al. Cerebral Mitochondrial Microangiopathy Leads to Leukoencephalopathy in Mitochondrial Neurogastrointestinal Encephalopathy. Am. J. Neuroradiol. 2018, 39, 427–434. [Google Scholar] [CrossRef]
- Asai, K.; Hirano, T.; Kaneko, S.; Moriyama, A.; Nakanishi, K.; Isobe, I.; Eksioglu, Y.Z.; Kato, T. A Novel Glial Growth Inhibitory Factor, Gliostatin, Derived from Neurofibroma. J. Neurochem. 1992, 59, 307–317. [Google Scholar] [CrossRef] [PubMed]
- Asai, K.; Nakanishi, K.; Isobe, I.; Eksioglu, Y.Z.; Hirano, A.; Hama, K.; Miyamoto, T.; Kato, T. Neurotrophic Action of Gliostatin on Cortical Neurons. Identity of Gliostatin and Platelet-Derived Endothelial Cell Growth Factor. J. Biol. Chem. 1992, 267, 20311–20316. [Google Scholar] [PubMed]
- Ueki, T.; Nakanishi, K.; Asai, K.; Okouchi, Y.; Isobe, I.; Eksioglu, Y.Z.; Kato, T.; Kohno, K. Neurotrophic Action of Gliostatin on Cocultured Neurons with Glial Cells. Brain Res. 1993, 622, 299–302. [Google Scholar] [CrossRef]
- Faraji, F.; Karjoo, Z.; Moghaddam, M.V.; Heidari, S.; Emameh, R.Z.; Falak, R. Challenges Related to the Immunogenicity of Parenteral Recombinant Proteins: Underlying Mechanisms and New Approaches to Overcome It. Int. Rev. Immunol. 2018, 37, 301–315. [Google Scholar] [CrossRef] [PubMed]
- Murray, A.M.; Pearson, I.F.S.; Fairbanks, L.D.; Chalmers, R.A.; Bain, M.D.; Bax, B.E. The Mouse Immune Response to Carrier Erythrocyte Entrapped Antigens. Vaccine 2006, 24, 6129–6139. [Google Scholar] [CrossRef]


| Patient | Sex | Age of Diagnosis (Years) | Age at Start of EE-TP | TYMP Mutation | Buffy Coat TP Activity (nmol/mg Protein/h) 1 | Pre-Treatment Plasma Metabolites (µmol/L) | |
|---|---|---|---|---|---|---|---|
| Thymidine | Deoxyuridine | ||||||
| 1 | Female | 23 | 25 | Homozygous for c.1431_1432insT | 40 | 9 | 19 |
| 2 | Male | 26 | 28 | Heterozygous c.866A > C c.1231_1243 del | 0 | 21 | 31 |
| 3 | Male | 15 | 26 | g.4009_4010insG g.4101G > A | 24 | 12 | 19 |
| Urine Collection Period (h) | Urinary Excretion of 51Cr (%) | Reference Range (%) |
|---|---|---|
| 0–24 | 1.1 | 1.0–3.2 |
| 24–48 | 0.8 | |
| 48–72 | 0.7 | |
| Mean | 0.9 |
| Scale | Months of Therapy | ||
|---|---|---|---|
| Pre-Therapy | 7 | 24 | |
| SF36 (health and well-being): | |||
| Physical component (population mean 50 ± 10) | 47 | 52 | 42 |
| Mental component (population mean 50 ± 10) | 43 | 45 | 42 |
| Newcastle mitochondrial disease scale (normal = 0): | |||
| I (general neurological functioning, 0 to 50) | 4 | 4 | 16 |
| II (system specific functioning, 0 to 45) | 6 | 6 | 6 |
| III (clinical assessment, 0 to 50) | 8 | 8 | 19 |
| MRC sum motor score | |||
| (normal = 80) | 73 | 73 | 53 |
| Overall neuropathy limitation scale: | |||
| (0 = no disability, 12 = maximum disability) | 4 | 4 | 4 |
| Sensory sum score: | |||
| (normal = 0, maximum score = 64) | 26 | 26 | 34 |
| Scale | Months of Therapy | ||||
|---|---|---|---|---|---|
| Pre-Therapy | 23 | 50 | 64 | 73 | |
| SF36 (health and well-being) | |||||
| Physical component (population mean 50 ± 10) | 48 | 52 | 55 | 55 | 55 |
| Mental component (population mean 50 ± 10) | 60 | 59 | 60 | 60 | 60 |
| Newcastle mitochondrial disease scale (normal = 0) | |||||
| I (general neurological functioning, 0 to 50) | 4 | 4 | 4 | 4 | 2 |
| II (system specific functioning, 0 to 45) | 2 | 2 | 2 | 6 | 5 |
| III (clinical assessment, 0 to 50) | 11 | 11 | 11 | 9 | 8 |
| MRC sum motor score | |||||
| (normal = 80) | 56 | 74 * | 74 | 74 | 74 |
| Overall neuropathy limitation scale: | |||||
| (0 = no disability, 12 = maximum disability) | 3 | 3 | 3 | 4 | 4 |
| Sensory sum score: | |||||
| (normal = 0, maximum score = 64) | 21 | 19 | 20 | 13 | 4 |
| Infusion # | Observations | Pre-Medication Prior to Infusion |
|---|---|---|
| 2 | nausea felt hot and faint erythema of face, neck and in arm proximal to infusion site tickle sensation in throat subsided spontaneous after 5 min | None |
| 3 | coughing spasm sensation in throat described as a tickle dry mouth felt hot subsided spontaneously after 5 min | Oral chlorphenamine 4 mg 3 h prior |
| 4 | coughing spasm | Oral chlorphenamine 8 mg 3 h prior |
| 5 | generalized paresthesia nausea coughing spasm generalized erythema transient headache, visual disturbance subsided spontaneously after 5 min | Oral chlorphenamine 8 mg 3 h prior IV hydrocortisone 50 mg at time of reaction |
| 6 | no reactions | Oral dexamethazone 4 mg 6 h prior Oral chlorphenamine 8 mg 3 h prior IV maxalon 10 mg immediately prior to infusion |
| 9 | coughing spasm nausea felt hot | As infusion 6 |
| 10 | nausea | Oral dexamethazone 4 mg 6 h prior Oral chlorphenamine 8 mg 3 h prior Oral ondansetron 4 mg 3 h prior |
| 15 | coughing spasm nausea felt cold and shaky | As infusion 10 |
| 17 | coughing spasm nausea erythema of neck | Oral dexamethazone 8 mg 6 h prior Oral chlorphenamine 12 mg in two divided doses: 6 h (8 mg) and 2 h (25%) prior Oral ondansetron 8 mg 3 h prior |
| 18–31 | no reactions | Oral dexamethazone 10 mg 6 h prior Oral chlorphenamine 12 mg two divided doses: 6 h (8 mg) and 2 h (4 mg) prior Oral ondansetron 16 mg total in two equal doses, 6 and 3 h prior |
| Infusion # | Observations | Pre-Medication Prior to Infusion |
|---|---|---|
| 3 | erythema of face felt hot | none |
| 4 | erythema of face felt hot | oral dexamethasone 4 mg 6 h prior oral chlorphenamine 12 mg, 4 mg and 8 mg given respectively 4 h and 1 h prior oral ondansetron 8 mg given 1 h prior |
| 5 | erythema of face felt hot | oral dexamethasone 10 mg 6 h prior oral chlorphenamine 12 mg, 4 mg and 8 mg given respectively 4 h and 1 h prior to infusion oral ondansetron 8 mg given 1 h prior |
| 6 | erythema of face felt hot tightness in chest | oral dexamethasone 12 mg 6 h prior oral chlorphenamine 12 mg, 4 mg and 8 mg given respectively 4 h and 2 h prior to infusion + IV chlorphenamine 8 mg at start of infusion oral ondansetron 8 mg given 1 h prior |
| 7–8 | felt hot erythema of face reduced compared to previous cycles | oral dexamethasone 10 mg 6 h prior IV hydrocortisone 100 mg at start of infusion oral chlorphenamine 12 mg, 2 h prior to infusion and IV 8 mg at start of infusion oral ondansetron 8 mg given 1 h prior |
| 9 | slight erythema of face felt hot | oral monteleukast 20 mg daily for 3 days prior oral dexamethasone 10 mg 6 h prior IV hydrocortisone 100 mg at start of infusion oral chlorphenamine 12 mg, 2 h prior to infusion and IV 8 mg at start of infusion oral ondansetron 6 mg 1 h prior |
| 10 | slight erythema of face felt hot | oral monteleukast 20 mg daily for 3 days prior to infusion oral ketotifen 2 mg daily in 2 equally divided doses for 4 days prior to infusion oral dexamethasone 10 mg 6 h prior oral chlorphenamine 12 mg, 2 h prior oral ondansetron 8 mg given 1 h prior IV hydrocortisone 100 mg at start of infusion. IV 8 mg at start of infusion |
| 11 | very slight erythema of face | as infusion 10 |
| 12–13 | No reactions | oral dexamethasone 10 mg 6 h prior oral chlorphenamine 12 mg, 2 h prior oral ondansetron 4 mg given 1 h prior IV hydrocortisone 100 mg at start of infusion IV 8 mg at start of infusion |
| 14–22 | No reactions | phased withdrawal of pre-medication starting with ondansetron, then oral dexamethasone and chlorphenamine |
| 23–26 | No reactions | IV chlorphenamine 4 mg at start of infusion IV hydrocortisone 100 mg at start of infusion |
| 27 | very slight erythema of face | IV chlorphenamine 8 mg at start of infusion |
| 28–39 | No reactions until infusion 39 when during last 5 min of infusion: erythema of face, tightness in chest | IV chlorphenamine 8 mg at start of infusion IV hydrocortisone 50 mg at start of infusion |
| 40–68 | No reactions | oral dexamethasone 10 mg 5 h prior to infusion oral chlorphenamine 4 mg 4 h prior to infusion IV chlorphenamine 10 mg at start of infusion IV hydrocortisone 100 mg at start of infusion |
| 69- | No reactions | oral dexamethasone 10 mg 5 h prior to infusion oral chlorphenamine 4 mg 4 h prior to infusion IV chlorphenamine 10 mg at start of infusion IV hydrocortisone 50 mg at start of infusion |
| 70 | No reactions | oral dexamethasone 10 mg 5 h prior to infusion oral chlorphenamine 4 mg 4 h prior to infusion IV chlorphenamine 10 mg at start of infusion |
| 71 | No reactions | IV chlorphenamine 5 mg at start of infusion IV hydrocortisone 50 mg at start of infusion |
| 72 | No reactions | oral dexamethasone 10 mg 4 h prior to infusion |
| 73 | No reactions | oral dexamethasone 6 mg 4 h prior to infusion |
| 74–75 | No reactions | oral dexamethasone 4 mg 4 h prior to infusion |
| 76 | Chill 3 h post infusion | none |
| 77–79 | No reactions | IV hydrocortisone 100 mg at start of infusion |
© 2019 by the authors. Licensee MDPI, Basel, Switzerland. This article is an open access article distributed under the terms and conditions of the Creative Commons Attribution (CC BY) license (http://creativecommons.org/licenses/by/4.0/).
Share and Cite
Levene, M.; Bain, M.D.; Moran, N.F.; Nirmalananthan, N.; Poulton, J.; Scarpelli, M.; Filosto, M.; Mandel, H.; MacKinnon, A.D.; Fairbanks, L.; et al. Safety and Efficacy of Erythrocyte Encapsulated Thymidine Phosphorylase in Mitochondrial Neurogastrointestinal Encephalomyopathy. J. Clin. Med. 2019, 8, 457. https://doi.org/10.3390/jcm8040457
Levene M, Bain MD, Moran NF, Nirmalananthan N, Poulton J, Scarpelli M, Filosto M, Mandel H, MacKinnon AD, Fairbanks L, et al. Safety and Efficacy of Erythrocyte Encapsulated Thymidine Phosphorylase in Mitochondrial Neurogastrointestinal Encephalomyopathy. Journal of Clinical Medicine. 2019; 8(4):457. https://doi.org/10.3390/jcm8040457
Chicago/Turabian StyleLevene, Michelle, Murray D. Bain, Nicholas F. Moran, Niranjanan Nirmalananthan, Joanna Poulton, Mauro Scarpelli, Massimiliano Filosto, Hanna Mandel, Andrew D. MacKinnon, Lynette Fairbanks, and et al. 2019. "Safety and Efficacy of Erythrocyte Encapsulated Thymidine Phosphorylase in Mitochondrial Neurogastrointestinal Encephalomyopathy" Journal of Clinical Medicine 8, no. 4: 457. https://doi.org/10.3390/jcm8040457
APA StyleLevene, M., Bain, M. D., Moran, N. F., Nirmalananthan, N., Poulton, J., Scarpelli, M., Filosto, M., Mandel, H., MacKinnon, A. D., Fairbanks, L., Pacitti, D., & Bax, B. E. (2019). Safety and Efficacy of Erythrocyte Encapsulated Thymidine Phosphorylase in Mitochondrial Neurogastrointestinal Encephalomyopathy. Journal of Clinical Medicine, 8(4), 457. https://doi.org/10.3390/jcm8040457