Hematological Indices in Portal Hypertension: Cirrhosis versus Noncirrhotic Portal Hypertension

 , ,
, ,
Abstract
:1. Introduction
2. Experimental Section
2.1. Study Population
2.2. Clinical, Laboratory and Radiological Assessments
2.3. Statistical Analysis
3. Results
3.1. Characteristics of Patients
3.2. PHT and Related Complications
3.3. Comparison of Hematological Indices between Cirrhosis and NCPHT
3.4. Influences of Gender and Age on Hematological Indices
3.5. Splenomegaly and Hematological Indices
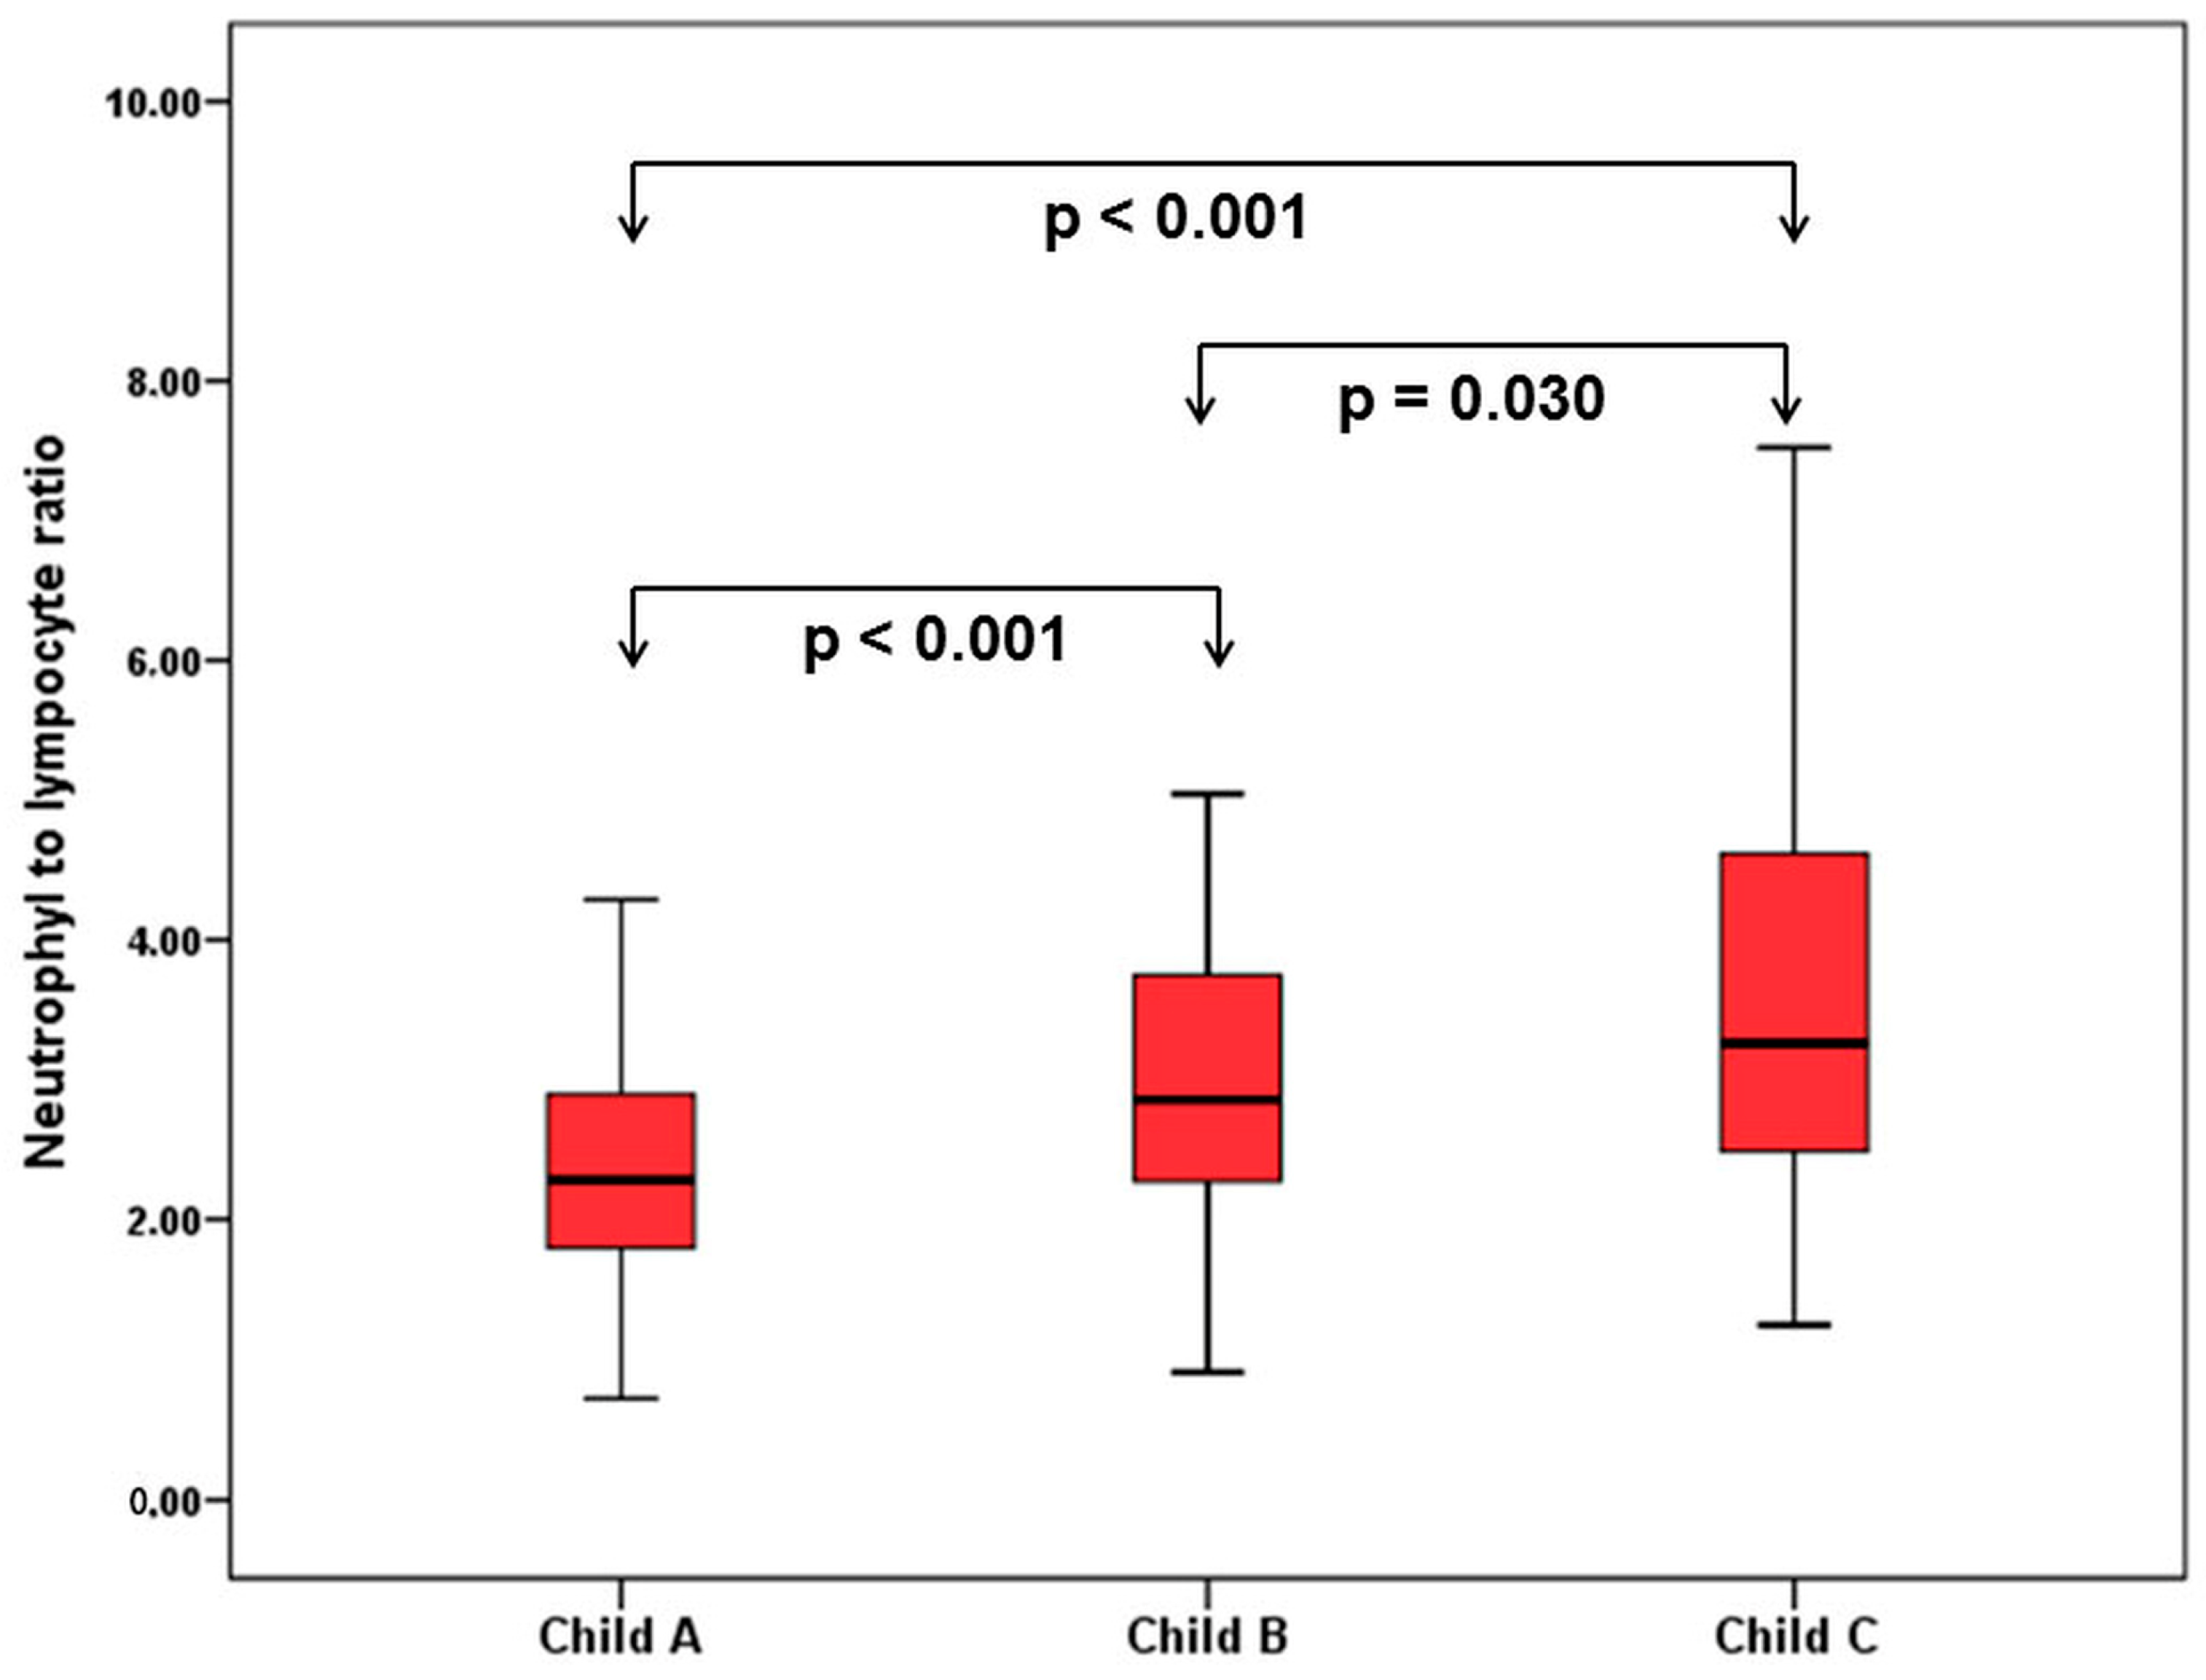
3.6. Comparison of Hematological Indices in Cirrhosis
4. Discussion
5. Conclusions
Author Contributions
Funding
Conflicts of Interest
References
- Kumar, A.; Sharma, P.; Sarin, S.K. Hepatic venous pressure gradient measurement: Time to learn! Indian J. Gastroenterol. 2008, 27, 74–80. [Google Scholar] [PubMed]
- Ripoll, C. Hepatic venous pressure gradient and outcomes in cirrhosis. J. Clin. Gastroenterol. 2007, 41 (Suppl. S3), S330–S335. [Google Scholar] [CrossRef] [PubMed]
- Garcia-Tsao, G.; Abraldes, J.G.; Berzigotti, A.; Bosch, J. Portal hypertensive bleeding in cirrhosis: Risk stratification, diagnosis, and management: 2016 practice guidance by the american association for the study of liver diseases. Hepatology 2017, 65, 310–335. [Google Scholar] [CrossRef] [PubMed]
- Okuda, K. Non-cirrhotic portal hypertension versus idiopathic portal hypertension. J. Gastroenterol. Hepatol. 2002, 17 (Suppl. S3), S204–S213. [Google Scholar] [CrossRef] [PubMed]
- Ripoll, C.; Groszmann, R.; Garcia-Tsao, G.; Grace, N.; Burroughs, A.; Planas, R.; Escorsell, A.; Garcia-Pagan, J.C.; Makuch, R.; Patch, D.; et al. Hepatic venous pressure gradient predicts clinical decompensation in patients with compensated cirrhosis. Gastroenterology 2007, 133, 481–488. [Google Scholar] [CrossRef] [PubMed]
- Bosch, J.; Garcia-Pagan, J.C. Complications of cirrhosis. I. Portal hypertension. J. Hepatol. 2000, 32, 141–156. [Google Scholar] [CrossRef]
- Kim, M.Y.; Jeong, W.K.; Baik, S.K. Invasive and non-invasive diagnosis of cirrhosis and portal hypertension. World J. Gastroenterol. 2014, 20, 4300–4315. [Google Scholar] [CrossRef] [PubMed]
- Khanna, R.; Sarin, S.K. Non-cirrhotic portal hypertension—Diagnosis and management. J. Hepatol. 2014, 60, 421–441. [Google Scholar] [CrossRef] [PubMed]
- Abby Philips, C.; Sahney, A. Oesophageal and gastric varices: Historical aspects, classification and grading: Everything in one place. Gastroenterol. Rep. 2016, 4, 186–195. [Google Scholar] [CrossRef] [PubMed]
- McLean, E.; Cogswell, M.; Egli, I.; Wojdyla, D.; de Benoist, B. Worldwide prevalence of anaemia, who vitamin and mineral nutrition information system, 1993–2005. Public Health Nutr. 2009, 12, 444–454. [Google Scholar] [CrossRef] [PubMed]
- Goddard, A.F.; James, M.W.; McIntyre, A.S.; Scott, B.B. British Society of Gastroenterology. Guidelines for the management of iron deficiency anaemia. Gut 2011, 60, 1309–1316. [Google Scholar] [CrossRef] [PubMed]
- Qamar, A.A.; Grace, N.D.; Groszmann, R.J.; Garcia-Tsao, G.; Bosch, J.; Burroughs, A.K.; Ripoll, C.; Maurer, R.; Planas, R.; Escorsell, A.; et al. Incidence, prevalence, and clinical significance of abnormal hematologic indices in compensated cirrhosis. Clin. Gastroenterol. Hepatol. 2009, 7, 689–695. [Google Scholar] [CrossRef] [PubMed]
- Zhao, Z.; Liu, J.; Wang, J.; Xie, T.; Zhang, Q.; Feng, S.; Deng, H.; Zhong, B. Platelet-to-lymphocyte ratio (PLR) and neutrophil-to-lymphocyte ratio (NLR) are associated with chronic hepatitis b virus (HBV) infection. Int. Immunopharmacol. 2017, 51, 1–8. [Google Scholar] [CrossRef] [PubMed]
- Mutchnick, M.G.; Lerner, E.; Conn, H.O. Effect of portacaval anastomosis on hypersplenism. Dig. Dis. Sci. 1980, 25, 929–938. [Google Scholar] [CrossRef] [PubMed]
- Bashour, F.N.; Teran, J.C.; Mullen, K.D. Prevalence of peripheral blood cytopenias (hypersplenism) in patients with nonalcoholic chronic liver disease. Am. J. Gastroenterol. 2000, 95, 2936–2939. [Google Scholar] [CrossRef] [PubMed]
- Rajalingam, R.; Javed, A.; Sharma, D.; Sakhuja, P.; Singh, S.; Nag, H.H.; Agarwal, A.K. Management of hypersplenism in non-cirrhotic portal hypertension: A surgical series. Hepatobiliary Pancreat. Dis. Int. 2012, 11, 165–171. [Google Scholar] [CrossRef]
- Lv, Y.; Yee Lau, W.; Wu, H.; Han, X.; Gong, X.; Liu, N.; Yue, J.; Li, Q.; Li, Y.; Deng, J. Causes of peripheral cytopenia in hepatitic cirrhosis and portal hypertensive splenomegaly. Exp. Biol. Med. 2017, 242, 744–749. [Google Scholar] [CrossRef] [PubMed] [Green Version]
- Lv, Y.; Han, X.; Gong, X.; Ma, Q.; Chang, S.; Wu, H.; Li, Y.; Deng, J. Grading of peripheral cytopenias caused by nonalcoholic cirrhotic portal hypertension and its clinical significance. Cell Biochem. Biophys. 2015, 71, 1141–1145. [Google Scholar] [CrossRef] [PubMed]
- Qamar, A.A.; Grace, N.D. Abnormal hematological indices in cirrhosis. Can. J. Gastroenterol. 2009, 23, 441–445. [Google Scholar] [CrossRef] [PubMed]
- Kwon, J.H.; Jang, J.W.; Kim, Y.W.; Lee, S.W.; Nam, S.W.; Jaegal, D.; Lee, S.; Bae, S.H. The usefulness of c-reactive protein and neutrophil-to-lymphocyte ratio for predicting the outcome in hospitalized patients with liver cirrhosis. BMC Gastroenterol. 2015, 15, 146. [Google Scholar] [CrossRef] [PubMed]
- Moreau, N.; Wittebole, X.; Fleury, Y.; Forget, P.; Laterre, P.F.; Diego, C.Z. Neutrophil-to-lymphocyte ratio predicts death in acute-on-chronic liver failure patients admitted to the intensive care unit: A retrospective cohort study. Shock 2017, 489, 385. [Google Scholar] [CrossRef] [PubMed]
- Biyik, M.; Ucar, R.; Solak, Y.; Gungor, G.; Polat, I.; Gaipov, A.; Cakir, O.O.; Ataseven, H.; Demir, A.; Turk, S.; et al. Blood neutrophil-to-lymphocyte ratio independently predicts survival in patients with liver cirrhosis. Eur. J. Gastroenterol. Hepatol. 2013, 25, 435–441. [Google Scholar] [CrossRef] [PubMed]
- Zhang, H.; Sun, Q.; Mao, W.; Fan, J.; Ye, B. Neutrophil-to-lymphocyte ratio predicts early mortality in patients with HBV-related decompensated cirrhosis. Gastroenterol. Res. Pract. 2016, 2016, 4394650. [Google Scholar] [CrossRef] [PubMed]


| Cirrhosis (n = 239) | NCPHT (n = 89) | p | |
|---|---|---|---|
| Age, years | 58.3 ± 13.9 | 46.5 ± 17.3 | <0.001 |
| Sex, male/female | 134/105 | 51/38 | 0.841 |
| Varices, n(%) | 200 (83.7%) | 45 (50.6%) | <0.001 |
| Esophageal varices, n(%) | 198 (82.8%) | 39 (43.9%) | <0.001 |
| Grade 1, n(%) | 45 (18.8%) | 15 (16.9%) | |
| Grade 2, n(%) | 86 (36.0%) | 15 (16.9%) | |
| Grade 3, n(%) | 64 (26.8%) | 9 (10.1%) | |
| Gastric varices, n(%) | 33 (13.8%) | 14 (15.7%) | 0.737 |
| GOV-1, n(%) | 10 (4.2%) | 4 (4.5%) | |
| GOV-2, n(%) | 8 (3.3%) | 2 (2.2%) | |
| IGV-1, n(%) | 15 (6.3%) | 8 (9.0%) | |
| IGV-2, n(%) | 0 | 0 | |
| Variceal bleeding, n(%) | 56 (28.0%) | 3 (6.6%) | <0.001 |
| Ascites, n(%) | 142 (59.4%) | 12 (13.8%) | <0.001 |
| Grade 1, n(%) | 44 (18.4%) | 5 (5.6%) | |
| Grade 2, n(%) | 46 (19.2%) | 6 (6.7%) | |
| Grade 3, n(%) | 52 (21.8%) | 0 | |
| Hepatic encephalopathy, n(%) | 50 (20.9%) | 0 | <0.001 |
| Splenomegaly, n(%) | 208 (87.0%) | 61 (70.1%) | <0.001 |
| Spleen, mm (median ± SE) | 150 ± 1.8 | 140 ± 3.5 | 0.002 |
| Portal vein thrombosis, n(%) | 47 (19.7%) | 33 (37.1%) | 0.004 |
| Child–Turcotte–Pugh class | |||
| Class A, n(%) | 91 (38.1%) | ||
| Class B, n(%) | 88 (36.8%) | ||
| Class C, n(%) | 60 (25.1%) | ||
| Model for End-Stage Liver Disease (MELD), median (IQR) | 8 (4–12) |
| Cirrhosis (n = 239) | NCPHT (n = 89) | p | |
|---|---|---|---|
| Cytopenia, n(%) | 221 (92.5%) | 49 (55.1%) | <0.001 |
| Normal, n(%) | 18 (7.5%) | 40 (44.9%) | |
| Monocytopenia, n(%) | 72 (30.2%) | 30 (33.7%) | |
| Bicytopenia, n(%) | 95 (39.7%) | 12 (13.5%) | |
| Pancytopenia, n(%) | 54 (22.6%) | 7 (7.9%) | |
| Anemia, n(%) | 147 (61.5%) | 33 (37.1%) | <0.001 |
| Leukopenia, n(%) | 81 (33.9%) | 15 (16.9%) | 0.030 |
| Thrombocytopenia, n(%) | 197 (82.4%) | 27 (30.3%) | <0.001 |
| Leukocyte, (×103/uL) | 4585 ± 126 | 5840 ± 205 | <0.001 |
| Neutrophil, (×103/uL) | 2845 ± 88 | 3420 ± 156 | 0.005 |
| Lymphocyte, (×103/uL) | 1075 ± 37 | 1390 ± 76 | <0.001 |
| Hemoglobin, g/dL | 11.7 ± 0.2 | 13.0 ± 0.2 | <0.001 |
| Platelet, (×103/uL) | 103,000 ± 3600 | 202,000 ± 10820 | <0.001 |
| NLR | 2.71 ± 0.14 | 2.47 ± 0.19 | 0.125 |
| INR | 1.33 ± 0.31 | 1.09 ± 0.14 | <0.001 |
| Albumin (g/dL) | 3.2 ± 0.7 | 4.1 ± 0.5 | <0.001 |
| Bilirubin,(mg/dL) | 1.4 ± 0.23 | 0.8 ± 0.14 | <0.001 |
| Creatinine, (mg/dL) | 0.70 ± 0.02 | 0.78 ± 0.07 | 0.002 |
| <50 Years | p | ≥50 Years | p | |||
|---|---|---|---|---|---|---|
| NCPHT (n = 51) | Cirrhosis (n = 50) | NCPHT (n = 38) | Cirrhosis (n = 189) | |||
| Age, years | 33.7 ± 8.4 | 37.6 ± 8.5 | 0.023 | 63.8 ± 8.9 | 63.8 ± 8,9 | 0.995 |
| Leukocyte, (×103/uL) | 5750 ± 285 | 4405 ± 245 | 0.002 | 5855 ± 320 | 4600 ± 145 | 0.009 |
| Neutrophil, (×103/uL) | 3430 ± 210 | 2730 ± 160 | 0.006 | 3320 ± 220 | 2900 ± 100 | 0.084 |
| Lymphocyte, (×103/uL) | 1360 ± 100 | 1165 ± 80 | 0.040 | 1435 ± 115 | 1050 ± 40 | 0.008 |
| Hemoglobin, g/dL | 13.1 ± 2.2 | 12.7 ± 2.5 | 0.291 | 12.6 ± 1.9 | 11.4 ± 2.2 | 0.002 |
| Platelet, (×103/uL) | 204,000 ± 14,300 | 98,500 ± 6870 | <0.001 | 190,000 ± 16,800 | 104,000 ± 4160 | <0.001 |
| NLR | 2.62 ± 0.20 | 2.35 ± 0.19 | 0.924 | 2.40 ± 0.36 | 2.84 ± 0.16 | 0.256 |
| Spleen, mm | 153 ± 34 | 167 ± 34 | 0.041 | 137 ± 24 | 151 ± 25 | 0.001 |
| CTP-A (n = 91) | CTP-B (n = 88) | CTP-C (n = 60) | pa | pb | pc | |
|---|---|---|---|---|---|---|
| Leukocyte, (×103/uL) | 4400 ± 190 | 4420 ± 184 | 5613 ± 293 | 0.826 | 0.042 | 0.020 |
| Neutrophil, (×103/uL) | 2780 ± 110 | 2760 ± 130 | 3320 ± 220 | 0.819 | 0.002 | 0.005 |
| Lymphocyte, (×103/uL) | 1160 ± 70 | 1050 ± 50 | 950 ± 60 | 0.196 | 0.047 | 0.336 |
| Hemoglobin, g/dL | 12.6 ± 2.2 | 11.3 ± 2.3 | 10.7 ± 2.1 | 0.001 | <0.001 | 0.163 |
| Platelet, (×103/uL) | 104,000 ± 5600 | 108,000 ± 5100 | 98,000 ± 8870 | 0.625 | 0.377 | 0.202 |
| NLR | 2.28 ± 0.14 | 2.85 ± 0.19 | 3.26 ± 0.37 | <0.001 | <0.001 | 0.030 |
| Spleen, mm | 154 ± 31 | 157 ± 25 | 153 ± 28 | 0.512 | 0.828 | 0.384 |
© 2018 by the authors. Licensee MDPI, Basel, Switzerland. This article is an open access article distributed under the terms and conditions of the Creative Commons Attribution (CC BY) license (http://creativecommons.org/licenses/by/4.0/).
Share and Cite
Sahin, A.; Artas, H.; Tunc, N.; Yalniz, M.; Bahcecioglu, I.H. Hematological Indices in Portal Hypertension: Cirrhosis versus Noncirrhotic Portal Hypertension. J. Clin. Med. 2018, 7, 196. https://doi.org/10.3390/jcm7080196
Sahin A, Artas H, Tunc N, Yalniz M, Bahcecioglu IH. Hematological Indices in Portal Hypertension: Cirrhosis versus Noncirrhotic Portal Hypertension. Journal of Clinical Medicine. 2018; 7(8):196. https://doi.org/10.3390/jcm7080196
Chicago/Turabian StyleSahin, Abdurrahman, Hakan Artas, Nurettin Tunc, Mehmet Yalniz, and Ibrahim Halil Bahcecioglu. 2018. "Hematological Indices in Portal Hypertension: Cirrhosis versus Noncirrhotic Portal Hypertension" Journal of Clinical Medicine 7, no. 8: 196. https://doi.org/10.3390/jcm7080196
APA StyleSahin, A., Artas, H., Tunc, N., Yalniz, M., & Bahcecioglu, I. H. (2018). Hematological Indices in Portal Hypertension: Cirrhosis versus Noncirrhotic Portal Hypertension. Journal of Clinical Medicine, 7(8), 196. https://doi.org/10.3390/jcm7080196