Could Cardiovascular Health Metrics Account for Age and Sex Disparities in Self-Reported Ischemic Heart Disease Prevalence?

Abstract
1. Introduction
2. Methods
2.1. Study Design and Participants
2.2. CVH Metrics
2.3. Outcome Measurement
2.4. Covariates
2.5. Statistical Analysis
3. Results
3.1. Baseline Characteristics
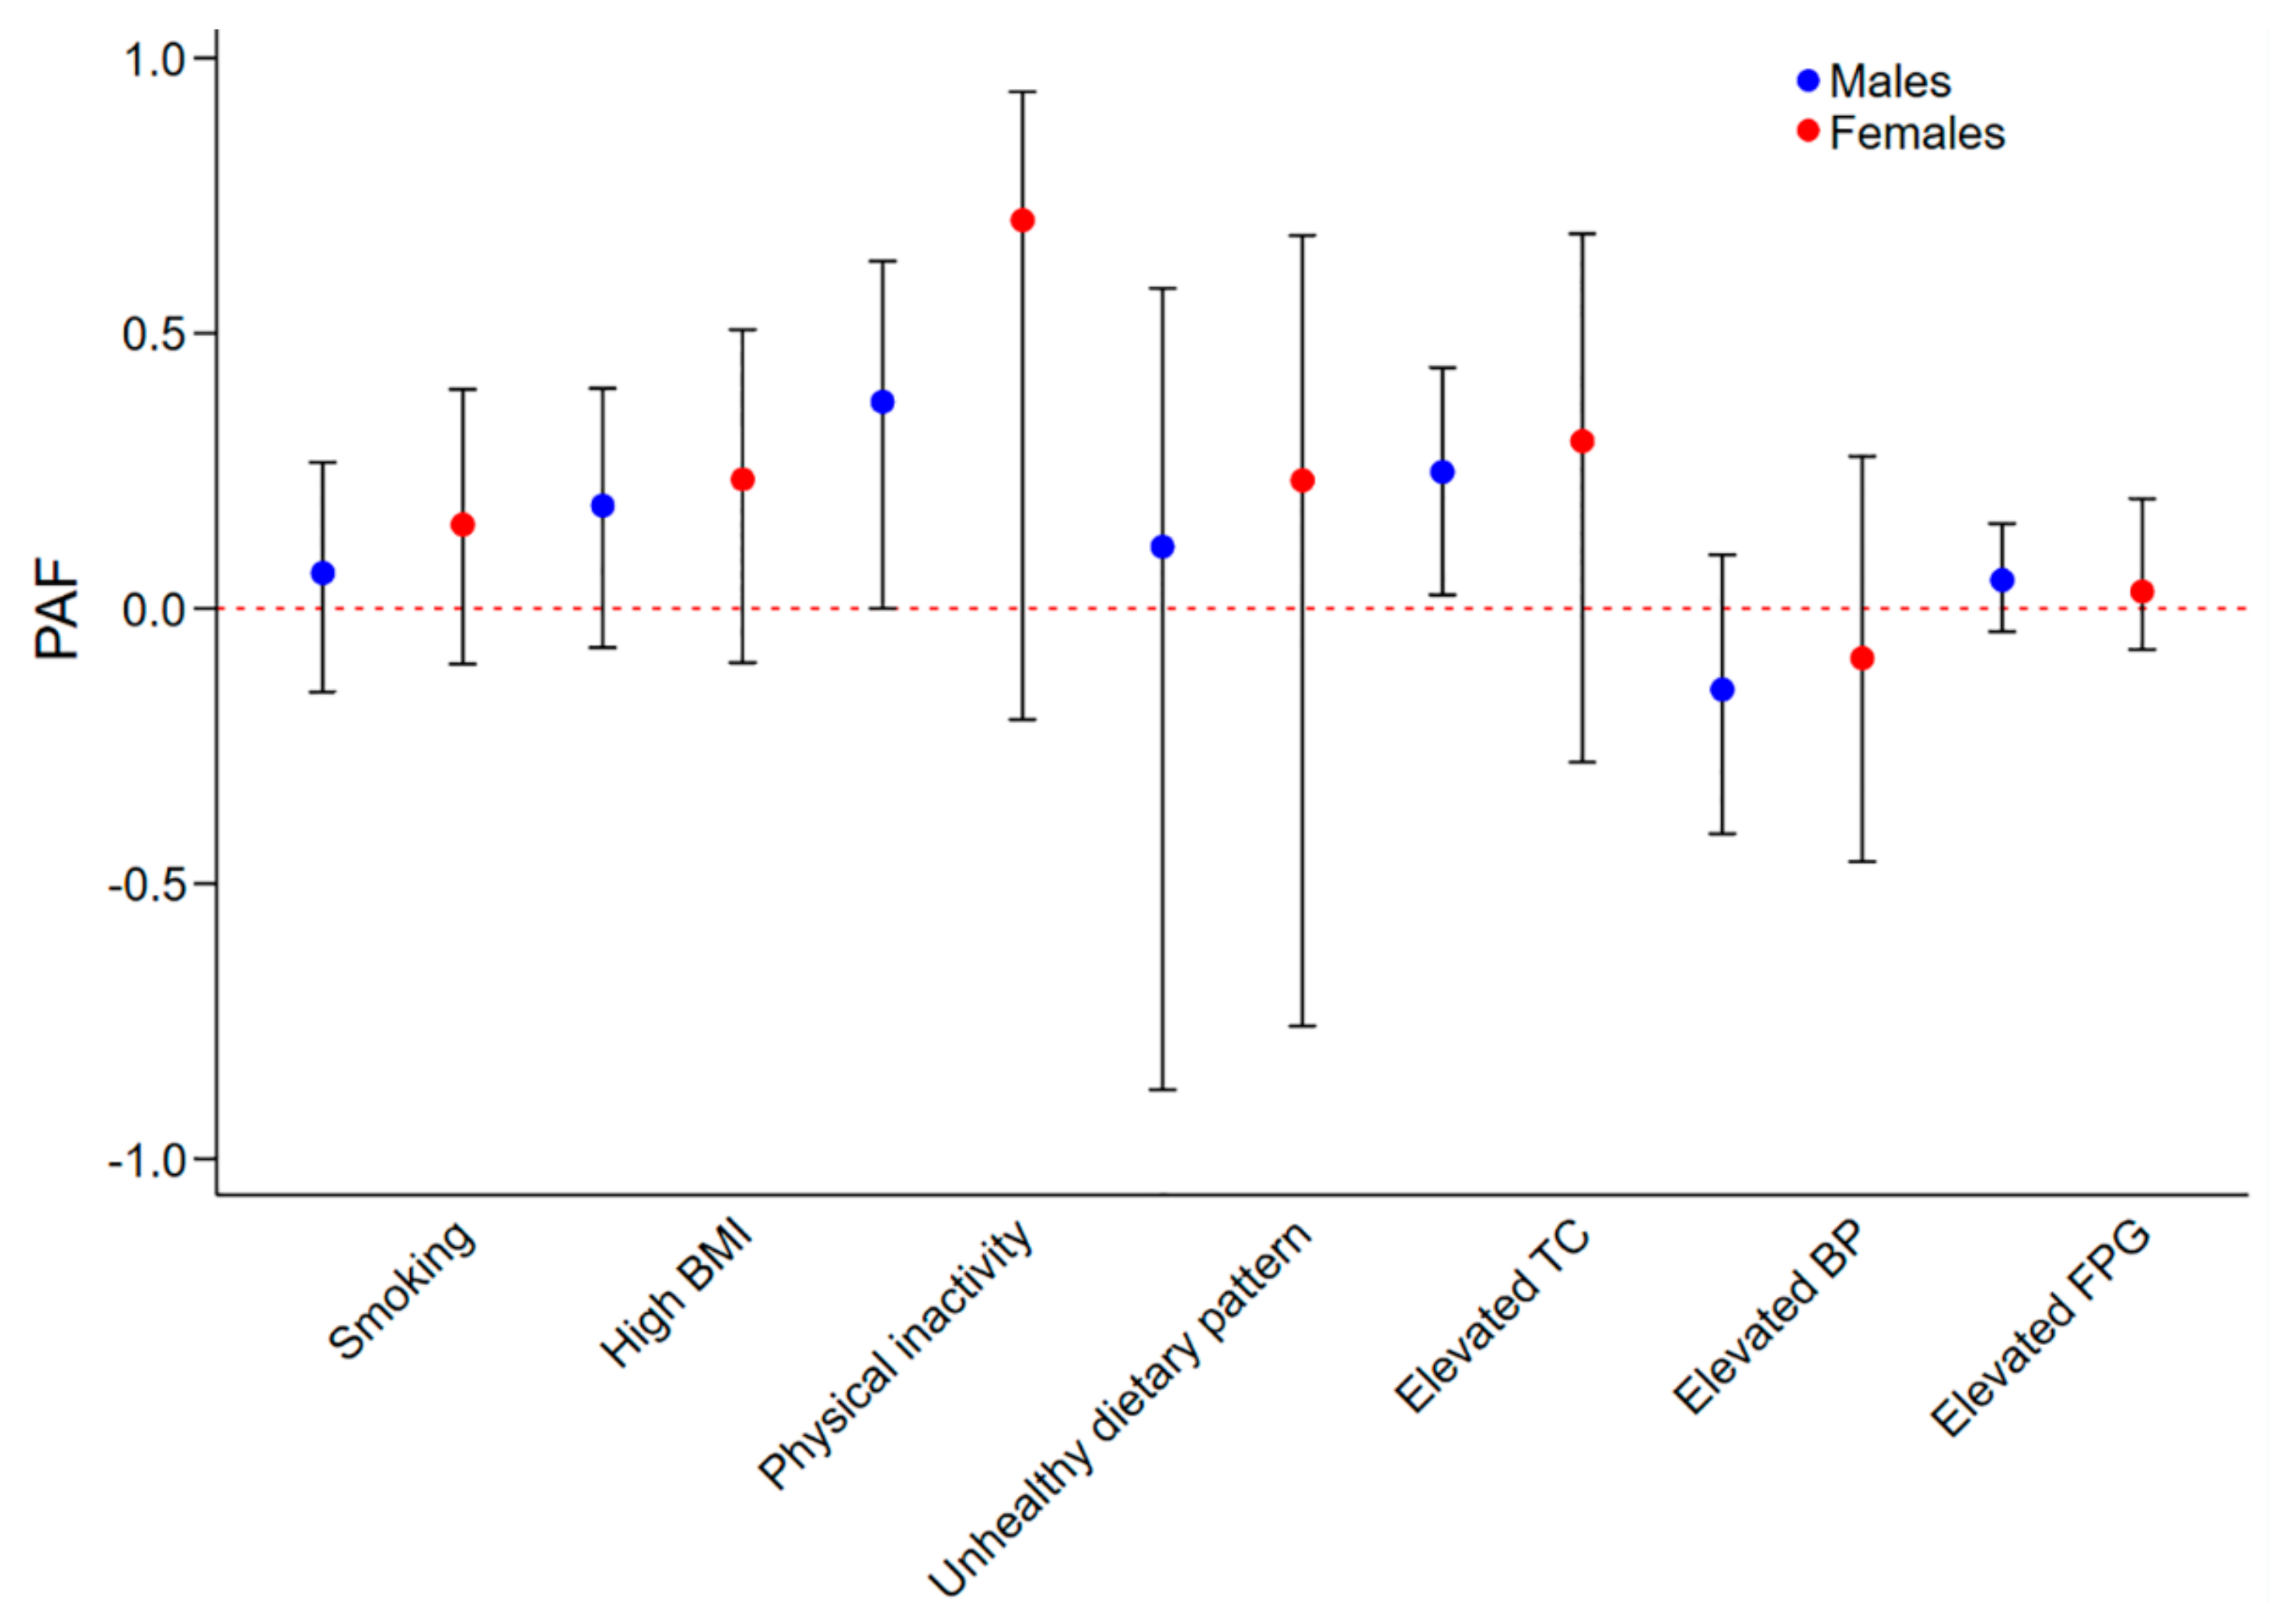
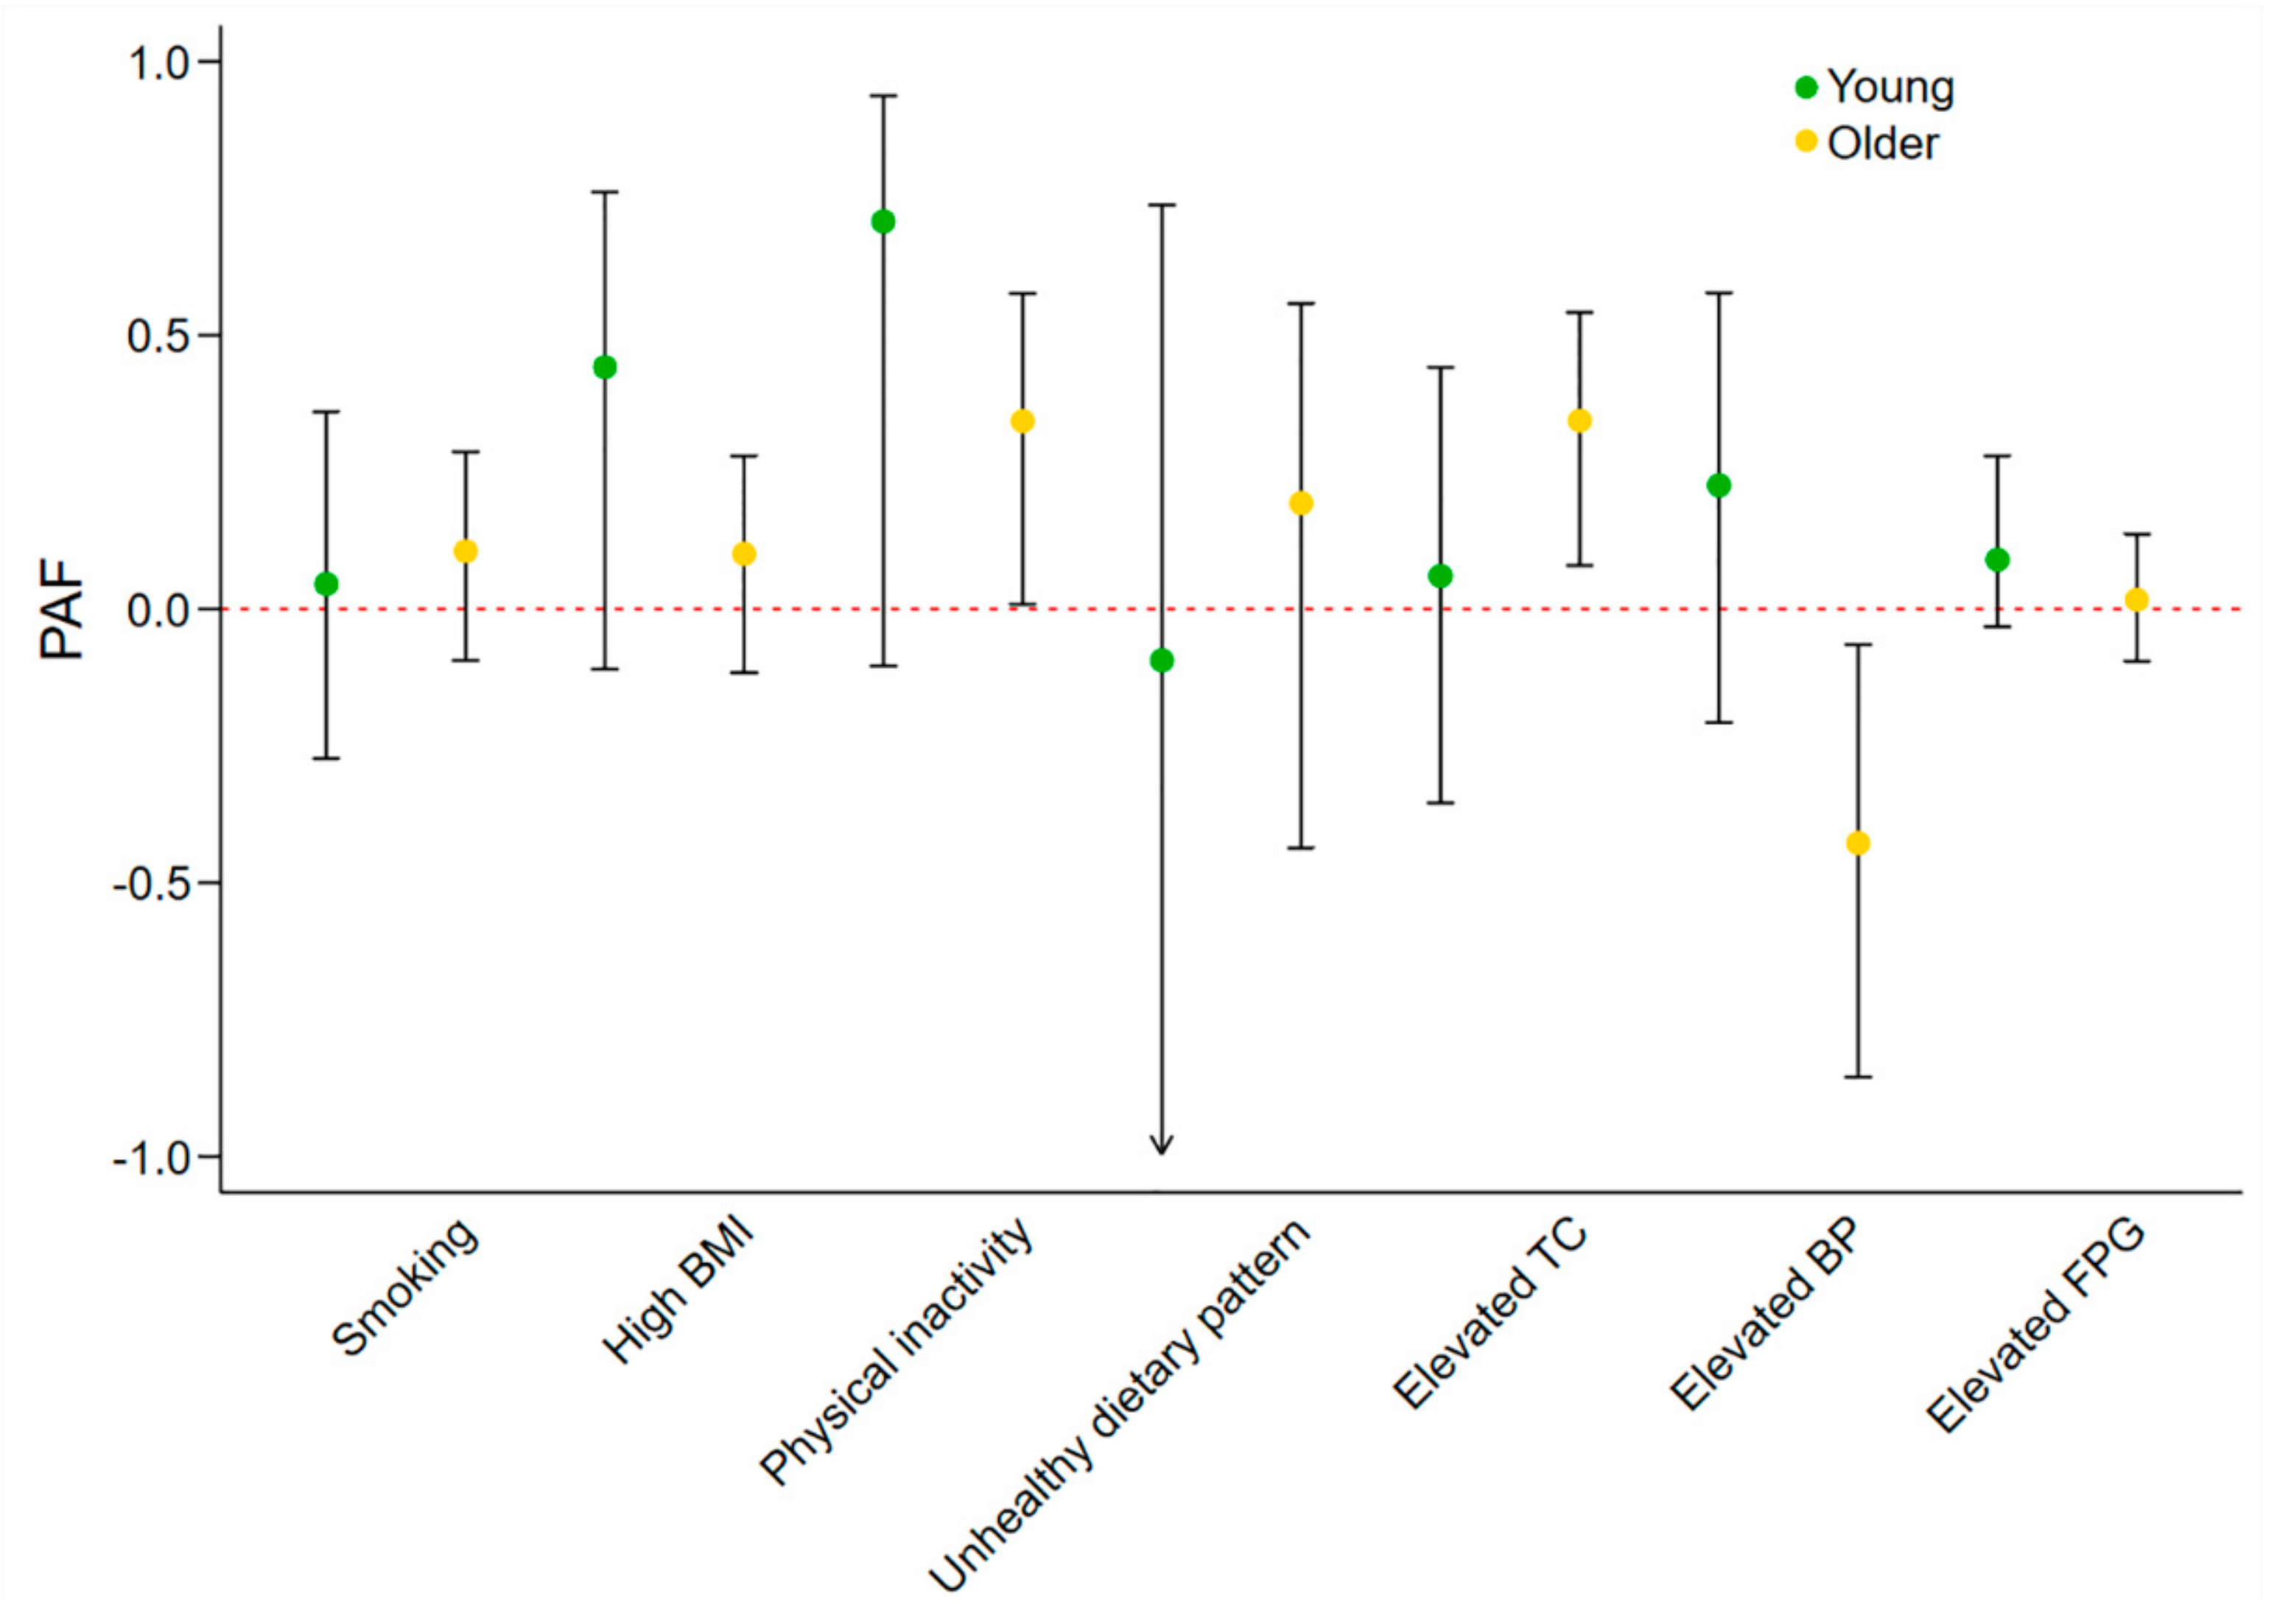
3.2. Sex and Age-Specific Effects of Individual Metrics on IHD Prevalence
3.3. Sex and Age-Specific Effects of Number of Ideal CVH Metrics on IHD Prevalence
4. Discussion
5. Conclusions
Author Contributions
Funding
Conflicts of Interest
References
- GBD 2016 Causes of Death Collaborators. Global, regional, and national age-sex specific mortality for 264 causes of death, 1980–2016: A systematic analysis for the Global Burden of Disease Study 2016. Lancet 2017, 390, 1151–1210. [Google Scholar] [CrossRef]
- Lv, J.; Yu, C.; Guo, Y.; Bian, Z.; Yang, L.; Chen, Y.; Tang, X.; Zhang, W.; Qian, Y.; Huang, Y.; et al. Adherence to Healthy Lifestyle and Cardiovascular Diseases in the Chinese Population. J. Am. Coll. Cardiol. 2017, 69, 1116–1125. [Google Scholar] [CrossRef] [PubMed]
- Chomistek, A.K.; Chiuve, S.E.; Eliassen, A.H.; Mukamal, K.J.; Willett, W.C.; Rimm, E.B. Healthy lifestyle in the primordial prevention of cardiovascular disease among young women. J. Am. Coll. Cardiol. 2015, 65, 43–51. [Google Scholar] [CrossRef] [PubMed]
- Lloyd-Jones, D.M.; Hong, Y.; Labarthe, D.; Mozaffarian, D.; Appel, L.J.; Van Horn, L.; Greenlund, K.; Daniels, S.; Nichol, G.; Tomaselli, G.F.; et al. Defining and setting national goals for cardiovascular health promotion and disease reduction: The American Heart Association’s strategic Impact Goal through 2020 and beyond. Circulation 2010, 121, 586–613. [Google Scholar] [CrossRef] [PubMed]
- Peng, Y.; Wang, Z.; Dong, B.; Cao, S.; Hu, J.; Adegbija, O. Life’s Simple 7 and ischemic heart disease in the general Australian population. PLoS ONE 2017, 12, e0187020. [Google Scholar] [CrossRef] [PubMed]
- Yang, Q.; Cogswell, M.E.; Dana Flanders, W.; Hong, Y.; Zhang, Z.; Loustalot, F.; Gillespie, C.; Merritt, R.; Hu, F.B. Trends in cardiovascular health metrics and associations with all-cause and CVD mortality among us adults. JAMA 2012, 307, 1273–1283. [Google Scholar] [CrossRef] [PubMed]
- Hackshaw, A.; Morris, J.K.; Boniface, S.; Tang, J.L.; Milenkovic, D. Low cigarette consumption and risk of coronary heart disease and stroke: Meta-analysis of 141 cohort studies in 55 study reports. BMJ 2018, 360, j5855. [Google Scholar] [CrossRef] [PubMed]
- Huxley, R.R.; Hirakawa, Y.; Hussain, M.A.; Aekplakorn, W.; Wang, X.; Peters, S.A.; Mamun, A.; Woodward, M. Age- and Sex-Specific Burden of Cardiovascular Disease Attributable to 5 Major and Modifiable Risk Factors in 10 Asian Countries of the Western Pacific Region. Circ. J. 2015, 79, 1662–1674. [Google Scholar] [CrossRef] [PubMed]
- Gaye, B.; Canonico, M.; Perier, M.C.; Samieri, C.; Berr, C.; Dartigues, J.F.; Tzourio, C.; Elbaz, A.; Empana, J.P. Ideal Cardiovascular Health, Mortality, and Vascular Events in Elderly Subjects: The Three-City Study. J. Am. Coll. Cardiol. 2017, 69, 3015–3026. [Google Scholar] [CrossRef] [PubMed]
- Huxley, R.; Barzi, F.; Woodward, M. Excess risk of fatal coronary heart disease associated with diabetes in men and women: Meta-analysis of 37 prospective cohort studies. BMJ 2006, 332, 73–78. [Google Scholar] [CrossRef] [PubMed]
- Huxley, R.R.; Woodward, M. Cigarette smoking as a risk factor for coronary heart disease in women compared with men: A systematic review and meta-analysis of prospective cohort studies. Lancet 2011, 378, 1297–1305. [Google Scholar] [CrossRef]
- Peters, S.A.; Singhateh, Y.; Mackay, D.; Huxley, R.R.; Woodward, M. Total cholesterol as a risk factor for coronary heart disease and stroke in women compared with men: A systematic review and meta-analysis. Atherosclerosis 2016, 248, 123–131. [Google Scholar] [CrossRef]
- Singh, G.M.; Danaei, G.; Farzadfar, F.; Stevens, G.A.; Woodward, M.; Wormser, D.; Kaptoge, S.; Whitlock, G.; Qiao, Q.; Lewington, S.; et al. The age-specific quantitative effects of metabolic risk factors on cardiovascular diseases and diabetes: A pooled analysis. PLoS ONE 2013, 8, e65174. [Google Scholar] [CrossRef] [PubMed]
- Lacey, B.; Lewington, S.; Clarke, R.; Kong, X.L.; Chen, Y.; Guo, Y.; Yang, L.; Bennett, D.; Bragg, F.; Bian, Z.; et al. Age-specific association between blood pressure and vascular and non-vascular chronic diseases in 0.5 million adults in China: A prospective cohort study. Lancet Glob. Health 2018, 6, e641–e649. [Google Scholar] [CrossRef]
- Rao Kondapally Seshasai, S.; Kaptoge, S.; Thompson, A.; Di Angelantonio, E.; Gao, P.; Sarwar, N.; Whincup, P.H.; Mukamal, K.J.; Gillum, R.F.; Holme, I.; et al. Diabetes mellitus, fasting glucose, and risk of cause-specific death. N. Engl. J. Med. 2011, 364, 829–841. [Google Scholar] [PubMed]
- Manson, J.E.; Greenland, P.; LaCroix, A.Z.; Stefanick, M.L.; Mouton, C.P.; Oberman, A.; Perri, M.G.; Sheps, D.S.; Pettinger, M.B.; Siscovick, D.S. Walking compared with vigorous exercise for the prevention of cardiovascular events in women. N. Engl. J. Med. 2002, 347, 716–725. [Google Scholar] [CrossRef] [PubMed]
- Tillmann, T.; Vaucher, J.; Okbay, A.; Pikhart, H.; Peasey, A.; Kubinova, R.; Pajak, A.; Tamosiunas, A.; Malyutina, S.; Hartwig, F.P.; et al. Education and coronary heart disease: Mendelian randomisation study. BMJ 2017, 358, j3542. [Google Scholar] [CrossRef] [PubMed]
- Konttinen, H.; Kilpi, F.; Moustgaard, H.; Martikainen, P. Socioeconomic Position and Antidepressant Use as Predictors of Coronary Heart Disease Mortality: A Population-Based Registry Study of 362,271 Finns. Psychosom. Med. 2016, 78, 144–152. [Google Scholar] [CrossRef] [PubMed]
- Ramachandran, H.J.; Wu, V.X.; He, H.G.; Jiang, Y.; Wang, W. Awareness, knowledge, healthy lifestyle behaviors, and their correlates to coronary heart disease among working women in Singapore. Heart Lung 2016, 45, 341–349. [Google Scholar] [CrossRef] [PubMed]
- Yasaitis, L.C.; Berkman, L.F.; Chandra, A. Comparison of self-reported and Medicare claims-identified acute myocardial infarction. Circulation 2015, 131, 1477–1485. [Google Scholar] [CrossRef] [PubMed]
- Muggah, E.; Graves, E.; Bennett, C.; Manuel, D.G. Ascertainment of chronic diseases using population health data: A comparison of health administrative data and patient self-report. BMC Public Health 2013, 13, 16. [Google Scholar] [CrossRef] [PubMed]
- Okura, Y.; Urban, L.H.; Mahoney, D.W.; Jacobsen, S.J.; Rodeheffer, R.J. Agreement between self-report questionnaires and medical record data was substantial for diabetes, hypertension, myocardial infarction and stroke but not for heart failure. J. Clin. Epidemiol. 2004, 57, 1096–1103. [Google Scholar] [CrossRef] [PubMed]
- Bolland, M.J.; Barber, A.; Doughty, R.N.; Grey, A.; Gamble, G.; Reid, I.R. Differences between self-reported and verified adverse cardiovascular events in a randomised clinical trial. BMJ Open 2013, 3. [Google Scholar] [CrossRef] [PubMed]


| Metrics | Status | Males, n (%) | Females, n (%) | p | Young, n (%) | Older, n (%) | p |
|---|---|---|---|---|---|---|---|
| IHD | Yes | 214 (4.2) | 143 (2.5) | <0.01 | 72 (1.1) | 285 (10.2) | <0.01 |
| No | 3115 (95.8) | 4027 (97.5) | 4751 (98.9) | 2391 (89.8) | |||
| Smoking | Ideal | 1420 (49.8) | 2342 (61.1) | <0.01 | 2521 (57.7) | 1241 (49.0) | <0.01 |
| Non-ideal | 1909 (50.2) | 1828 (38.9) | 2302 (42.3) | 1435 (51.0) | |||
| BMI | Ideal | 833 (32.3) | 1562 (46.2) | <0.01 | 1750 (43.1) | 645 (27.2) | <0.01 |
| Non-ideal | 2388 (67.7) | 2344 (53.8) | 2843 (56.9) | 1889 (72.8) | |||
| Physical activity | Ideal | 945 (32.7) | 829 (20.9) | <0.01 | 1320 (30.0) | 454 (16.6) | <0.01 |
| Non-ideal | 2382 (67.3) | 3339 (79.1) | 3500 (70.0) | 2221 (83.4) | |||
| Dietary pattern | Ideal | 93 (2.1) | 341 (7.4) | <0.01 | 223 (4.1) | 211 (6.9) | <0.01 |
| Non-ideal | 3236 (97.9) | 3829 (92.6) | 4600 (95.9) | 2465 (93.1) | |||
| TC | Ideal | 1259 (45.1) | 1568 (45.8) | 0.70 | 2246 (52.5) | 581 (23.9) | <0.01 |
| Non-ideal | 2070 (54.9) | 2602 (54.2) | 2577 (47.5) | 2095 (76.1) | |||
| BP | Ideal | 1047 (36.7) | 1781 (51.6) | <0.01 | 2234 (51.4) | 594 (21.9) | <0.01 |
| Non-ideal | 2189 (63.3) | 2204 (48.4) | 2427 (48.6) | 1966 (78.1) | |||
| FPG | Ideal | 2426 (79.4) | 3513 (87.7) | <0.01 | 4162 (88.6) | 1777 (68.4) | <0.01 |
| Non-ideal | 903 (20.6) | 657 (12.3) | 661 (11.4) | 899 (31.6) | |||
| Age | <60 years | 2078 (76.2) | 2745 (74.7) | 0.01 | 4823 (100.0) | 0 (0.0) | NA |
| ≥60 years | 1251 (23.8) | 1425 (25.3) | 0 (0.0) | 2676 (100.0) | |||
| Sex | Male | 3329 (100.0) | 0 (0.0) | NA | 2078 (49.8) | 1251 (47.8) | 0.01 |
| Female | 0 (0.0) | 4170 (100.0) | 2745 (50.2) | 1425 (52.2) | |||
| Education level | High | 1620 (57.6) | 2113 (58.1) | 0.76 | 2969 (67.5) | 764 (28.3) | <0.01 |
| Low | 1709 (42.4) | 2057 (41.9) | 1854 (32.5) | 1912 (71.7) | |||
| Income | High | 1642 (56.5) | 1758 (49.9) | <0.01 | 2771 (62.0) | 629 (26.6) | <0.01 |
| Low | 1441 (43.5) | 1976 (50.1) | 1628 (38.0) | 1789 (73.4) | |||
| Region | Major cities | 2024 (72.0) | 2538 (73.0) | 0.71 | 3012 (74.2) | 1550 (67.2) | <0.01 |
| Inner regional | 760 (20.0) | 949 (19.2) | 1025 (18.3) | 684 (23.7) | |||
| Other | 545 (8.0) | 683 (7.8) | 786 (7.5) | 442 (9.1) |
| Metrics | Population | Crude IRR (95% CI) | p | Adjusted IRR * (95% CI) | p | Pinteraction |
|---|---|---|---|---|---|---|
| Smoking | Males | 1.84 (1.21–2.79) | 0.01 | 1.12 (0.77–1.63) | 0.56 | 0.49 |
| Females | 1.30 (0.78–2.18) | 0.31 | 1.41 (0.79–2.51) | 0.24 | ||
| High BMI | Males | 1.93 (1.26–2.97) | <0.01 | 1.32 (0.91–1.90) | 0.14 | 0.14 |
| Females | 2.13 (1.27–3.58) | 0.01 | 1.51 (0.85–2.71) | 0.15 | ||
| Physical inactivity | Males | 3.57 (1.94–6.55) | <0.01 | 1.84 (1.00–3.39) | 0.048 | 0.38 |
| Females | 9.47 (1.88–47.73) | 0.01 | 3.99 (0.79–20.12) | 0.09 | ||
| Unhealthy dietary pattern | Males | 0.42 (0.17–1.06) | 0.06 | 1.13 (0.52–2.43) | 0.76 | 0.82 |
| Females | 1.24 (0.50–3.07) | 0.64 | 1.33 (0.53–3.29) | 0.54 | ||
| Elevated TC | Males | 2.56 (1.66–3.95) | <0.01 | 1.53 (1.04–2.25) | 0.03 | 0.85 |
| Females | 5.22 (2.07–13.18) | <0.01 | 1.70 (0.65–4.42) | 0.28 | ||
| Elevated BP | Males | 1.62 (1.07–2.45) | 0.02 | 0.81 (0.57–1.16) | 0.25 | 0.89 |
| Females | 3.46 (1.93–6.21) | <0.01 | 0.85 (0.43–1.69) | 0.63 | ||
| Elevated FPG | Males | 2.56 (1.84–3.55) | <0.01 | 1.20 (0.85–1.67) | 0.29 | 1.00 |
| Females | 2.98 (1.66–5.34) | <0.01 | 1.20 (0.56–2.57) | 0.64 |
| Metrics | Population | Crude IRR (95% CI) | p | Adjusted IRR * (95% CI) | p | Pinteraction |
|---|---|---|---|---|---|---|
| Smoking | Young adults | 1.67 (0.89–3.14) | 0.11 | 1.10 (0.55–2.18) | 0.78 | 0.48 |
| Older adults | 1.35 (0.95–1.92) | 0.09 | 1.22 (0.84–1.75) | 0.29 | ||
| High BMI | Young adults | 4.42 (1.64–11.92) | <0.01 | 2.28 (0.84–6.16) | 0.10 | 0.01 |
| Older adults | 1.07 (0.78–1.47) | 0.66 | 1.15 (0.86–1.52) | 0.34 | ||
| Physical inactivity | Young adults | 7.08 (1.56–32.16) | 0.01 | 4.34 (0.87–21.55) | 0.07 | 0.03 |
| Older adults | 1.91 (1.17–3.12) | 0.01 | 1.63 (1.01–2.64) | 0.046 | ||
| Unhealthy dietary pattern | Young adults | 0.93 (0.21–4.11) | 0.93 | 0.91 (0.21–3.95) | 0.90 | 0.31 |
| Older adults | 1.27 (0.66–2.44) | 0.47 | 1.26 (0.67–2.37) | 0.47 | ||
| Elevated TC | Young adults | 2.69 (1.27–5.66) | 0.01 | 1.12 (0.51–2.48) | 0.77 | 0.51 |
| Older adults | 1.47 (0.98–2.21) | 0.06 | 1.67 (1.11–2.51) | 0.02 | ||
| Elevated BP | Young adults | 3.69 (1.92–7.12) | <0.01 | 1.56 (0.67–3.62) | 0.29 | <0.01 |
| Older adults | 0.78 (0.50–1.22) | 0.28 | 0.61 (0.40–0.92) | 0.02 | ||
| Elevated FPG | Young adults | 3.60 (1.77–7.30) | <0.01 | 1.72 (0.77–3.83) | 0.18 | 0.04 |
| Older adults | 1.29 (0.92–1.80) | 0.14 | 1.05 (0.74–1.47) | 0.79 |
| Participants | Ideal Metrics Number | IHD Cases/Participants | Crude OR (95% CI) | p | Adjusted * OR (95% CI) | p |
|---|---|---|---|---|---|---|
| Males | 0–2 | 150/1741 | Reference | NA | Reference | NA |
| 3–4 | 44/1147 | 0.34 (0.21–0.56) | <0.01 | 0.65 (0.42–1.01) | 0.06 | |
| 5–7 | 4/285 | 0.06 (0.01–0.51) | 0.01 | 0.47 (0.05–4.30) | 0.50 | |
| One more ideal metric | NA | 0.61 (0.53–0.70) | <0.01 | 0.86 (0.73–1.02) | 0.09 | |
| Females | 0–2 | 99/1601 | Reference | NA | Reference | NA |
| 3–4 | 29/1639 | 0.22 (0.11–0.45) | <0.01 | 0.41 (0.19–0.88) | 0.02 | |
| 5–7 | 0/589 | NA | NA | NA | NA | |
| One more ideal metric | NA | 0.52 (0.45–0.60) | <0.01 | 0.73 (0.59–0.91) | 0.01 | |
| Young | 0–2 | 54/1708 | Reference | NA | Reference | NA |
| 3–4 | 15/2028 | 0.18 (0.09–0.37) | <0.01 | 0.35 (0.15–0.83) | 0.02 | |
| 5–7 | 0/792 | NA | NA | NA | NA | |
| One more ideal metric | NA | 0.49 (0.40–0.60) | <0.01 | 0.69 (0.52–0.91) | 0.01 | |
| Older | 0–2 | 195/1634 | Reference | NA | Reference | NA |
| 3–4 | 58/758 | 0.61 (0.39–0.95) | 0.03 | 0.68 (0.44–1.03) | 0.07 | |
| 5–7 | 4/82 | 0.35 (0.04–2.91) | 0.32 | 0.55 (0.06–5.09) | 0.59 | |
| One more ideal metric | NA | 0.83 (0.71–0.97) | 0.02 | 0.89 (0.76–1.05) | 0.17 |
© 2018 by the authors. Licensee MDPI, Basel, Switzerland. This article is an open access article distributed under the terms and conditions of the Creative Commons Attribution (CC BY) license (http://creativecommons.org/licenses/by/4.0/).
Share and Cite
Peng, Y.; Wang, Z. Could Cardiovascular Health Metrics Account for Age and Sex Disparities in Self-Reported Ischemic Heart Disease Prevalence? J. Clin. Med. 2018, 7, 369. https://doi.org/10.3390/jcm7100369
Peng Y, Wang Z. Could Cardiovascular Health Metrics Account for Age and Sex Disparities in Self-Reported Ischemic Heart Disease Prevalence? Journal of Clinical Medicine. 2018; 7(10):369. https://doi.org/10.3390/jcm7100369
Chicago/Turabian StylePeng, Yang, and Zhiqiang Wang. 2018. "Could Cardiovascular Health Metrics Account for Age and Sex Disparities in Self-Reported Ischemic Heart Disease Prevalence?" Journal of Clinical Medicine 7, no. 10: 369. https://doi.org/10.3390/jcm7100369
APA StylePeng, Y., & Wang, Z. (2018). Could Cardiovascular Health Metrics Account for Age and Sex Disparities in Self-Reported Ischemic Heart Disease Prevalence? Journal of Clinical Medicine, 7(10), 369. https://doi.org/10.3390/jcm7100369