
Comparing Electromyographic Muscle Activities and Kinematics During Sit-to-Stand Transitions in Patients with Adult Spinal Deformity Versus Healthy Controls

 , ,
, ,
Abstract
1. Introduction
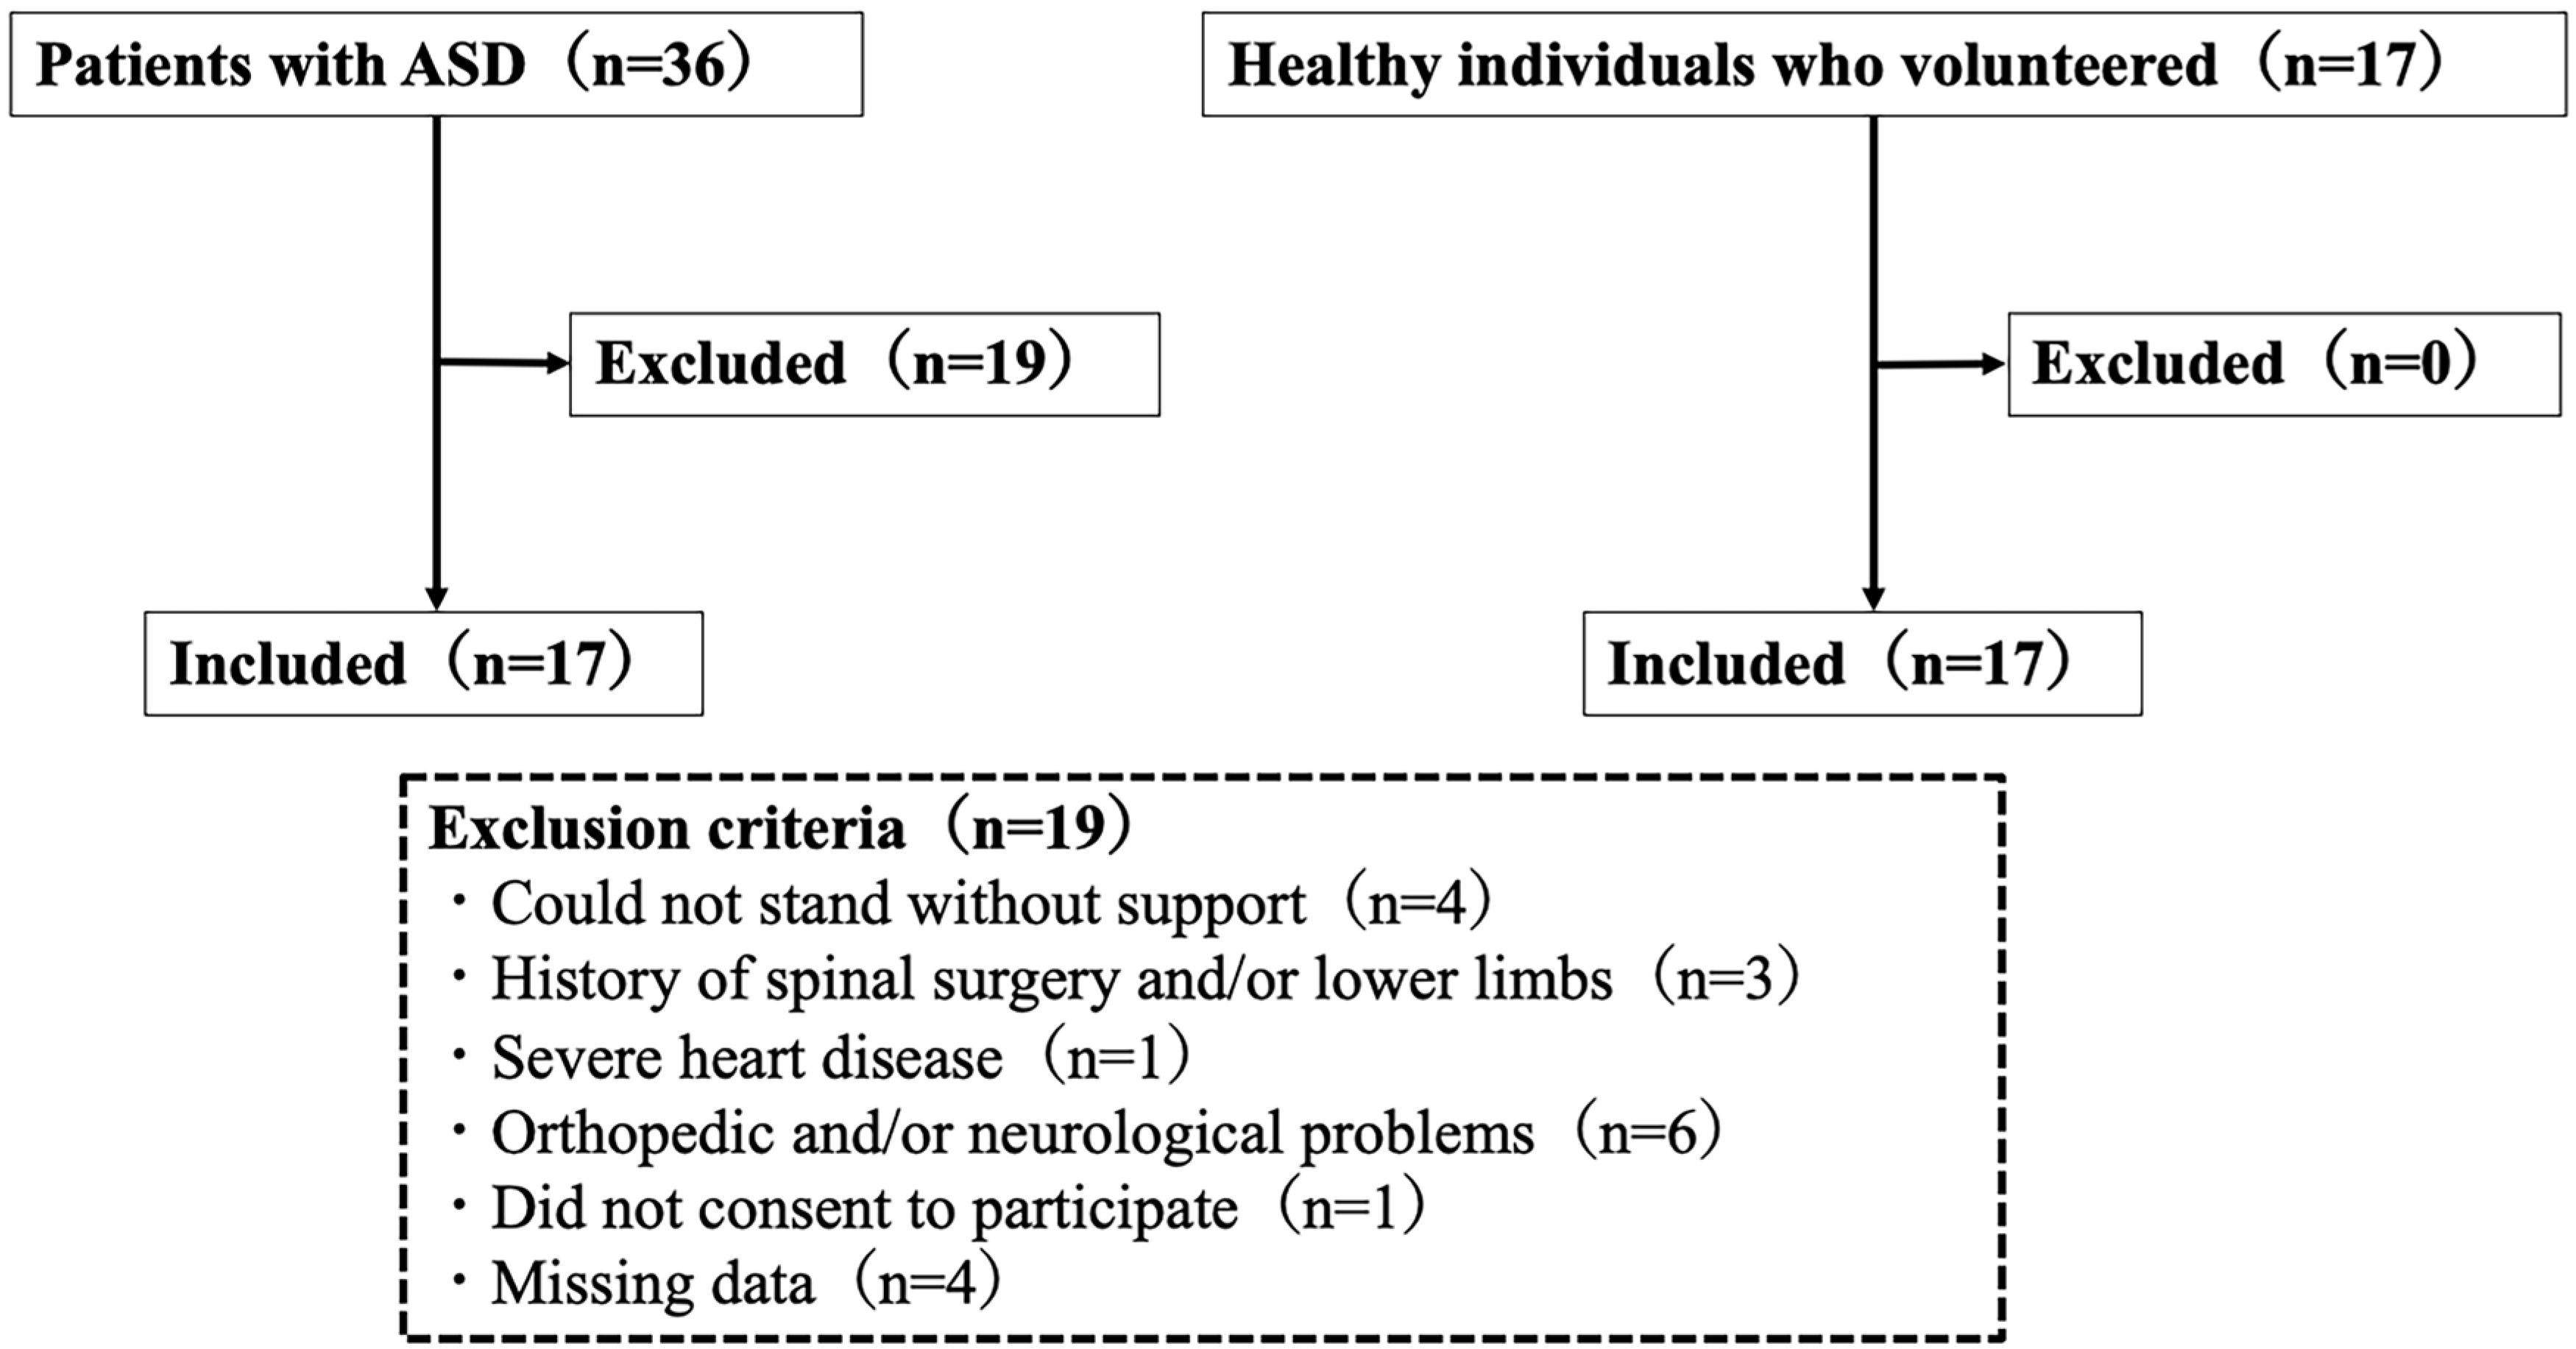
2. Materials and Methods
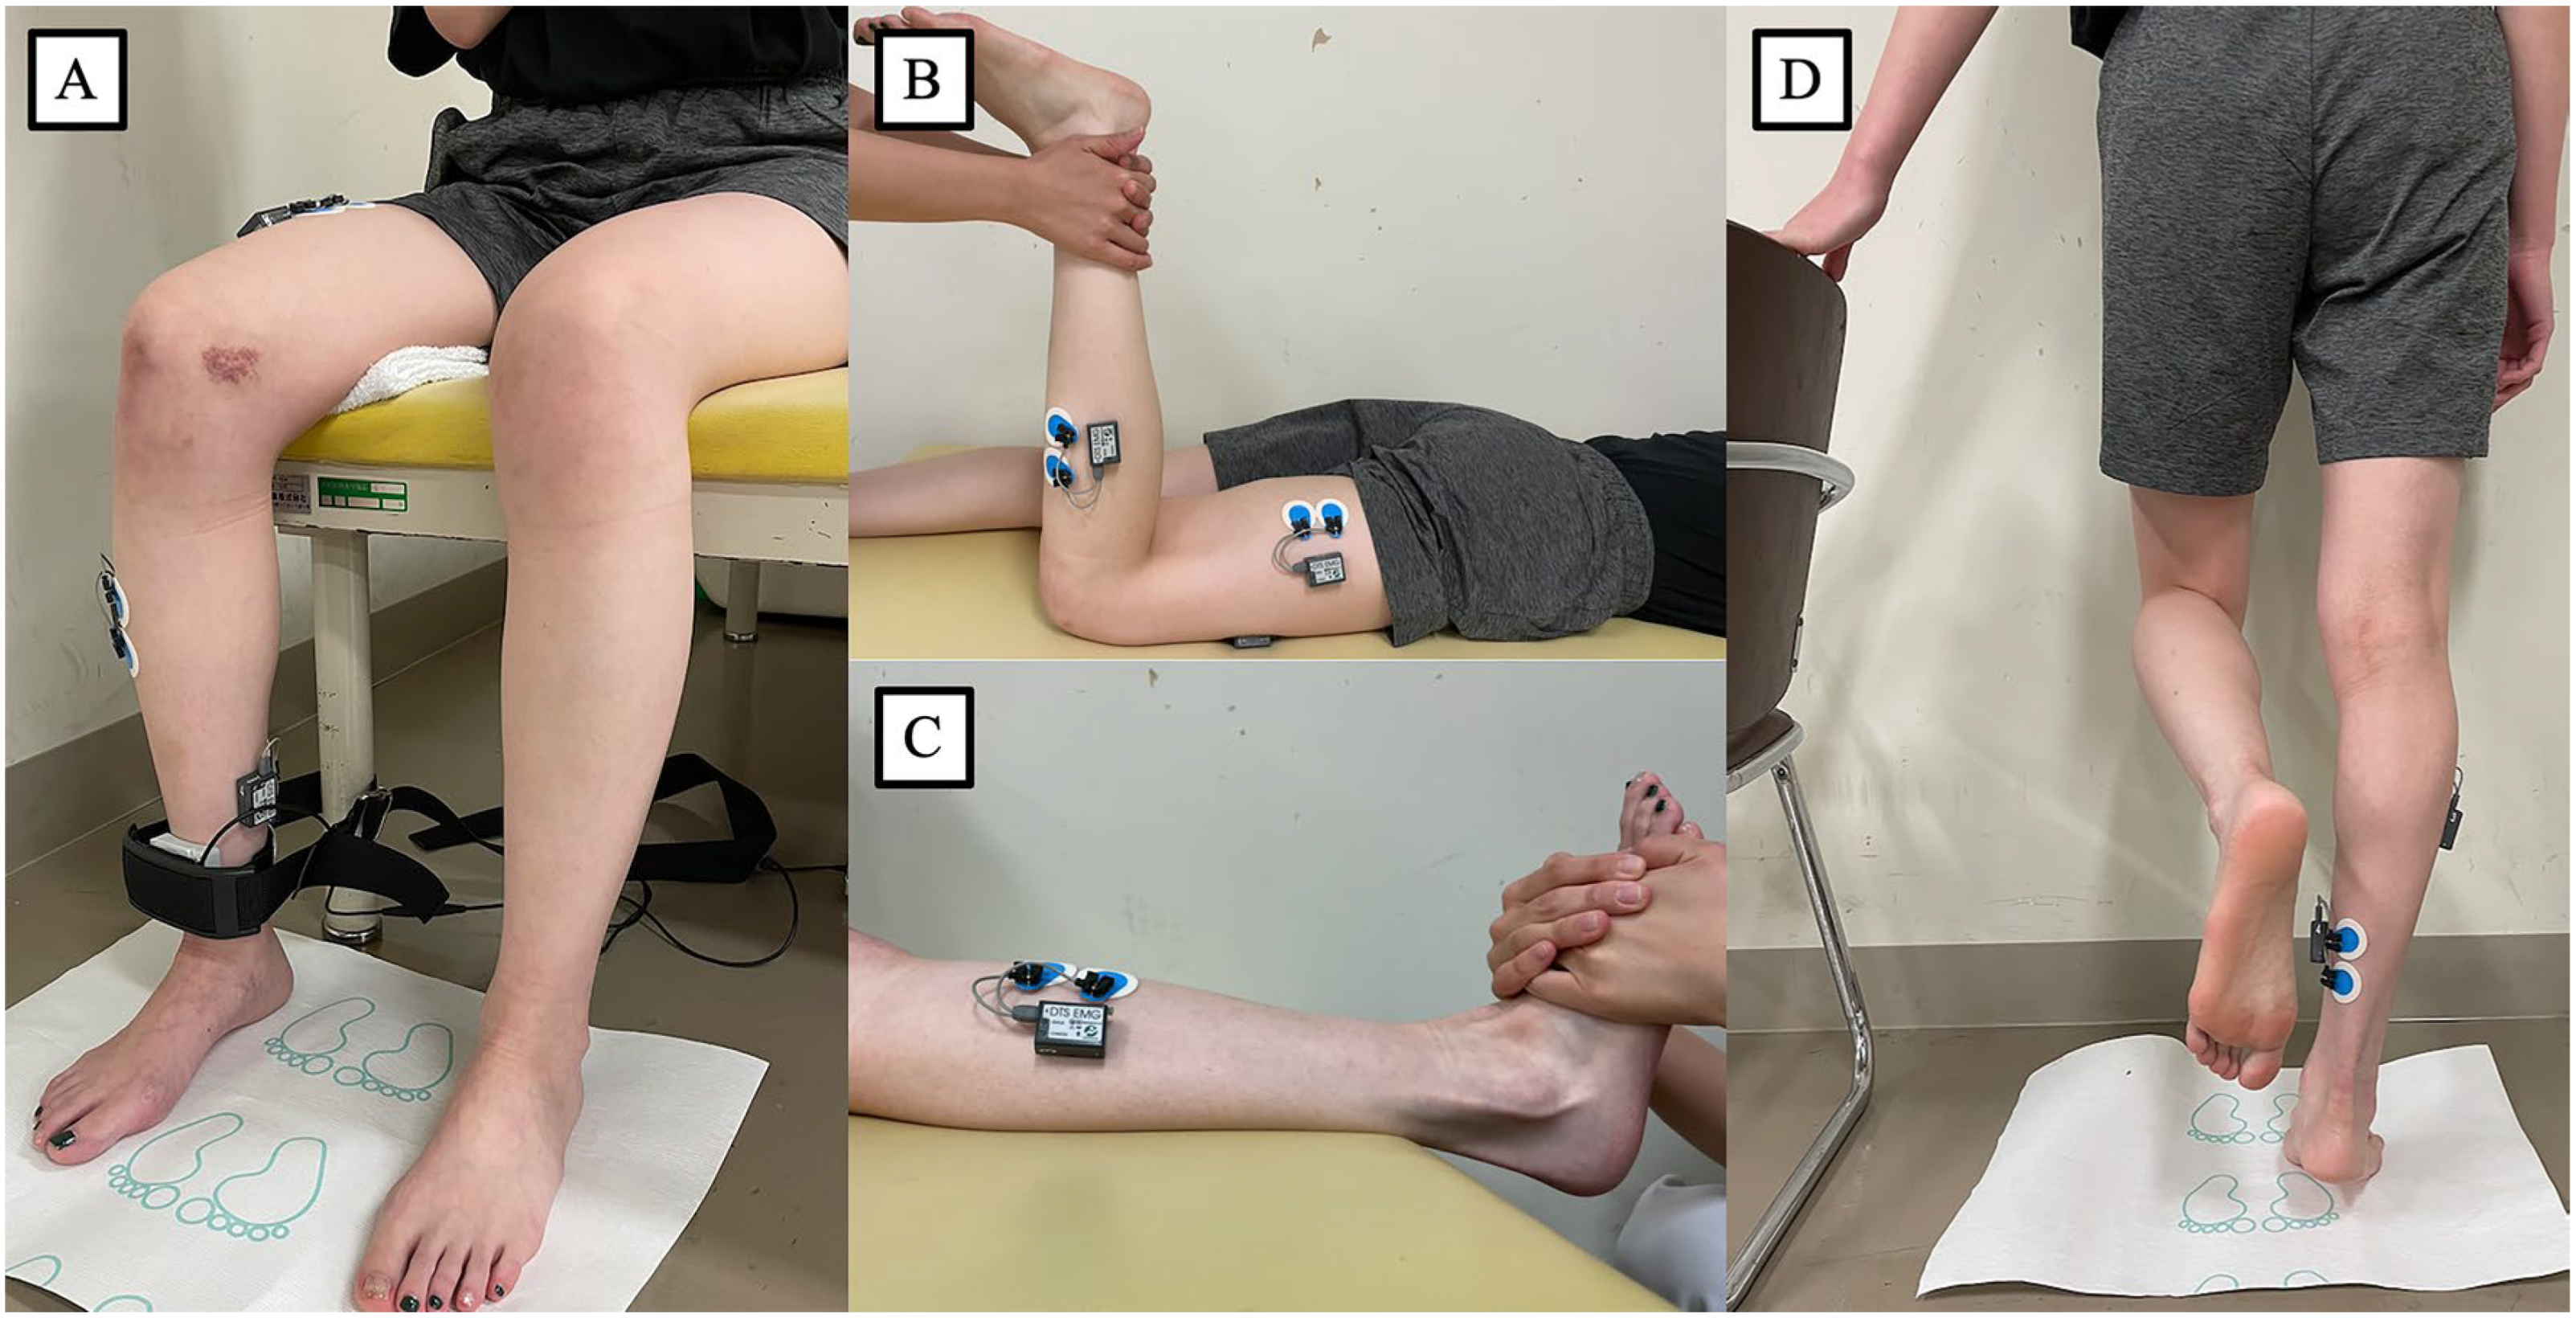
Measurements
- Test procedure
- Data acquisition
- Kinematic data
- Radiographic measurements
3. Results
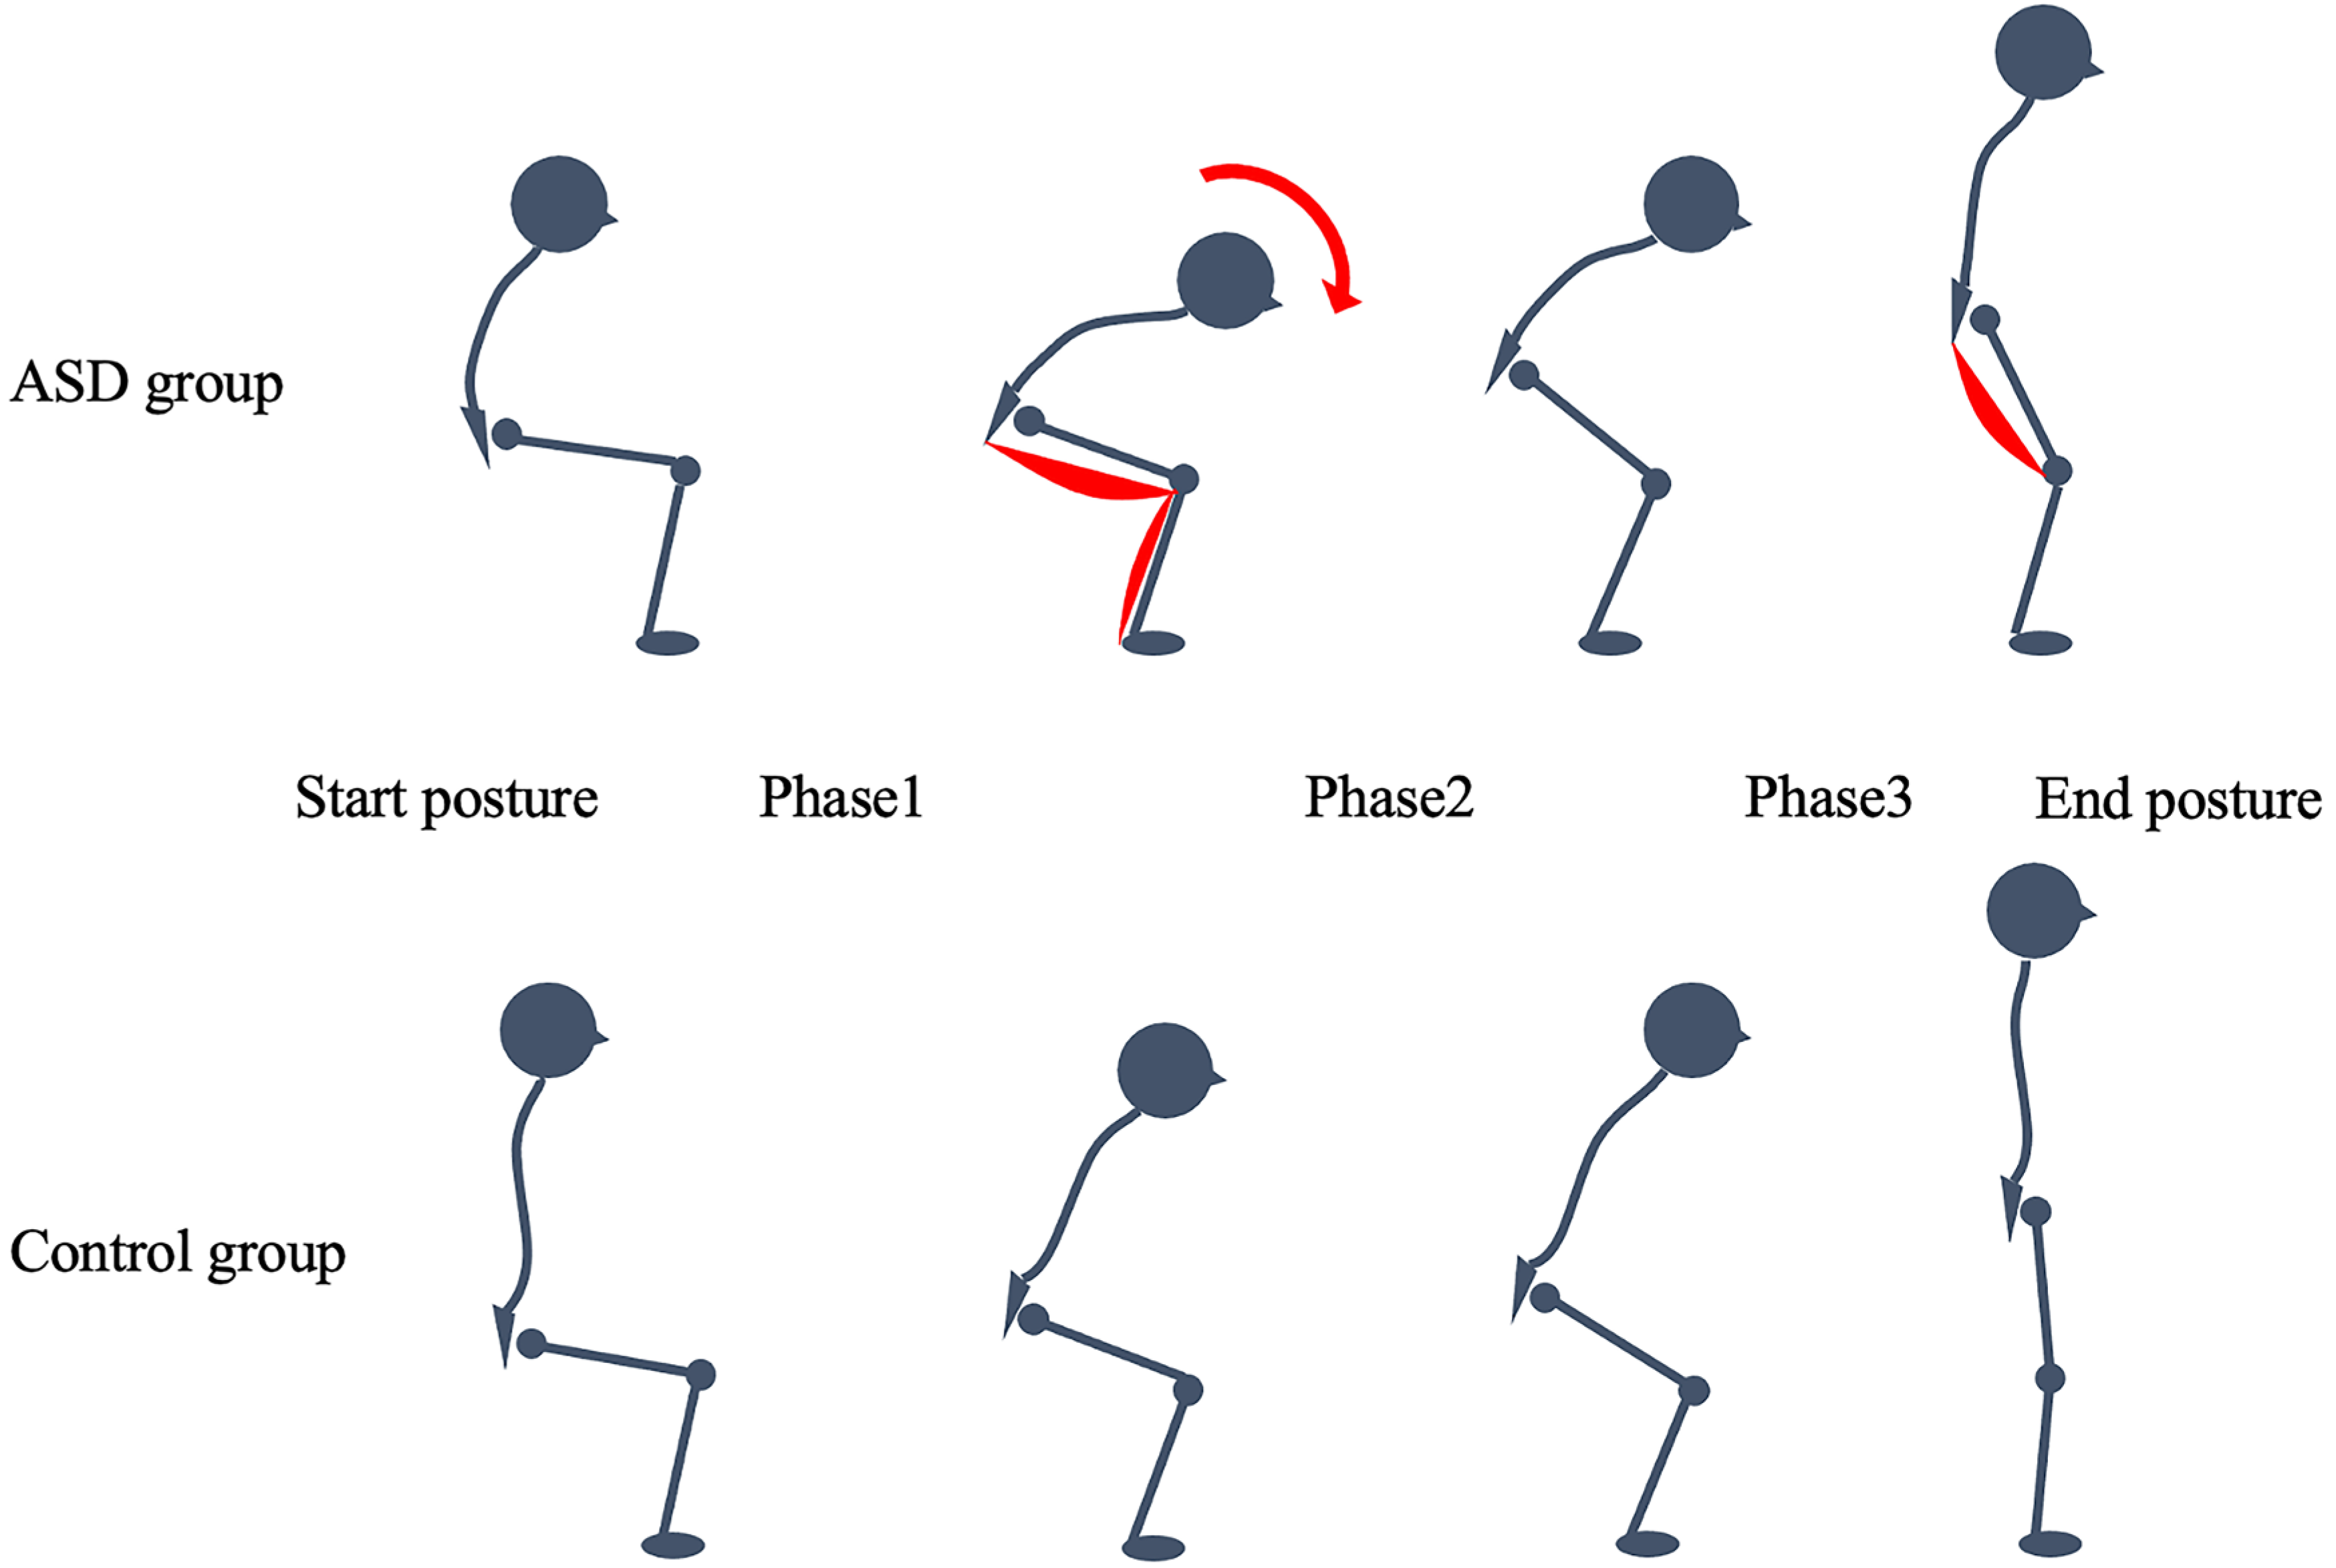
Kinematics
- Joint angles
- Phase times and total STS time
4. Discussion
5. Conclusions
Author Contributions
Funding
Institutional Review Board Statement
Informed Consent Statement
Data Availability Statement
Conflicts of Interest
References
- Schwab, F.; Dubey, A.; Gamez, L.; El Fegoun, A.B.; Hwang, K.; Pagala, M.; Farcy, J.P. Adult scoliosis: Prevalence, SF-36, and nutritional parameters in an elderly volunteer population. Spine 2005, 30, 1082–1085. [Google Scholar] [CrossRef] [PubMed]
- Fehlings, M.G.; Tetreault, L.; Nater, A.; Choma, T.; Harrop, J.; Mroz, T.; Santaguida, C.; Smith, J.S. The aging of the global population: The changing epidemiology of disease and spinal disorders. Neurosurgery 2015, 77 (Suppl. 4), S1–S5. [Google Scholar] [CrossRef]
- Schwab, F.; Dubey, A.; Pagala, M.; Gamez, L.; Farcy, J.P. Adult scoliosis: A health assessment analysis by SF-36. Spine (Phila Pa 1976) 2003, 28, 602–606. [Google Scholar] [CrossRef]
- Pellisé, F.; Vila-Casademunt, A.; Ferrer, M.; Domingo-Sàbat, M.; Bagó, J.; Pérez-Grueso, F.J.S.; Alanay, A.; Mannion, A.F.; Acaroglu, E. Impact on health related quality of life of adult spinal deformity (ASD) compared with other chronic conditions. Eur. Spine J. 2015, 24, 3–11. [Google Scholar] [CrossRef]
- Hirvensalo, M.; Rantanen, T.; Heikkinen, E. Mobility difficulties and physical activity as predictors of mortality and loss of independence in the community-living older population. J. Am. Geriatr. Soc. 2000, 48, 493–498. [Google Scholar] [CrossRef] [PubMed]
- Yamada, T.; Demura, S. Relationships between ground reaction force parameters during a sit-to-stand movement and physical activity and falling risk of the elderly and a comparison of the movement characteristics between the young and the elderly. Arch. Gerontol. Geriatr. 2009, 48, 73–77. [Google Scholar] [CrossRef]
- Dall, P.M.; Kerr, A. Frequency of the sit to stand task: An observational study of free-living adults. Appl. Ergon. 2010, 41, 58–61. [Google Scholar] [CrossRef]
- Lord, S.R.; Murray, S.M.; Chapman, K.; Munro, B.; Tiedemann, A. Sit-to-stand performance depends on sensation, speed, balance, and psychological status in addition to strength in older people. J. Gerontol. A Biol. Sci. Med. Sci. 2002, 57, M539-43. [Google Scholar] [CrossRef] [PubMed]
- Dehail, P.; Bestaven, E.; Muller, F.; Mallet, A.; Robert, B.; Bourdel-Marchasson, I.; Petit, J. Kinematic and electromyographic analysis of rising from a chair during a “Sit-to-Walk” task in elderly subjects: Role of strength. Clin. Biomech. 2007, 22, 1096–1103. [Google Scholar] [CrossRef]
- Barrey, C.; Roussouly, P.; Perrin, G.; Le Huec, J.C. Sagittal balance disorders in severe degenerative spine. Can we identify the compensatory mechanisms? Eur. Spine J. 2011, 20 (Suppl. 5), 626–633. [Google Scholar] [CrossRef]
- Barrey, C.; Roussouly, P.; Le Huec, J.C.; D’Acunzi, G.; Perrin, G. Compensatory mechanisms contributing to keep the sagittal balance of the spine. Eur. Spine J. 2013, 22 (Suppl. 6), S834–S841. [Google Scholar] [CrossRef] [PubMed]
- Yagi, M.; Kaneko, S.; Yato, Y.; Asazuma, T. Standing balance and compensatory mechanisms in patients with adult spinal deformity. Spine 2017, 42, E584–E591. [Google Scholar] [CrossRef]
- Muramoto, A.; Imagama, S.; Ito, Z.; Hirano, K.; Ishiguro, N.; Hasegawa, Y. Spinal sagittal balance substantially influences locomotive syndrome and physical performance in community-living middle-aged and elderly women. J. Orthop. Sci. 2016, 21, 216–221. [Google Scholar] [CrossRef] [PubMed]
- Saad, E.; Semaan, K.; Kawkabani, G.; Massaad, A.; Salibv, R.M.; Mekhael, M.; Fakhoury, M.; Karam, K.A.; Jaber, E.; Ghanem, I.; et al. Alteration of the Sitting and Standing Movement in Adult Spinal Deformity. Front. Bioeng. Biotechnol. 2022, 9, 751193. [Google Scholar] [CrossRef]
- Bailey, J.F.; Matthew, R.P.; Seko, S.; Curran, P.; Chu, L.; Berven, S.H.; Deviren, V.; Burch, S.; Lotz, J.C. ISSLS PRIZE IN BIOENGINEERING SCIENCE 2019: Biomechanical changes in dynamic sagittal balance and lower limb compensatory strategies following realignment surgery in adult spinal deformity patients. Eur. Spine J. 2019, 28, 905–913. [Google Scholar] [CrossRef]
- Enomoto, M.; Ukegawa, D.; Sakaki, K.; Tomizawa, S.; Arai, Y.; Kawabata, S.; Kato, T.; Yoshii, T.; Shinomiya, K.; Okawa, A. Increase in paravertebral muscle activity in lumbar kyphosis patients by surface electromyography compared with lumbar spinal canal stenosis patients and healthy volunteers. J. Spinal Disord. Tech. 2012, 25, E167–E173. [Google Scholar] [CrossRef]
- Schwab, F.; Ungar, B.; Blondel, B.; Buchowski, J.; Coe, J.; Deinlein, D.; DeWald, C.; Mehdian, H.; Shaffrey, C.; Tribus, C.; et al. Scoliosis Research Society-Schwab adult spinal deformity classification: A validation study. Spine 2012, 37, 1077–1082. [Google Scholar] [CrossRef]
- Blache, Y.; Pairot de Fontenay, B.; Monteil, K. The effects of seat height and foot placement on lumbar spine load during sit-to-stand tasks. Ergonomics 2014, 57, 1687–1695. [Google Scholar] [CrossRef]
- Sütçü, G.; Yalçın, A.I.; Ayvat, E.; Kılınç, Ö.O.; Ayvat, F.; Doğan, M.; Harput, G.; Yıldırım, S.A.; Kılınç, M. Electromyographic activity and kinematics of sit-to-stand in individuals with muscle disease. Neurol. Sci. 2019, 40, 2311–2318. [Google Scholar] [CrossRef]
- Hermens, H.J.; Freriks, B.; Disselhorst-Klug, C.; Rau, G. Development of recommendations for SEMG sensors and sensor placement procedures. J. Electromyogr. Kinesiol. 2000, 10, 361–374. [Google Scholar] [CrossRef]
- Halaki, M.; Gi, K. Normalization of EMG signals: To normalize or not to normalize and what to normalize to? In Computational Intelligence in Electromyography Analysis—A Perspective on Current Applications and Future Challenges; Naik, G.R., Ed.; IntechOpen: Novi Sad, Serbia, 2012. [Google Scholar] [CrossRef]
- Schenkman, M.; Berger, R.A.; Riley, P.O.; Mann, R.W.; Hodge, W.A. Whole-body movements during rising to standing from sitting. Phys. Ther. 1990, 70, 638–648; discussion 648–651. [Google Scholar] [CrossRef]
- Caruthers, E.J.; Thompson, J.A.; Chaudhari, A.M.; Schmitt, L.C.; Best, T.M.; Saul, K.R.; Siston, R.A. Muscle forces and their contributions to vertical and horizontal acceleration of the center of mass during sit-to-stand transfer in young, healthy adults. J. Appl. Biomech. 2016, 32, 487–503. [Google Scholar] [CrossRef] [PubMed]
- Jeon, W.; Jensen, J.L.; Griffin, L. Muscle activity and balance control during sit-to-stand across symmetric and asymmetric initial foot positions in healthy adults. Gait Posture 2019, 71, 138–144. [Google Scholar] [CrossRef] [PubMed]
- Im, S.C.; Seo, S.W.; Kang, N.Y.; Jo, H.; Kim, K. The Effect of lumbar belts with different extensibilities on kinematic, kinetic, and muscle activity of sit-to-stand motions in patients with nonspecific low back pain. J. Pers. Med. 2022, 12, 1678. [Google Scholar] [CrossRef] [PubMed]
- Hughes, M.A.; Weiner, D.K.; Schenkman, M.L.; Long, R.M.; Studenski, S.A. Chair rise strategies in the elderly. Clin. Biomech. 1994, 9, 187–192. [Google Scholar] [CrossRef]
- van der Kruk, E.; Silverman, A.K.; Reilly, P.; Bull, A.M.J. Compensation due to age-related decline in sit-to-stand and sit-to-walk. J. Biomech. 2021, 122, 110411. [Google Scholar] [CrossRef]
- Shum, G.L.; Crosbie, J.; Lee, R.Y. Effect of low back pain on the kinematics and joint coordination of the lumbar spine and hip during sit-to-stand and stand-to-sit. Spine 2005, 30, 1998–2004. [Google Scholar] [CrossRef]
- Passias, P.G.; Segreto, F.A.; Bortz, C.A.; Horn, S.R.; Pierce, K.E.; Naessig, S.; Brown, A.E.; Jackson-Fowl, B.; Ahmad, W.; Oh, C.; et al. Probability of severe frailty development among operative and nonoperative adult spinal deformity patients: An actuarial survivorship analysis over a 3-year period. Spine J. 2020, 20, 1276–1285. [Google Scholar] [CrossRef]
- Xie, H.; Liu, J.; He, Y.; Zhang, Z.; Dong, H.; Meng, L.; Miao, J. Surface electromyography study on asymmetry in paravertebral muscle degeneration in patients with degenerative lumbar scoliosis. Sci. Rep. 2022, 12, 18675. [Google Scholar] [CrossRef]


| ASD Group (a), (b) | Control Group (b) | Z (c) | p | |
|---|---|---|---|---|
| (n = 17) | (n = 17) | |||
| Age (years) | 72.7 ± 6.8 | 71.9 ± 5.8 | −0.570 | 0.569 |
| Height (cm) | 148.3 ± 5.2 | 151.8 ± 5.8 | −1.639 | 0.101 |
| Weight (kg) | 48.9 ± 10.1 | 52.2 ± 8.0 | −1.172 | 0.241 |
| BMI (kg/m2) | 22.2 ± 4.4 | 22.7 ± 3.3 | −0.741 | 0.459 |
| Right knee extension strength (kgf) | 18.2 ± 5.5 | 22.1 ± 7.4 | −1.602 | 0.109 |
| Left knee extension strength (kgf) | 17.3 ± 6.5 | 21.2 ± 7.2 | −1.636 | 0.102 |
| Cobb angle (°) | 36.5 ± 19.1 | N/A | N/A | N/A |
| C7PL-CSVL (mm) | 44.6 ± 37.5 | N/A | N/A | N/A |
| SVA (mm) | 114.3 ± 67.1 | N/A | N/A | N/A |
| LL (°) | 25.3 ± 13.6 | N/A | N/A | N/A |
| TK (°) | 35.2 ± 15.9 | N/A | N/A | N/A |
| SS (°) | 21.9 ± 8.6 | N/A | N/A | N/A |
| PI (°) | 55.7 ± 10.8 | N/A | N/A | N/A |
| PT (°) | 33.8 ± 9.8 | N/A | N/A | N/A |
| PI-LL (°) | 30.4 ± 15.0 | N/A | N/A | N/A |
| Muscle | Period | ASD Group (a), (b) | Control Group (b) | Z (c) | p |
|---|---|---|---|---|---|
| (n = 17) | (n = 17) | ||||
| Rectus femoris (%) | Phase 1 | 37.8 ± 16.2 | 33.3 ± 17.2 | −1.223 | 0.221 |
| Phase 2 | 65.9 ± 26.1 | 64.3 ± 35.2 | −0.482 | 0.630 | |
| Phase 3 | 54.4 ± 25.3 | 51.8 ± 27.8 | −0.465 | 0.642 | |
| Biceps femoris (%) | Phase 1 | 23.7 ± 26.5 | 12.3 ± 8.6 | −1.981 | 0.048 (d) |
| Phase 2 | 84.5 ± 107.3 | 46.0 ± 54.2 | −1.567 | 0.117 | |
| Phase 3 | 48.6 ± 25.8 | 32.8 ± 40.5 | −2.532 | 0.011 (d) | |
| Tibialis anterior (%) | Phase 1 | 47.5 ± 36.2 | 36.6 ± 19.1 | −0.741 | 0.459 |
| Phase 2 | 47.4 ± 29.0 | 46.8 ± 31.6 | −0.189 | 0.850 | |
| Phase 3 | 26.1 ± 17.3 | 22.2 ± 16.9 | −0.500 | 0.617 | |
| Soleus (%) | Phase 1 | 16.2 ± 7.5 | 8.5 ± 2.9 | −3.393 | 0.001 (d) |
| Phase 2 | 32.9 ± 23.5 | 26.1 ± 12.7 | −0.448 | 0.654 | |
| Phase 3 | 32.0 ± 15.9 | 30.6 ± 11.0 | −0.052 | 0.959 |
| ASD Group (a), (b) | Control Group (b) | Z (c) | p | |
|---|---|---|---|---|
| (n = 17) | (n = 17) | |||
| Start posture (sitting) | ||||
| Hip flexion (°) | 78.6 ± 5.8 | 72.2 ± 5.3 | −2.980 | 0.003 (d) |
| Knee flexion (°) | 93.2 ± 6.4 | 88.4 ± 5.8 | −2.068 | 0.039 (d) |
| Ankle dorsiflexion (°) | 14.2 ± 7.7 | 12.0 ± 8.3 | −0.913 | 0.361 |
| Between Phases 1 and 2 | ||||
| Hip flexion (°) | 111.3 ± 8.5 | 95.5 ± 10.0 | −3.772 | 0.000 (d) |
| Knee flexion (°) | 88.2 ± 7.0 | 82.8 ± 6.0 | −2.292 | 0.022 (d) |
| Ankle dorsiflexion (°) | 20.6 ± 8.8 | 16.8 ± 7.5 | −1.241 | 0.215 |
| Between Phases 2 and 3 | ||||
| Hip flexion (°) | 103.5 ± 9.9 | 86.7 ± 10.1 | −3.790 | 0.000 (d) |
| Knee flexion (°) | 81.9 ± 8.2 | 76.2 ± 6.0 | −2.053 | 0.040 (d) |
| Ankle dorsiflexion (°) | 23.6 ± 9.1 | 20.1 ± 8.5 | −1.034 | 0.301 |
| End posture (standing) | ||||
| Hip flexion (°) | 18.4 ± 11.9 | −1.0 ± 4.9 | −4.567 | 0.000 (d) |
| Knee flexion (°) | 21.9 ± 8.7 | 7.8 ± 5.0 | −3.878 | 0.000 (d) |
| Ankle dorsiflexion (°) | 9.0 ± 5.9 | 4.2 ± 6.7 | −2.171 | 0.030 (d) |
| ASD Group (a), (b) | Control Group (b) | Z (c) | p | |
|---|---|---|---|---|
| (n = 17) | (n = 17) | |||
| Phase 1: Flexion momentum (s) | 0.79 ± 0.22 | 0.62 ± 0.09 | −2.290 | 0.022 (d) |
| Phase 2: Momentum transfer (s) | 0.22 ± 0.13 | 0.19 ± 0.12 | −0.982 | 0.326 |
| Phase 3: Extension (s) | 1.28 ± 0.42 | 0.99 ± 0.25 | −2.222 | 0.026 (d) |
| Total (s) | 2.29 ± 0.67 | 1.80 ± 0.33 | −2.256 | 0.024 (d) |
Disclaimer/Publisher’s Note: The statements, opinions and data contained in all publications are solely those of the individual author(s) and contributor(s) and not of MDPI and/or the editor(s). MDPI and/or the editor(s) disclaim responsibility for any injury to people or property resulting from any ideas, methods, instructions or products referred to in the content. |
© 2025 by the authors. Licensee MDPI, Basel, Switzerland. This article is an open access article distributed under the terms and conditions of the Creative Commons Attribution (CC BY) license (https://creativecommons.org/licenses/by/4.0/).
Share and Cite
Hayamizu, Y.; Nagafusa, T.; Sasaki, K.; Nagashima, M.; Yamauchi, K.; Hasegawa, T.; Yoshida, G.; Banno, T.; Arima, H.; Oe, S.; et al. Comparing Electromyographic Muscle Activities and Kinematics During Sit-to-Stand Transitions in Patients with Adult Spinal Deformity Versus Healthy Controls. J. Clin. Med. 2025, 14, 2514. https://doi.org/10.3390/jcm14072514
Hayamizu Y, Nagafusa T, Sasaki K, Nagashima M, Yamauchi K, Hasegawa T, Yoshida G, Banno T, Arima H, Oe S, et al. Comparing Electromyographic Muscle Activities and Kinematics During Sit-to-Stand Transitions in Patients with Adult Spinal Deformity Versus Healthy Controls. Journal of Clinical Medicine. 2025; 14(7):2514. https://doi.org/10.3390/jcm14072514
Chicago/Turabian StyleHayamizu, Yukako, Tetsuyuki Nagafusa, Kumi Sasaki, Masaaki Nagashima, Katsuya Yamauchi, Tomohiko Hasegawa, Go Yoshida, Tomohiro Banno, Hideyuki Arima, Shin Oe, and et al. 2025. "Comparing Electromyographic Muscle Activities and Kinematics During Sit-to-Stand Transitions in Patients with Adult Spinal Deformity Versus Healthy Controls" Journal of Clinical Medicine 14, no. 7: 2514. https://doi.org/10.3390/jcm14072514
APA StyleHayamizu, Y., Nagafusa, T., Sasaki, K., Nagashima, M., Yamauchi, K., Hasegawa, T., Yoshida, G., Banno, T., Arima, H., Oe, S., Yamada, T., Matsuyama, Y., & Yamato, Y. (2025). Comparing Electromyographic Muscle Activities and Kinematics During Sit-to-Stand Transitions in Patients with Adult Spinal Deformity Versus Healthy Controls. Journal of Clinical Medicine, 14(7), 2514. https://doi.org/10.3390/jcm14072514