
Evaluation of Changes in the Anthropometric Measurements of Infants in Relation to the Type of Feeding and the Presence of Gestational Diabetes in Their Mothers: A Preliminary Study
 , , , ,
  ,
,
Abstract
1. Introduction
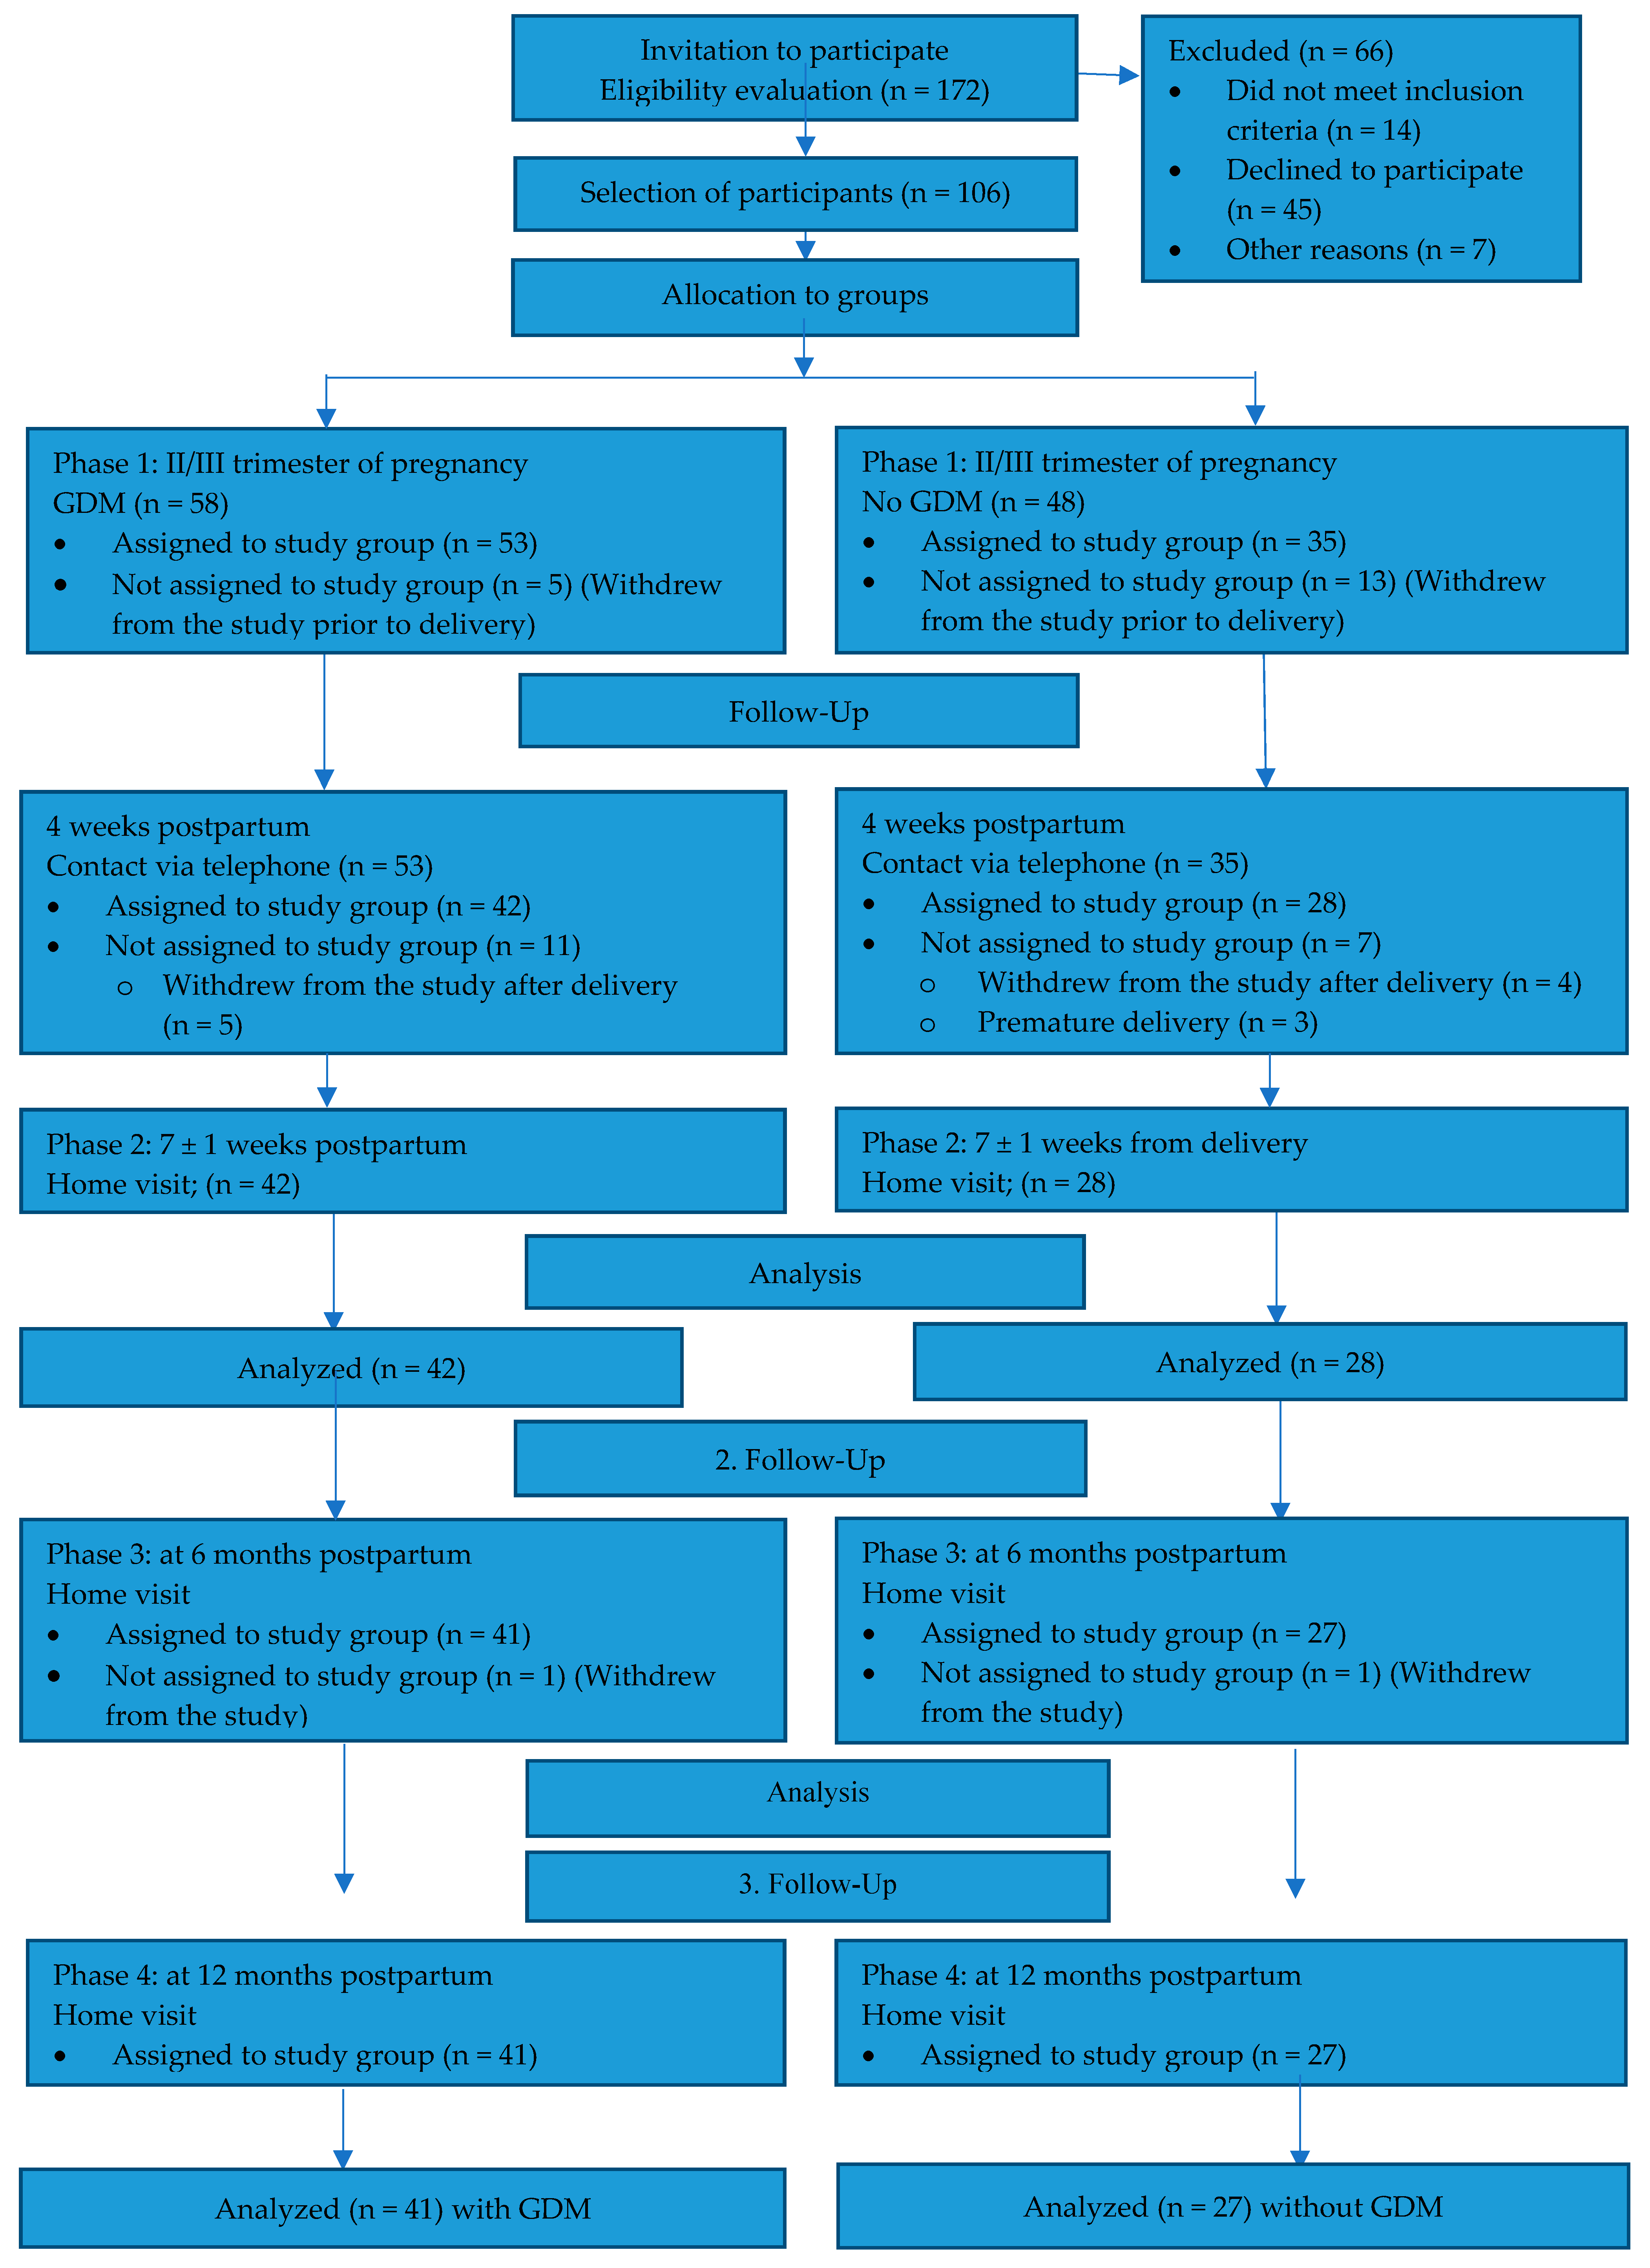
2. Methods
3. Results
4. Discussion
4.1. Change in Anthropometric Dimensions of the Infants Under Study at Birth and at Three Time Points
4.2. Effect of GDM on the Anthropometric Measurements of the Infants Studied at Three Time Points
4.3. Effect of GDM on the Anthropometric Measurements of the Infants Studied at Three Time Points, by Sex
4.4. The Impact of Breastfeeding on the Anthropometric Measurements of the Babies Studied at Three Time Points
4.5. The Impact of Breastfeeding on the Anthropometric Dimensions of the Babies Studied by Sex at Three Time Points
4.6. Limitations
5. Conclusions
Author Contributions
Funding
Institutional Review Board Statement
Informed Consent Statement
Data Availability Statement
Conflicts of Interest
References
- Schlüter, K.; Funfack, W.; Pachaly, J.; Weber, B. Development of Subcutaneous Fat in Infancy Standards for Tricipital, Subscapular, and Suprailiacal Skinfolds in German Infants. Eur. J. Pediat. 1976, 123, 255–267. [Google Scholar] [CrossRef] [PubMed]
- Horta, B.L.; Loret de Mola, C.; Victora, C.G. Long-term consequences of breastfeeding on cholesterol, obesity, systolicblood pressure and type 2 diabetes: A systematic review and meta-analysis. Acta Pediatr. 2015, 104, 30–37. [Google Scholar]
- Weng, S.F.; Redsell, S.A.; Swift, J.A.; Yang, M.; Glazebrook, C.P. Systematic review and meta-analyses of risk factors for childhood overweight identifiable during infancy. Arch. Dis. Child. 2012, 97, 1019–1026. [Google Scholar]
- Yan, J.; Liu, L.; Zhu, Y.; Huang, G.; Wang, P.P. The association between breastfeeding and childhood obesity: A meta-analysis. BMC Public Health 2014, 14, 1267. [Google Scholar]
- Pudło, H.; Respondek, M. Nutritional programming—The impact of nutrition of pregnant women on the health of their children. J. Educ. Health Sport. 2016, 6, 589–600. [Google Scholar] [CrossRef]
- ESPGHAN Committee on Nutrition; Agostoni, C.; Braegger, C.; Decsi, T.; Kolacek, S.; Koletzko, B.; Michaelsen, K.F.; Mihatsch, W.; Moreno, L.A.; Puntis, J.; et al. Breast-feeding: A Commentary by the ESPGHAN Committee on Nutrition. J. Pediatr. Gastroenterol. Nutr. 2009, 49, 112–125. [Google Scholar]
- Uwaezuoke, S.N.; Eneh, C.I.; Ndu, I.K. Relationship Between Exclusive Breastfeeding and Lower Risk of Childhood Obesity: A Narrative Review of Published Evidence. Clin. Med. Insights Pediatr. 2017, 11, 1179556517690196. [Google Scholar] [CrossRef]
- Arenz, S.; Rückerl, R.; Koletzko, B.; von Kries, R. Breast-feeding and childhood obesity—A systematic review. Int. J. Obes. 2004, 28, 1247–1256. [Google Scholar]
- Harder, T.; Bergmann, R.; Kallischnigg, G.; Plagemann, A. Duration of Breastfeeding and Risk of Overweight: A Meta-Analysis. Am. J. Epidemiol. 2005, 162, 397–403. [Google Scholar] [CrossRef]
- von Kries, R.; Koletzko, B.; Sauerwald, T.; von Mutius, E.; Barnert, D.; Grunert, V.; von Voss, H. Breast feeding and obesity: Cross sectional study. BMJ 1999, 319, 147–150. [Google Scholar] [CrossRef]
- Toschke, A.M.; Vignerova, J.; Lhotska, L.; Osancova, K.; Koletzko, B.; von Kries, R. Overweight and obesity in 6- to 14-year-old Czech children in 1991: Protective effect of breast-feeding. J. Pediatr. 2002, 141, 764–769. [Google Scholar] [CrossRef] [PubMed]
- Koletzko, B.; von Kries, R.; Closa, R.; Escribano, J.; Scaglioni, S.; Giovannini, M.; Beyer, J.; Demmelmair, H.; Gruszfeld, D.; Dobrzanska, A. Lower protein in infant formula is associated with lower weight up to age 2 y: A randomized clinical trial. Am. J. Clin. Nutr. 2009, 89, 1836–1845. [Google Scholar] [CrossRef] [PubMed]
- Singhal, A.; Kennedy, K.; Lanigan, J.; Fewtrell, M.; Cole, T.J.; Stephenson, T.; Elias-Jones, A.; Weaver, L.T.; Ibhanesebhor, S.; MacDonald, P.D.; et al. Nutrition in infancy and long-term risk of obesity: Evidence from 2 randomized controlled trials. Am. J. Clin. Nutr. 2010, 92, 1133–1144. [Google Scholar] [CrossRef] [PubMed]
- Ardic, C.; Usta, O.; Omar, E.; Yildiz, C.; Memis, E. Effects of infant feeding practices and maternal characteristics on early childhood obesity. Arch. Argent. Pediatr. 2019, 117, 26–33. [Google Scholar]
- Butte, N.F. Impact of Infant Feeding Practices on Childhood Obesity. J. Nutr. 2009, 139, 412–416. [Google Scholar] [CrossRef]
- Harmon, K.A.; Gerard, L.; Jensen, D.R.; Kealey, E.H.; Hernandez, T.L.; Reece, M.S.; Barbour, L.A.; Bessesen, D.H. Continuous glucose profiles in obese and normal-weight pregnant women on a controlled diet: Metabolic determinants of fetal growth. Diabetes Care 2011, 34, 2198–2204. [Google Scholar] [CrossRef]
- Damm, P.; Houshmand-Oeregaard, A.; Kelstrup, L.; Lauenborg, J.; Mathiesen, E.M.; Clausen, T.D. Gestational diabetes mellitus and long-term consequences for mother and offspring: A view from Denmark. Diabetology 2016, 59, 1396–1399. [Google Scholar] [CrossRef]
- Nehring, I.; Chmitorz, A.; Reulen, H.; von Kries, R.; Ensenauer, R. Gestational diabetes predicts the risk of childhood overweight and abdominal circumference independent of maternal obesity. Diabet. Med. 2013, 30, 1449–1456. [Google Scholar] [CrossRef]
- Daly, B.; Toulis, K.A.; Thomas, N.; Gokhale, K.; Martin, J.; Webber, J.; Keerthy, D.; Jolly, K.; Saravanan, P.; Nirantharakumar, K. Increased risk of ischemic heart disease, hypertension, and type 2 diabetes in women with previous gestational diabetes mellitus, a target group in general practice for preventive interventions: A population-based cohort study. PLoS Med. 2018, 15, 1002488. [Google Scholar] [CrossRef]
- Cade, W.T.; Levy, P.T.; Tinius, R.A.; Patel, M.D.; Choudhry, S.; Holland, M.R.; Singh, G.K.; Cahill, A.G. Markers of maternal and infant metabolism are associated with ventricular dysfunction in infants of obese women with type 2 diabetes. Pediatr. Res. 2017, 82, 768–775. [Google Scholar] [CrossRef]
- Kramer, C.K.; Campbell, S.; Retnakaran, R. Gestational diabetes and the risk of cardiovascular disease in women: A systematic review and meta-analysis. Diabetologia 2019, 62, 905–914. [Google Scholar] [CrossRef] [PubMed]
- Lowe, W.L., Jr.; Lowe, L.P.; Kuang, A.; Catalano, P.M.; Nodzenski, M.; Talbot, O.; Tam, W.H.; Sacks, D.A.; McCance, D.; Linder, B.; et al. Maternal glucose levels during pregnancy and childhood adiposity in the Hyperglycemia and Adverse Pregnancy Outcome Follow-up Study. Diabetologia 2019, 62, 598–610. [Google Scholar] [CrossRef] [PubMed]
- Silverman, B.L.; Rizzo, T.; Green, O.C.; Cho, N.H.; Winter, R.J.; Ogata, E.S.; Richards, G.E.; Metzger, B.E. Long-term prospective evaluation of offspring of diabetic mothers. Diabetes 1991, 40, 121–125. [Google Scholar] [CrossRef] [PubMed]
- Ay, L.; Hokken-Koelega, A.C.S.; Mook-Kanamori, D.O.; Hofman, A.; Moll, H.A.; Mackenbach, J.P.; Witteman, J.C.M.; Steegers, E.A.P.; Jaddoe, V.W.V. Tracking and determinants of subcutaneous fat mass in early childhood: The Generation R Study. Int. J. Obes. 2008, 32, 1050–1059. [Google Scholar] [CrossRef]
- Oaklet, Z.R. Differences in subcutaneous fat in breast- and formula-fed infants. Arch. Dis. Child. 1977, 52, 79–80. [Google Scholar] [CrossRef]
- De Lucia Rolfe, E.; Modi, N.; Uthaya, S.; Hughes, I.A.; Dunger, D.B.; Acerini, C.; Stolk, R.P.; Ong, K.K. Ultrasound estimates of visceral and subcutaneous-abdominal adipose tissues in infancy. J. Obes. 2013, 2013, 951954. [Google Scholar] [CrossRef]
- WHO. WHO Child Growth Standards: Length/Height-for-Age, Weight-for-Age, Weight-for-Length, Weight-for-Height and Body Mass Index-for-Age: Methods and Development; Department of Nutrition for Health and Development, World Health Organization: Geneva, Switzerland, 2006; ISBN 92-4-154693-X. [Google Scholar]
- WHO. WHO Child Growth Standards: Head Circumference-for-Age, Arm Circumference-for-Age, Triceps Skinfold-for-Age and Subscapular Skinfold-for-Age: Methods and Development; Department of Nutrition for Health and Development, World Health Organization: Geneva, Switzerland, 2007; ISBN 978-92-4-154718-5. [Google Scholar]
- WHO. WHO Child Growth Standards: Growth Velocity Based on Weight, Length and Head Circumference: Methods and Development; Department of Nutrition for Health and Development, World Health Organization: Geneva, Switzerland, 2009; ISBN 978-92-4-154763-5. [Google Scholar]
- Schmelzle, H.R.; Quang, D.N.; Fusch, G.; Fush, C. Birth weight categorization according to gestational age does not reflect percentage body fat in term and preterm newborns. Eur. J. Pediatr. 2007, 166, 161–167. [Google Scholar] [CrossRef]
- Luque, V.; Mendez, G.; Capdevila, F.; Closa, R.; Ferre, N.; Garcia, M.R.; Escribano, J. Subcutaneous fat stores related to weight in fullterm neonates. Ann. Hum. Biol. 2009, 36, 88–97. [Google Scholar] [CrossRef]
- Wells, J.C.; Fewtrell, M.S. Measuring body composition. Arch. Dis. Child. 2006, 91, 612–617. [Google Scholar] [CrossRef]
- World Health Organisation. Classification of Diabetes Mellitus. 2019. Available online: https://www.who.int/health-topics/diabetes (accessed on 23 August 2023).
- Zimowski, M.; Moye, J.; Dugoni, B.; Heim Viox, M.; Cohen, H.; Winfrey, K. Home-based anthropometric, blood pressure and pulse measurements in young children by trained data collectors in the National Children’s Study. Public Health Nutr. 2016, 20, 200–209. [Google Scholar] [CrossRef]
- Oken, E.; Gillman, M.W. Fetal origins of obesity. Obes. Res. 2003, 11, 496–505. [Google Scholar] [PubMed]
- Forsum, E.; Löf, M.; Olausson, H.; Olhager, E. Maternal body composition in relation to infant birth weight and subcutaneous adipose tissue. Br. J. Nutr. 2006, 96, 408–414. [Google Scholar] [CrossRef] [PubMed]
- Oddy, W.H.; Scott, J.A.; Graham, K.I.; Binns, C.W. Breastfeeding influences on growth and health at one year of age. Breastfeed Rev. 2006, 14, 15–23. [Google Scholar]
- Donma, M.M.; Donma, O. Infant feeding and growth: A study on Turkish infants postpartum to 6 months. Pediatr. Int. 1999, 41, 542–548. [Google Scholar]
- Ekelund, U.; Ong, K.; Linné, Y.; Neovius, M.; Brage, S.; Dunger, D.B.; Wareham, N.J.; Rössner, S. Upward weight percentile crossing in infancy and early childhood independently predicts fat mass in young adults: The Stockholm Weight Development Study (SWEDES). Am. J. Clin. Nutr. 2006, 83, 324–330. [Google Scholar]
- Dewey, K.G. Growth characteristics of breast-fed compared to formula-fed infants. Biol. Neonate 1998, 74, 94–105. [Google Scholar] [CrossRef]
- Duncan, B.; Schaefer, C.; Sibley, B.; Fonseca, N.M. Reduced growth velocity in exclusively breastfed infants. Am. J. Dis. Child. 1984, 138, 309–313. [Google Scholar]
- D’Angelo, G.; Manti, S.; Barbalace, A.; Barberi, I. Breastfeeding: A natural defence against obesity? J. Pediatr. Neonat. Individ. Med. 2016, 5, 050106. [Google Scholar] [CrossRef]
- Owen, C.G.; Martin, R.M.; Whincup, P.H.; Davey-Smith, G.; Gillman, M.W.; Cook, D.G. The effect of breastfeeding on mean body mass index throughout life: A quantitative review of published and unpublished observational evidence. Am. J. Clin. Nutr. 2005, 82, 1298–1307. [Google Scholar]
- Chaudhary, S.R.; Govil, S.; Lala, M.K.; Yagnik, H.B. Infant and young child feeding index and its association with nutritional status: A cross-sectional study of urban slums of Ahmedabad. J. Fam. Community Med. 2018, 25, 88–94. [Google Scholar]
- Assunção, M.L.; Ferreira, H.S.; Coutinho, S.B.; Santos, L.M.P.; Horta, B.L. Protective effect of breastfeeding against overweight can be detected as early as the second year of life: A study of children from one of the most socially-deprived areas of Brazil. J. Health Popul. Nutr. 2015, 33, 85–91. [Google Scholar]
- Jaddoe, V.; Durmuş, B.; Ay, L.; Duijts, L.; Moll, H.A.; Hokken-Koelega, A.C.S.; Raat, H.; Hofman, A.; Steegers, E.A.P.; Jaddoe, V.W.V. Infant diet and subcutaneous fat mass in early childhood. The Generation R Study. Eur. J. Clin. Nutr. 2011, 10, 1038. [Google Scholar]
- Główny Urząd Statystyczny. Stan Zdrowia Ludności Polski w 2019 r. Health Status of Population in Poland in 2019; GUS: Warszawa, Poland, 2021. [Google Scholar]

| Sociodemographic Data | All Group n = 68 (%) | GDM n = 41 (%) | No GDM n = 27 (%) | p | |
|---|---|---|---|---|---|
| Marital status | Married | 38 (55.88) | 29 (70.73) | 19 (70.37) | 1 |
| Single | 20 (29.41) | 12 (29.27) | 8 (29.63) | ||
| Education | Vocational | 2 (2.94) | 1 (2.44) | 1 (3.7) | 0.073 |
| Secondary | 10 (14.71) | 3 (7.32) | 7 (25.93) | ||
| Tertiary | 56 (82.36) | 37 (90.25) | 19 (70.37) | ||
| Place of residence | Rural | 5 (7.36) | 2 (4.88) | 3 (11.11) | 0.379 |
| Urban | 63 (92.65) | 39 (95.12) | 24 (88.89) | ||
| Income status | Medium | 8 (11.76) | 4 (9.76) | 4 (14.82) | 0.218 |
| High | 45 (66.18) | 25 (60.98) | 20 (74.07) | ||
| Very high | 15 (22.06) | 12 (29.27) | 3 (11.11) | ||
| Occupational activity | Working | 55 (80.88) | 35 (85.37) | 20 (74.07) | 0.399 |
| Not working | 13 (19.12) | 6 (14.63) | 7 (25.93) | ||
| Birth rate | 1 | 39 (57.36) | 21 (51.22) | 18 (66.67) | 0.311 |
| 2 | 20 (29.41) | 15 (36.59) | 5 (18.52) | ||
| 3 and above | 9 (13.24) | 5 (12.19) | 4 (14.82) | ||
| Type of childbirth | Natural | 33 (48.53) | 15 (36.59) | 18 (66.67) | 0.029 * |
| Surgical | 35 (51.47) | 26 (63.41) | 9 (33.33) | ||
| Type of feeding at 7 ± 1 week | Breastfeeding | 39 (57.36) | 23 (56,1) | 16 (59.26) | 0.874 |
| Combination | 22 (32.36) | 13 (31.7) | 9 (33.33) | ||
| No breastfeeding | 7 (10.29) | 5 (12.19) | 2 (7.4) | ||
| Type of feeding at 6 months * | Breastfeeding | 45 (66.18) | 25 (60.98) | 20 (74.07) | 0.392 |
| No breastfeeding | 23 (33.82) | 16 (39.02) | 7 (25.93) | ||
| Type of feeding at 1 year * | Breastfeeding | 34 (50.0) | 16 (39.02) | 18 (66.67) | 0.047 * |
| No breastfeeding | 34 (50.0) | 25 (60.98) | 9 (33.33) | ||
| Infant’s sex | Male | 39 (57.36) | 27 (65.85) | 12 (44.44) | 0.135 |
| Female | 29 (42.65) | 14 (34.15) | 15 (55.56) | ||
| Sociodemographic data | average | Average | average | p | |
| Mother’s age | average | 31.76 | 32.37 | 30.85 | 0.655 |
| Babies’ Anthropometric Data | Total Group n = 68 | Boys n = 39 | Girls n = 29 | p | ||
|---|---|---|---|---|---|---|
| Mean | Mean | Mean | ||||
| Delivery | Weight [g] | mean | 3403.31 | 3452.56 | 3337.07 | 0.249 |
| Length [cm] | mean | 54.24 | 54.33 | 54.1 | 0.915 | |
| Ponderal Index [kg/m3] | mean | 21.4 | 21.6 | 21.1 | 0.275 | |
| at 7 ± 1 week | Weight [g] | mean | 4944.71 | 5173.08 | 4637.59 | <0.001 * |
| Length [cm] | mean | 56.41 | 56.87 | 55.79 | 0.116 | |
| BMI [kg/m2] | mean | 15.55 | 16.01 | 14.92 | 0.006 * | |
| Head circumference [cm] | mean | 37.44 | 37.88 | 36.85 | 0.001 * | |
| Ponderal Index [kg/m3] | mean | 27.7 | 28.3 | 26.7 | 0.1 | |
| at 6 months | Weight [g] | mean | 7813.53 | 8182.05 | 7317.93 | <0.001 * |
| Length [cm] | mean | 66.94 | 68.21 | 65.23 | 0.002 * | |
| BMI [kg/m2] | mean | 17.49 | 17.68 | 17.23 | 0.348 | |
| Head circumference [cm] | mean | 42.59 | 43.1 | 41.9 | <0.001 * | |
| Ponderal Index [kg/m3] | mean | 26.3 | 26.1 | 26.5 | 0.786 | |
| Subscapular skinfold thickness [mm] | mean | 8.51 | 8.53 | 8.49 | 0.936 | |
| at 12 months | Weight [g] | mean | 9738.97 | 10,108.21 | 9242.41 | 0.003 * |
| Length [cm] | mean | 75.93 | 76.81 | 74.76 | 0.007 * | |
| BMI [kg/m2] | mean | 16.87 | 17.14 | 16.51 | 0.094 | |
| Head circumference [cm] | mean | 45.67 | 46.24 | 44.9 | 0.001 * | |
| Ponderal Index [kg/m3] | mean | 22.3 | 22.4 | 22.1 | 0.522 | |
| Subscapular skinfold thickness [mm] | mean | 7.72 | 7.64 | 7.83 | 0.896 | |
| Variable | At 7 ± 1 Weeks Postpartum | p | 6 Months Postpartum | p | 12 Months Postpartum | p | |||||||||||||||
|---|---|---|---|---|---|---|---|---|---|---|---|---|---|---|---|---|---|---|---|---|---|
| Breastfeeding | No Breastfeeding + Mixed Feeding | Breastfeeding | No Breastfeeding | Breastfeeding | No Breastfeeding | ||||||||||||||||
| Mean | Min–Max | SD | Mean | Min–Max | SD | Mean | Min–Max | SD | Mean | Min–Max | SD | Mean | Min–Max | SD | Mean | Min–Max | SD | ||||
| weight [g] | 5055.38 | 3660–6490 | 609.72 | 4795.86 | 3740–6070 | 481.24 | 0.03 * | 7742.0 | 5930–10,370 | 836.77 | 7953.48 | 5700–9890 | 1072.48 | 0.361 | 9422.65 | 7070–12,390 | 1074.55 | 10,055.29 | 7350–12,460 | 1212.62 | 0.019 * |
| weight [percentile] | 52.99 | 1–96 | 24.89 | 43.79 | 4–88.5 | 23.84 | 0.115 | 52.00 | 4–100 | 24.57 | 56.43 | 3–97.5 | 29.51 | 0.525 | 50.51 | 2.5–99 | 26.88 | 66.16 | 6–99 | 27.56 | 0.024 * |
| Length [cm] | 56.50 | 51–61 | 2.63 | 56.29 | 52–61.5 | 2.73 | 0.526 | 66.70 | 58.5–78 | 3.64 | 67.41 | 60–79 | 4.57 | 0.599 | 75.78 | 68–80 | 2.76 | 76.09 | 70–82 | 2.92 | 0.863 |
| length [percentile] | 50.64 | 0–98,5 | 34.10 | 48.34 | 3–100 | 35.91 | 0.921 | 48.13 | 0–100 | 32.04 | 50.57 | 0–100 | 36.03 | 0.815 | 60.62 | 1–97 | 30.91 | 59.41 | 7–100 | 27.08 | 0.878 |
| head circumference [cm] | 37.4 | 34–40 | 1.32 | 37.5 | 35–40 | 1.20 | 0.935 | 42.39 | 39.5–44.7 | 1.16 | 42.99 | 39.5–45.5 | 1.40 | 0.065 | 45.42 | 42.5–48 | 1.32 | 45.93 | 42–50 | 1.80 | 0.144 |
| head circumference [percentile] | 34.01 | 0–97 | 25.96 | 39.34 | 1–90 | 28.93 | 0.434 | 40.11 | 1–96 | 25.55 | 48.78 | 2–92 | 25.39 | 0.203 | 47.65 | 4–99 | 28.72 | 57.00 | 2–100 | 32.03 | 0.186 |
| BMI [kg/m2] | 15.83 | 12.88–18.96 | 1.59 | 15.17 | 12.82–19.22 | 1.51 | 0.102 | 17.45 | 12.85–21.78 | 1.84 | 17.57 | 12.33–21.71 | 2.24 | 0.589 | 16.40 | 13.78–19.85 | 1.58 | 17.35 | 13.83–20.53 | 1.69 | 0.015 * |
| BMI [percentile] | 52.87 | 4.5–97 | 31.23 | 40.74 | 1–100 | 30.12 | 0.135 | 53.93 | 0–100 | 30.86 | 57.13 | 0–100 | 34.57 | 0.618 | 42.97 | 1–98 | 31.26 | 61.93 | 0–99 | 29.17 | 0.014 * |
| Length/weight [percentile] | 52.78 | 0–100 | 35.46 | 44.93 | 0–100 | 36.85 | 0.324 | 56.73 | 0–100 | 30.87 | 60.22 | 0–100 | 33.55 | 0.582 | 44.88 | 2–98 | 30.09 | 63.97 | 2–99 | 29.04 | 0.01 * |
| Ponderal Index [kg/m3] | 28.1 | 21.6–35.4 | 0.33 | 27.1 | 20.9–35.3 | 0.35 | 0.229 | 26.3 | 16.5–34.2 | 0.36 | 26.3 | 18.0–33.5 | 0.43 | 0.837 | 21.7 | 17.8–25.9 | 0.23 | 22.8 | 17.2–27.4 | 0.24 | 0.046 * |
| Subscapular skinfold thickness [mm] | - | - | - | - | - | - | - | 8.61 | 5–13 | 1.86 | 8.33 | 4.2–11 | 1.54 | 0.871 | 7.68 | 4.5–14 | 1.91 | 7.76 | 5–12.2 | 1.68 | 0.735 |
| Subscapular skinfold thickness [percentile] | - | - | - | - | - | - | - | 71.08 | 1.5–100 | 29.09 | 72.22 | 0–98.5 | 30.05 | 0.953 | 67.07 | 2–100 | 28.90 | 70.34 | 7–100 | 28.01 | 0.713 |
| Variable | Sex | At 7 ± 1 Weeks Postpartum | p B/G | at 6 Months Postpartum | p B/G | at 12 Months Postpartum | p B/G | ||||||
|---|---|---|---|---|---|---|---|---|---|---|---|---|---|
| Breastfeeding | Mixed Feeding + No Breastfeeding | p B/B G/G | Breastfeeding | No Breastfeeding | p B/B G/G | Breastfeeding | No Breastfeeding | p B/B G/G | |||||
| Mean | Mean | Mean | Mean | Mean | Mean | ||||||||
| weight [g] | B | 5280 | 5002 | 0.065 | 0.001 * | 8053.75 | 8387.33 | 0.189 | 0.001 * | 9626.11 | 10,521.43 | 0.005 * | 0.003 * |
| G | 4696 | 4575 | 0.616 | 7385.71 | 7140 | 0.494 | 9193.75 | 9302.31 | 0.779 | ||||
| weight [percentile] | B | 55.71 | 44.63 | 0.149 | 0.365 | 51.9 | 63.2 | 0.194 | 0.315 | 46.67 | 71.67 | 0.005 * | 0.664 |
| G | 48.63 | 42.89 | 0.631 | 52.12 | 43.75 | 0.51 | 54.84 | 57.27 | 0.779 | ||||
| length [cm] | B | 56.94 | 56.77 | 0.675 | 0.116 | 68.04 | 68.47 | 0.965 | 0.002 * | 76.33 | 77.21 | 0.245 | 0.007 * |
| G | 55.8 | 55.79 | 0.983 | 65.18 | 65.44 | 0.883 | 75.16 | 74.27 | 0.184 | ||||
| length [percentile] | B | 49.48 | 47.47 | 0.862 | 0.862 | 51.67 | 52.8 | 0.942 | 0.267 | 57.39 | 63.71 | 0.245 | 0.838 |
| G | 52.5 | 49.29 | 1 | 44.1 | 46.38 | 1 | 64.25 | 52.46 | 0.184 | ||||
| head circumference [cm] | B | 37.83 | 37.97 | 0.793 | 0.001 * | 42.76 | 43.65 | 0.02 * | 0.001 * | 45.81 | 46.62 | 0.064 | 0.001 * |
| G | 36.72 | 37.0 | 0.581 | 41.96 | 41.75 | 0.921 | 44.98 | 44.81 | 0.912 | ||||
| head circumference [percentile] | B | 34.46 | 40.53 | 0.623 | 0.651 | 36.17 | 52.8 | 0.06 | 0.623 | 44.72 | 60.86 | 0.064 | 0.867 |
| G | 33.3 | 38.07 | 0.511 | 44.62 | 41.25 | 0.844 | 50.94 | 50.77 | 0.912 | ||||
| BMI [kg/m2] | B | 16.31 | 15.56 | 0.123 | 0.006 * | 17.48 | 18.0 | 0.323 | 0.348 | 16.54 | 17.66 | 0.01 * | 0.094 |
| G | 15.08 | 14.75 | 0.715 | 17.41 | 16.75 | 0.582 | 16.25 | 16.84 | 0.449 | ||||
| BMI [percentile] | B | 58.73 | 42.87 | 0.17 | 0.126 | 51.54 | 61.5 | 0.319 | 0.814 | 41.69 | 66.4 | 0.012 * | 0.406 |
| G | 43.5 | 38.46 | 0.793 | 56.67 | 48.94 | 0.643 | 44.41 | 54.69 | 0.456 | ||||
| length/weight [percentile] | B | 59.06 | 47.13 | 0.378 | 0.135 | 53.83 | 64.87 | 0.225 | 0.955 | 42.0 | 69.1 | 0.004 * | 0.523 |
| G | 42.73 | 42.57 | 0.81 | 60.05 | 51.5 | 0.574 | 48.12 | 55.69 | 0.614 | ||||
| Ponderal Index [kg/m3] | B | 2.87 | 2.75 | 0.27 | 0.1 | 2.59 | 2.66 | 0.502 | 0.786 | 2.17 | 2.29 | 0.1 | 0.522 |
| G | 27.1 | 26.6 | 0.747 | 26.8 | 25.7 | 0.518 | 21.6 | 22.7 | 0.423 | ||||
| Subscapular skinfold thickness [mm] | B | - | - | - | - | 8.51 | 8.55 | 0.582 | 0.936 | 7.11 | 8.1 | 0.024 * | 0.896 |
| G | - | - | - | - | 8.71 | 7.9 | 0.365 | 8.32 | 7.22 | 0.124 | |||
| Subscapular skinfold thickness [mm] | B | - | - | - | - | 70.27 | 76.77 | 0.572 | 0.842 | 60.92 | 80.0 | 0.026 * | 0.65 |
| G | - | - | - | - | 72.0 | 63.69 | 0.365 | 74.0 | 54.73 | 0.124 | |||
| Variable | At 7 ± 1 Weeks from Delivery | p | at 6 Months from Delivery | p | at 12 Months from Delivery | p | |||||||||||||||
|---|---|---|---|---|---|---|---|---|---|---|---|---|---|---|---|---|---|---|---|---|---|
| GDM | Without GDM | GDM | Without GDM | GDM | Without GDM | ||||||||||||||||
| Mean | Min–Max | SD | Mean | Min–Max | SD | Mean | Min–Max | SD | Mean | Min–Max | SD | Mean | Min–Max | SD | Mean | Min–Max | SD | ||||
| weight [g] | 4974.39 | 3740–6490 | 546.18 | 4899.63 | 3660–6160 | 611.06 | 0.552 | 7877.56 | 5700–9890 | 891.27 | 7716.30 | 5930–10,370 | 972.62 | 0.164 | 9844.39 | 7350–11,600 | 1173.89 | 9578.89 | 7070–12,460 | 1195.58 | 0.229 |
| weight [percentile] | 49.06 | 4–96 | 24.34 | 49.07 | 1–88.5 | 25.69 | 0.9 | 54.15 | 3–97.5 | 26.75 | 52.52 | 4–100 | 25.84 | 0.693 | 59.62 | 6–97.5 | 30.09 | 56.39 | 2.5–99 | 25.34 | 0.647 |
| length [cm] | 56.54 | 51–61 | 2.62 | 56.22 | 51–61.5 | 2.74 | 0.669 | 67.00 | 60.5–78 | 3.55 | 66.86 | 58.5–79 | 4.57 | 0.702 | 75.91 | 70–82 | 2.88 | 75.96 | 68–80 | 2.79 | 0.85 |
| length [percentile] | 50.73 | 3–98.5 | 35.55 | 48.04 | 0–100 | 33.81 | 0.87 | 48.83 | 0–100 | 31.24 | 49.15 | 0–100 | 36.58 | 0.866 | 57.59 | 7–100 | 29.30 | 63.70 | 1–99 | 28.29 | 0.39 |
| head circumference [cm] | 37.51 | 35–40 | 1.21 | 37.34 | 34–40 | 1.35 | 0.604 | 42.70 | 39.5–45.5 | 1.34 | 42.43 | 39.5–45 | 1.15 | 0.327 | 45.76 | 42–50 | 1.67 | 45.54 | 42.5–49 | 1.47 | 0.436 |
| head circumference [percentile] | 35.82 | 1–97 | 26.66 | 37.00 | 0–90 | 28.47 | 0.87 | 42.49 | 1–96 | 26.13 | 43.89 | 2–92 | 25.35 | 0.715 | 52.17 | 2–100 | 32.10 | 52.56 | 4–99 | 28.65 | 1 |
| BMI [kg/m2] | 15.57 | 12.83–19.22 | 1.50 | 15.51 | 12.82–18.96 | 1.72 | 0.851 | 17.62 | 12.33–21.71 | 2.14 | 17.29 | 14.57–21.78 | 1.70 | 0.418 | 17.08 | 13.83–20.53 | 1.87 | 16.56 | 13.78–19.96 | 1.37 | 0.158 |
| BMI [percentile] | 47.28 | 2.5–100 | 30.24 | 48.33 | 1–97 | 32.99 | 0.94 | 57.2 | 0–100 | 33.18 | 51.7 | 1.5–100 | 30.28 | 0.463 | 55.57 | 0–99 | 34.64 | 47.70 | 3–98 | 25.88 | 0.265 |
| Length/weight [percentile] | 46.73 | 0–100 | 35.34 | 53.54 | 0–99 | 37.26 | 0.629 | 59.17 | 0–100 | 32.80 | 56.00 | 3–100 | 30.19 | 0.603 | 56.88 | 2–99 | 34.11 | 50.70 | 4–99 | 25.37 | 0.347 |
| Ponderal Index [kg/m3] | 27.6 | 21.6–35.4 | 0.33 | 27.7 | 20.9–33.3 | 0.36 | 0.773 | 26.4 | 16.5–34.2 | 0.40 | 26.1 | 19.0–33.5 | 0.36 | 0.584 | 22.5 | 17.2–27.4 | 0.27 | 21.8 | 18.1–25.3 | 0.18 | 0.256 |
| Subscapular skinfold thickness [mm] | - | - | - | - | - | - | - | 8.46 | 5–11.7 | 1.57 | 8.59 | 4.2–13 | 2.04 | 0.98 | 7.61 | 4.5–12.2 | 1.65 | 7.90 | 5–14 | 1.99 | 0.678 |
| Subscapular skinfold thickness [percentile] | - | - | - | - | - | - | - | 71.82 | 1.5–100 | 29.35 | 70.93 | 0–100 | 29.50 | 0.945 | 67.67 | 2–100 | 28.55 | 70.28 | 7–100 | 28.37 | 0.735 |
| Variable | Sex | at 7 ± 1 Weeks after Delivery | p B/B G/G | at 6 Months after Delivery | p B/B G/G | at 12 Months after Delivery | p B/B G/G | |||||||||
|---|---|---|---|---|---|---|---|---|---|---|---|---|---|---|---|---|
| GDM | Without GDM | GDM | Without GDM | GDM | Without GDM | |||||||||||
| Mean | p B/G | Mean | p B/G | Mean | p B/G | Mean | p B/G | Mean | p B/G | Mean | p B/G | |||||
| weight [g] | B | 5146.30 | 0.002 * | 5233.33 | 0.021 * | 0.879 | 8123.70 | 0.043 * | 8313.33 | 0.007 * | 0.915 | 10,071.48 | 0.151 | 10,190.83 | 0.015 * | 1 |
| G | 4642.86 | 4632.67 | 0.57 | 7402.86 | 7238.67 | 0.711 | 9406.43 | 9089.33 | 0.621 | |||||||
| weight [percentile] | B | 51.09 | 0.386 | 52.25 | 0.463 | 0.903 | 55.44 | 0.66 | 58.04 | 0.407 | 0.891 | 60.54 | 1 | 59.21 | 0.845 | 1 |
| G | 45.14 | 46.53 | 0.777 | 51.64 | 48.10 | 0.694 | 57.86 | 54.13 | 0.621 | |||||||
| length [cm] | B | 56.94 | 0.181 | 56.71 | 0.525 | 0.891 | 67.91 | 0.017 * | 68.88 | 0.043 * | 0.583 | 76.76 | 0.021 * | 76.92 | 0.134 | 0.783 |
| G | 55.75 | 55.83 | 0.948 | 65.25 | 65.25 | 0.793 | 74.29 | 75.20 | 0.441 | |||||||
| length [percentile] | B | 51.24 | 1 | 43.00 | 0.643 | 0.648 | 49.67 | 0.762 | 57.58 | 0.251 | 0.647 | 59.33 | 0.6 | 64.08 | 0.981 | 0.783 |
| G | 49.75 | 52.07 | 0.983 | 47.21 | 42.40 | 0.743 | 54.21 | 63.40 | 0.441 | |||||||
| head circumference [cm] | B | 37.89 | 0.005 * | 37.85 | 0.16 | 0.736 | 43.13 | 0.003 * | 43.04 | 0.03 * | 0.518 | 46.24 | 0.021 * | 46.25 | 0.022 * | 0.951 |
| G | 36.77 | 36.93 | 0.427 | 41.86 | 41.94 | 0.565 | 44.82 | 44.98 | 0.93 | |||||||
| head circumference [percentile] | B | 37.70 | 0.296 | 34.75 | 0.678 | 0.715 | 42.89 | 0.825 | 41.83 | 0.476 | 0.735 | 53.22 | 0.989 | 53.83 | 0.768 | 0.951 |
| G | 32.18 | 38.80 | 0.483 | 41.71 | 45.53 | 0.691 | 50.14 | 51.53 | 0.93 | |||||||
| BMI [kg/m2] | B | 15.89 | 0.065 | 16.30 | 0.053 | 0.374 | 17.72 | 0.755 | 17.60 | 0.486 | 0.73 | 17.12 | 1 | 17.19 | 0.028 * | 0.845 |
| G | 14.96 | 14.88 | 0.847 | 17.43 | 17.05 | 0.621 | 17.01 | 16.05 | 0.354 | |||||||
| BMI [percentile] | B | 50.31 | 0.425 | 57.83 | 0.179 | 0.513 | 56.59 | 0.847 | 52.62 | 1 | 0.715 | 55.15 | 0.65 | 54.67 | 0.164 | 0.819 |
| G | 41.43 | 40.73 | 0.879 | 58.36 | 50.97 | 0.527 | 56.39 | 42.13 | 0.348 | |||||||
| Length/weight [percentile] | B | 50.30 | 0.394 | 63.88 | 0.164 | 0.28 | 58.70 | 0.815 | 56.67 | 0.942 | 0.843 | 57.00 | 0.721 | 55.67 | 0.558 | 0.796 |
| G | 39.86 | 45.27 | 0.896 | 60.07 | 55.47 | 0.585 | 56.64 | 46.73 | 0.458 | |||||||
| Ponderal Index [kg/m3] | B | 28.0 | 0.35 | 28.8 | 0.126 | 0.391 | 263 | 0.714 | 25.8 | 0.755 | 0.663 | 22.4 | 0.523 | 22.3 | 0.114 | 0.988 |
| G | 27.0 | 26.8 | 0.983 | 26.8 | 26.3 | 0.78 | 22.9 | 21.4 | 0.217 | |||||||
| Subscapular skinfold thickness [mm] | B | - | - | - | - | - | 8.35 | 0.699 | 8.93 | 0.694 | 0.714 | 7.57 | 0.772 | 7.82 | 0.98 | 0.843 |
| G | - | - | - | - | - | 8.67 | 8.32 | 0.677 | 7.69 | 7.96 | 0.827 | |||||
| Subscapular skinfold thickness [percentile] | B | - | - | - | - | - | 71.26 | 0.934 | 76.17 | 0.623 | 0.725 | 70.00 | 0.64 | 73.88 | 0.714 | 0.831 |
| G | - | - | - | - | - | 72.89 | 66.73 | 0.661 | 63.18 | 67.40 | 0.861 | |||||
Disclaimer/Publisher’s Note: The statements, opinions and data contained in all publications are solely those of the individual author(s) and contributor(s) and not of MDPI and/or the editor(s). MDPI and/or the editor(s) disclaim responsibility for any injury to people or property resulting from any ideas, methods, instructions or products referred to in the content. |
© 2025 by the authors. Licensee MDPI, Basel, Switzerland. This article is an open access article distributed under the terms and conditions of the Creative Commons Attribution (CC BY) license (https://creativecommons.org/licenses/by/4.0/).
Share and Cite
Ćwiek, D.; Zimny, M.; Dawid, W.; Iwanowicz-Palus, G.; Kulesza-Brończyk, B.; Rachubińska, K.; Cybulska, A.M.; Sipak-Szmigiel, O.; Branecka-Woźniak, D.; Szymoniak, K. Evaluation of Changes in the Anthropometric Measurements of Infants in Relation to the Type of Feeding and the Presence of Gestational Diabetes in Their Mothers: A Preliminary Study. J. Clin. Med. 2025, 14, 2393. https://doi.org/10.3390/jcm14072393
Ćwiek D, Zimny M, Dawid W, Iwanowicz-Palus G, Kulesza-Brończyk B, Rachubińska K, Cybulska AM, Sipak-Szmigiel O, Branecka-Woźniak D, Szymoniak K. Evaluation of Changes in the Anthropometric Measurements of Infants in Relation to the Type of Feeding and the Presence of Gestational Diabetes in Their Mothers: A Preliminary Study. Journal of Clinical Medicine. 2025; 14(7):2393. https://doi.org/10.3390/jcm14072393
Chicago/Turabian StyleĆwiek, Dorota, Małgorzata Zimny, Weronika Dawid, Grażyna Iwanowicz-Palus, Bożena Kulesza-Brończyk, Kamila Rachubińska, Anna Maria Cybulska, Olimpia Sipak-Szmigiel, Dorota Branecka-Woźniak, and Katarzyna Szymoniak. 2025. "Evaluation of Changes in the Anthropometric Measurements of Infants in Relation to the Type of Feeding and the Presence of Gestational Diabetes in Their Mothers: A Preliminary Study" Journal of Clinical Medicine 14, no. 7: 2393. https://doi.org/10.3390/jcm14072393
APA StyleĆwiek, D., Zimny, M., Dawid, W., Iwanowicz-Palus, G., Kulesza-Brończyk, B., Rachubińska, K., Cybulska, A. M., Sipak-Szmigiel, O., Branecka-Woźniak, D., & Szymoniak, K. (2025). Evaluation of Changes in the Anthropometric Measurements of Infants in Relation to the Type of Feeding and the Presence of Gestational Diabetes in Their Mothers: A Preliminary Study. Journal of Clinical Medicine, 14(7), 2393. https://doi.org/10.3390/jcm14072393