
Brain-Gut Interplay: Cognitive Performance and Biomarker Correlations in IBD Patients

 , , ,
, , ,  ,
, 
Abstract
1. Introduction
Aim of the Study
2. Material and Methods
2.1. Study Design and Assessment Methodology
2.2. Design and Participants
2.3. Inclusion Criteria
2.4. Exclusion Criteria
2.5. Clinical Assessment
2.6. Laboratory Assessment
2.7. Statistical Analysis
3. Results
3.1. Study Participants
3.2. Baseline Cognitive and Emotional Function in CD, UC, and the Controls: A Comparative Analysis
3.3. Baseline Biomarker Assessment in CD, UC, and the Controls: A Comparative Analysis
3.4. Longitudinal Findings in Cognitive Function in CD, UC, and the Controls: A Comparative Analysis
3.5. Multivariate Analysis of Biomarkers in CU, CD, and the Controls: Adjusting for Lifestyle Factors
- ○
- In the univariate analyses, significant differences were noted between patient groups regarding log-transformed SAA levels (p = 0.003). Multivariate regression, adjusted for age, biologic therapy, BMI, sleep duration, and physical activity, revealed that UC remained significantly associated with increased log-SAA compared to the controls, whereas CD did not (p = 0.09, R = 0.368, R2 = 0.135) (Table 10).
- ○
- Hcy: No significant differences in Hcy levels were observed between the disease groups after adjustment in the multivariate model (p = 0.289, R = 0.310, R2 = 0.096) (Table 11).
- ○
- BDNF: Both the CD and UC groups exhibited lower BDNF levels compared to controls, with this difference maintaining significance in the multivariate analysis (p < 0.001, R = 0.497, R2 = 0.247) (Table 12).
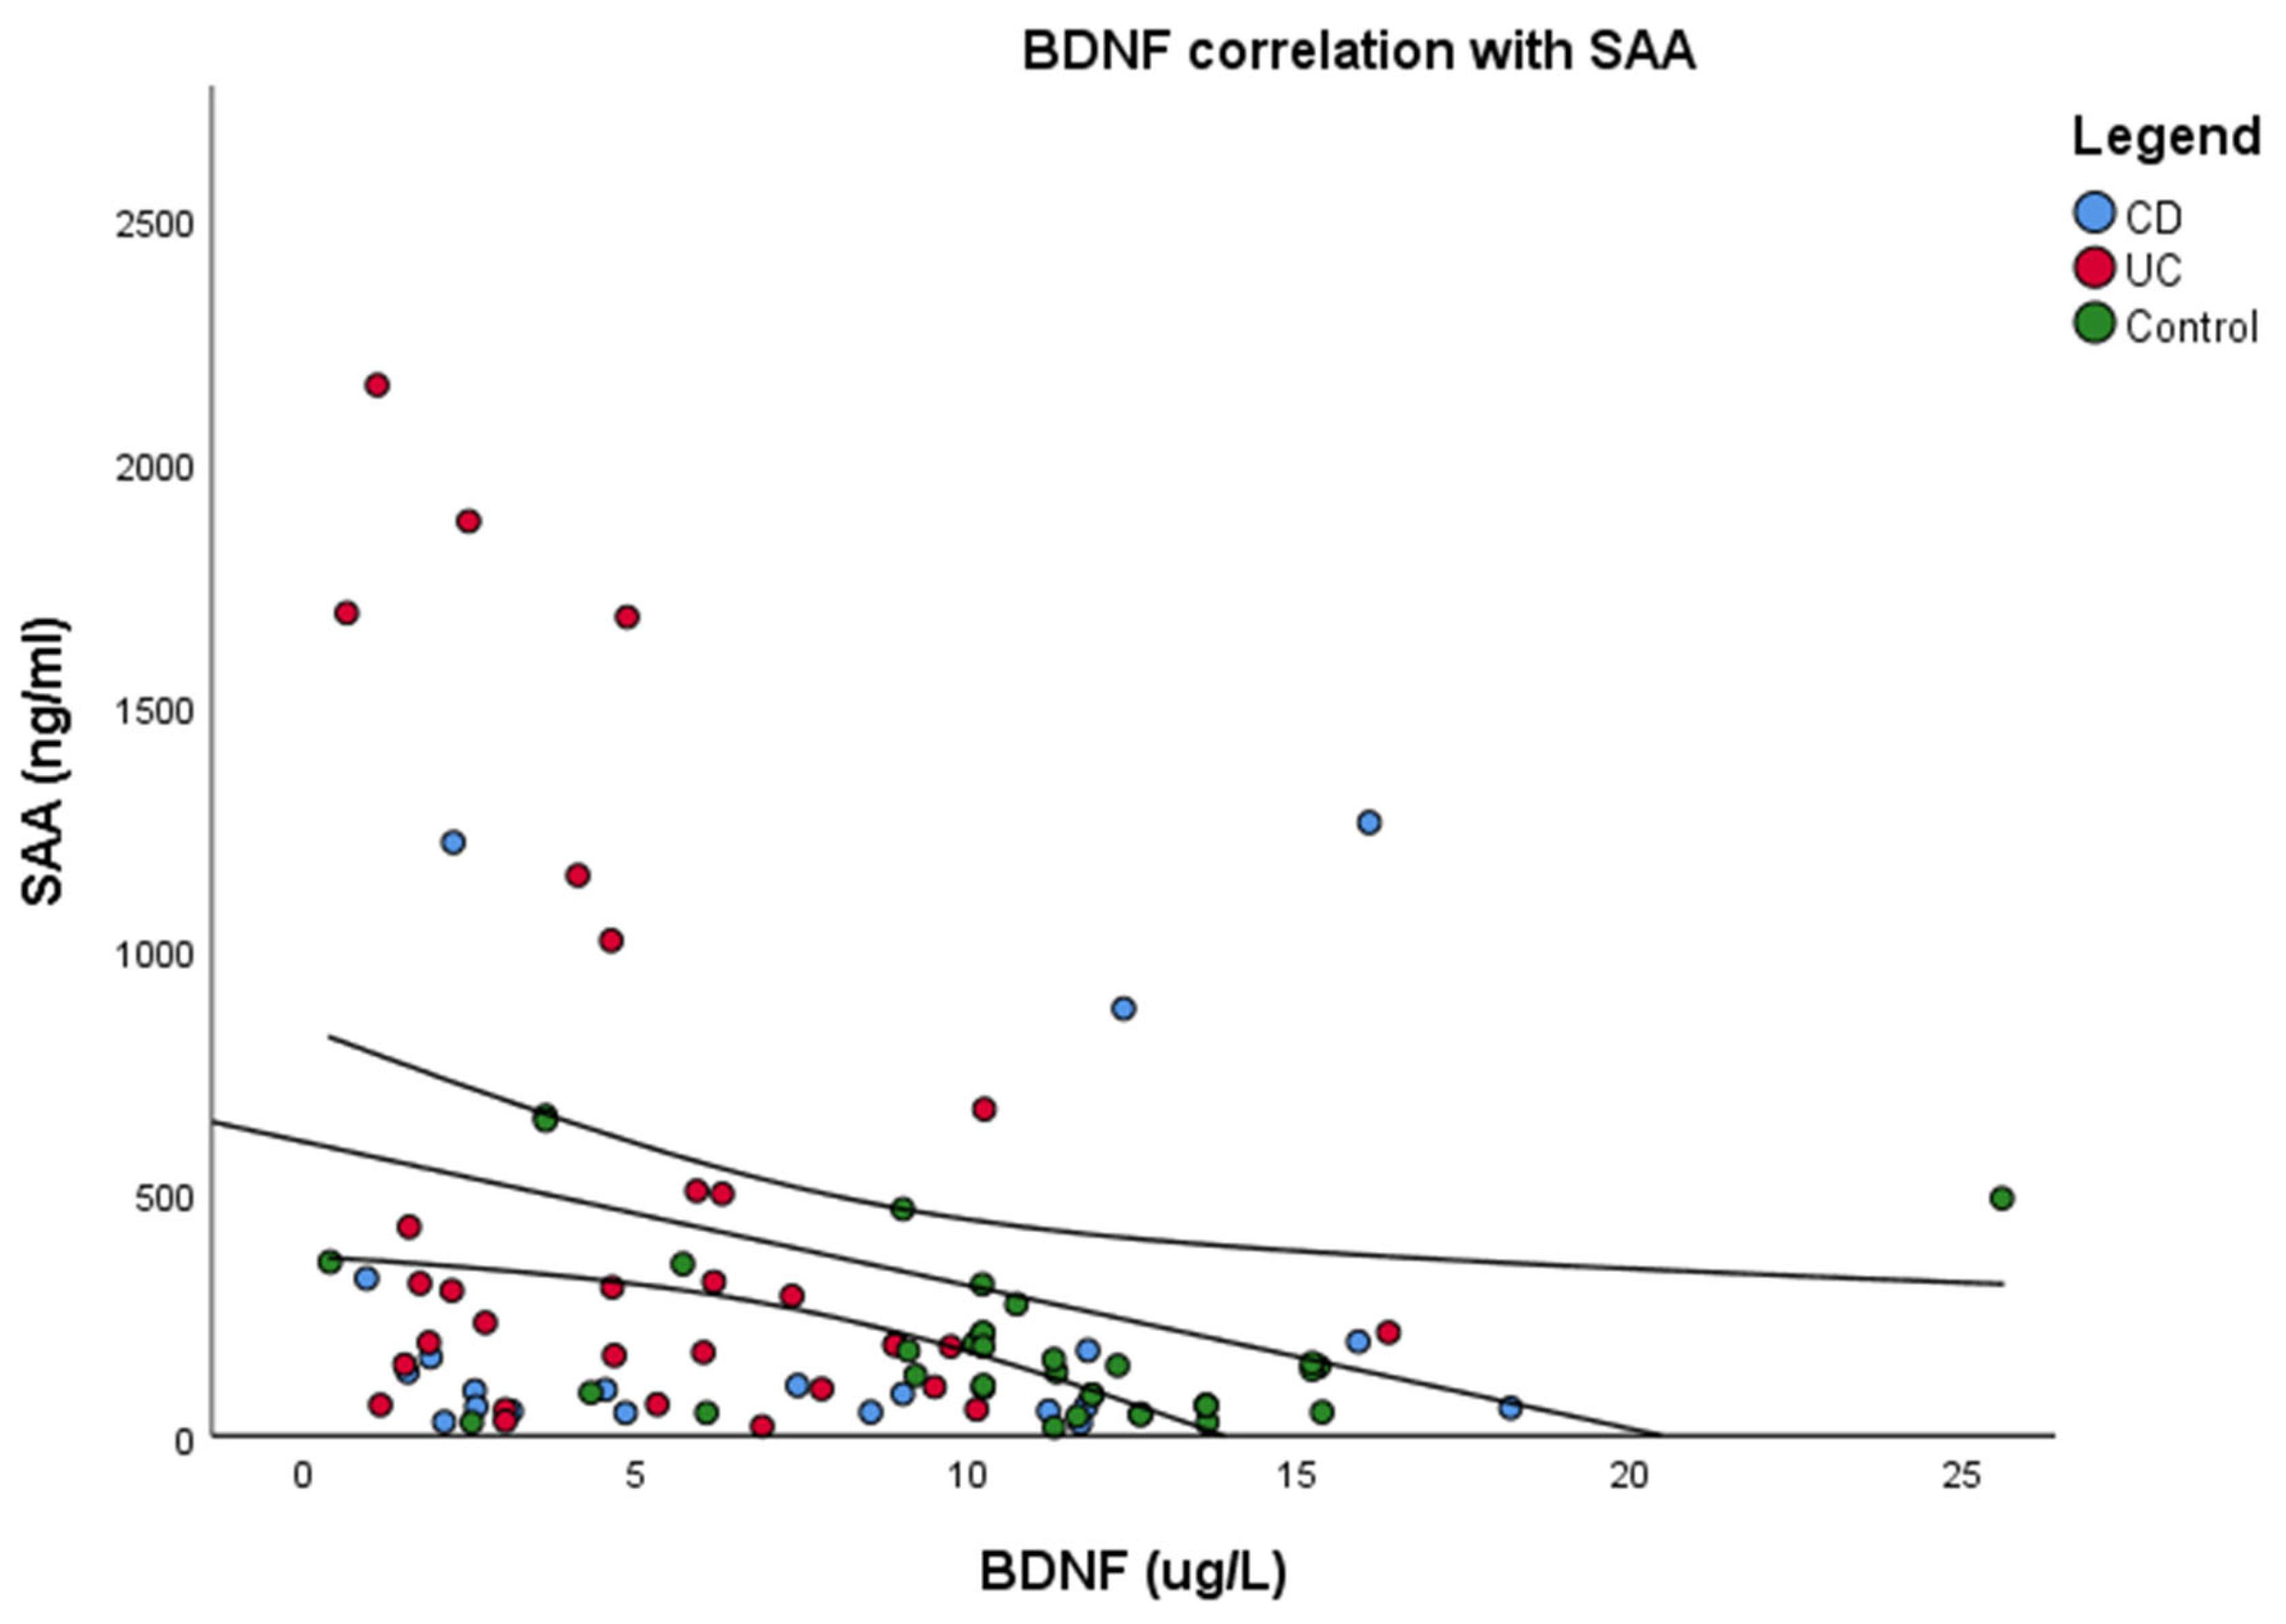
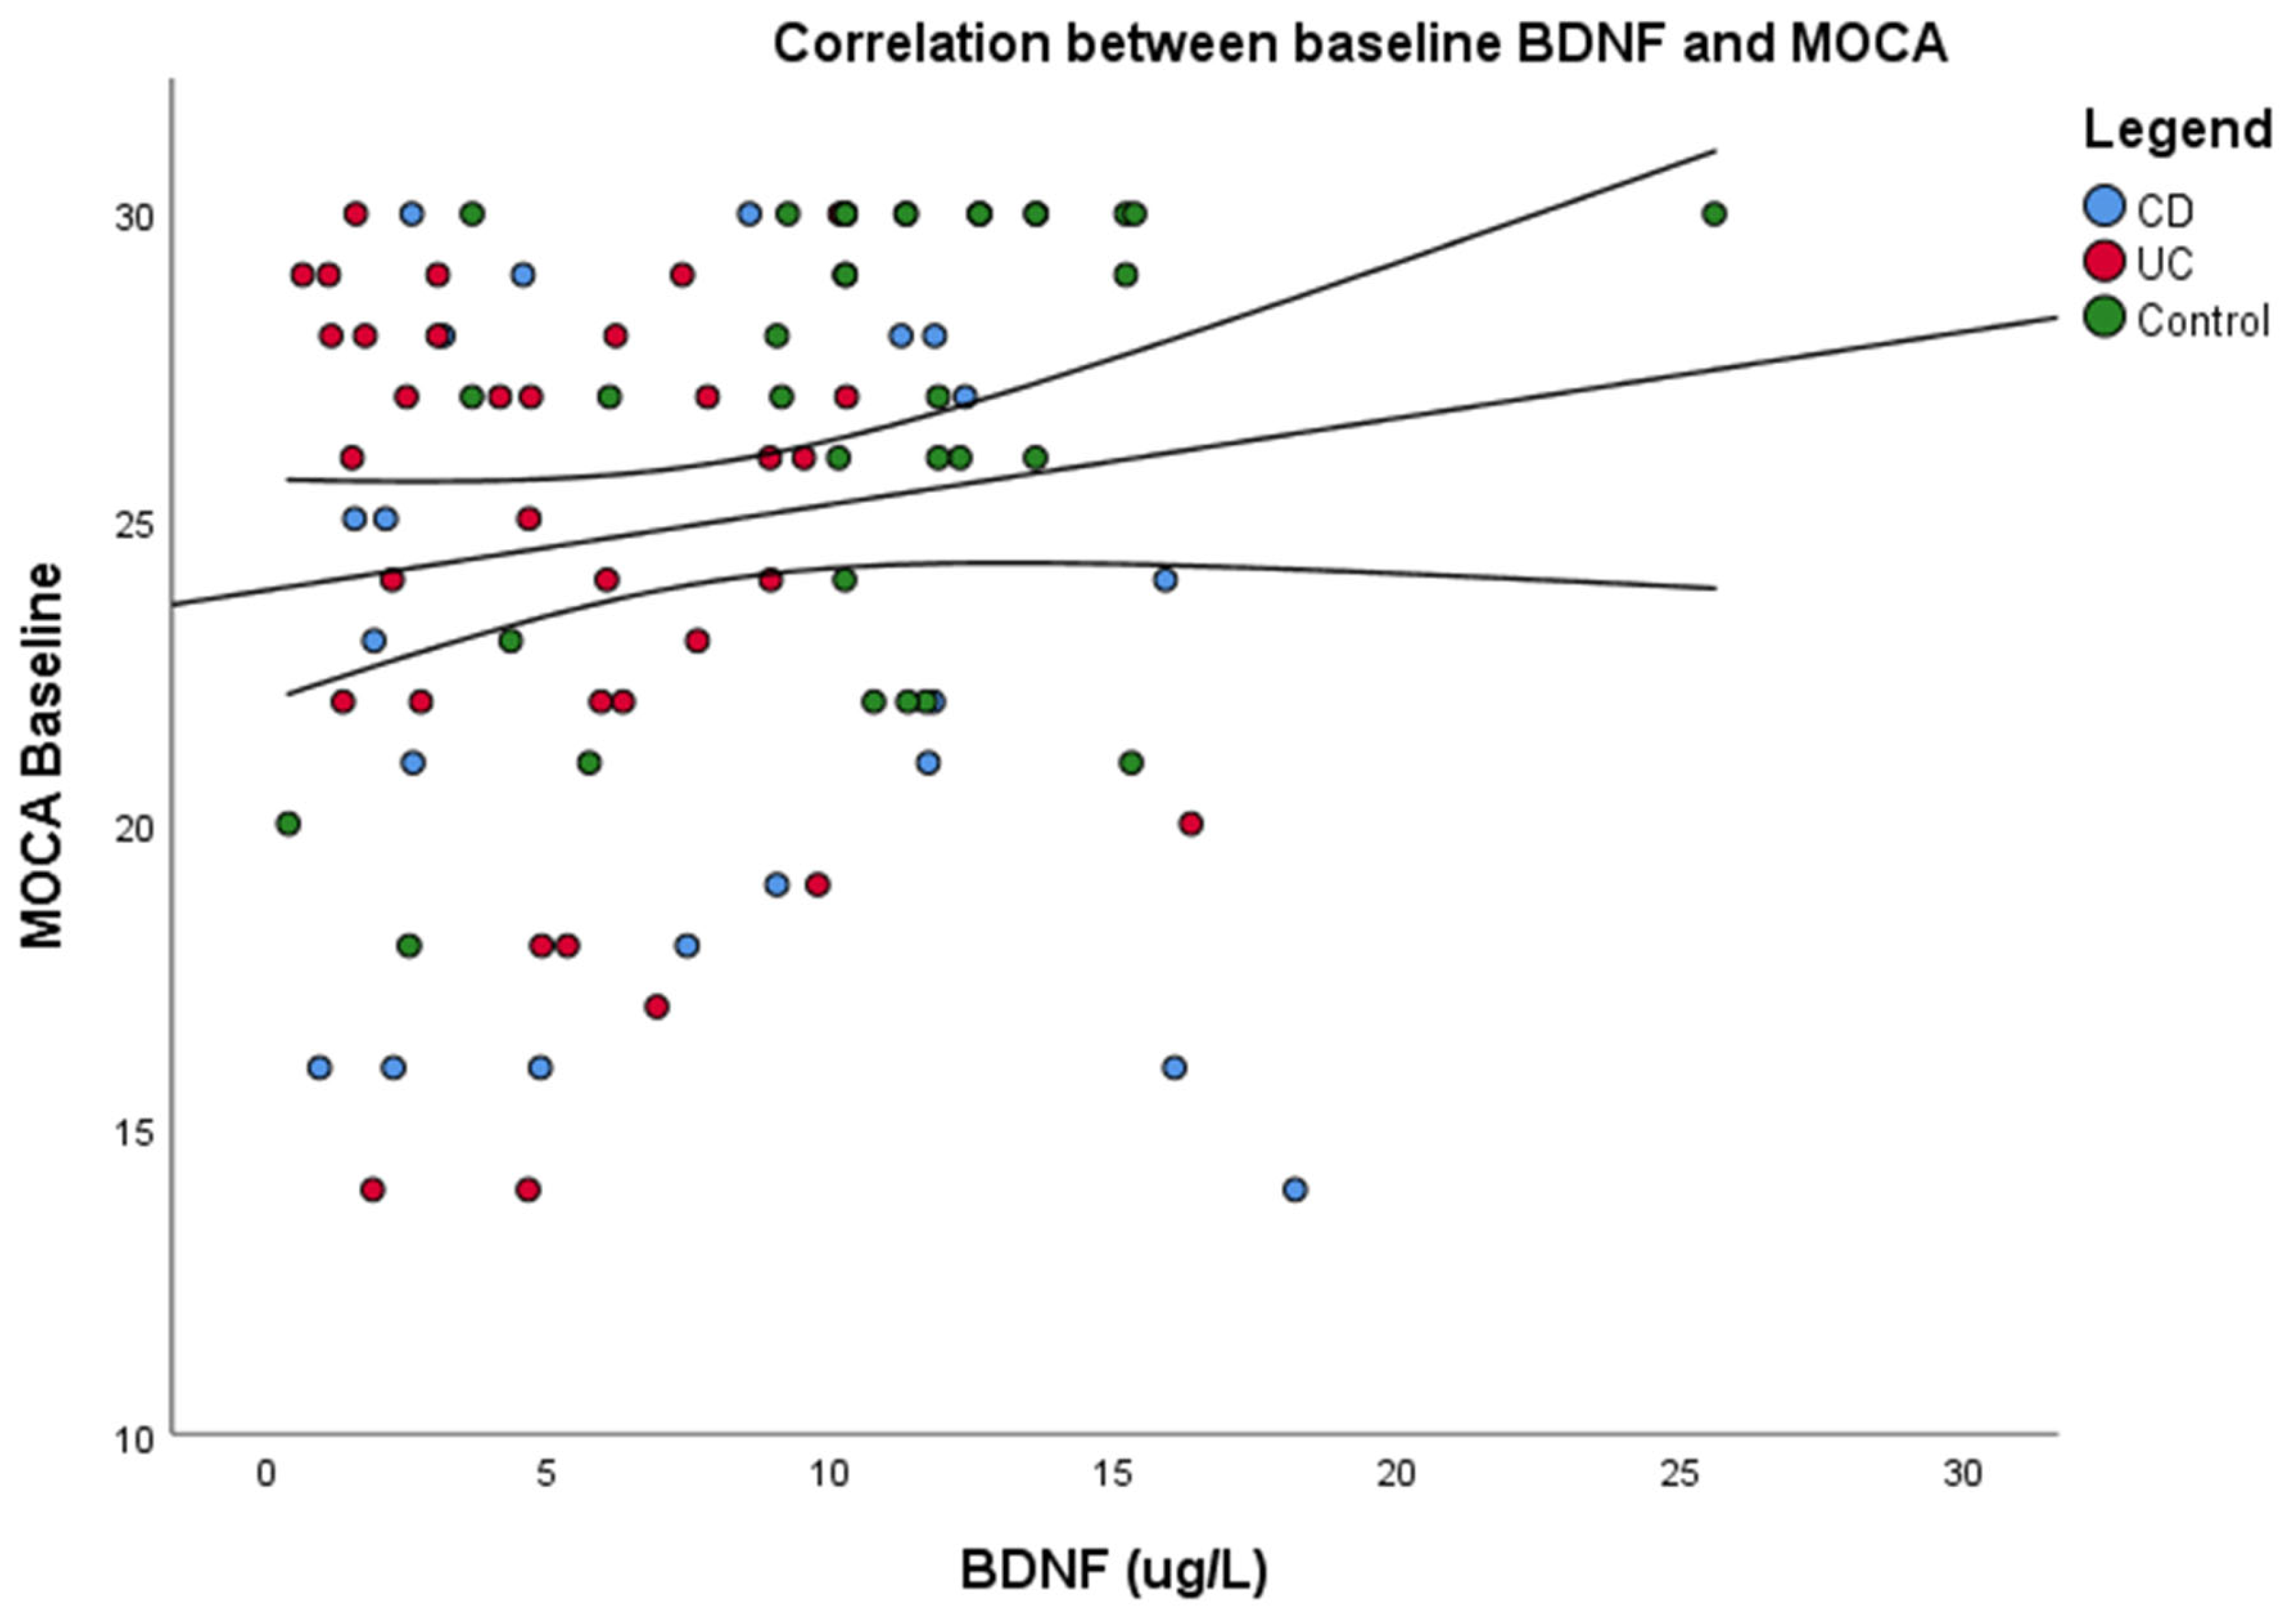
3.6. Correlations Between Serum Biomarkers and Cognitive Functioning
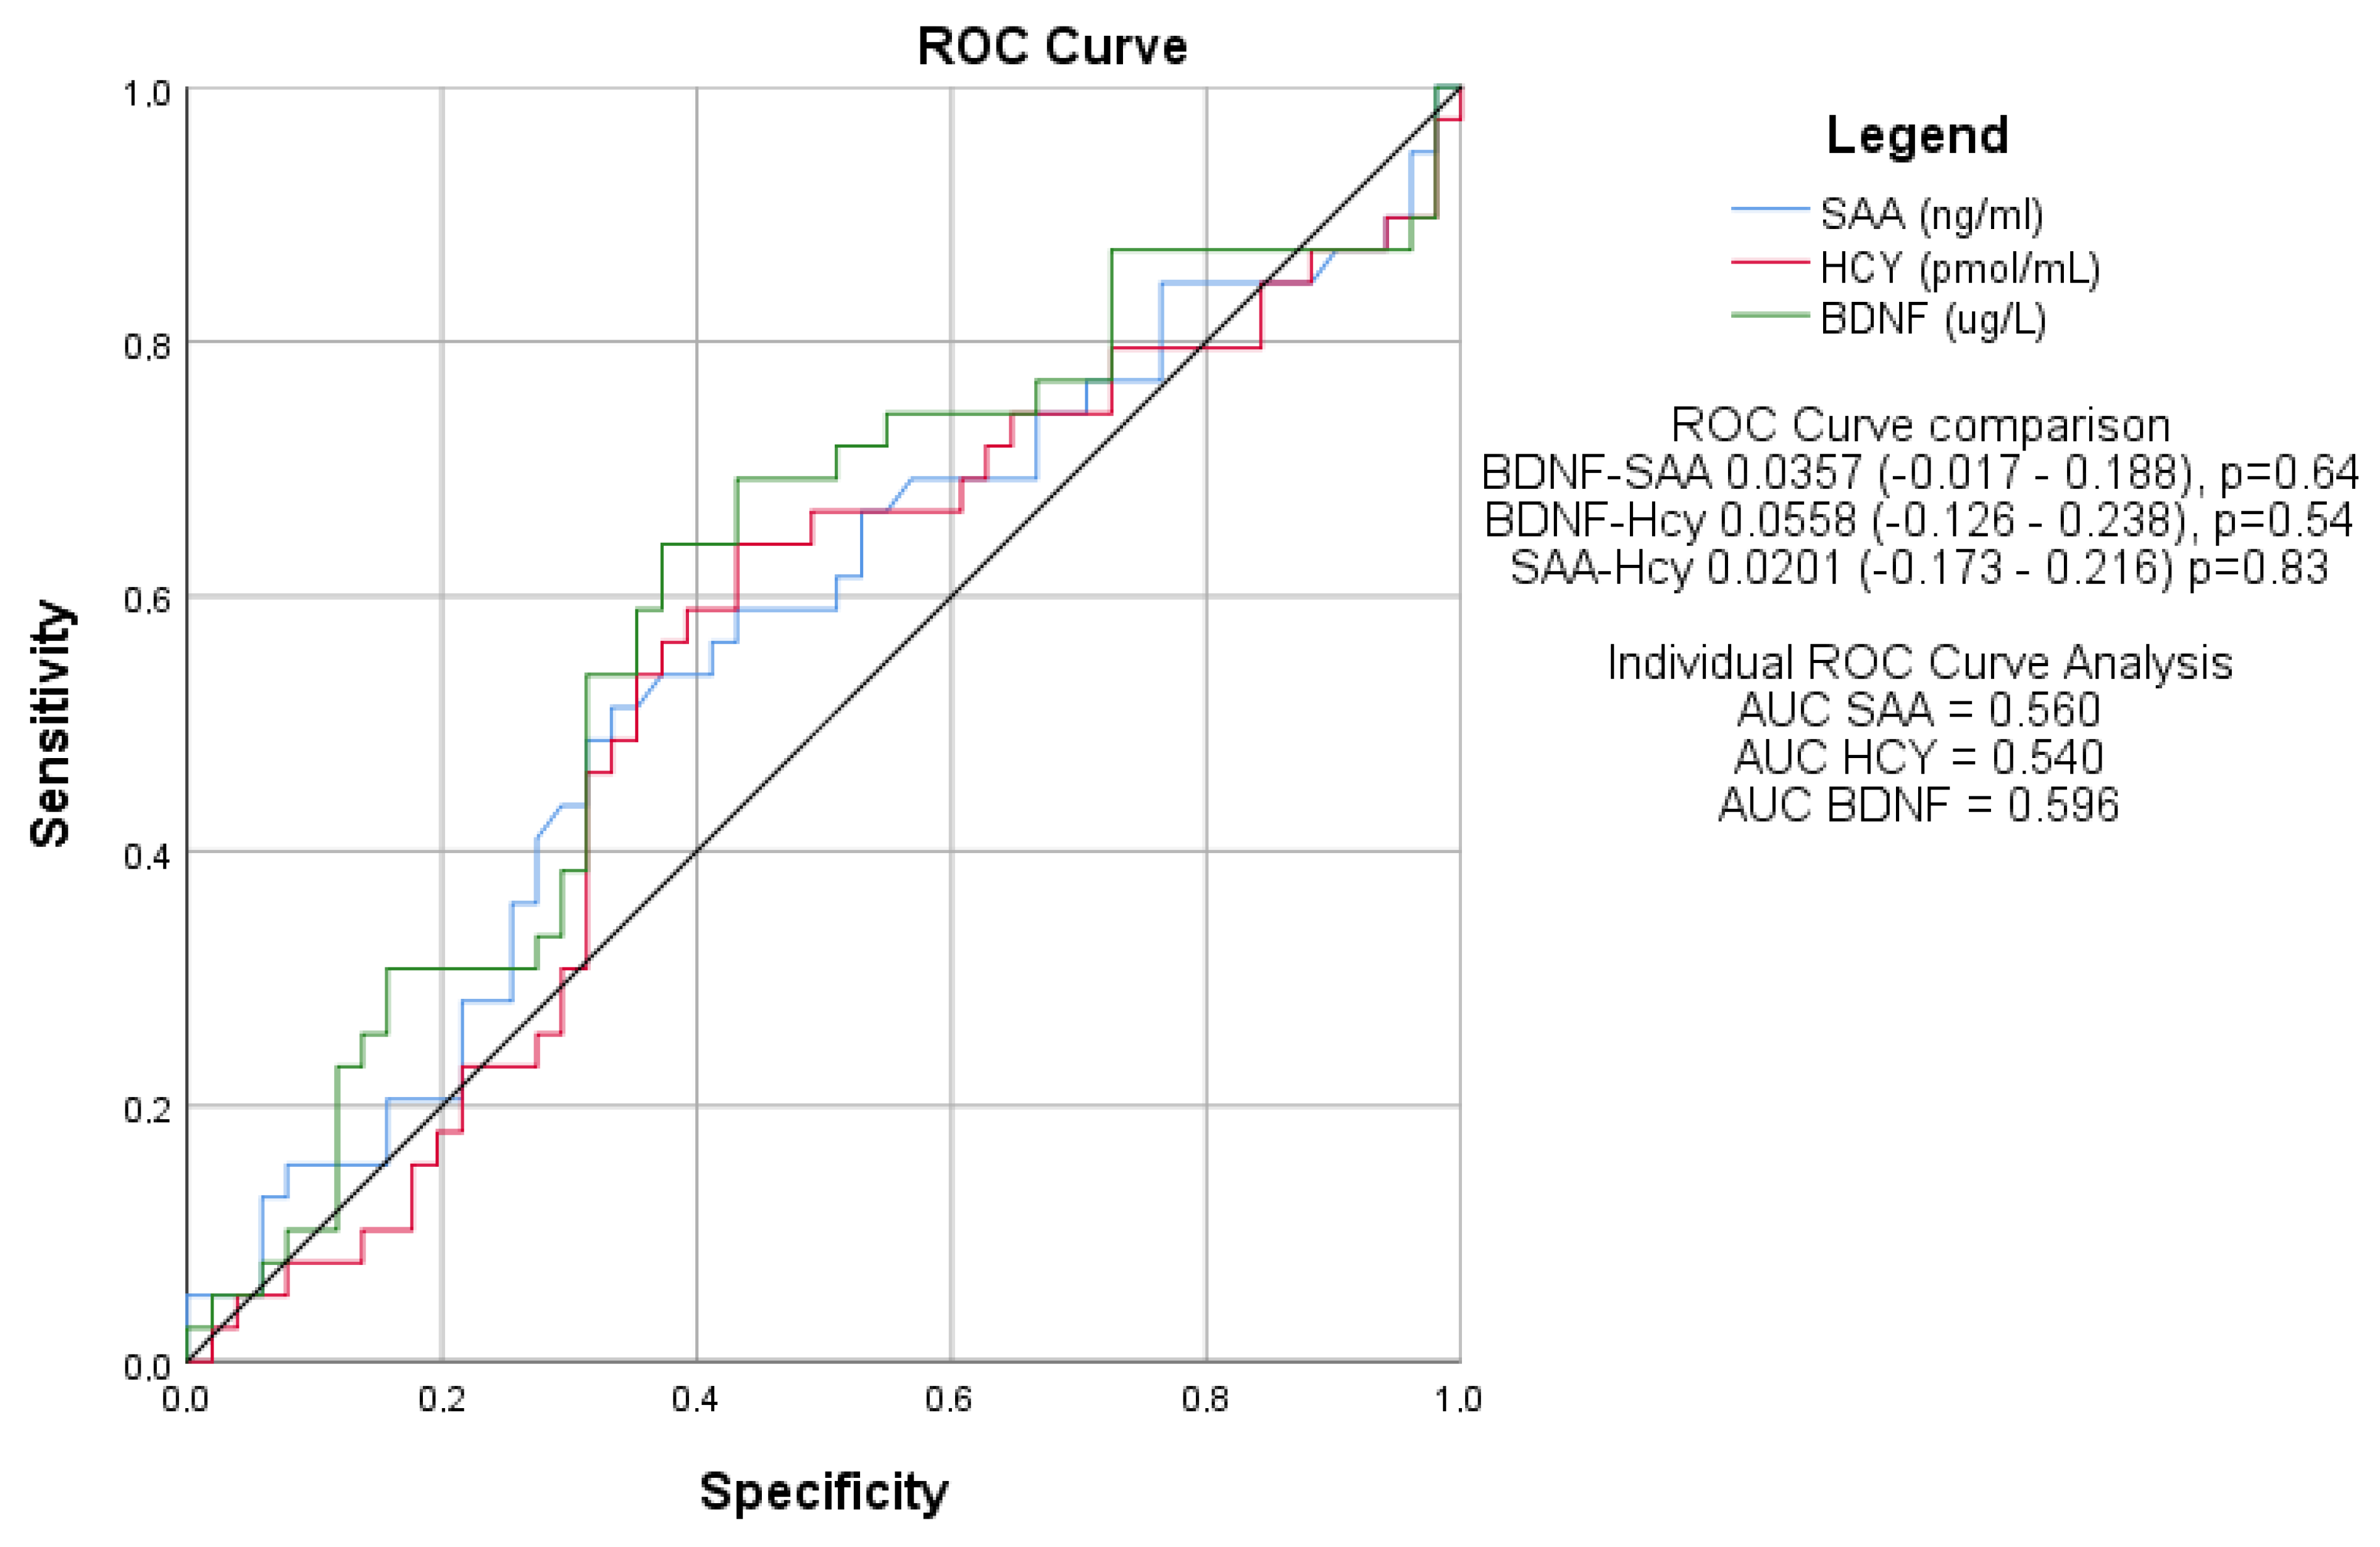
3.7. Diagnostic Performance of Serum Biomarkers for Cognitive Dysfunction
4. Discussions
5. Conclusions
Author Contributions
Funding
Institutional Review Board Statement
Informed Consent Statement
Data Availability Statement
Acknowledgments
Conflicts of Interest
Abbreviations
References
- Maaser, C.; Sturm, A.; Vavricka, S.R.; Kucharzik, T.; Fiorino, G.; Annese, V.; Calabrese, E.; Baumgart, D.C.; Bettenworth, D.; Borralho Nunes, P.; et al. ECCO-ESGAR Guideline for Diagnostic Assessment in IBD part 1: Initial diagnosis, monitoring of known IBD, detection of complications. J. Crohn’s Colitis 2019, 13, 144–164. [Google Scholar] [CrossRef]
- Sturm, A.; Maaser, C.; Calabrese, E.; Annese, V.; Fiorino, G.; Kucharzik, T.; Vavricka, S.R.; Verstockt, B.; Van Rheenen, P.; Tolan, D.; et al. ECCO-ESGAR Guideline for Diagnostic Assessment in IBD part 2: IBD scores and general principles and technical aspects. J. Crohn’s Colitis 2019, 13, 273–284. [Google Scholar] [CrossRef]
- Chavarría, C.; Casanova, M.J.; Chaparro, M.; Acosta, M.B.-D.; Ezquiaga, E.; Bujanda, L.; Rivero, M.; Argüelles-Arias, F.; Martín-Arranz, M.D.; Martínez-Montiel, M.P.; et al. Prevalence and factors associated with fatigue in patients with inflammatory bowel disease: A multicentre study. J. Crohn’s Colitis 2019, 13, 996–1002. [Google Scholar] [CrossRef]
- Chen, Y.-X.; Liang, N.; Li, X.-L.; Yang, S.-H.; Wang, Y.-P.; Shi, N.-N. Diagnosis and treatment for mild cognitive impairment: A systematic review of clinical practice guidelines and consensus statements. Front. Neurol. 2021, 12, 719849. [Google Scholar] [CrossRef]
- Shen, X.-N.; Niu, L.-D.; Wang, Y.-J.; Cao, X.-P.; Liu, Q.; Tan, L.; Zhang, C.; Yu, J.-T. Inflammatory markers in Alzheimer’s disease and mild cognitive impairment: A meta-analysis and systematic review of 170 studies. J. Neurol. Neurosurg. Psychiatry 2019, 90, 590–598. [Google Scholar] [CrossRef]
- Sharma, N.; Dhiman, S.; Bodh, V.; Sharma, D.; Sharma, R.; Sharma, S.; Sharma, B. Cognitive dysfunction in ulcerative colitis patients in remission and its comparison with patients with irritable bowel syndrome and healthy controls. Indian J. Gastroenterol. 2021, 40, 169–175. [Google Scholar] [CrossRef]
- Chen, P.-H.; Cheng, S.-J.; Lin, H.-C.; Lee, C.-Y.; Chou, C.-H. Risk factors for the progression of mild cognitive impairment in different types of neurodegenerative disorders. Behav. Neurol. 2018, 2018, 6929732–6929738. [Google Scholar] [CrossRef]
- Wang, D.; Zhang, X.; Du, H. Inflammatory bowel disease: A potential pathogenic factor of Alzheimer’s disease. Prog. Neuro-Psychopharmacol. Biol. Psychiatry 2022, 119, 110610. [Google Scholar] [CrossRef]
- Sarb, O.-F.; Sarb, A.-D.; Iacobescu, M.; Vlad, I.-M.; Milaciu, M.-V.; Ciurmarnean, L.; Vacaras, V.; Tantau, A.-I. From Gut to Brain: Uncovering Potential Serum Biomarkers Connecting Inflammatory Bowel Diseases to Neurodegenerative Diseases. Int. J. Mol. Sci. 2024, 25, 5676. [Google Scholar] [CrossRef]
- Ma, F.; Wu, T.; Zhao, J.; Ji, L.; Song, A.; Zhang, M.; Huang, G. Plasma homocysteine and serum folate and vitamin B(12) levels in mild cognitive impairment and Alzheimer’s disease: A case-control study. Nutrients 2017, 9, 725. [Google Scholar] [CrossRef]
- Lauriola, M.; D’onofrio, G.; Ciccone, F.; Germano, C.; Cascavilla, L.; Paris, F.; Greco, A. Relationship of homocysteine plasma levels with mild cognitive impairment, Alzheimer’s disease, vascular dementia, psychobehavioral, and functional complications. J. Alzheimer’s Dis. 2021, 82, 235–248. [Google Scholar] [CrossRef]
- Jack, C.R.; Wiste, H.J.; Therneau, T.M.; Weigand, S.D.; Knopman, D.S.; Mielke, M.M.; Petersen, R.C. Associations of amyloid, tau, and neurodegeneration biomarker profiles with rates of memory decline among individuals without dementia. JAMA 2019, 321, 2316–2325. [Google Scholar] [CrossRef]
- Serrano-Pozo, A.; Das, S.; Hyman, B.T. APOE and Alzheimer’s disease: Advances in genetics, pathophysiology, and therapeutic approaches. Lancet Neurol. 2021, 20, 68–80. [Google Scholar] [CrossRef] [PubMed]
- Tran, S.M.-S.; Mohajeri, M.H. The role of gut bacterial metabolites in brain development, aging and disease. Nutrients 2021, 13, 732. [Google Scholar] [CrossRef] [PubMed]
- Kim, B.Y.; Lee, S.H.; Graham, P.L.; Angelucci, F.; Lucia, A.; Pareja-Galeano, H.; Leyhe, T.; Turana, Y.; Lee, I.R.; Yoon, J.H.; et al. Peripheral brain-derived neurotrophic factor levels in Alzheimer’s disease and mild cognitive impairment: A comprehensive systematic review and meta-analysis. Mol. Neurobiol. 2017, 54, 7297–7311. [Google Scholar] [CrossRef]
- Miranda, M.; Morici, J.F.; Zanoni, M.B.; Bekinschtein, P. Brain-derived neurotrophic factor: A key molecule for memory in the healthy and the pathological brain. Front. Cell. Neurosci. 2019, 13, 363. [Google Scholar] [CrossRef]
- Polyakova, M.; Mueller, K.; Arelin, K.; Lampe, L.; Rodriguez, F.S.; Luck, T.; Kratzsch, J.; Hoffmann, K.-T.; Riedel-Heller, S.; Villringer, A.; et al. Increased serum NSE and S100B indicate neuronal and glial alterations in subjects under 71 years with mild neurocognitive disorder/mild cognitive impairment. Front. Cell. Neurosci. 2022, 16, 788150. [Google Scholar] [CrossRef]
- Sarb, O.F.; Vacaras, V.; Sarb, A.; Iacobescu, M.; Tantau, A.-I. Cognitive Dysfunction and Affective Mood Disorder Screening in Patients With Chronic Inflammatory Bowel Disease: Protocol for a Prospective Case-Control Study. JMIR Res. Protoc. 2023, 12, e50546. [Google Scholar] [CrossRef] [PubMed] [PubMed Central]
- Buchholz, I.; Janssen, M.F.; Kohlmann, T.; Feng, Y.-S. A systematic review of studies comparing the measurement properties of the three-level and five-level versions of the EQ-5D. PharmacoEconomics 2018, 36, 645–661. [Google Scholar] [CrossRef]
- Janssen, M.F.; Bonsel, G.J.; Luo, N. Is EQ-5D-5L Better Than EQ-5D-3L? A Head-to-Head comparison of descriptive systems and value sets from seven countries/regions. PharmacoEconomics 2018, 36, 675–697. [Google Scholar] [CrossRef]
- R Core Team. R: A Language and Environment for Statistical Computing [Internet]; R Foundation for Statistical Computing: Vienna, Austria, 2024. [Google Scholar]
- Hopkins, C.W.; Powell, N.; Norton, C.; Dumbrill, J.L.; Hayee, B.; Moulton, C.D. Cognitive Impairment in Adult Inflammatory Bowel Disease: A Systematic Review and Meta-Analysis. J. Acad. Consult. Liaison. Psychiatry 2021, 62, 387–403. [Google Scholar] [CrossRef] [PubMed]
- Bartocci, B.; Buono, A.D.; Gabbiadini, R.; Busacca, A.; Quadarella, A.; Repici, A.; Mencaglia, E.; Gasparini, L.; Armuzzi, A. Mental Illnesses in Inflammatory Bowel Diseases: Mens sana in corpore sano. Medicina 2023, 59, 682. [Google Scholar] [CrossRef] [PubMed]
- Faisal, M.; Vedin, T.; Edelhamre, M.; Forberg, J.L. Diagnostic performance of biomarker S100B and guideline adherence in routine care of mild head trauma. Scand. J. Trauma, Resusc. Emerg. Med. 2023, 31, 3. [Google Scholar] [CrossRef] [PubMed]
- Barberio, B.; Zamani, M.; Black, C.J.; Savarino, E.V.; Ford, A.C. Prevalence of symptoms of anxiety and depression in patients with inflammatory bowel disease: A systematic review and meta-analysis. Lancet Gastroenterol. Hepatol. 2021, 6, 359–370. [Google Scholar] [CrossRef] [PubMed]
- Luo, J.; Xu, Z.; Noordam, R.; van Heemst, D.; Li-Gao, R. Depression and Inflammatory Bowel Disease: A Bidirectional Two-sample Mendelian Randomization Study. J. Crohn’s Colitis 2022, 16, 633–642. [Google Scholar] [CrossRef] [PubMed]
- Rada, C.; Gheonea, D.; Ţieranu, C.G.; Popa, D.E. Diagnosis and Psychotherapeutic Needs by Early Maladaptive Schemas in Patients With Inflammatory Bowel Disease. Front. Psychol. 2022, 12, 807107. [Google Scholar] [CrossRef] [PubMed] [PubMed Central]

| Biomarker | ELISA Kit | Kit Performance |
|---|---|---|
| HCY | AssayGenie, Dublin, Ireland, HUFI04768 | Detection range = 7.813–500 pmol/mL; Sensitivity < 4.688 pmol/mL Intra-assay precision CV < 8%; Inter-assay precision CV < 10% |
| BDNF | ABclonal, Woburn, MA, USA, RK00074 | Detection range = 23.4–1500 pg/mL Sensitivity < 6.3 pg/mL Intra-assay precision CV < 10%; Inter-assay precision CV < 15% |
| SAA | ABclonal, Woburn, MA, USA, RK04228 | Detection range = 0.156–10 ng/mL; Sensitivity < 0.071 ng/mL Intra-assay precision CV ≤ 10%; Inter-assay precision CV ≤ 15% |
| S100B | ABclonal, Woburn, MA, USA, RK02234 | Detection range = 46.9–3000 pg/mL; Sensitivity < 23.5 pg/mL Intra-assay precision CV ≤ 10%; Inter-assay precision CV ≤ 15%) |
| Group | CD Group (n = 21) | UC Group (n = 34) | CG (n = 35) | p (CD-UC, CD-CG, UC-CG) |
|---|---|---|---|---|
| Age (years), median (IQR) | 39 (29–49) | 44.5 (32.75–60.75) | 39 (32.5–59) | 0.528 (0.724, 0.568, 0.665) |
| Education (years), median (IQR) | 15 (12–16) | 15 (12–16) | 15 (12–18) | 0.376 (0.759, 0.615, 0.347) |
| Smoking index/year, median (IQR) | 0 (0–6) | 0 (0–0) | 0 (0–0) | 0.312 (0.355, 0.39, 0.553) |
| Body-mass index (BMI) (kg/m2), median (IQR) | 24.4 (22.6–26.8) | 24.85 (23.13–27.95) | 23.9 (21.45–27.95) | 0.789 (0.896, 0.829, 1) |
| Gender (Female), n (%) | 10 (47.62) | 14 (41.18) | 25 (71.43) | 0.032 (0.64, 0.07, 0.01) |
| Living environment (Rural), n (%) | 2 (9.52) | 9 (26.47) | 5 (14.29) | 0.22 (0.12, 0.6, 0.2) |
| Physical activity (No), n (%) | 15 (71.43) | 17 (50) | 29 (82.86) | 0.013 (0.11, 0.31, 0.001) |
| ADL, median (IQR) | 6 (6) | 6 (6) | 6 (6) | 1 (1, 1, 1) |
| IADL, median (IQR) | 8 (8) | 8 (8) | 8 (8) | 1 (1, 1, 1) |
| Treatment | CD (n = 21) | UC (n = 34) | p |
|---|---|---|---|
| Standard therapy, n (%) | 8 (38%) | 15 (44.1%) | 0.42 |
| Biologic, n (%) | 12 (57%) | 16 (47%) | 0.2 |
| None, n (%) | 1 (4.7%) | 3 (8.8%) | 0.63 |
| Group | CD Group (n = 21) | UC Group (n = 34) | CG (n =35) | p (CD-UC, CD-CG, UC-CG) |
|---|---|---|---|---|
| MOCA test-baseline, median (IQR) | 23 (18–28) | 26 (22–28) | 28 (25–30) | 0.003 (0.301, 0.004, 0.017) |
| MIS-baseline, median (IQR) | 12 (8–14) | 13 (9.25–14) | 14 (12.5–15) | 0.015 (0.43, 0.022, 0.038) |
| FDS, median (IQR) | 10 (9–12) | 10 (8–12) | 10 (9.5–11) | 0.968 (1, 0.855, 1) |
| BDS, median (IQR) | 5 (4–8) | 6 (4–6.75) | 6 (5–8) | 0.6 (0.822, 1, 0.549) |
| Trail making A (seconds), median (IQR) | 43 (33–59.5) | 38.85 (31.05–59) | 35 (26–42) | 0.186 (0.443, 0.215, 0.31) |
| Trail making B (seconds), median (IQR) | 107 (72–155) | 100 (54.33–154.25) | 72 (65–80.5) | 0.113 (0.269, 0.106, 0.339) |
| DSST, median (IQR) | 43 (28.5–48.5) | 40 (33–48.25) | 46 (39–51) | 0.374 (0.658, 0.186, 0.322) |
| Group | CD (n = 21) | UC (n = 34) | CG (n = 35) | p-Value (CD-UC, CD-CG, UC-CG) |
|---|---|---|---|---|
| Cognitive dysfunction (total), n (%) | 14 (66.67) | 16 (47.06) | 9 (25.71) | 0.006 (0.15, 0.003, 0.06) |
| Mild cognitive impairment, n (%) | 9 (42.86) | 13 (38.24) | 9 (25.71) | 0.35 (0.73, 0.18, 0.26) |
| Moderate cognitive impairment, n (%) | 5 (23.81) | 3 (8.82) | 0 (0) | 0.01 (0.23, 0005, 0.11) |
| Normal, n (%) | 7 (33.33) | 18 (52.94) | 26 (74.29) | 0.01 (0.15, 0.003, 0.06) |
| Group | CD Group (n = 21) | UC Group (n = 34) | CG (n = 35) | p (CD-UC, CD-CG, UC-CG) |
|---|---|---|---|---|
| Stress score, median (IQR) | 6 (4–10) | 6 (2–13.5) | 8 (4–13) | 0.639 (0.884, 0.608, 1) |
| Anxiety score, median (IQR) | 6 (0–8) | 6 (0–8) | 8 (2–10) | 0.541 (0.834, 0.588, 0.821) |
| Depression score, median (IQR) | 2 (0–8) | 2 (0–6) | 4 (0–8) | 0.813 (0.716, 1, 1) |
| Group | CD Group (n = 21) | UC Group (n = 34) | CG (n = 35) | p (CD-UC, CD-CG, UC-CG) |
|---|---|---|---|---|
| SAA (ng/mL), median (IQR) | 92 (51–175) | 259.5 (150.75–629) | 136 (62.5–210) | 0.003 (0.009, 0.561, 0.007) |
| Hcy (pmol/mL), median (IQR) | 2802 (2028–5311) | 2500.5 (1639.5–6045.5) | 2287 (2012–3172.5) | 0.369 (0.587, 0.501, 0.443) |
| BDNF (pg/mL), median (IQR) | 7437 (2570–11,785) | 4771 (2289.25–7552.25) | 10,735 (9160.5–12,602.5) | <0.001 (0.071, 0.035, <0.001) |
| Group | CD Group (n = 21) | UC Group (n = 34) | CG (n = 35) | p (CD-UC, CD-CG, UC-CG) |
|---|---|---|---|---|
| MOCA- 1 year visit, median (IQR) | 23 (18–27) | 25.5 (21–28) | 27 (23.5–30) | 0.012 (0.388, 0.016, 0.035) |
| MIS- 1 year visit, median (IQR) | 10 (7–13) | 12 (9–14) | 14 (11–15) | 0.033 (0.67, 0.069, 0.041) |
| Group | MOCA Test- Baseline, Median (IQR) | MOCA- 1 Year Visit, Median (IQR) | p | MIS- Baseline, Median (IQR) | MIS- 1 Year Visit, Median (IQR) | p |
|---|---|---|---|---|---|---|
| CD Group (n = 21) | 23 (18–28) | 23 (18–27) | 0.9681 | 12 (8–14) | 10 (7–13) | 0.764 |
| UC Group (n = 34) | 26 (22–28) | 25.5 (21–28) | 0.741 | 13 (9.25–14) | 12 (9–14) | 0.483 |
| CG (n = 35) | 28 (25–30) | 27 (23.5–30) | 0.771 | 14 (12.5–15) | 14 (11–15) | 0.440 |
| Characteristic | B Adjusted | (95% CI) | p Value |
|---|---|---|---|
| Disease (CD vs. CG) | −0.041 | (−0.10–0.96) | 0.916 |
| Disease (UC vs. CG) | 0.932 | (0.29–1.57) | 0.005 |
| Age | 0.001 | (−0.016–0.018) | 0.889 |
| Biologic therapy | −0.012 | (−0.665–0.641) | 0.971 |
| BMI (kg/m2) | −0.014 | (−0.06–0.038) | 0.579 |
| Sleep hours/24 h | 0.03 | (−0.255–0.333) | 0.811 |
| Physical activity | −0.23 | (−0.79–0.343) | 0.433 |
| Characteristic | B Adjusted | (95% CI) | p |
|---|---|---|---|
| Disease (CD vs. CG) | 0.43 | (−0.394–0.481) | 0.113 |
| Disease (UC vs. CG) | −0.077 | (−0.446–0.291) | 0.741 |
| Age | 0.001 | (−0.009–0.011) | 0.812 |
| Biologic therapy | 0.331 | (−0.045–0.707) | 0.084 |
| BMI (kg/m2) | 0.019 | (−0.011–0.049) | 0.215 |
| Sleep hours/24 h | −0.08 | (−0.249–0.09) | 0.352 |
| Physical activity | −0.107 | (−0.434–0.221) | 0.519 |
| Characteristic | B Adjusted | (95% CI) | p |
|---|---|---|---|
| Disease (CD vs. CG) | −0.631 | (−1.13–−0.125) | 0.015 |
| Disease (UC vs. CG) | −0.897 | (−1.32–−0.471) | <0.001 |
| Age | 0.003 | (−0.009–0.014) | 0.642 |
| Biologic therapy | 0.311 | (−0.123–0.746) | 0.158 |
| BMI (kg/m2) | 0.03 | (0.005–0.064) | 0.092 |
| Sleep hours/24 h | −0.085 | (−0.28–0.111) | 0.391 |
| Physical activity | −0.144 | (−0.523–0.235) | 0.451 |
Disclaimer/Publisher’s Note: The statements, opinions and data contained in all publications are solely those of the individual author(s) and contributor(s) and not of MDPI and/or the editor(s). MDPI and/or the editor(s) disclaim responsibility for any injury to people or property resulting from any ideas, methods, instructions or products referred to in the content. |
© 2025 by the authors. Licensee MDPI, Basel, Switzerland. This article is an open access article distributed under the terms and conditions of the Creative Commons Attribution (CC BY) license (https://creativecommons.org/licenses/by/4.0/).
Share and Cite
Sârb, O.-F.; Iacobescu, M.; Soporan, A.-M.; Mureșan, X.-M.; Sârb, A.-D.; Stănciulescu, R.; Leucuța, C.-D.; Tanțău, A.-I. Brain-Gut Interplay: Cognitive Performance and Biomarker Correlations in IBD Patients. J. Clin. Med. 2025, 14, 2293. https://doi.org/10.3390/jcm14072293
Sârb O-F, Iacobescu M, Soporan A-M, Mureșan X-M, Sârb A-D, Stănciulescu R, Leucuța C-D, Tanțău A-I. Brain-Gut Interplay: Cognitive Performance and Biomarker Correlations in IBD Patients. Journal of Clinical Medicine. 2025; 14(7):2293. https://doi.org/10.3390/jcm14072293
Chicago/Turabian StyleSârb, Oliviu-Florențiu, Maria Iacobescu, Andreea-Maria Soporan, Ximena-Maria Mureșan, Adriana-Daniela Sârb, Raluca Stănciulescu, Corneliu-Daniel Leucuța, and Alina-Ioana Tanțău. 2025. "Brain-Gut Interplay: Cognitive Performance and Biomarker Correlations in IBD Patients" Journal of Clinical Medicine 14, no. 7: 2293. https://doi.org/10.3390/jcm14072293
APA StyleSârb, O.-F., Iacobescu, M., Soporan, A.-M., Mureșan, X.-M., Sârb, A.-D., Stănciulescu, R., Leucuța, C.-D., & Tanțău, A.-I. (2025). Brain-Gut Interplay: Cognitive Performance and Biomarker Correlations in IBD Patients. Journal of Clinical Medicine, 14(7), 2293. https://doi.org/10.3390/jcm14072293