
Non-Invasive Cardiac Output Monitoring with Electrical Cardiometry During Laparoscopic Cholecystectomy Surgery, a Cross-Sectional Study

 ,
,  , ,
, ,
Abstract
1. Introduction
2. Methods
2.1. Sample Size Calculation
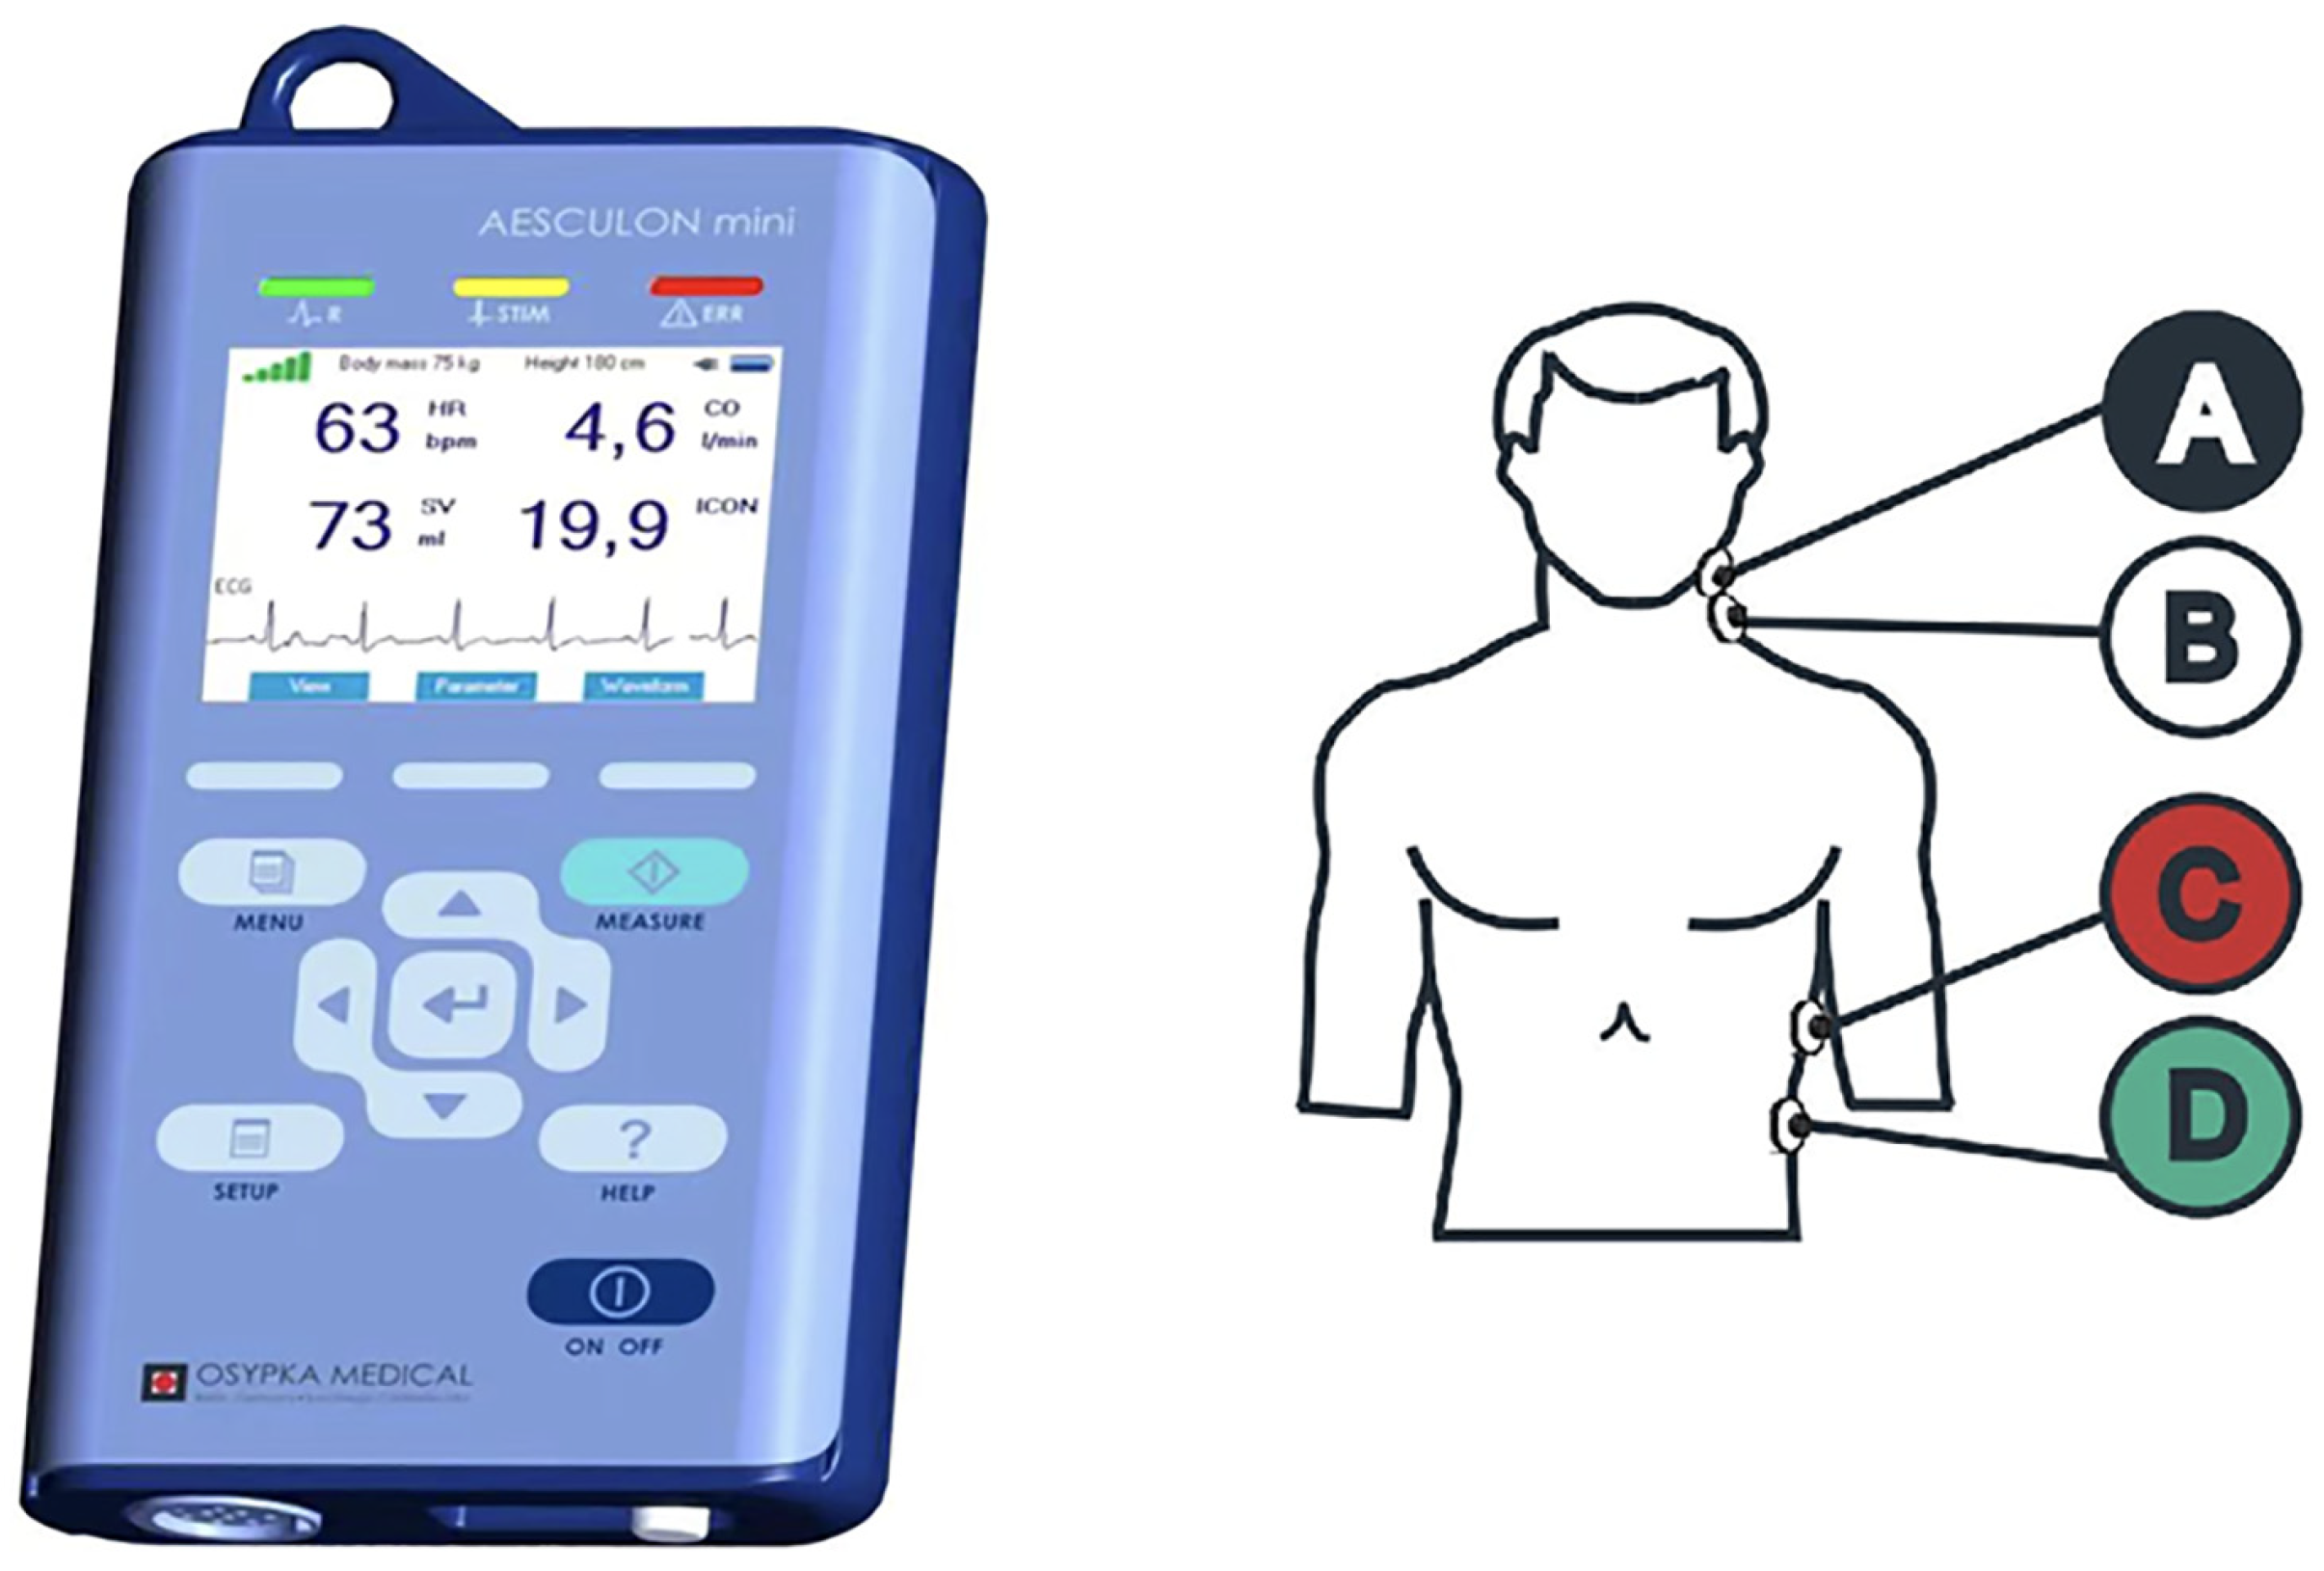
2.2. Electric Cardiometry (EC)
2.3. Anesthetic Technique
2.4. Retrieved Data and Measurement Times
2.5. Statistical Methodology
3. Results
3.1. Main Findings
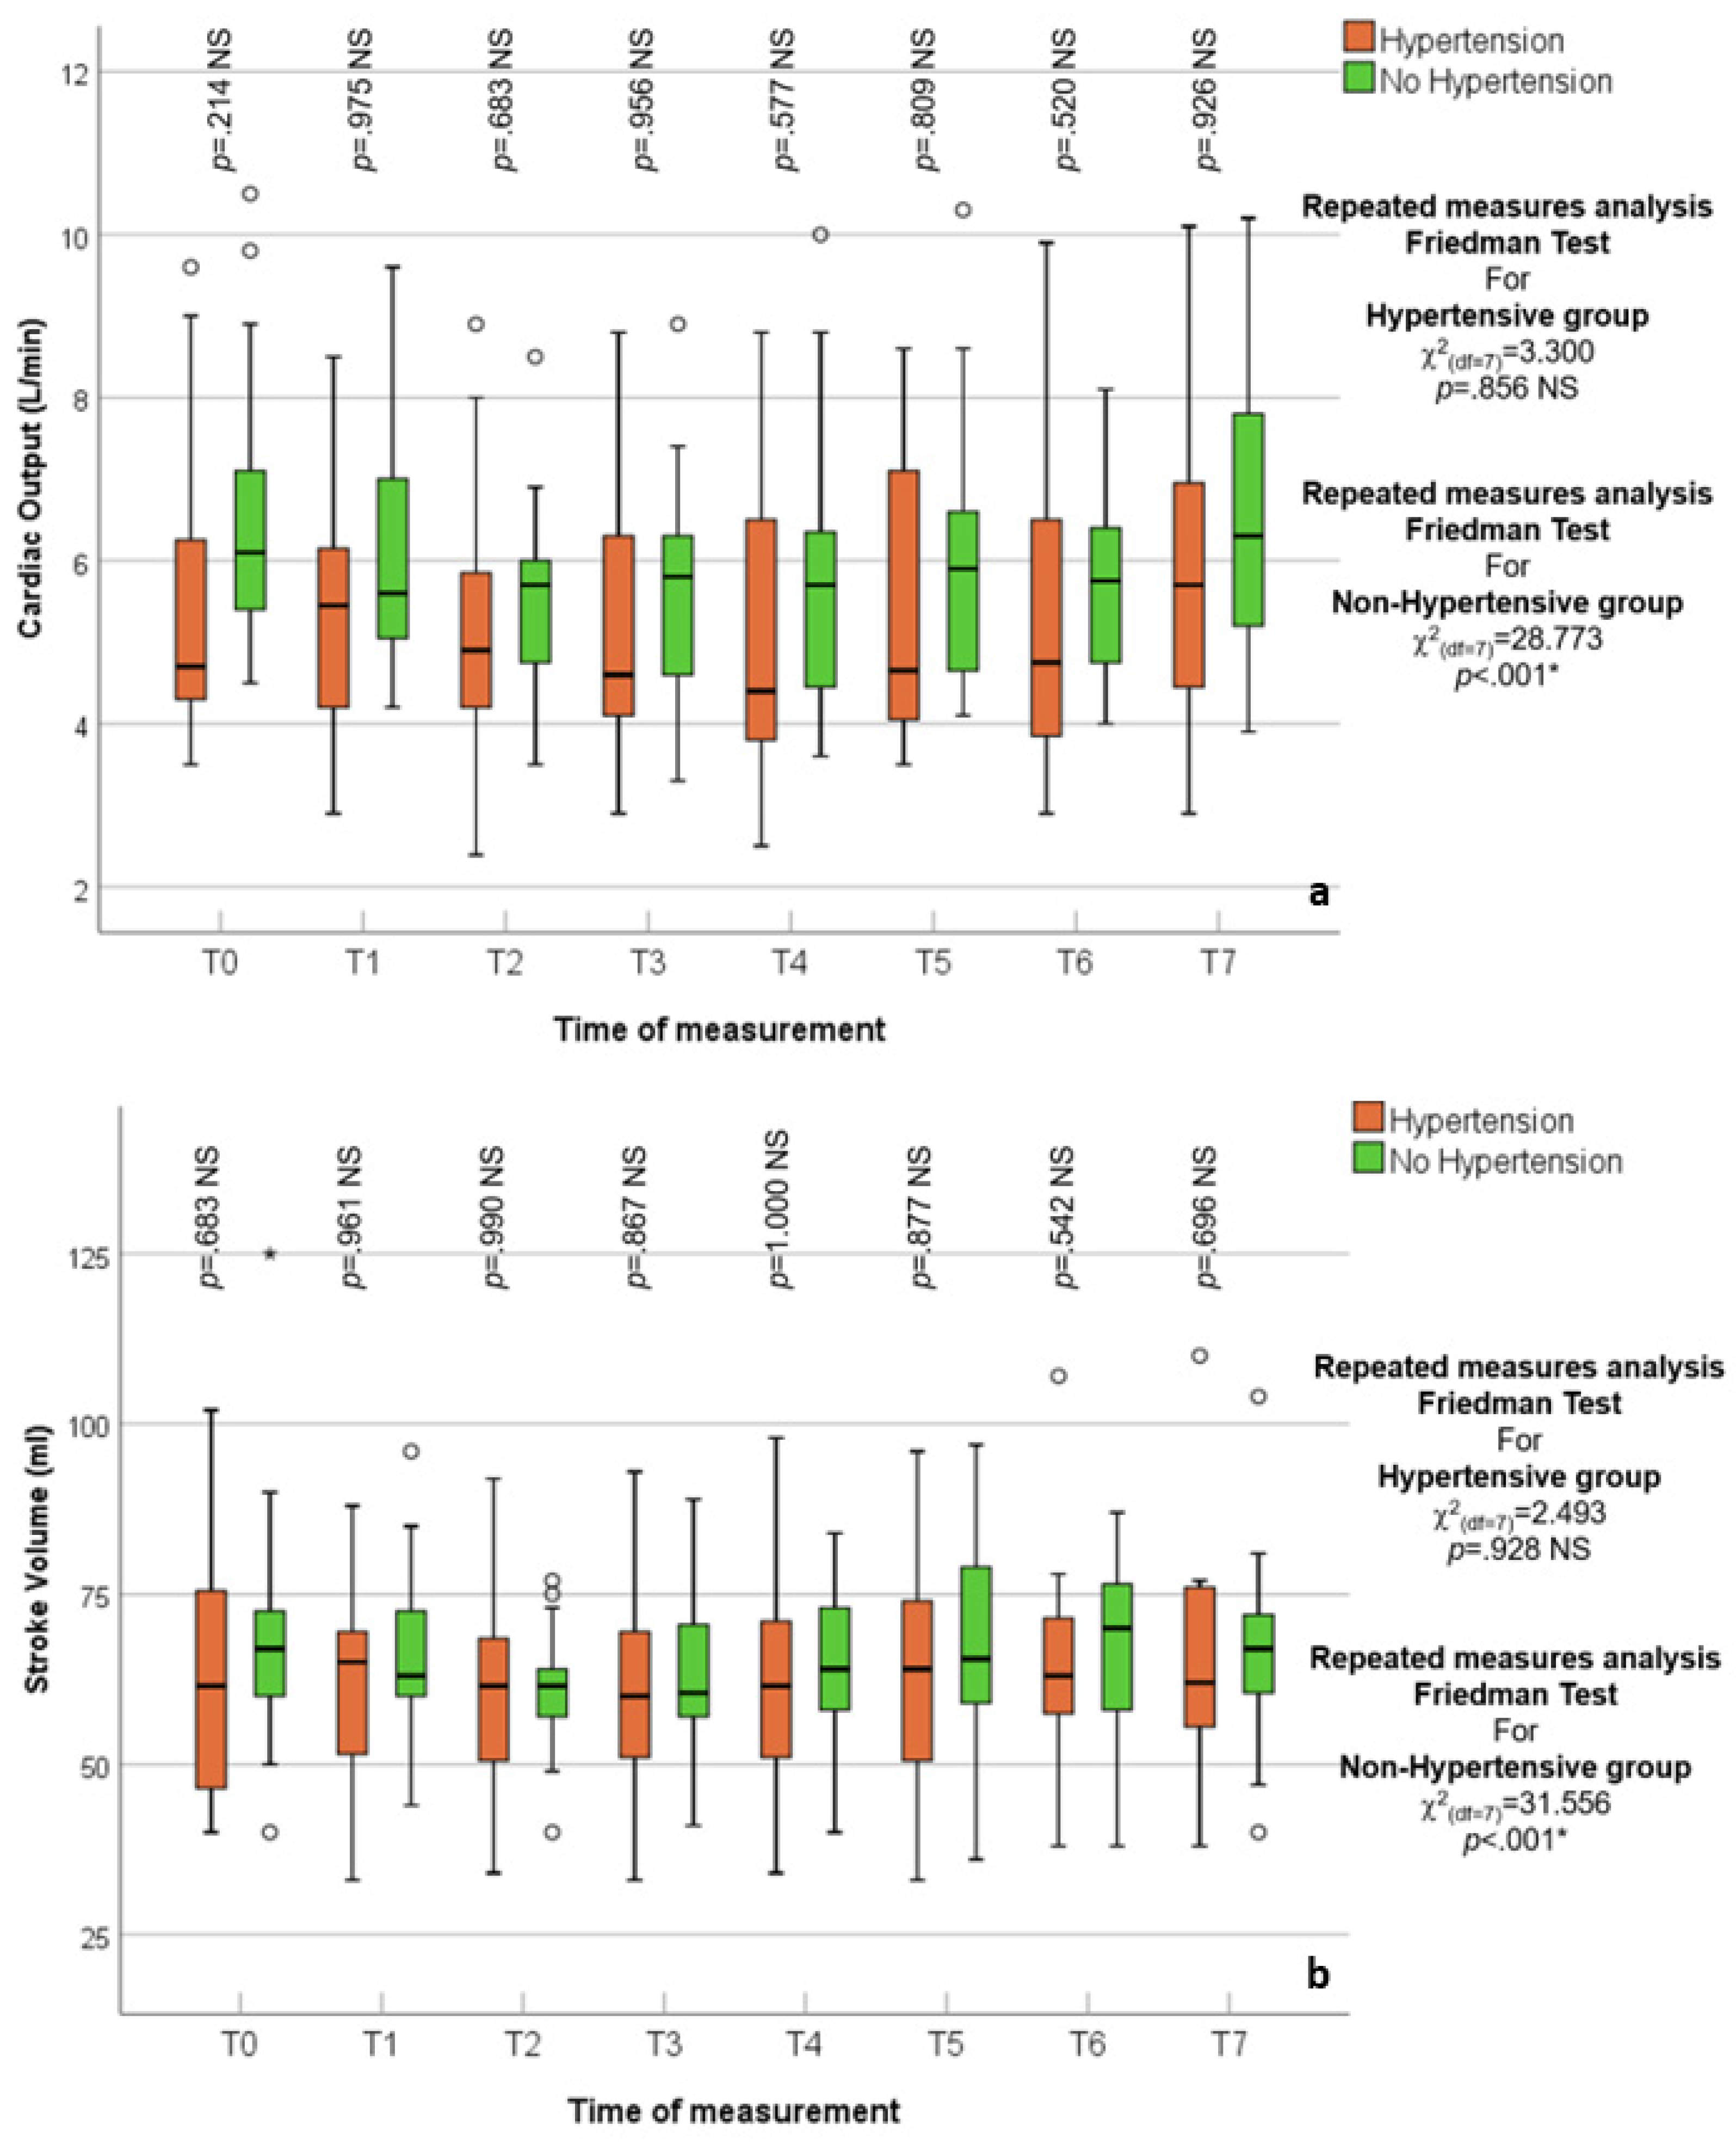
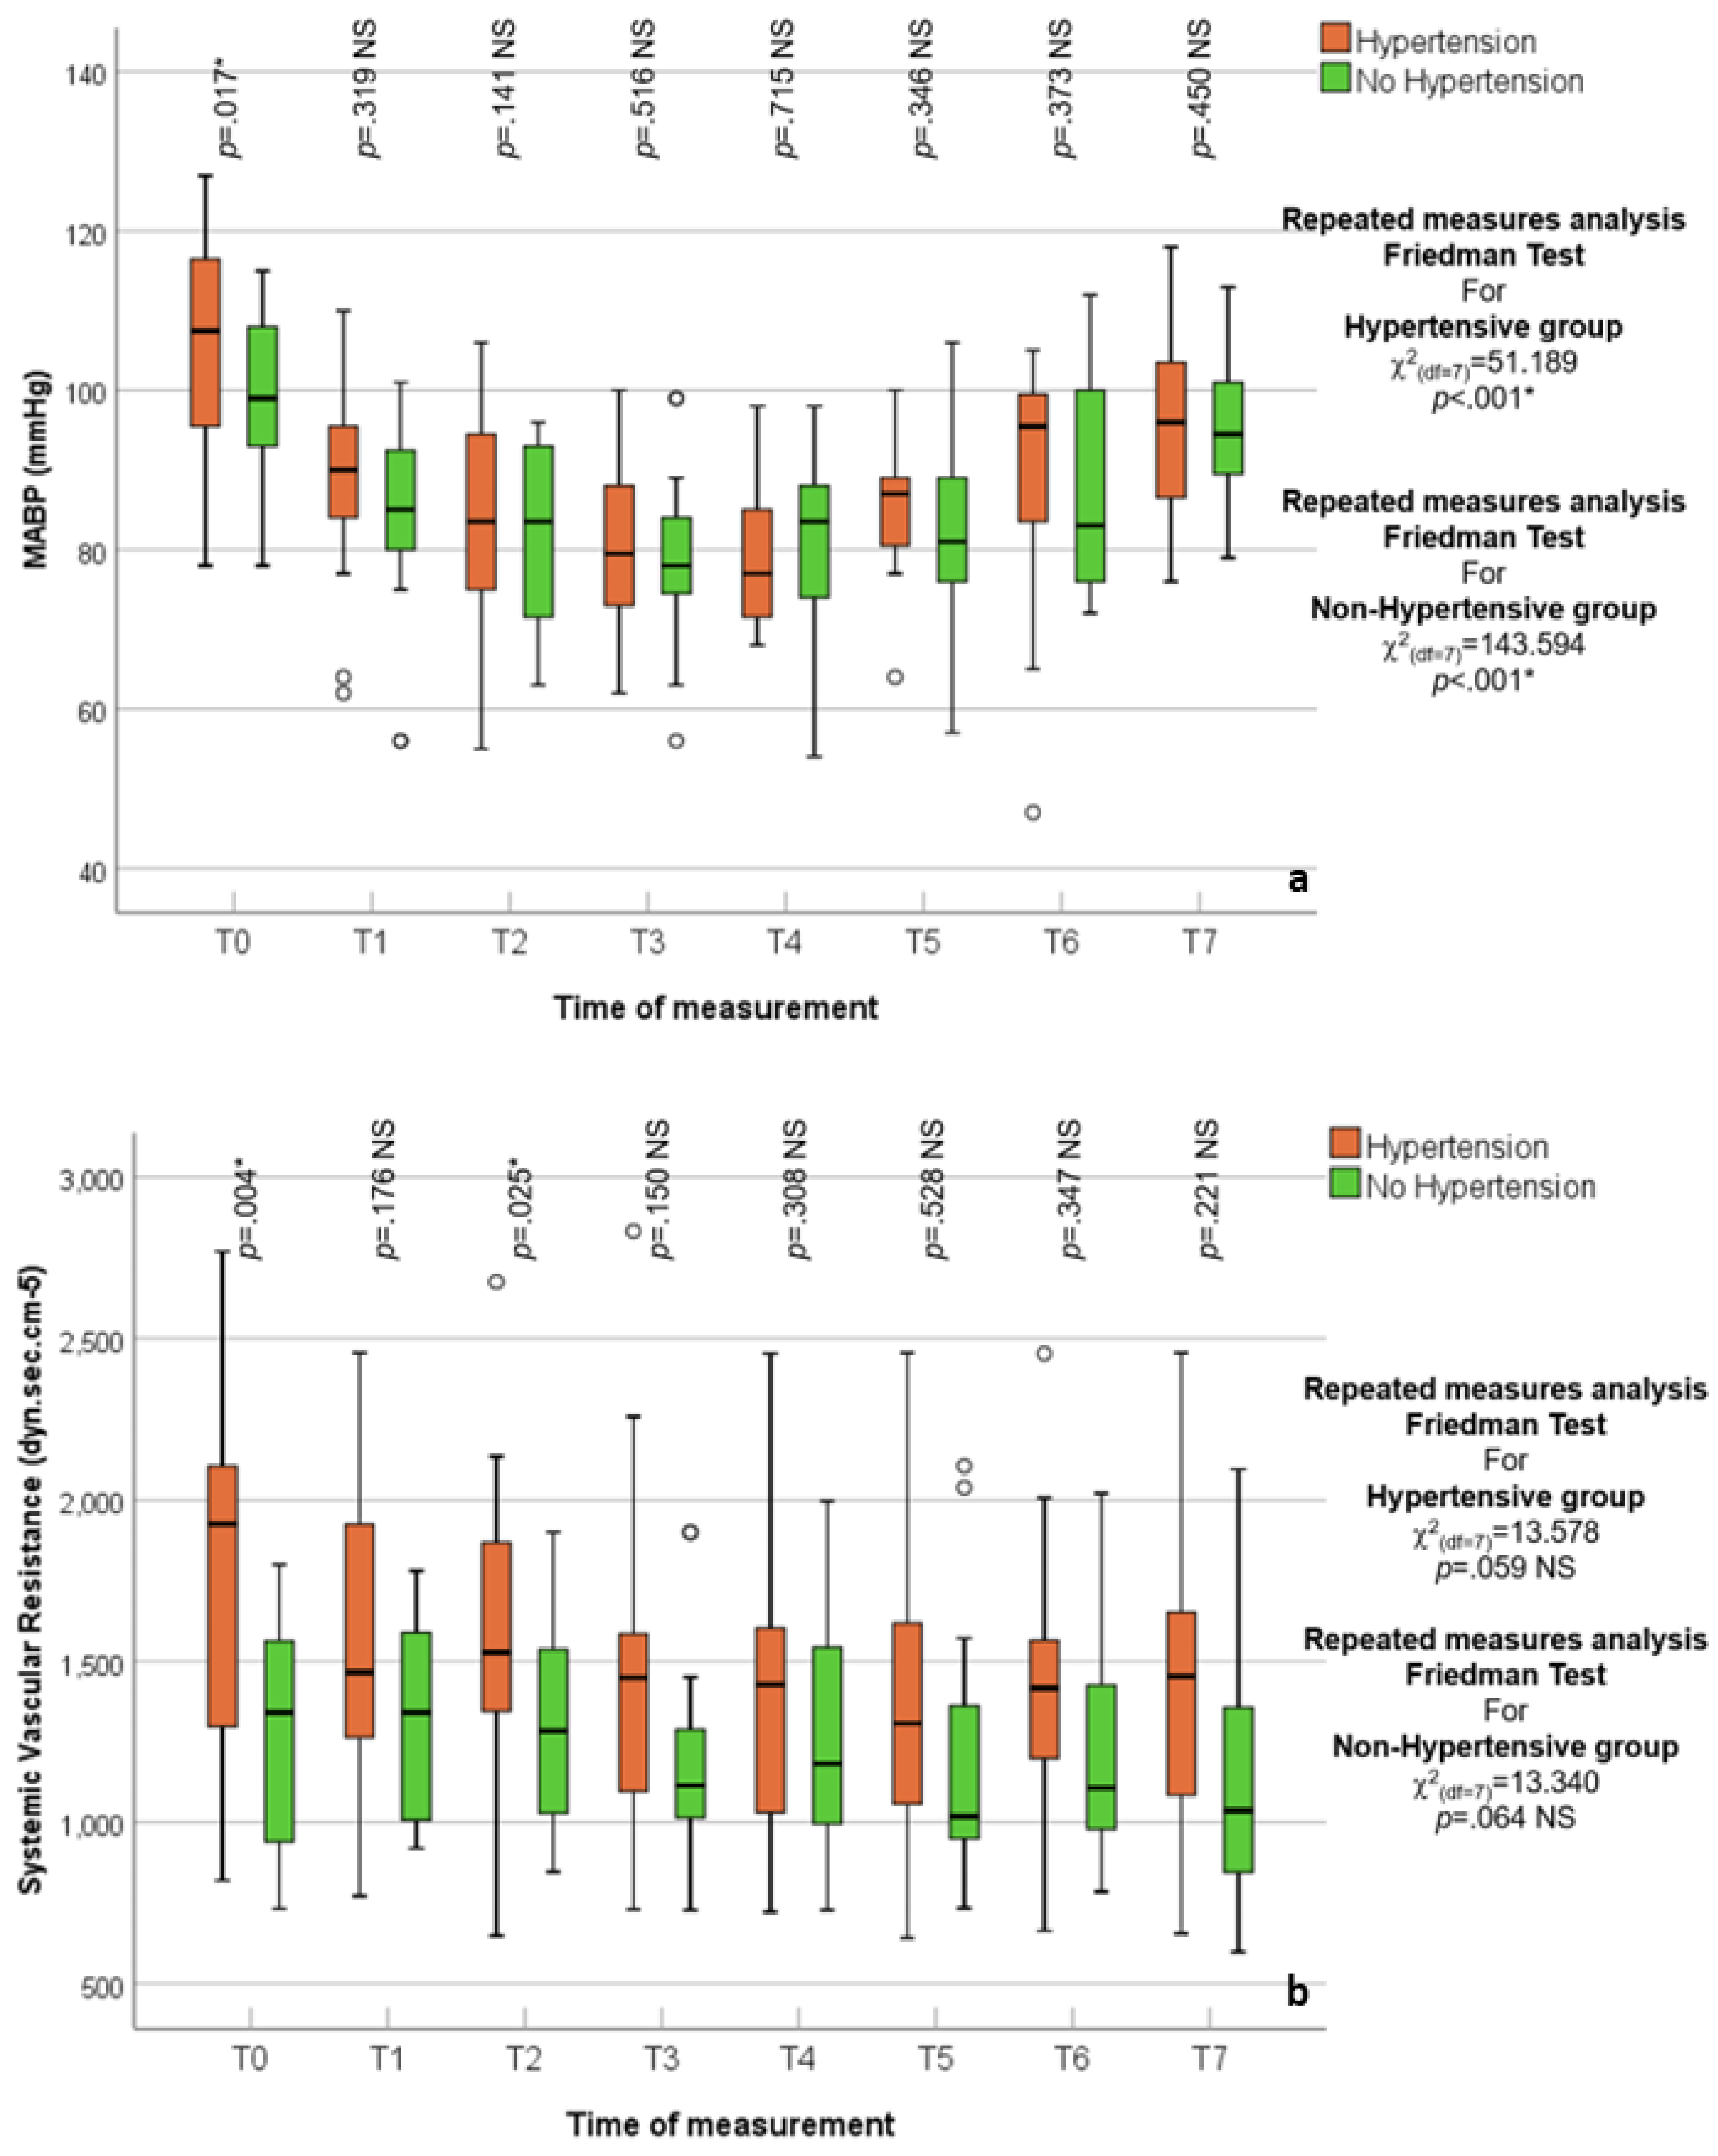
3.2. Hypertensive vs. Normotensive Patients
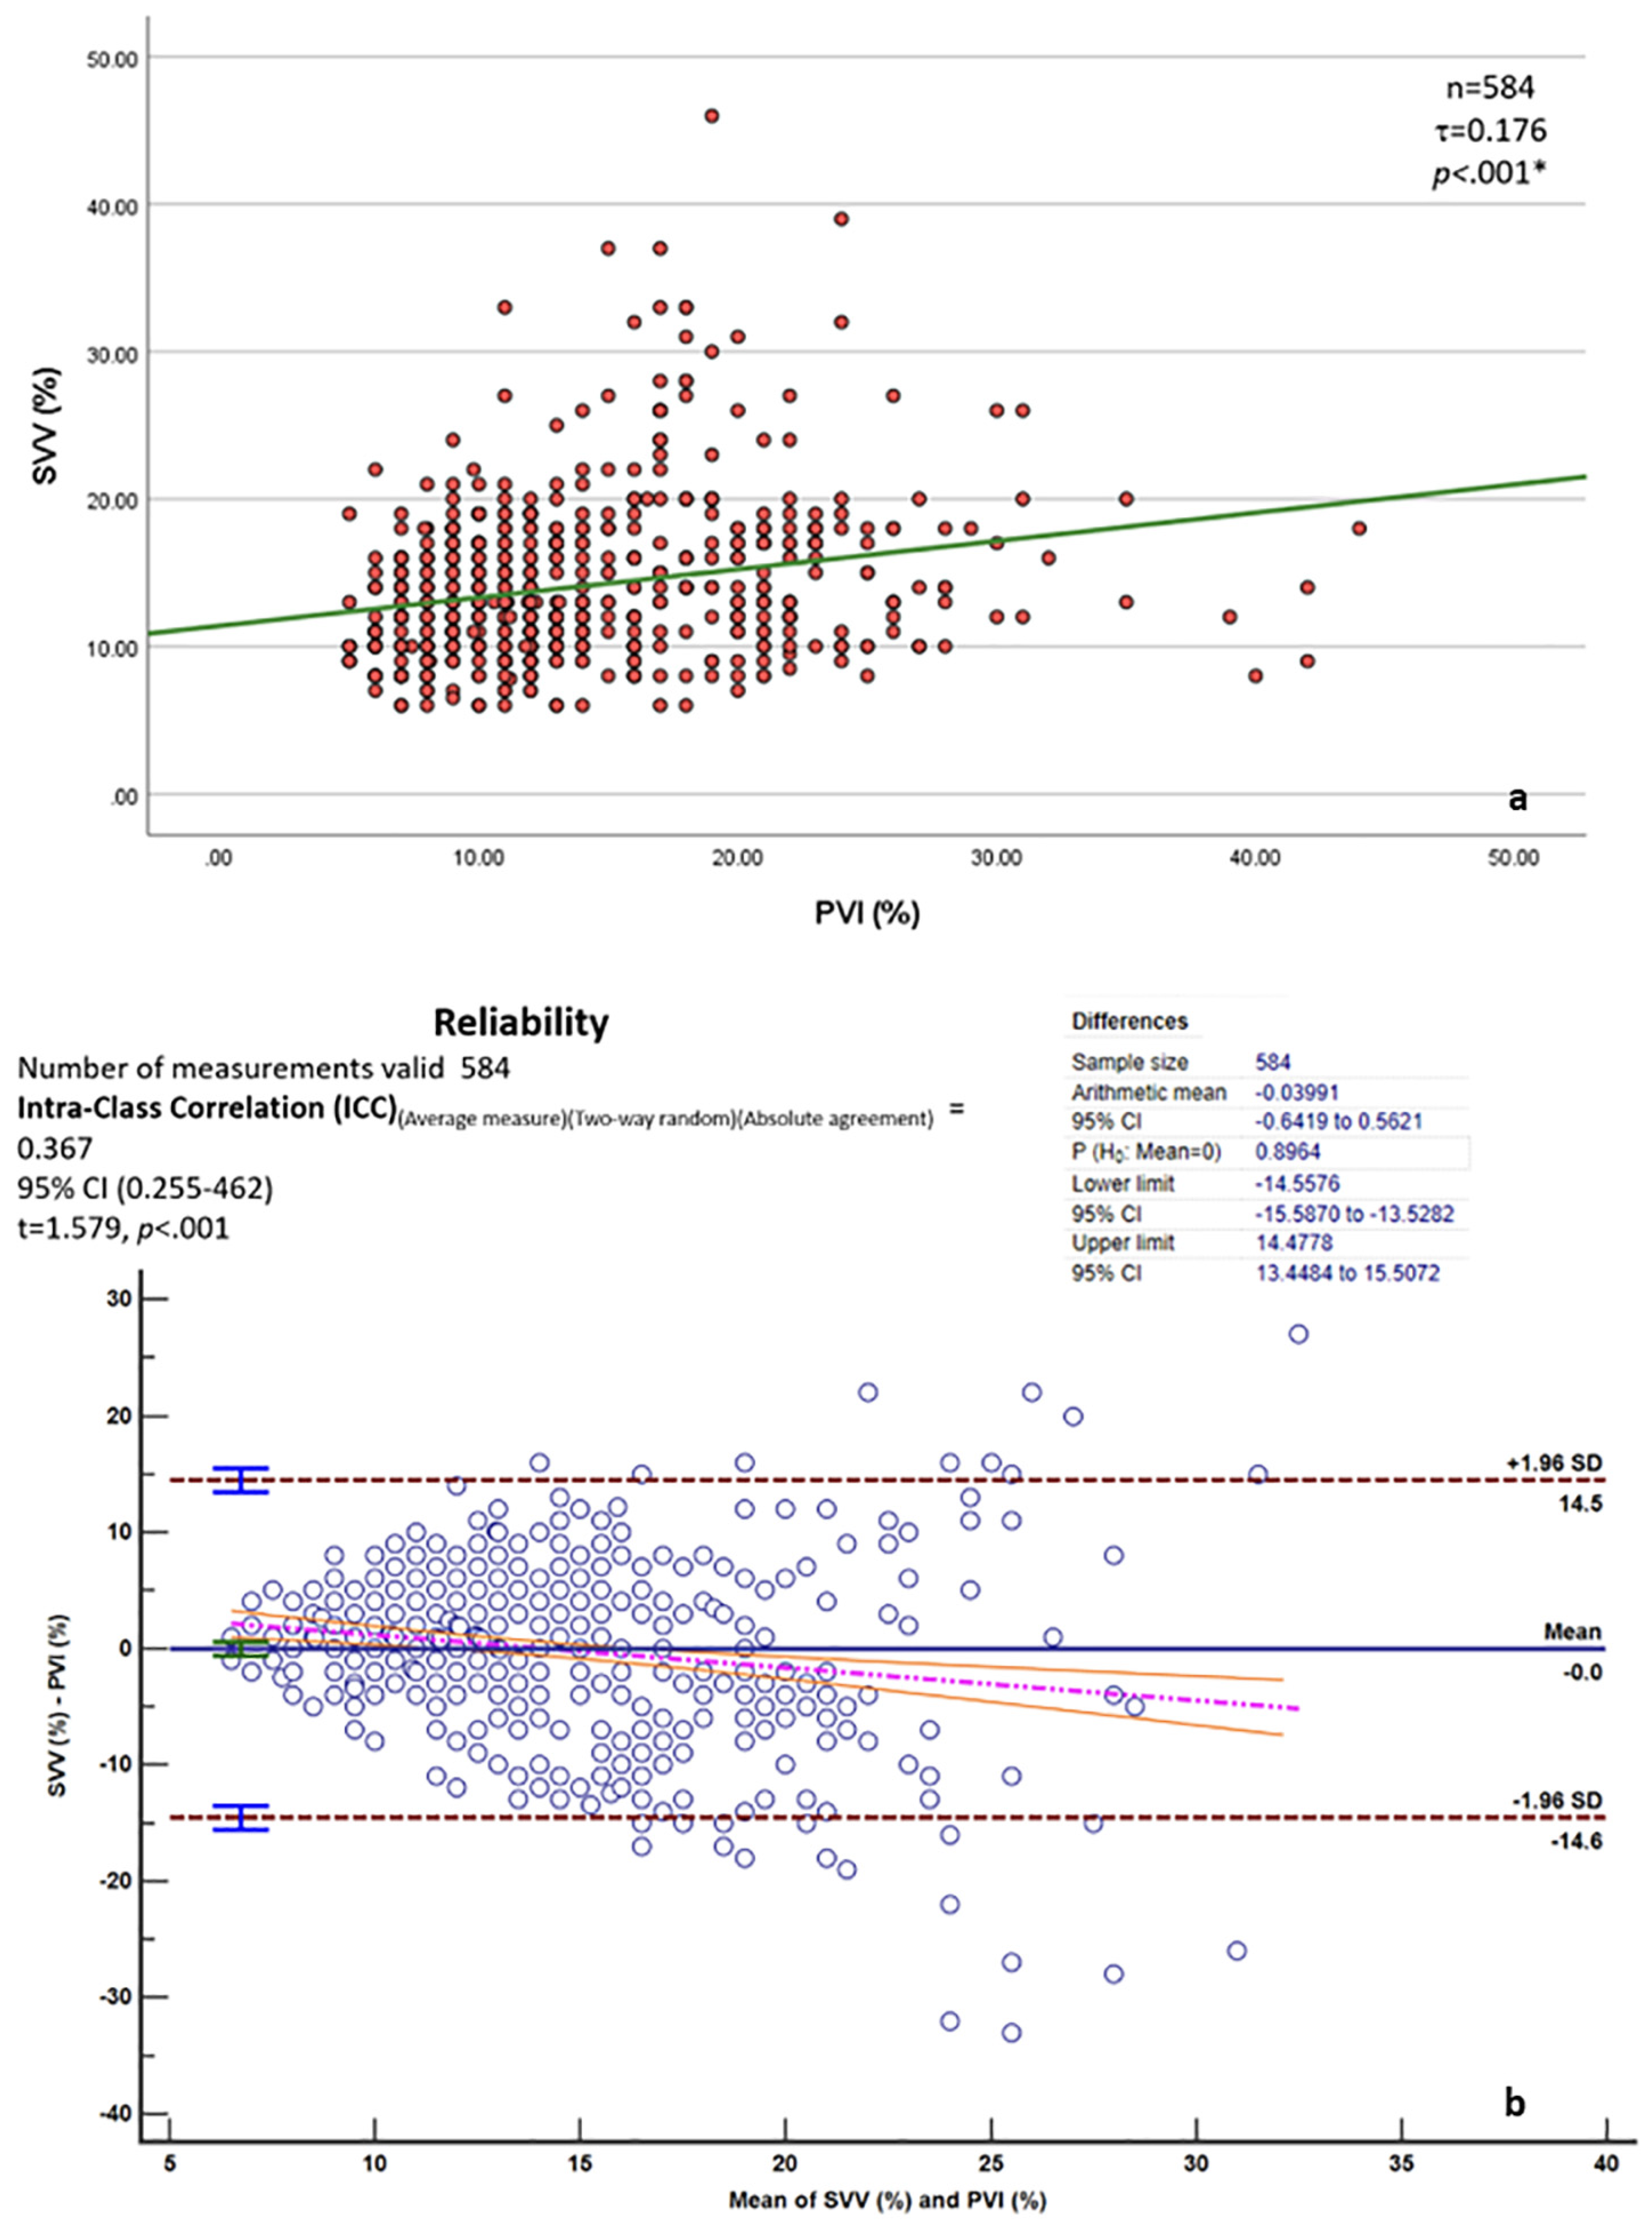
3.3. Stroke Volume Variation and Pleth Variability Index
4. Discussion
4.1. EC Precision
4.2. Limitations
5. Conclusions
Author Contributions
Funding
Institutional Review Board Statement
Informed Consent Statement
Data Availability Statement
Acknowledgments
Conflicts of Interest
References
- Safran, D.B.; Orlando, R., III. Physiologic effects of pneumoperitoneum. Am. J. Surg. 1994, 167, 281–286. [Google Scholar] [CrossRef] [PubMed]
- Atkinson, T.M.; Giraud, G.D.; Togioka, B.M.; Jones, D.B.; Cigarroa, J.E. Cardiovascular and ventilatory consequences of laparoscopic surgery. Circulation 2017, 135, 700–710. [Google Scholar] [CrossRef]
- Larsen, J.F.; Svendsen, F.M.; Pedersen, V. Randomized clinical trial of the effect of pneumoperitoneum on cardiac function and haemodynamics during laparoscopic cholecystectomy. Br. J. Surg. 2004, 91, 848–854. [Google Scholar] [CrossRef] [PubMed]
- Odeberg, S.; Ljungqvist, O.; Svenberg, T.; Gannedahl, P.; Bäckdahl, M.; von Rosen, A.; Sollevi, A. Haemodynamic effects of pneumoperitoneum and the influence of posture during anaesthesia for laparoscopic surgery. Acta Anaesthesiol. Scand. 1994, 38, 276–283. [Google Scholar] [CrossRef]
- Portera, C.A.; Compton, R.P.; Walters, D.N.; Browder, I.W. Benefits of pulmonary artery catheter and transesophageal echocardiographic monitoring in laparoscopic cholecystectomy patients with cardiac disease. Am. J. Surg. 1995, 169, 202–206. [Google Scholar] [CrossRef] [PubMed]
- Hein, H.; Joshi, G.P.; Ramsay, M.A.; Fox, L.; Gawey, B.J.; Hellman, C.L.; Arnold, J.C. Hemodynamic changes during laparoscopic cholecystectomy in patients with severe cardiac disease. J. Clin. Anesth. 1997, 9, 261–265. [Google Scholar] [CrossRef]
- Brantly, J.C.; Riley, P.M. Cardiovascular collapse during laparoscopy: A report of two cases. Am. J. Obstet. Gynecol. 1998, 159, 735–737. [Google Scholar]
- Barghout, A.; Plummer, B. Intraoperative myocardial infarction during elective laparoscopic cholecystectomy: A case report. Cureus 2024, 16, e76004. [Google Scholar] [CrossRef]
- Liu, Y.H.; Dhakal, B.P.; Keesakul, C.; Kacmarek, R.M.; Lewis, G.D. Continuous non-invasive cardiac output monitoring during exercise: Validation of electrical cardiometry with Fick and thermodilution methods. Br. J. Anaesth. 2016, 117, 129–131. [Google Scholar]
- Kobe, J.; Mishra, N.; Arya, V.K.; Al-Moustadi, W.; Nates, W.; Kumar, B. Cardiac output monitoring: Technology and choice. Ann. Card. Anaesth. 2019, 22, 6–17. [Google Scholar]
- Corcoran, T.; Rhodes, J.E.; Clarke, S.; Myles, P.S.; Ho, K.M. Perioperative fluid management strategies in major surgery: A stratified meta-analysis. Anesth. Analg. 2012, 114, 640. [Google Scholar] [CrossRef] [PubMed]
- Banerjee, A.; Saini, S.; Lal, J. Evaluation of hemodynamic changes during laparoscopic cholecystectomy by transthoracic echocardiography. J. Anaesthesiol. Clin. Pharmacol. 2021, 37, 436–442. [Google Scholar] [CrossRef] [PubMed]
- Rauch, R.; Welisch, E.; Lansdell, N.; Burrill, E.; Jones, J.; Robinson, T.; Bock, D.; Clarson, C.; Filler, G.; Norozi, K. Non-invasive measurement of cardiac output in obese children and adolescents: Comparison of electrical cardiometry and transthoracic Doppler echocardiography. J. Clin. Monit. Comput. 2013, 27, 187–193. [Google Scholar] [CrossRef]
- Sagiv, A.; Ben-Sira, D.; Goldhammer, E. Electrical cardiometry: A noninvasive method for monitoring cardiac output. J. Clin. Monit. Comput. 2012, 26, 309–315. [Google Scholar]
- Boet, A.; Jourdain, G.; Demontoux, S.; De Luca, D. Stroke volume and cardiac output evaluation by electrical cardiometry: Accuracy and reference nomograms in hemodynamically stable preterm neonates. J. Perinatol. 2016, 36, 748–752. [Google Scholar] [CrossRef] [PubMed]
- Marik, P.; Monnet, X.; Teboul, J. Hemodynamic parameters to guide fluid therapy. Ann. Intensive Care. 2011, 1, 1. [Google Scholar] [CrossRef]
- Lees, N.; Hamilton, M.; Rhodes, A. Clinical review: Goal-directed therapy in high-risk surgical patients. J. Crit. Care 2009, 13, 231. [Google Scholar] [CrossRef]
- IBM Corp. IBM SPSS Statistics for Windows, Version 25.0; IBM Corp.: Armonk, NY, USA, 2017. [Google Scholar]
- Shapiro, S. The Shapiro-Wilk and related test for normality. Statistics (Ber). 2015. Available online: https://math.mit.edu/~rmd/465/shapiro.pdf (accessed on 23 February 2025).
- Field, A. Discovering Statistics Using IBM SPSS Statistics, 4th ed.; SAGE Publications Ltd.: London, UK; Thousand Oaks, CA, USA; New Delhi, India, 2013. [Google Scholar]
- Friedman, M. The use of ranks to avoid the assumption of normality implicit in the analysis of variance. J. Am. Stat. Assoc. 1937, 32, 675–701. [Google Scholar] [CrossRef]
- Kendall, M.G. A new measure of rank correlation. Biometrika 1938, 30, 81–93. [Google Scholar] [CrossRef]
- Koch, G.G. Intraclass correlation coefficient. In Encyclopedia of Statistical Sciences; Kotz, S., Johnson, N.L., Read, C.B., Eds.; John Wiley & Sons: New York, NY, USA, 1982; pp. 213–217. [Google Scholar]
- Cicchetti, D.V. Guidelines, criteria, and rules of thumb for evaluating normed and standardized assessment instruments in psychology. Psychol. Assess 1994, 6, 284. [Google Scholar] [CrossRef]
- Curran-Everett, D. Evolution in statistics: P values, statistical significance, kayaks, and walking trees. Am. Physiol. Soc. 2020, 44, 221–224. [Google Scholar]
- Hinkle, D.E.; Wiersma, W.; Jurs, S.G. Applied Statistics for the Behavioral Sciences; Houghton Mifflin: Boston, MA, USA, 2003. [Google Scholar]
- Wittgen, C.M.; Andrus, C.H.; Fitzgerald, S.D.; Baudendistel, L.J.; Dahms, T.E.; Kaminski, D.L. Analysis of the hemodynamic and ventilatory effects of laparoscopic cholecystectomy. Arch. Surg. 1991, 126, 997–1001. [Google Scholar]
- Dexter, S.P.L.; Vucevic, M.; Gibson, J.; McMahon, M.J. Hemodynamic consequences of high- and low-pressure pneumoperitoneum during laparoscopic cholecystectomy. Surg. Endosc. 1999, 13, 376–381. [Google Scholar] [CrossRef]
- Jin, D.; Yu, H.; Li, H.; Zhao, N.; Zhang, Y.; Li, J.; Cui, J.; Tang, D.; Li, Y.; Teng, Y.; et al. Hemodynamic changes of anesthesia, pneumoperitoneum, and head-down tilt during laparoscopic surgery in elderly patients. Ann. Transl. Med. 2021, 9, 1177. [Google Scholar] [CrossRef] [PubMed] [PubMed Central]
- Gannedahl, P.; Odeberg, S.; Brodin, L.A.; Sollevi, A. Effects of posture and pneumoperitoneum during anaesthesia on the indices of left ventricular filling. Acta Anaesthesiol. Scand. 1996, 40, 160–166. [Google Scholar] [CrossRef] [PubMed]
- Łagosz, P.; Sokolski, M.; Biegus, J.; Tycinska, A.; Zymlinski, R. Elevated intra-abdominal pressure: A review of current knowledge. World J. Clin. Cases 2022, 10, 3005–3013. [Google Scholar] [CrossRef] [PubMed]
- Kim, E.J.; Yoon, H. The effects of pneumoperitoneum on heart rate, mean arterial blood pressure and cardiac output of hypertensive patients during laparoscopic colectomy. J. Korean Acad. Nurs. 2010, 40, 433–441. [Google Scholar] [CrossRef] [PubMed]
- Zhang, Y.; Li, X.; Wang, H. Hypertensive patients and hemodynamic instability during laparoscopic procedures: A systematic review. J. Clin. Anesth. 2023, 75, 110456. [Google Scholar]
- Lee-Ong, A. Physiologic Considerations in Laparoscopic Surgery. In Mastering Endo-Laparoscopic and Thoracoscopic Surgery; Springer Nature: Singapore, 2023; pp. 83–85. [Google Scholar]
- Hirvonen, E.A.; Nuutinen, L.S.; Vuolteenaho, O. Hormonal responses and cardiac filling pressures in head-up or head-down position and pneumoperitoneum in patients undergoing operative laparoscopy. Br. J. Anaesth. 1997, 78, 128–133. [Google Scholar] [CrossRef]
- Alishahi, S.; Francis, N.; Crofts, S.; Duncan, L.; Bickel, A.; Cuschieri, A. Central and peripheral adverse hemodynamic changes during laparoscopic surgery and their reversal with a novel intermittent sequential pneumatic compression device. Ann. Surg. 2001, 233, 176–182. [Google Scholar] [CrossRef]
- Russo, A.; Marana, E.; Viviani, D.; Polidori, L.; Colicci, S.; Mettimano, M.; Proietti, R.; Di Stasio, E. Diastolic function: The influence of pneumoperitoneum and Trendelenburg positioning during laparoscopic hysterectomy. Eur. J. Anaesthesiol. 2009, 26, 923–927. [Google Scholar] [CrossRef] [PubMed]
- Joris, J.L.; Noirot, D.P.; Legrand, M.J.; Jacquet, N.J.; Lamy, M.L. Hemodynamic changes during laparoscopic cholecystectomy. Anesth. Analg. 1993, 76, 1067–1071. [Google Scholar] [CrossRef] [PubMed]
- Biswas, J.; Das, P.K.; Malviya, D. Evaluation of hemodynamic changes with different abdominal pressure for laproscopic cholecystectomy using advanced cardiac output (Flo-Trac) monitoring. Indian. J. Clin. Anaesth. 2020, 7, 295–301. [Google Scholar]
- Sanders, M.; Servaas, S.; Slagt, C. Accuracy and precision of non-invasive cardiac output monitoring by electrical cardiometry: A systematic review and meta-analysis. J. Clin. Monit. Comput. 2020, 34, 433–460. [Google Scholar] [CrossRef] [PubMed] [PubMed Central]
- Suehiro, K.; Joosten, A.; Murphy, L.S.; Desebbe, O.; Alexander, B.; Kim, S.H.; Cannesson, M. Accuracy and precision of minimally-invasive cardiac output monitoring in children: A systematic review and meta-analysis. J. Clin. Monit. Comput. 2016, 30, 603–620. [Google Scholar] [CrossRef] [PubMed]
- Altamirano-Diaz, L.; Welisch, E.; Dempsey, A.A.; Park, T.S.; Grattan, M.; Norozi, K. Non-invasive measurement of cardiac output in children with repsaired coarctation of the aorta using electrical cardiometry compared to transthoracic Doppler echocardiography. Physiol. Meas. 2018, 39, 055003. [Google Scholar] [CrossRef] [PubMed]

| Pre-Induction (T0) | Post-Intubation (T1) | Post-Insufflation and Positioning (T2) | 15 min Post-Insufflation (T3) | 30 min Post-Insufflation (T4) | End of Surgery (T5) | 10 min Post-Deflation (T6) | Post-Extubation (T7) | Test of Significance p-Value | |
|---|---|---|---|---|---|---|---|---|---|
| Heart Rate (beat/min) | χ2(df = 7) = 52.455 p < 0.001 * | ||||||||
| 57.00–120.00 | 57.00–114.00 | 58.00–122.00 | 56.00–100.00 | 54.00–108.00 | 50.00–118.00 | 56.00–120.00 | 59.00–133.00 | |
| 88.38 ± 13.39 | 84.75 ± 14.02 | 83.900 ± 13.79 | 80.63 ± 11.29 | 79.89 ± 10.94 | 80.53 ± 12.27 | 82.11 ± 11.89 | 86.88 ± 14.22 | |
| 89.00 | 86.00 | 84.00 | 81.00 | 79.00 | 81.00 | 82.00 | 87.00 | |
| 86.00–94.00 | 83.00–92.00 | 79.00–87.00 | 78.00–84.00 | 78.00–83.00 | 80.00–84.00 | 80.00–87.00 | 84.00–90.00 | |
| 78.00–99.00 | 76.00–94.00 | 75.00–92.00 | 73.00–88.00 | 76.00–86.00 | 74.00–89.00 | 78.00–88.00 | 80.00–92.00 | |
| Adjusted p value | p = 0.202 NS | p = 0.553 NS | p < 0.001 * | p < 0.001 * | p < 0.001 * | p < 0.001 * | p = 1.000 NS | ||
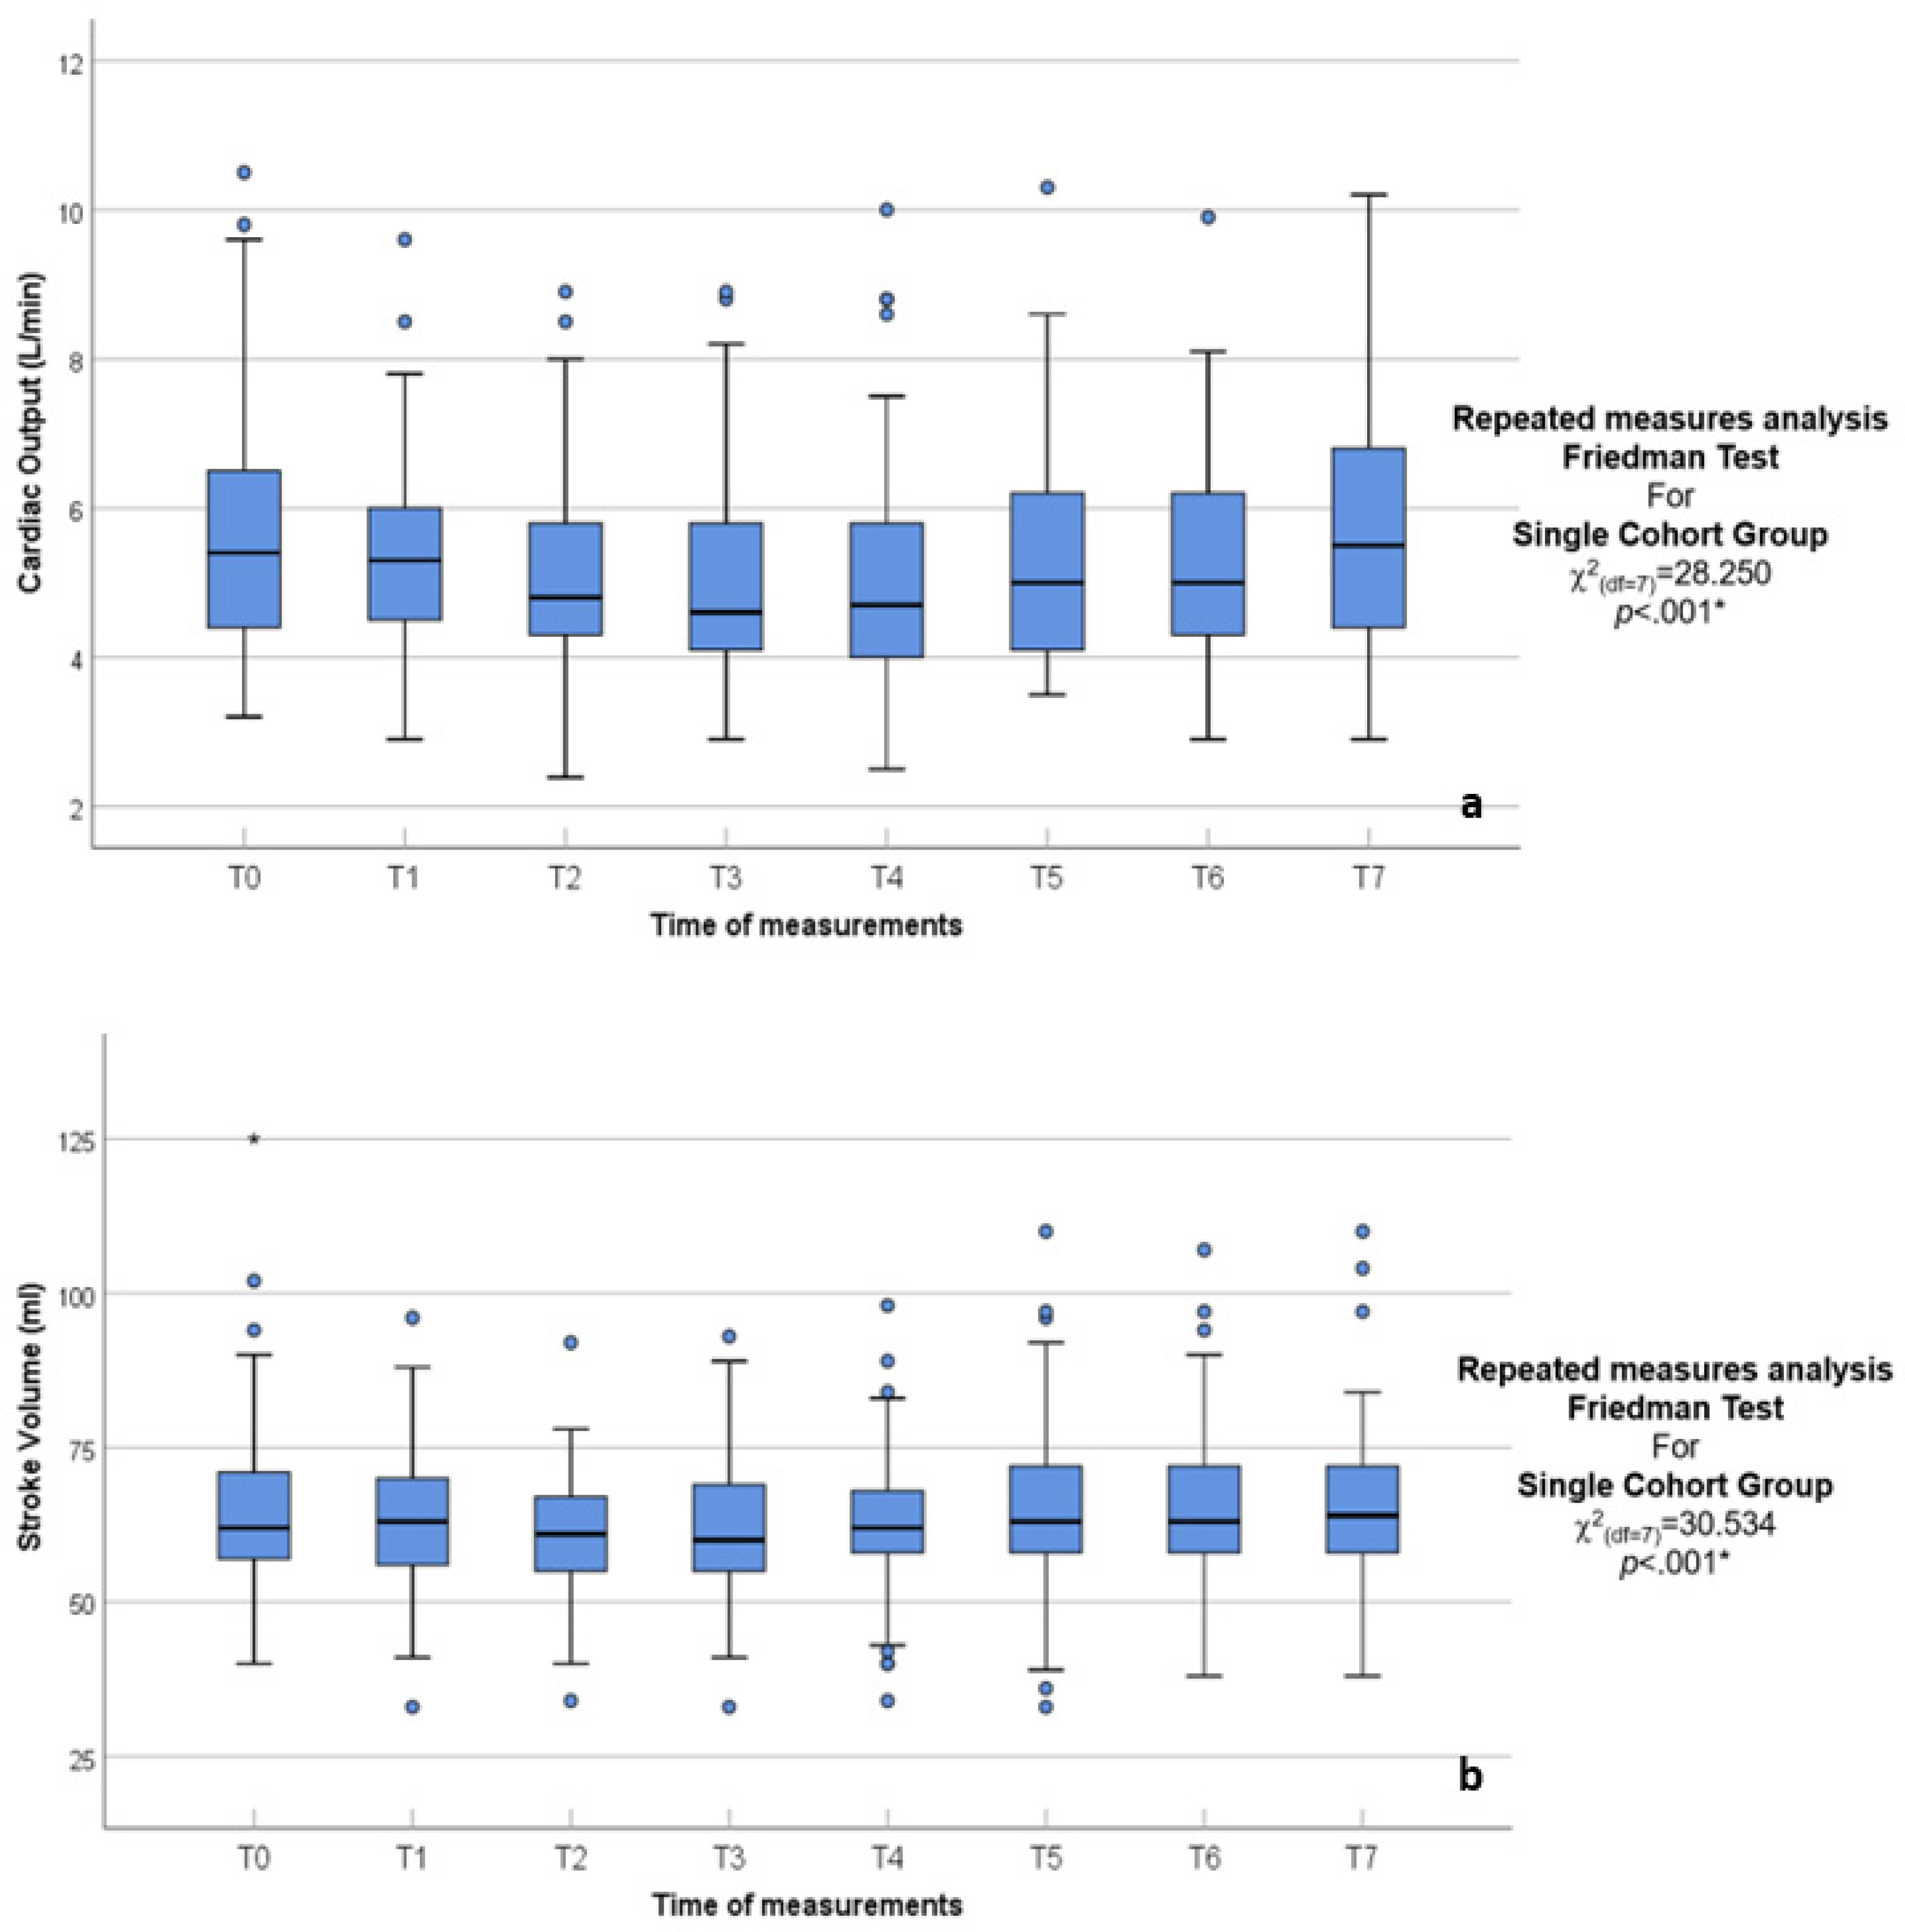
| CO (L/min) | χ2(df = 7) = 28.250 p < 0.001 * | ||||||||
| 3.20–10.50 | 2.90–9.60 | 2.39–8.90 | 2.90–8.90 | 2.50–10.00 | 3.50–10.30 | 2.90–9.90 | 2.90–10.20 | |
| 5.68 ± 1.58 | 5.38 ± 1.25 | 5.08 ± 1.16 | 5.04 ± 1.34 | 5.09 ± 1.48 | 5.33 ± 1.42 | 5.27 ± 1.32 | 5.72 ± 1.67 | |
| 5.40 | 5.30 | 4.80 | 4.60 | 4.70 | 5.00 | 5.00 | 5.50 | |
| 5.00–5.80 | 5.10–5.80 | 4.50–5.40 | 4.40–5.30 | 4.30–5.20 | 4.50–5.60 | 4.60–5.70 | 5.00–6.20 | |
| 4.40–6.50 | 4.50–6.00 | 4.30–5.80 | 4.10–5.80 | 4.00–5.80 | 4.10–6.20 | 4.30–6.20 | 4.40–6.80 | |
| Adjusted p value | p = 1.000 NS | p = 0.012 * | p = 0.050 NS | p = 0.002 * | p = 0.400 NS | p = 0.042 * | p = 1.000 NS | ||
| SV (mL) | χ2(df = 7) = 30.534 p < 0.001 * | ||||||||
| 40.00–125.00 | 33.00–96.00 | 34.00–92.00 | 33.00–93.00 | 34.00–98.00 | 33.00–110.00 | 38.00–107.00 | 38.00–110.00 | |
| 64.64 ± 15.00 | 63.58 ± 11.81 | 61.00 ± 9.90 | 61.38 ± 11.58 | 62.62 ± 11.96 | 64.59 ± 14.82 | 65.03 ± 13.08 | 65.40 ± 13.00 | |
| 62.00 | 63.00 | 61.00 | 60.00 | 62.00 | 63.00 | 63.00 | 64.00 | |
| 60.00–67.00 | 61.00–66.00 | 59.00–63.00 | 58.00–63.00 | 61.00–65.00 | 60.00–66.00 | 61.00–68.00 | 62.00–70.00 | |
| 57.00–71.00 | 56.00–70.00 | 55.00–67.00 | 55.00–69.00 | 58.00–68.00 | 58.00–72.00 | 58.00–72.00 | 58.00–72.00 | |
| Adjusted p value | p = 1.000 NS | p = 0.056 NS | p = 0.047 * | p = 0.114 NS | p = 1.000 NS | p = 1.000 NS | p = 1.000 NS | ||
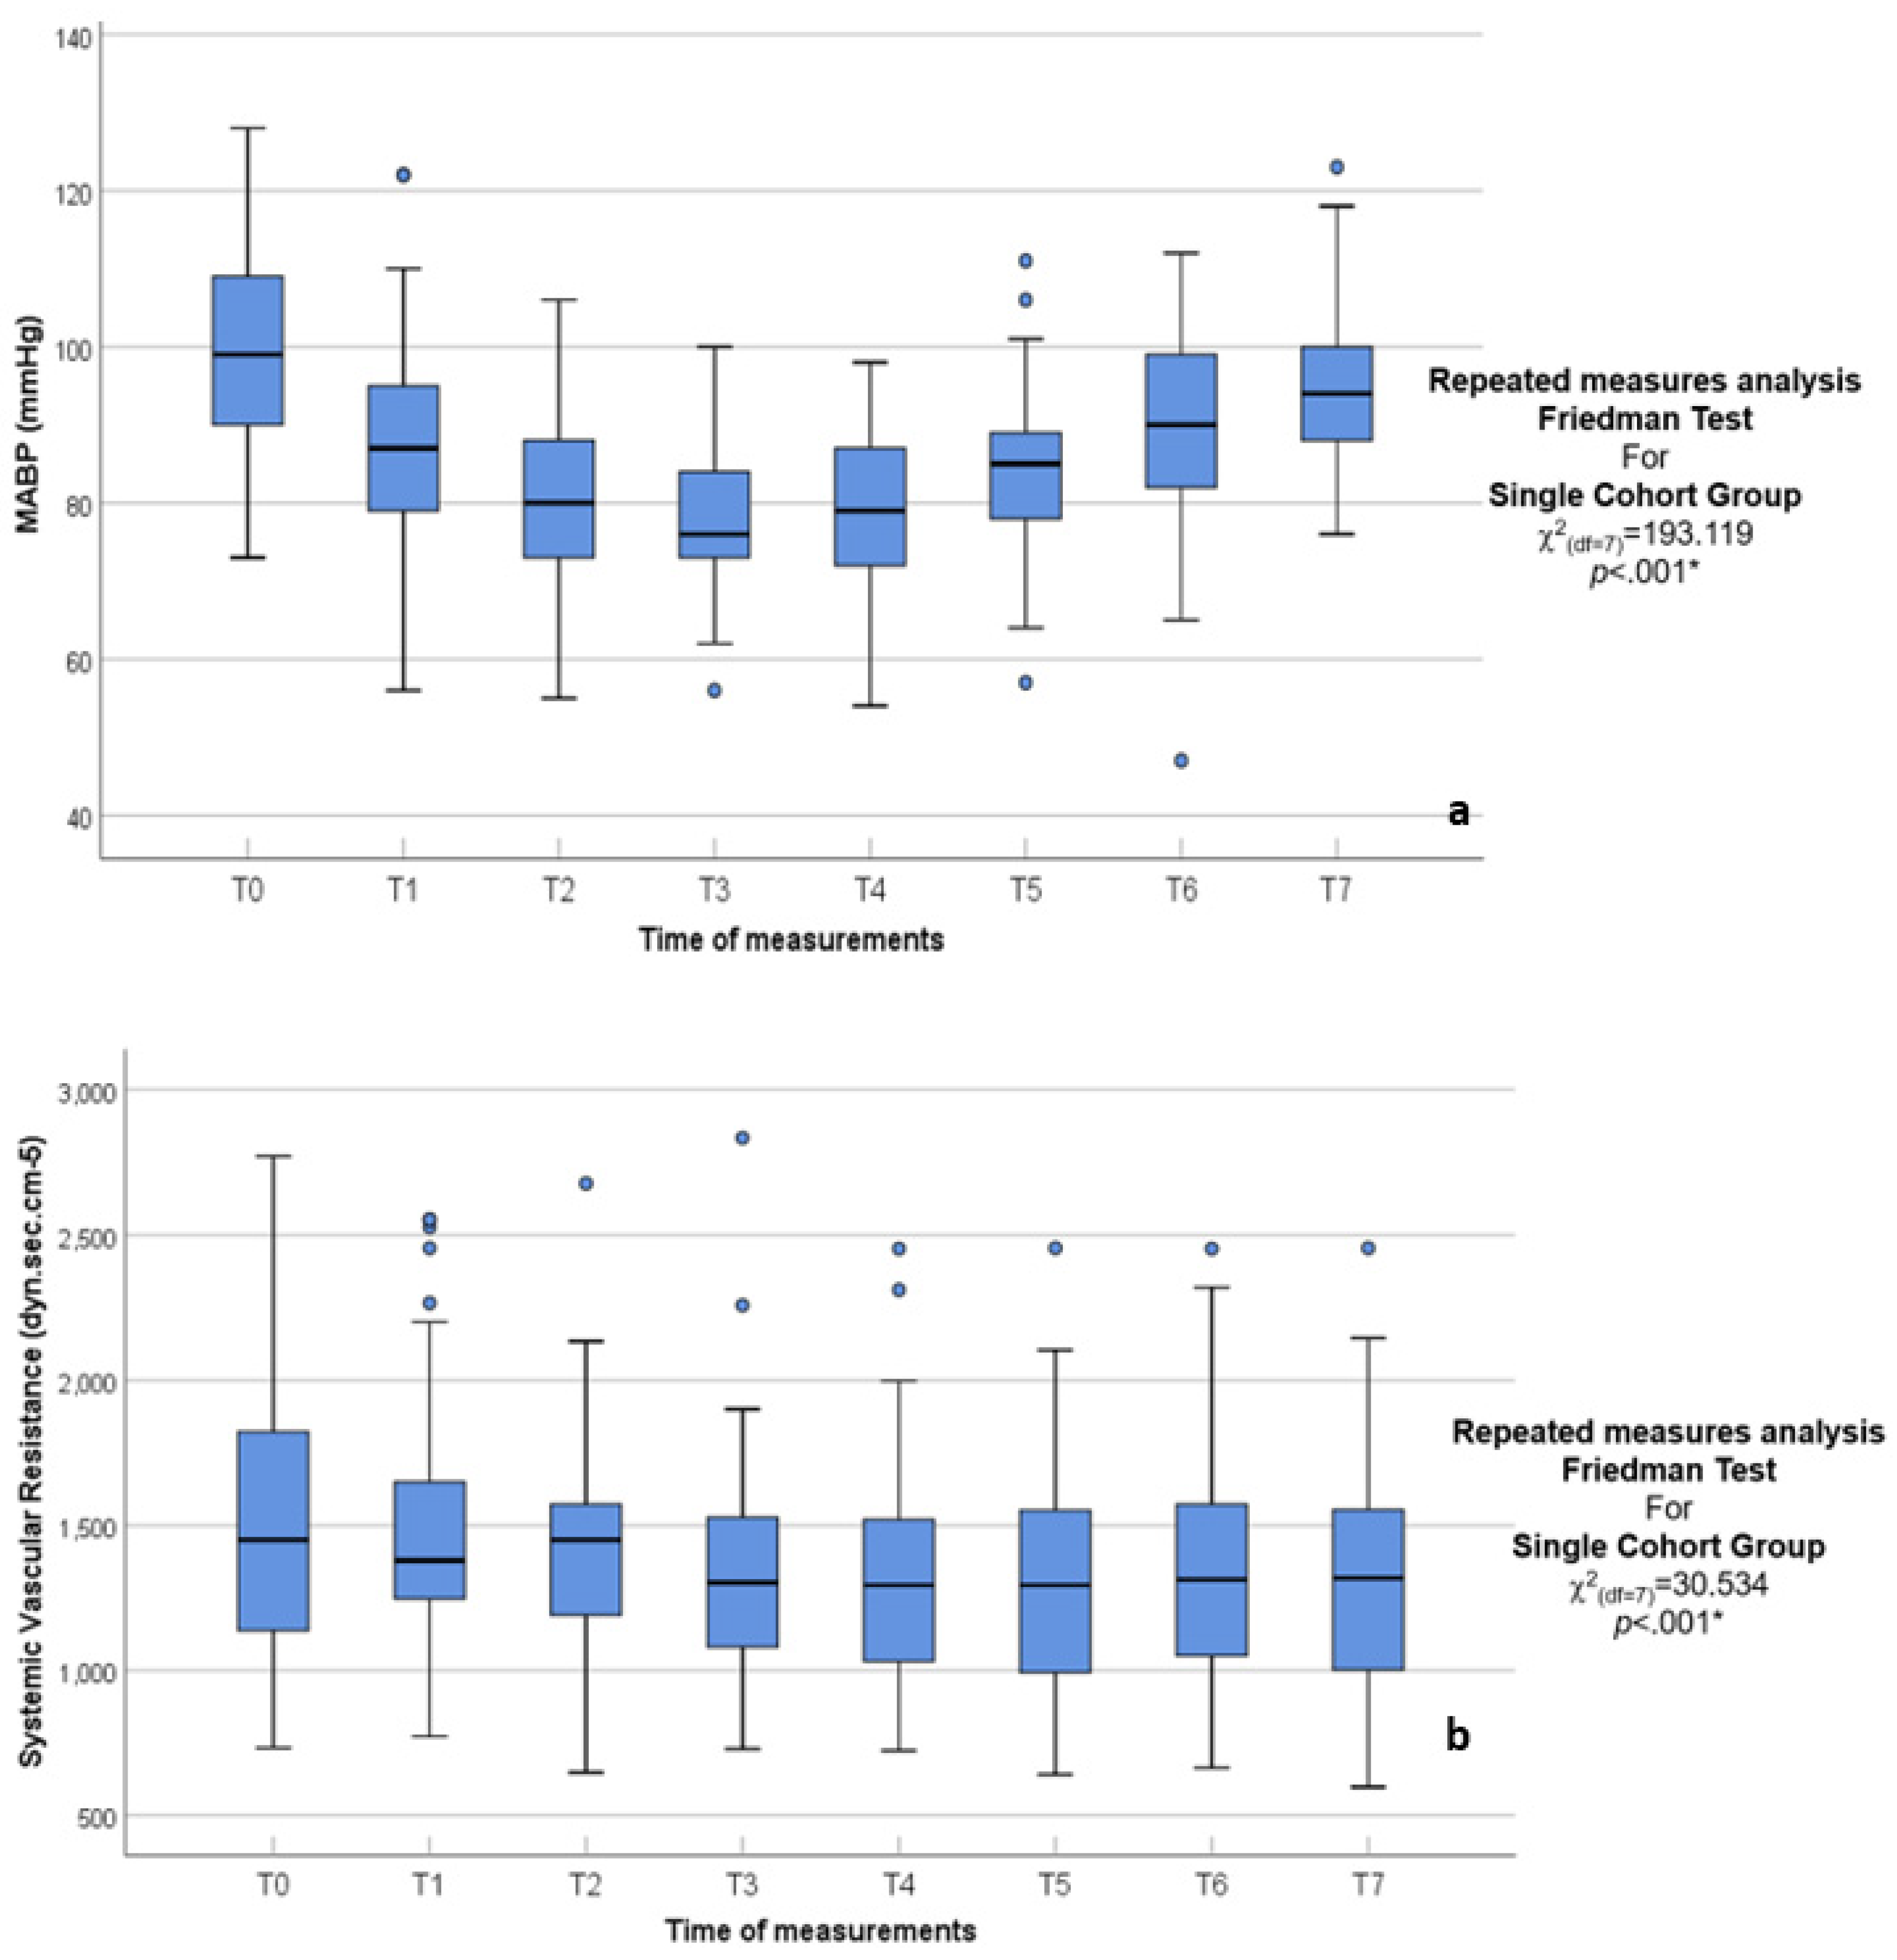
| MABP (mmHg) | χ2(df = 7) = 193.119 p < 0.001 * | ||||||||
| 73.00–128.00 | 56.00–122.00 | 55.00–106.00 | 56.00–100.00 | 54.00–98.00 | 57.00–111.00 | 47.00–112.00 | 76.00–123.00 | |
| 99.30 ± 12.08 | 86.33 ± 13.74 | 80.42 ± 10.62 | 78.10 ± 9.19 | 79.07 ± 9.64 | 84.70 ± 9.72 | 89.21 ± 11.98 | 94.49 ± 9.64 | |
| 99.00 | 87.00 | 80.00 | 76.00 | 79.00 | 85.00 | 90.00 | 94.00 | |
| 98.00–102.00 | 85.00–92.00 | 77.00–83.00 | 74.00–80.00 | 76.00–84.00 | 81.00–88.00 | 85.00–94.00 | 92.00–98.00 | |
| 90.00–109.00 | 79.00–95.00 | 73.00–88.00 | 73.00–84.00 | 72.00–87.00 | 78.00–89.00 | 82.00–99.00 | 88.00–100.00 | |
| Adjusted p value | padjusted < 0.001 * | padjusted < 0.001 * | padjusted < 0.001 * | padjusted < 0.001 * | padjusted < 0.001 * | p = 0.001 * | p = 1.000 NS | ||
| SVR (dyn.s.cm−5) | χ2(df = 7) = 22.060 p = 0.002 * | ||||||||
| 733.00–2770.00 | 772.00–2552.00 | 648.00–2676.00 | 729.00–2833.00 | 723.00–2453.00 | 641.00–2455.00 | 664.00–2453.00 | 598.00–2455.00 | |
| 1498.26 ± 461.83 | 1472.25 ± 410.74 | 1425.41 ± 348.13 | 1337.92 ± 347.90 | 1330.62 ± 348.24 | 1300.64 ± 374.51 | 1351.99 ± 368.01 | 1322.70 ± 405.56 | |
| 1450.00 | 1379.00 | 1450.00 | 1302.00 | 1293.00 | 1293.00 | 1313.00 | 1318.00 | |
| 1284.00–1638.00 | 1303.00–1561.00 | 1337.00–1513.00 | 1267.00–1435.00 | 1220.00–1419.00 | 1101.00–1428.00 | 1196.00–1518.00 | 1139.00–1451.00 | |
| 1137.00–1823.00 | 1247.00–1649.00 | 1191.00–1572.00 | 1080.00–1527.00 | 1031.00–1520.00 | 992.00–1552.00 | 1051.00–1572.00 | 1002.00–1553.00 | |
| Adjusted p value | p = 1.000 NS | p = 1.000 NS | p = 0.661 NS | p = 1.000 NS | padjusted < 0.001 * | p = 1.000 NS | p = 0.382 NS |
| Percentage Change (Versus Pre-Induction) | ||||||||
|---|---|---|---|---|---|---|---|---|
| Pre-Induction (T0) | T1 vs. T0 | T2 vs. T0 | T3 vs. T0 | T4 vs. T0 | T5 vs. T0 | T6 vs. T0 | T7 vs. T0 | |
| CO (L/min) | ||||||||
| 3.20–10.50 | −39.22–71.87 | −44.90–48.72 | −47.14–69.77 | −44.44–72.41 | −42.86–77.59 | −47.78–68.75 | −55.56–108.33 |
| 5.68 ± 1.58 | −2.85 ± 18.16 | −7.66 ± 19.70 | −8.36 ± 22.98 | −7.70 ± 24.77 | −2.81 ± 26.14 | −3.45 ± 25.76 | 4.03 ± 30.01 |
| 5.40 | −2.44 | −7.29 | −8.62 | −11.29 | −6.94 | −4.55 | −1.43 |
| 5.00–5.80 | −6.67–0.00 | −15.94–0.00 | −15.79–−2.27 | −18.97–−5.71 | −17.39–0.00 | −15.91–0.00 | −10.53–4.08 |
| 4.40–6.50 | −11.46–4.00 | −24.14–4.17 | −23.08–2.63 | −23.53–0.00 | −21.05–7.89 | −23.08–7.02 | −16.13–26.67 |
| SV (mL) | ||||||||
| 40.00–125.00 | −40.20–55.00 | −38.40–52.50 | −36.00–52.50 | −36.00–65.85 | −34.55–68.29 | −40.20–75.61 | −39.22–102.50 |
| 64.64 ± 15.00 | −0.08 ± 13.27 | −3.55 ± 14.11 | −3.12 ± 15.88 | −0.86 ± 19.00 | 1.72 ± 21.28 | 2.81 ± 19.75 | 3.67 ± 21.77 |
| 62.00 | −1.47 | −4.23 | −4.76 | −3.77 | −3.51 | −1.59 | 0.00 |
| 60.00–67.00 | −3.75–1.54 | −7.69–0.00 | −8.45–0.00 | −7.46–0.00 | −6.45–1.56 | −4.55–5.26 | −1.52–4.92 |
| 57.00–71.00 | −5.56–4.92 | −11.94–5.00 | −11.43–4.00 | −13.70–7.50 | −10.45–7.78 | −9.52–14.93 | −9.52–10.00 |
| MABP (mmHg) | ||||||||
| 73.00–128.00 | −48.23–89.43 | −49.42–52.22 | −49.71–55.24 | −61.59–57.03 | −58.19–120.32 | −56.82–83.68 | −63.98–124.21 |
| 99.30 ± 12.08 | 1.51 ± 20.89 | −0.22 ± 24.11 | −5.71 ± 25.46 | −5.49 ± 27.90 | −7.82 ± 30.48 | −4.31 ± 29.64 | −6.92 ± 31.28 |
| 99.00 | −1.31 | −2.98 | −9.31 | −3.09 | −14.57 | −5.44 | −12.32 |
| 98.00–102.00 | −3.29–2.34 | −6.03–5.56 | −15.39–5.56 | −10.00–7.42 | −19.04–2.47 | −16.28–4.03 | −16.37–−1.46 |
| 90.00–109.00 | −8.43–10.00 | −16.38–17.59 | −25.92–11.76 | −28.98–11.40 | −31.55–8.77 | −28.10–14.49 | −29.11–7.45 |
| SVR (dyn.s.cm−5) | ||||||||
| 733.00–2770.00 | −40.40–22.00 | −51.33–9.09 | −44.09–17.95 | −46.09–25.64 | −42.42–28.21 | −60.50–20.51 | −32.74–28.13 |
| 1498.26 ± 461.83 | −12.62 ± 12.99 | −18.13 ± 12.75 | −20.12 ± 14.11 | −19.16 ± 14.19 | −13.57 ± 14.01 | −9.32 ± 13.15 | −3.94 ± 11.42 |
| 1450.00 | −14.91 | −18.63 | −23.16 | −20.00 | −14.44 | −9.09 | −4.55 |
| 1284.00–1638.00 | −16.67–−9.47 | −21.74–−14.29 | −24.78–−16.85 | −23.00–−15.73 | −18.75–−11.22 | −14.00–−5.95 | −6.78–−1.01 |
| 1137.00–1823.00 | −20.95–−2.65 | −26.60–−11.21 | −29.29–−10.10 | −26.26–−10.09 | −22.00–−7.14 | −17.27–−1.83 | −11.00–3.57 |
Disclaimer/Publisher’s Note: The statements, opinions and data contained in all publications are solely those of the individual author(s) and contributor(s) and not of MDPI and/or the editor(s). MDPI and/or the editor(s) disclaim responsibility for any injury to people or property resulting from any ideas, methods, instructions or products referred to in the content. |
© 2025 by the authors. Licensee MDPI, Basel, Switzerland. This article is an open access article distributed under the terms and conditions of the Creative Commons Attribution (CC BY) license (https://creativecommons.org/licenses/by/4.0/).
Share and Cite
Yassen, K.A.; Aljumaiy, W.; Alherz, I.; AlMudayris, L.A.; AlBunyan, S.A.; AlSubaie, R.S.; Alniniya, F.; Saleh, S. Non-Invasive Cardiac Output Monitoring with Electrical Cardiometry During Laparoscopic Cholecystectomy Surgery, a Cross-Sectional Study. J. Clin. Med. 2025, 14, 2228. https://doi.org/10.3390/jcm14072228
Yassen KA, Aljumaiy W, Alherz I, AlMudayris LA, AlBunyan SA, AlSubaie RS, Alniniya F, Saleh S. Non-Invasive Cardiac Output Monitoring with Electrical Cardiometry During Laparoscopic Cholecystectomy Surgery, a Cross-Sectional Study. Journal of Clinical Medicine. 2025; 14(7):2228. https://doi.org/10.3390/jcm14072228
Chicago/Turabian StyleYassen, Khaled Ahmed, Walla Aljumaiy, Imran Alherz, Lina A. AlMudayris, Sara Abdulhameed AlBunyan, Renad S. AlSubaie, Fatma Alniniya, and Sherif Saleh. 2025. "Non-Invasive Cardiac Output Monitoring with Electrical Cardiometry During Laparoscopic Cholecystectomy Surgery, a Cross-Sectional Study" Journal of Clinical Medicine 14, no. 7: 2228. https://doi.org/10.3390/jcm14072228
APA StyleYassen, K. A., Aljumaiy, W., Alherz, I., AlMudayris, L. A., AlBunyan, S. A., AlSubaie, R. S., Alniniya, F., & Saleh, S. (2025). Non-Invasive Cardiac Output Monitoring with Electrical Cardiometry During Laparoscopic Cholecystectomy Surgery, a Cross-Sectional Study. Journal of Clinical Medicine, 14(7), 2228. https://doi.org/10.3390/jcm14072228