
Comparative Analysis of Prognostic Potential of Pretreatment Blood-Based Biomarkers in Metastatic Bladder Cancer: Modified Glasgow Prognostic Score

 , , , , , ,
Abstract
1. Introduction
2. Methods
2.1. Data Collection
2.2. Statistical Analysis
3. Results
3.1. NLR
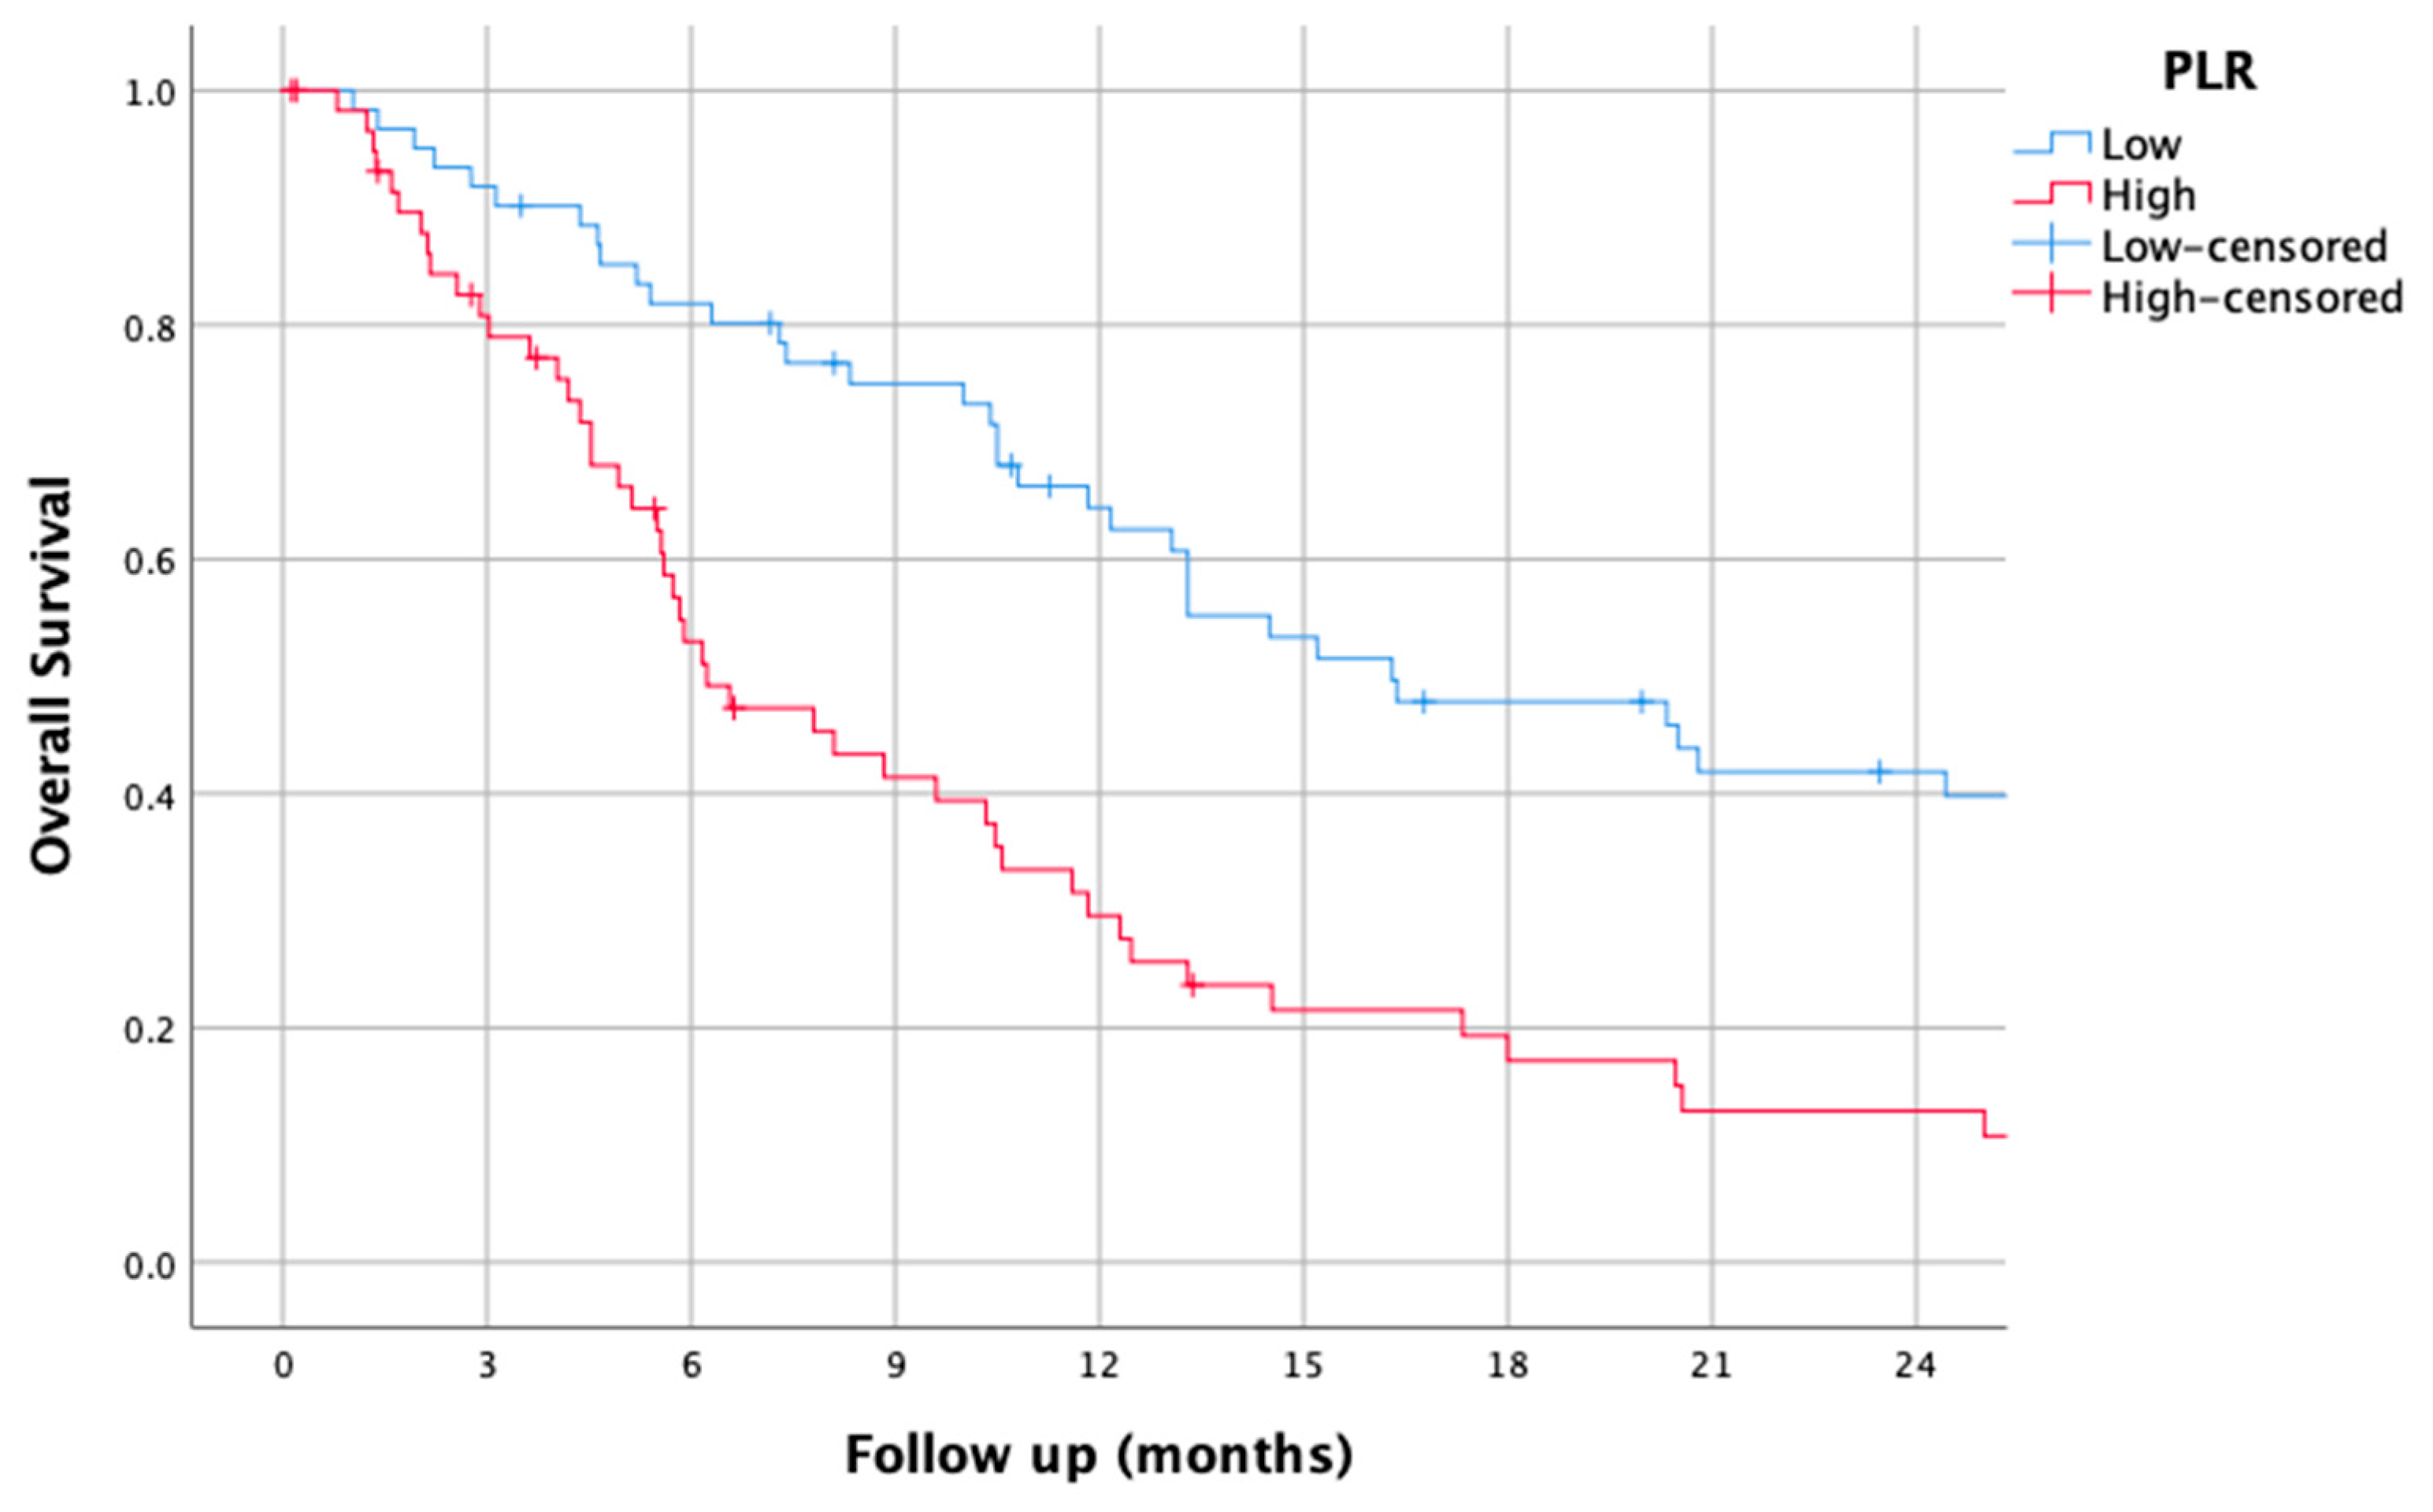
3.2. PLR
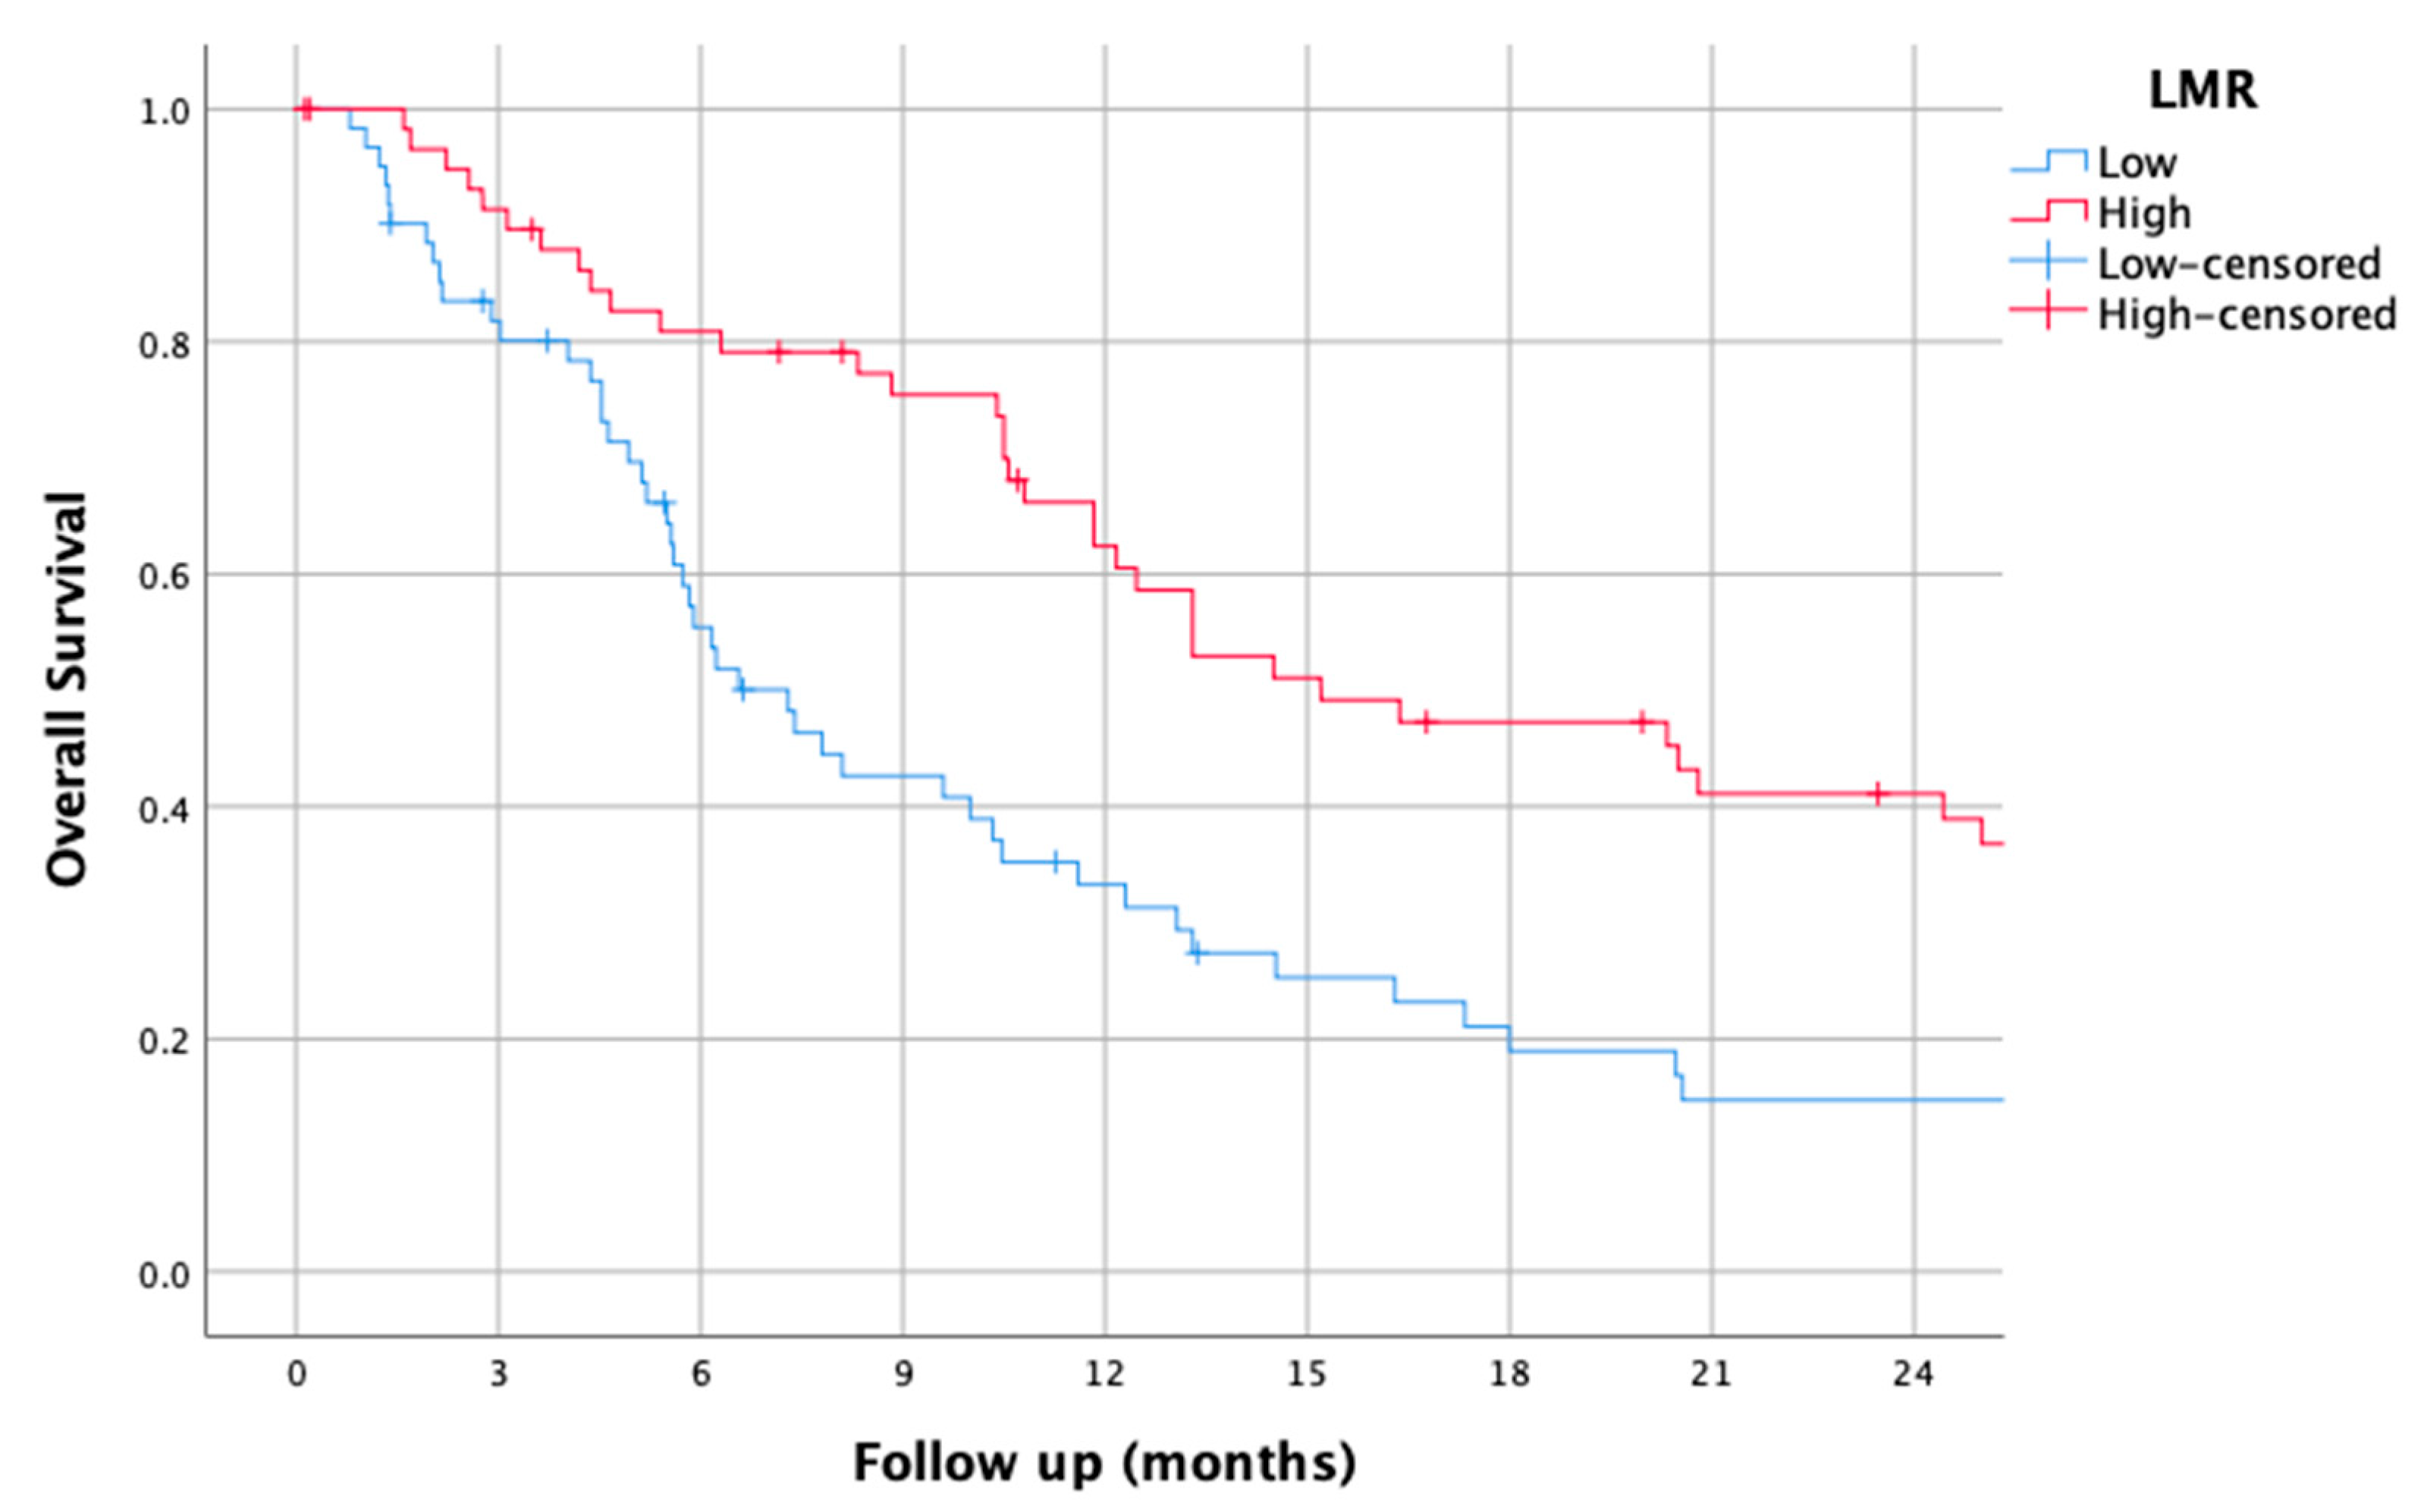
3.3. LMR
3.4. dNLR
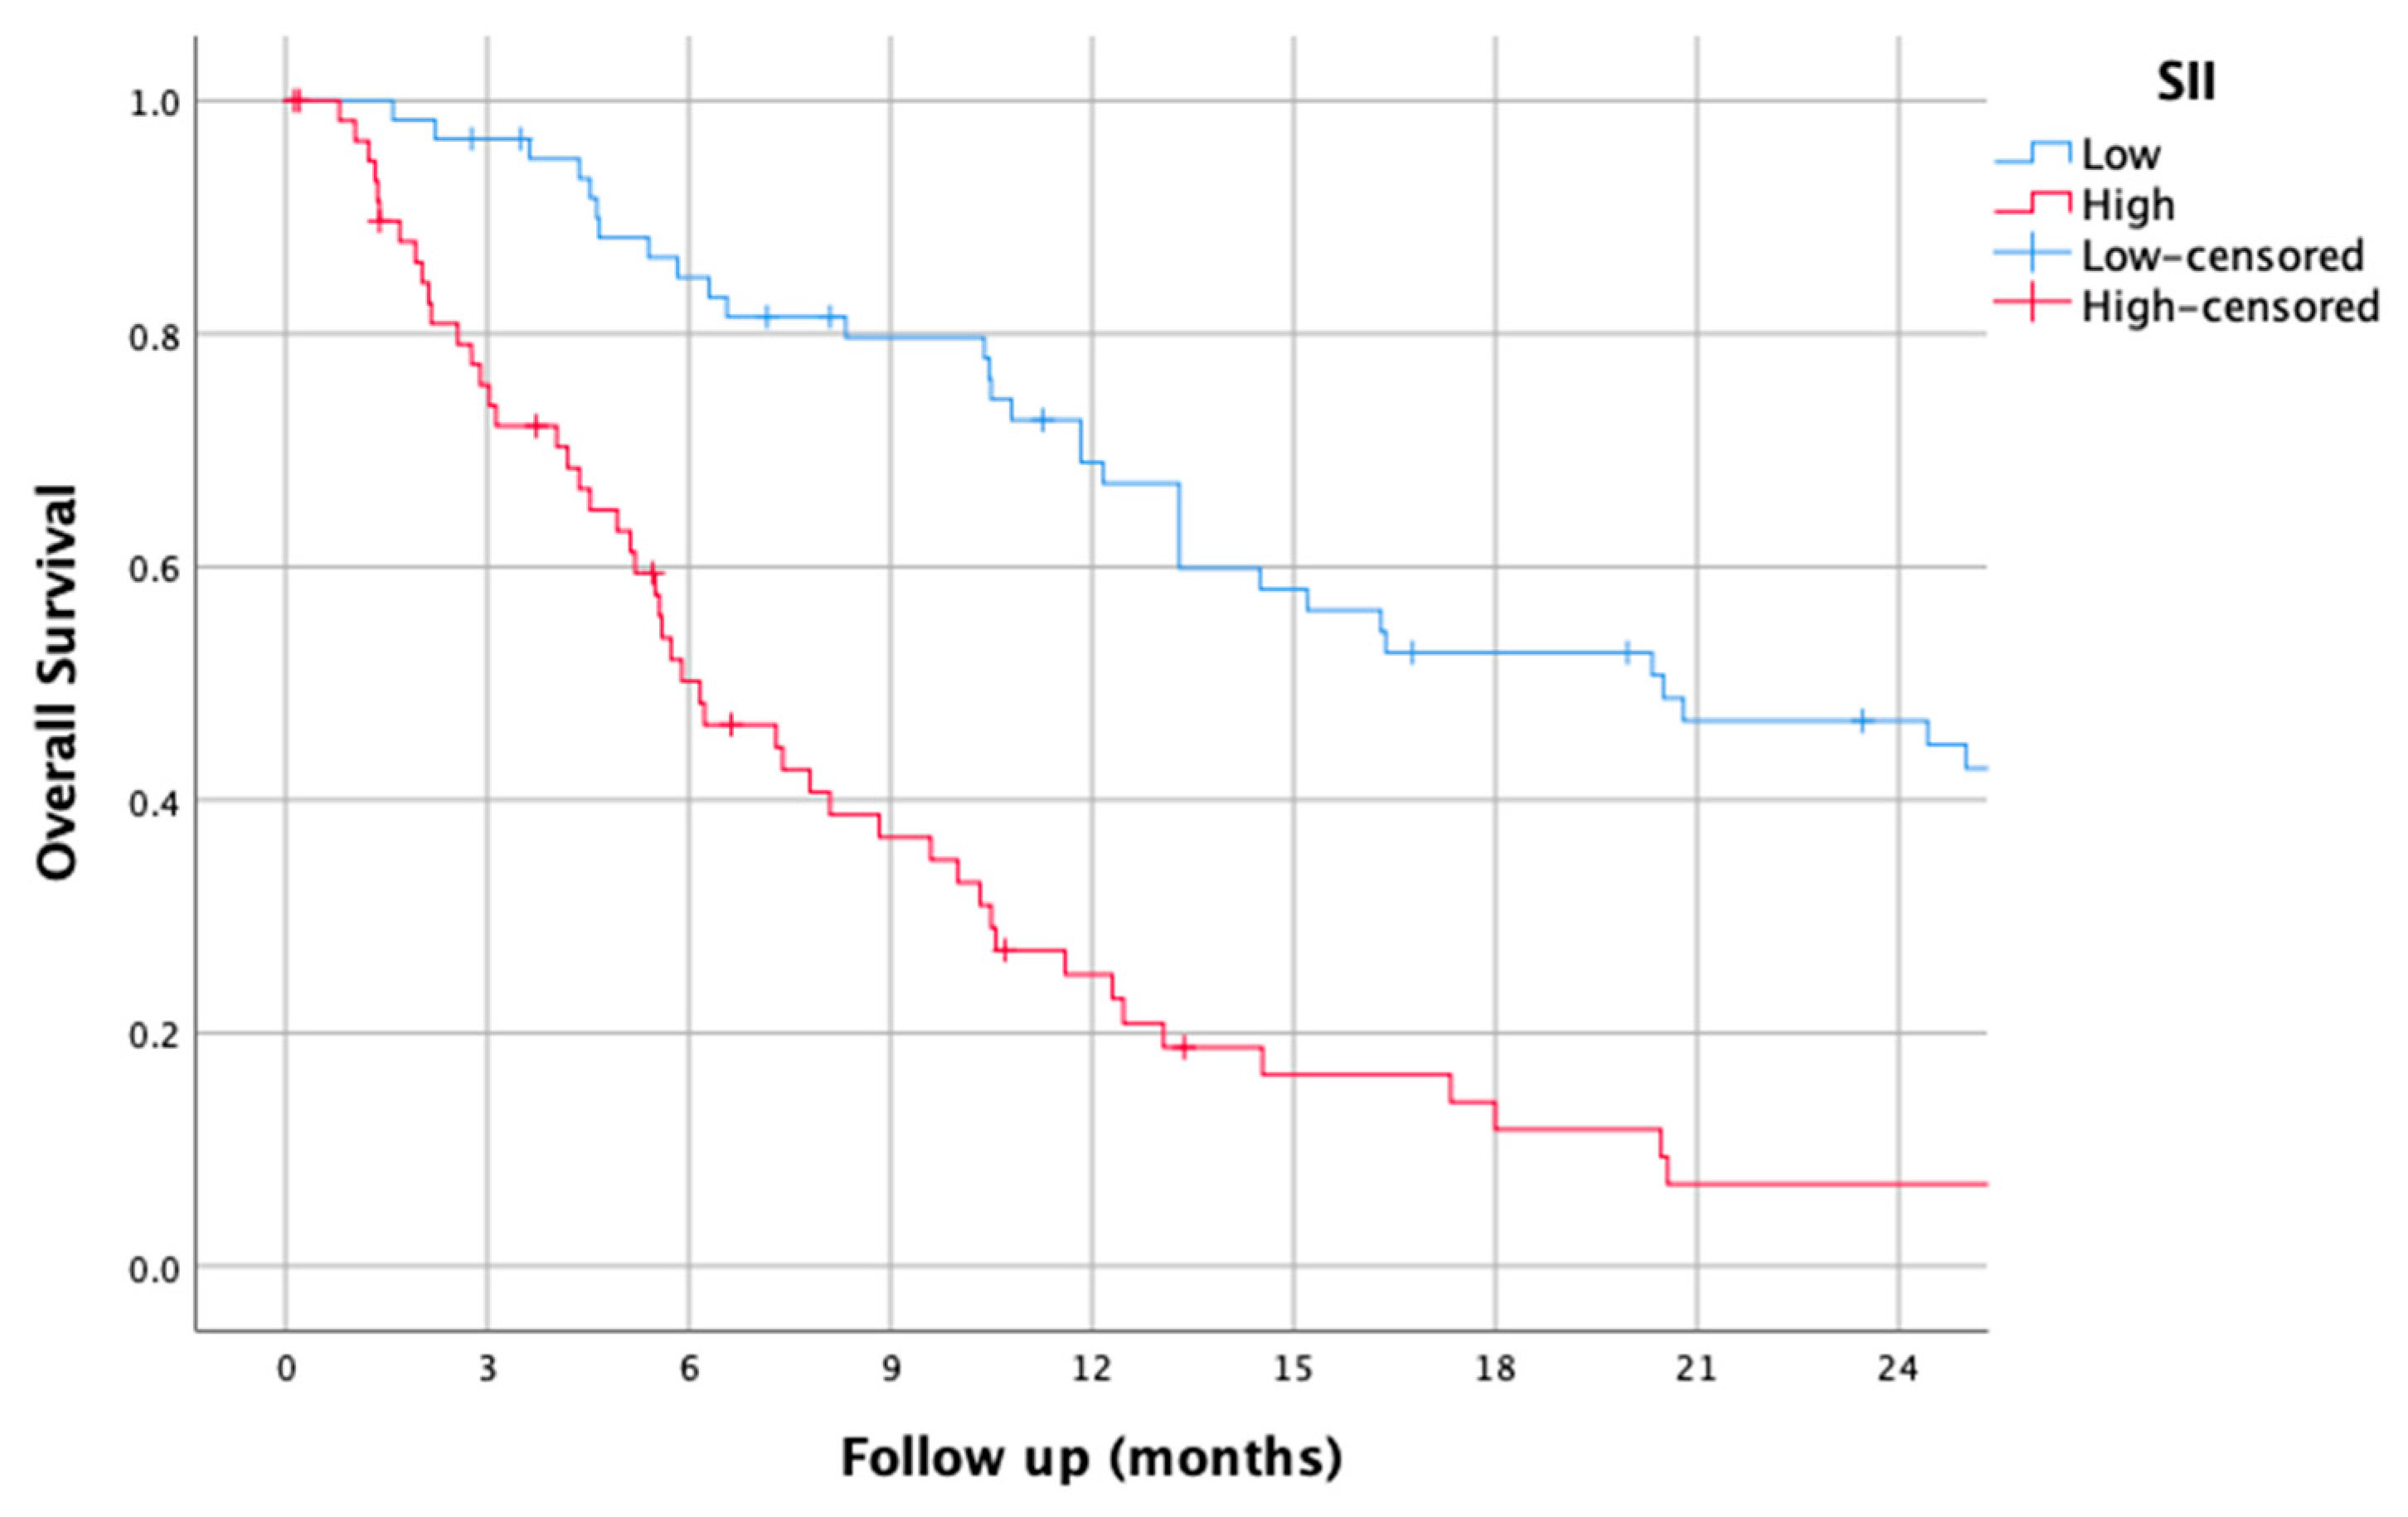
3.5. SII
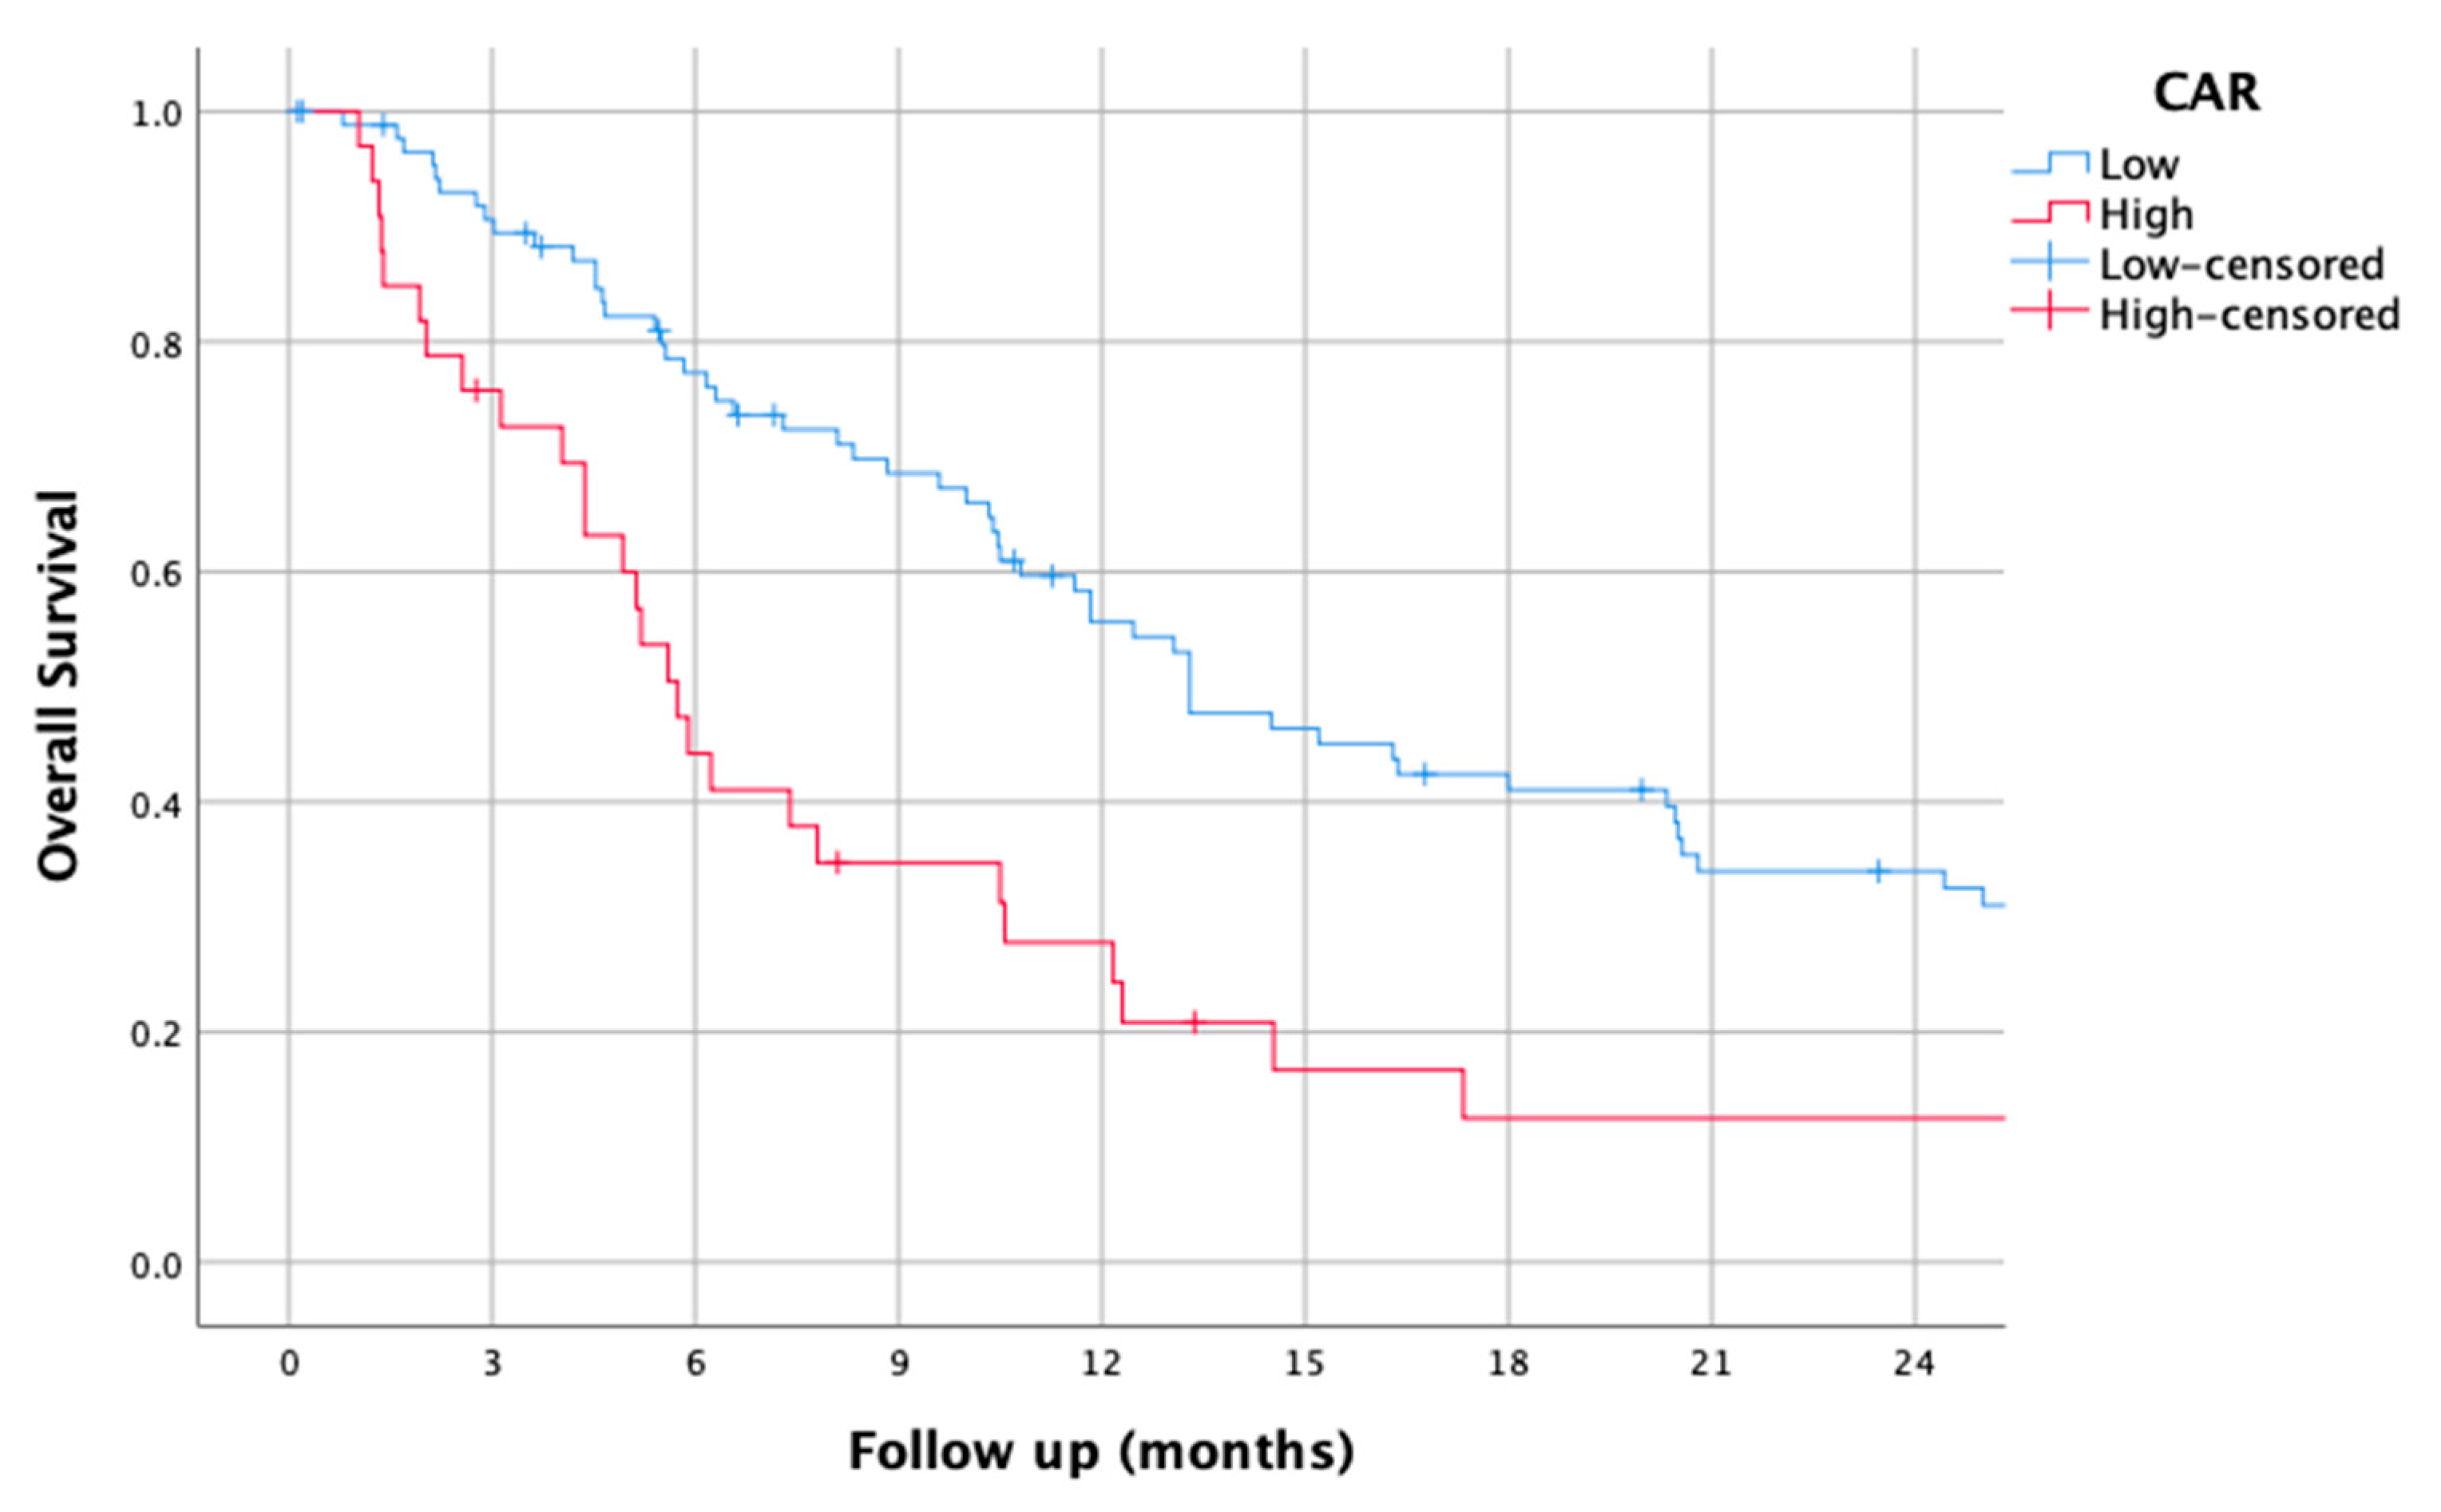
3.6. CAR
3.7. PNI
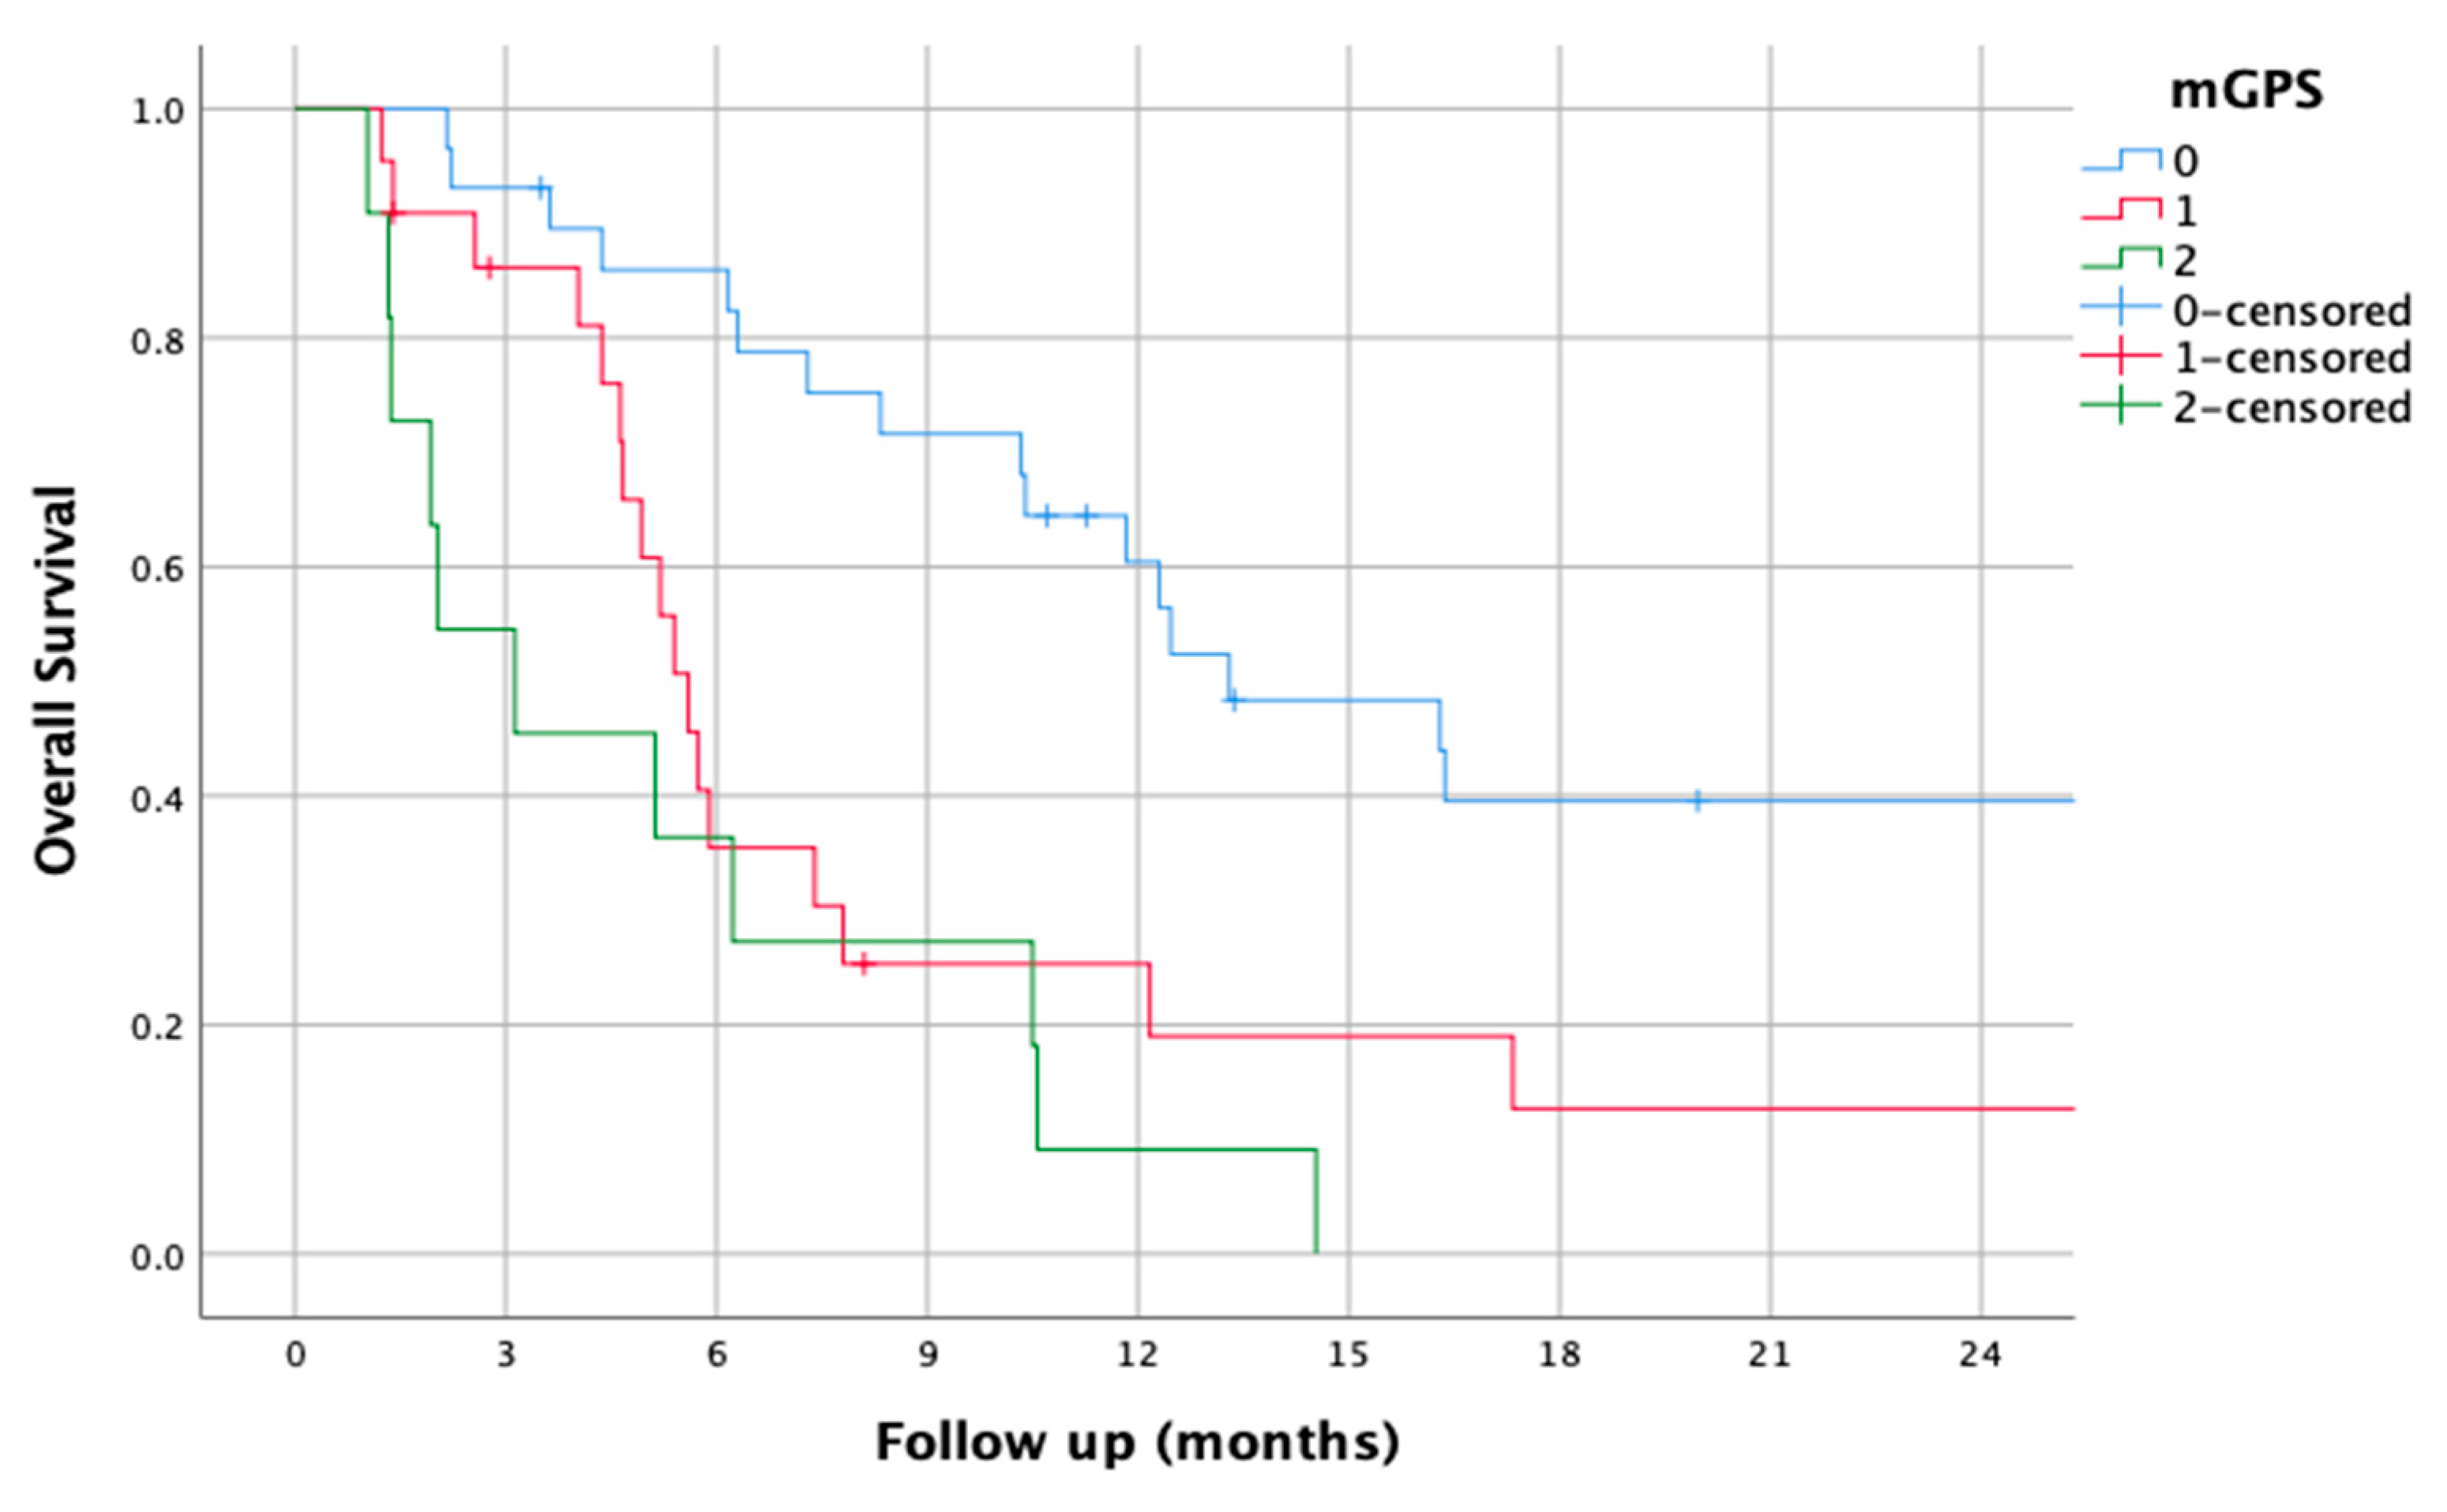
3.8. mGPS
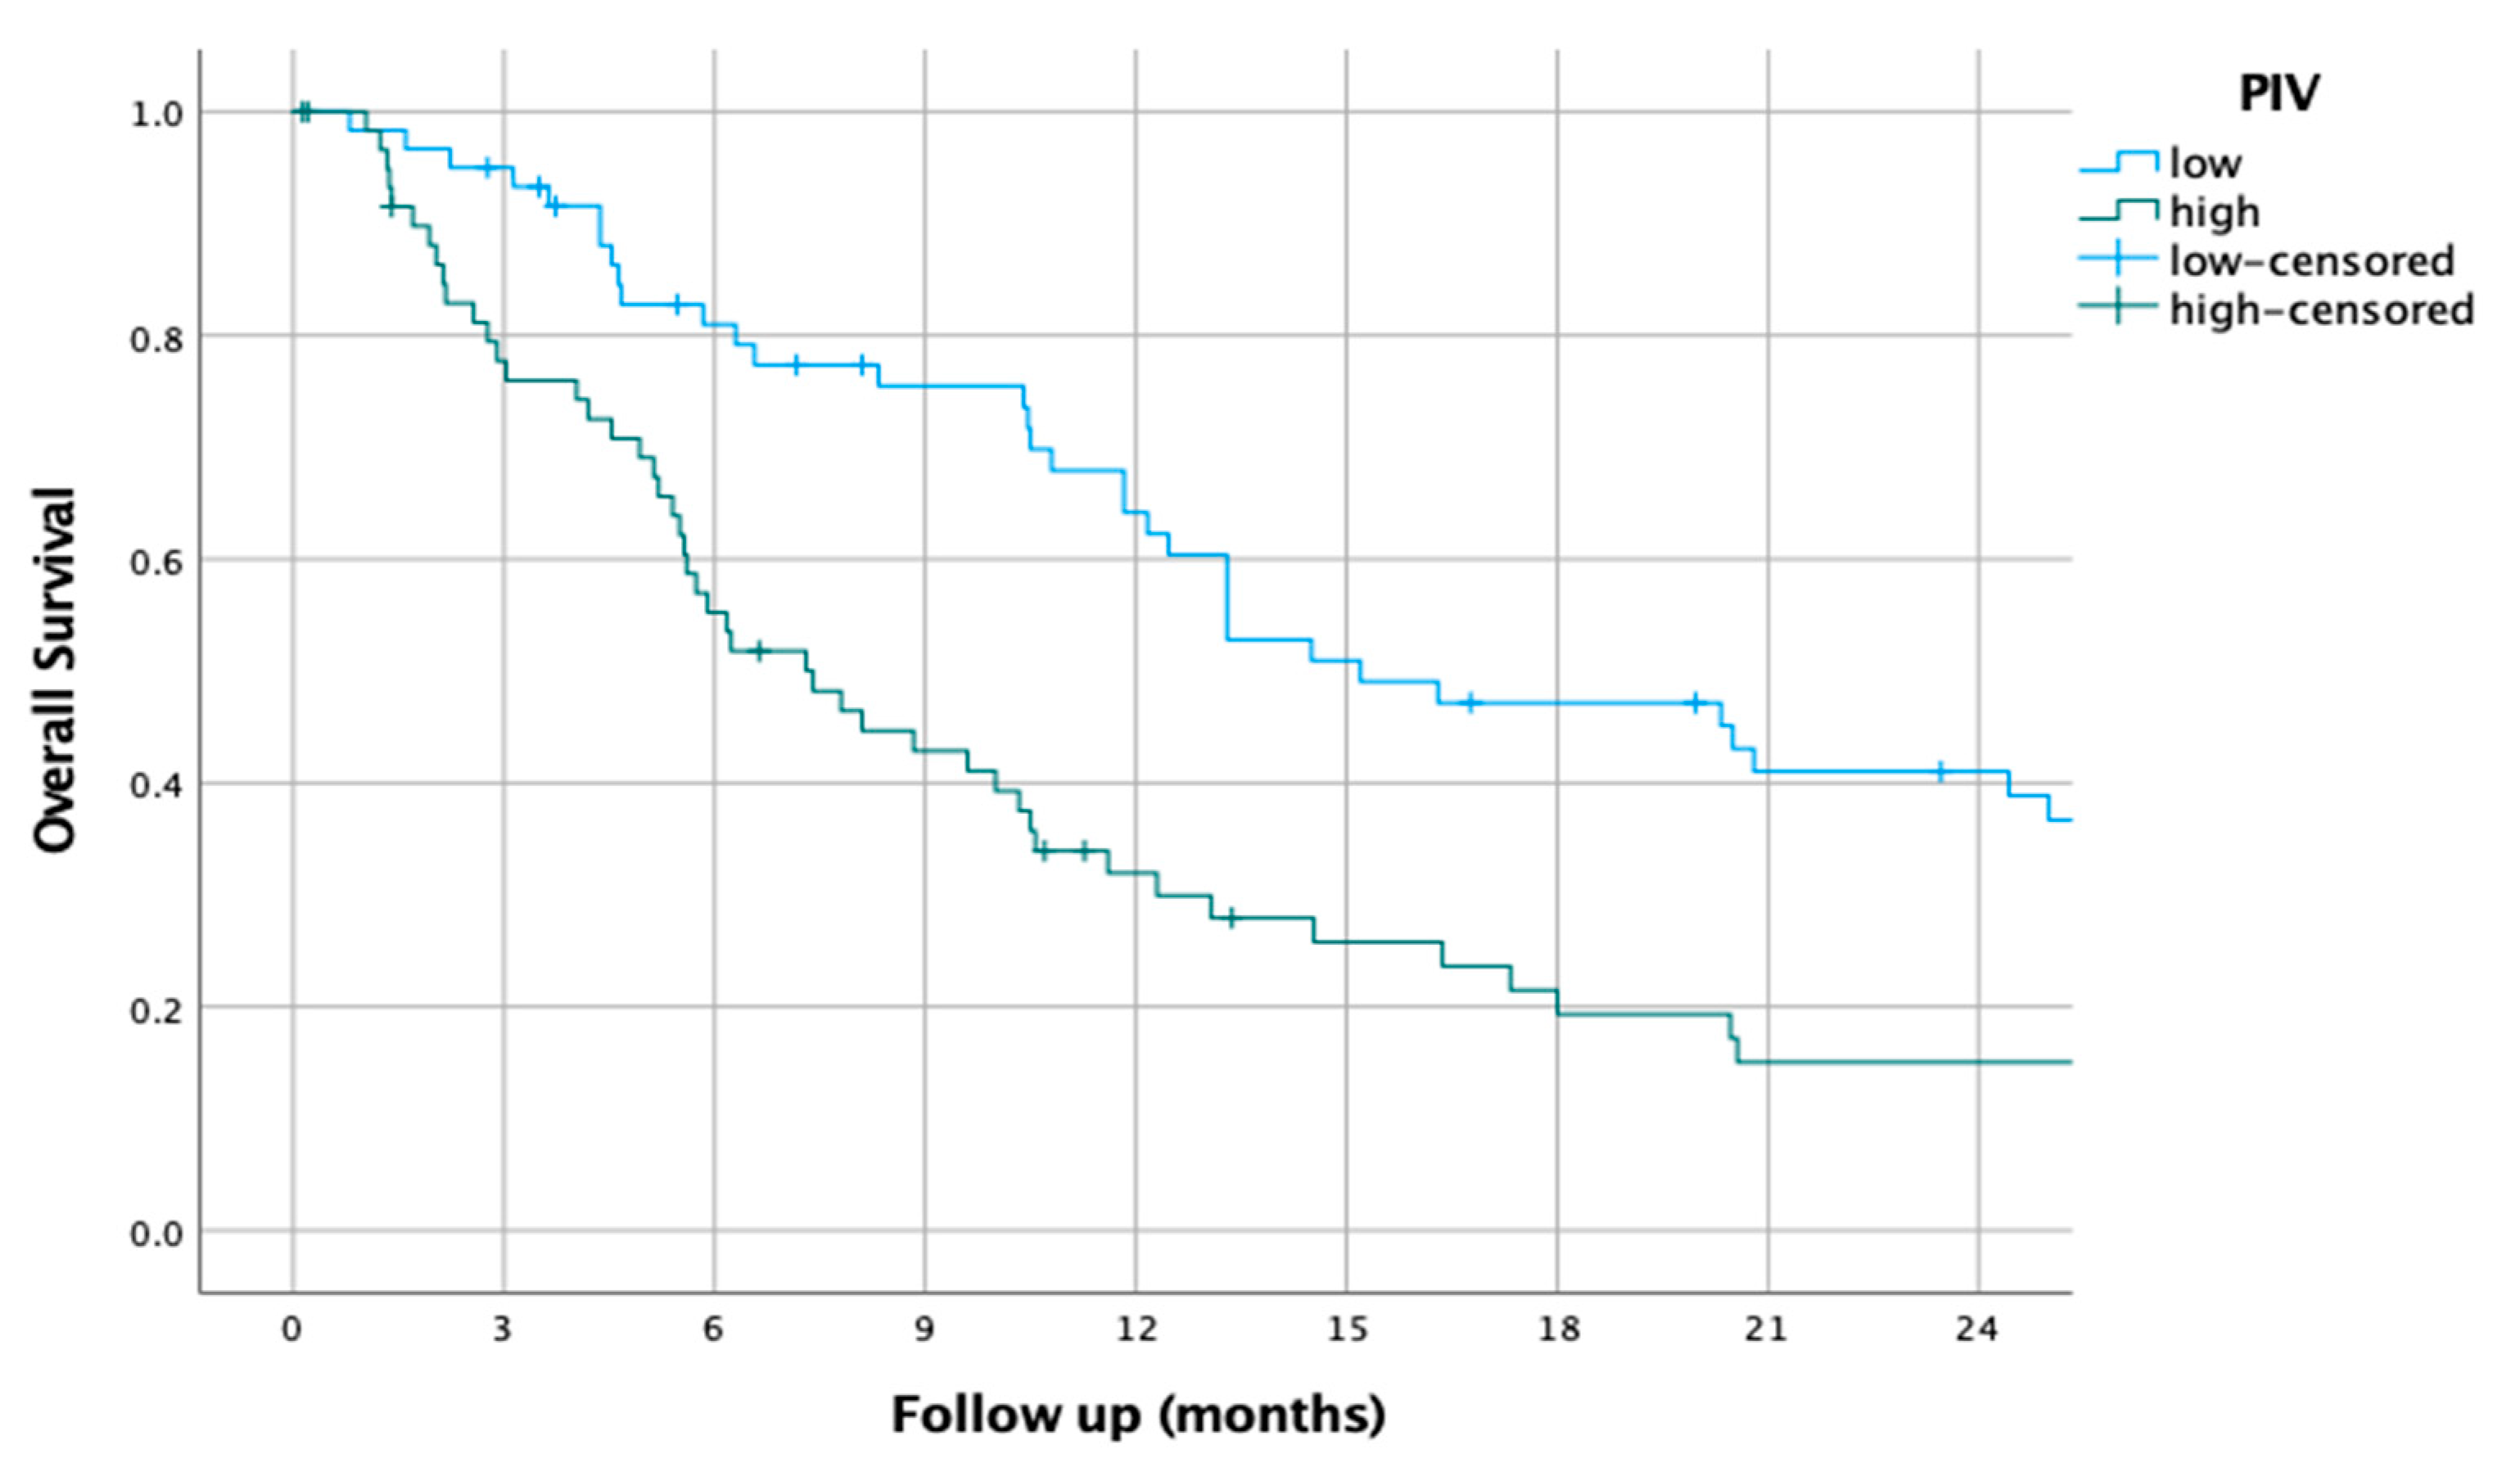
3.9. PIV
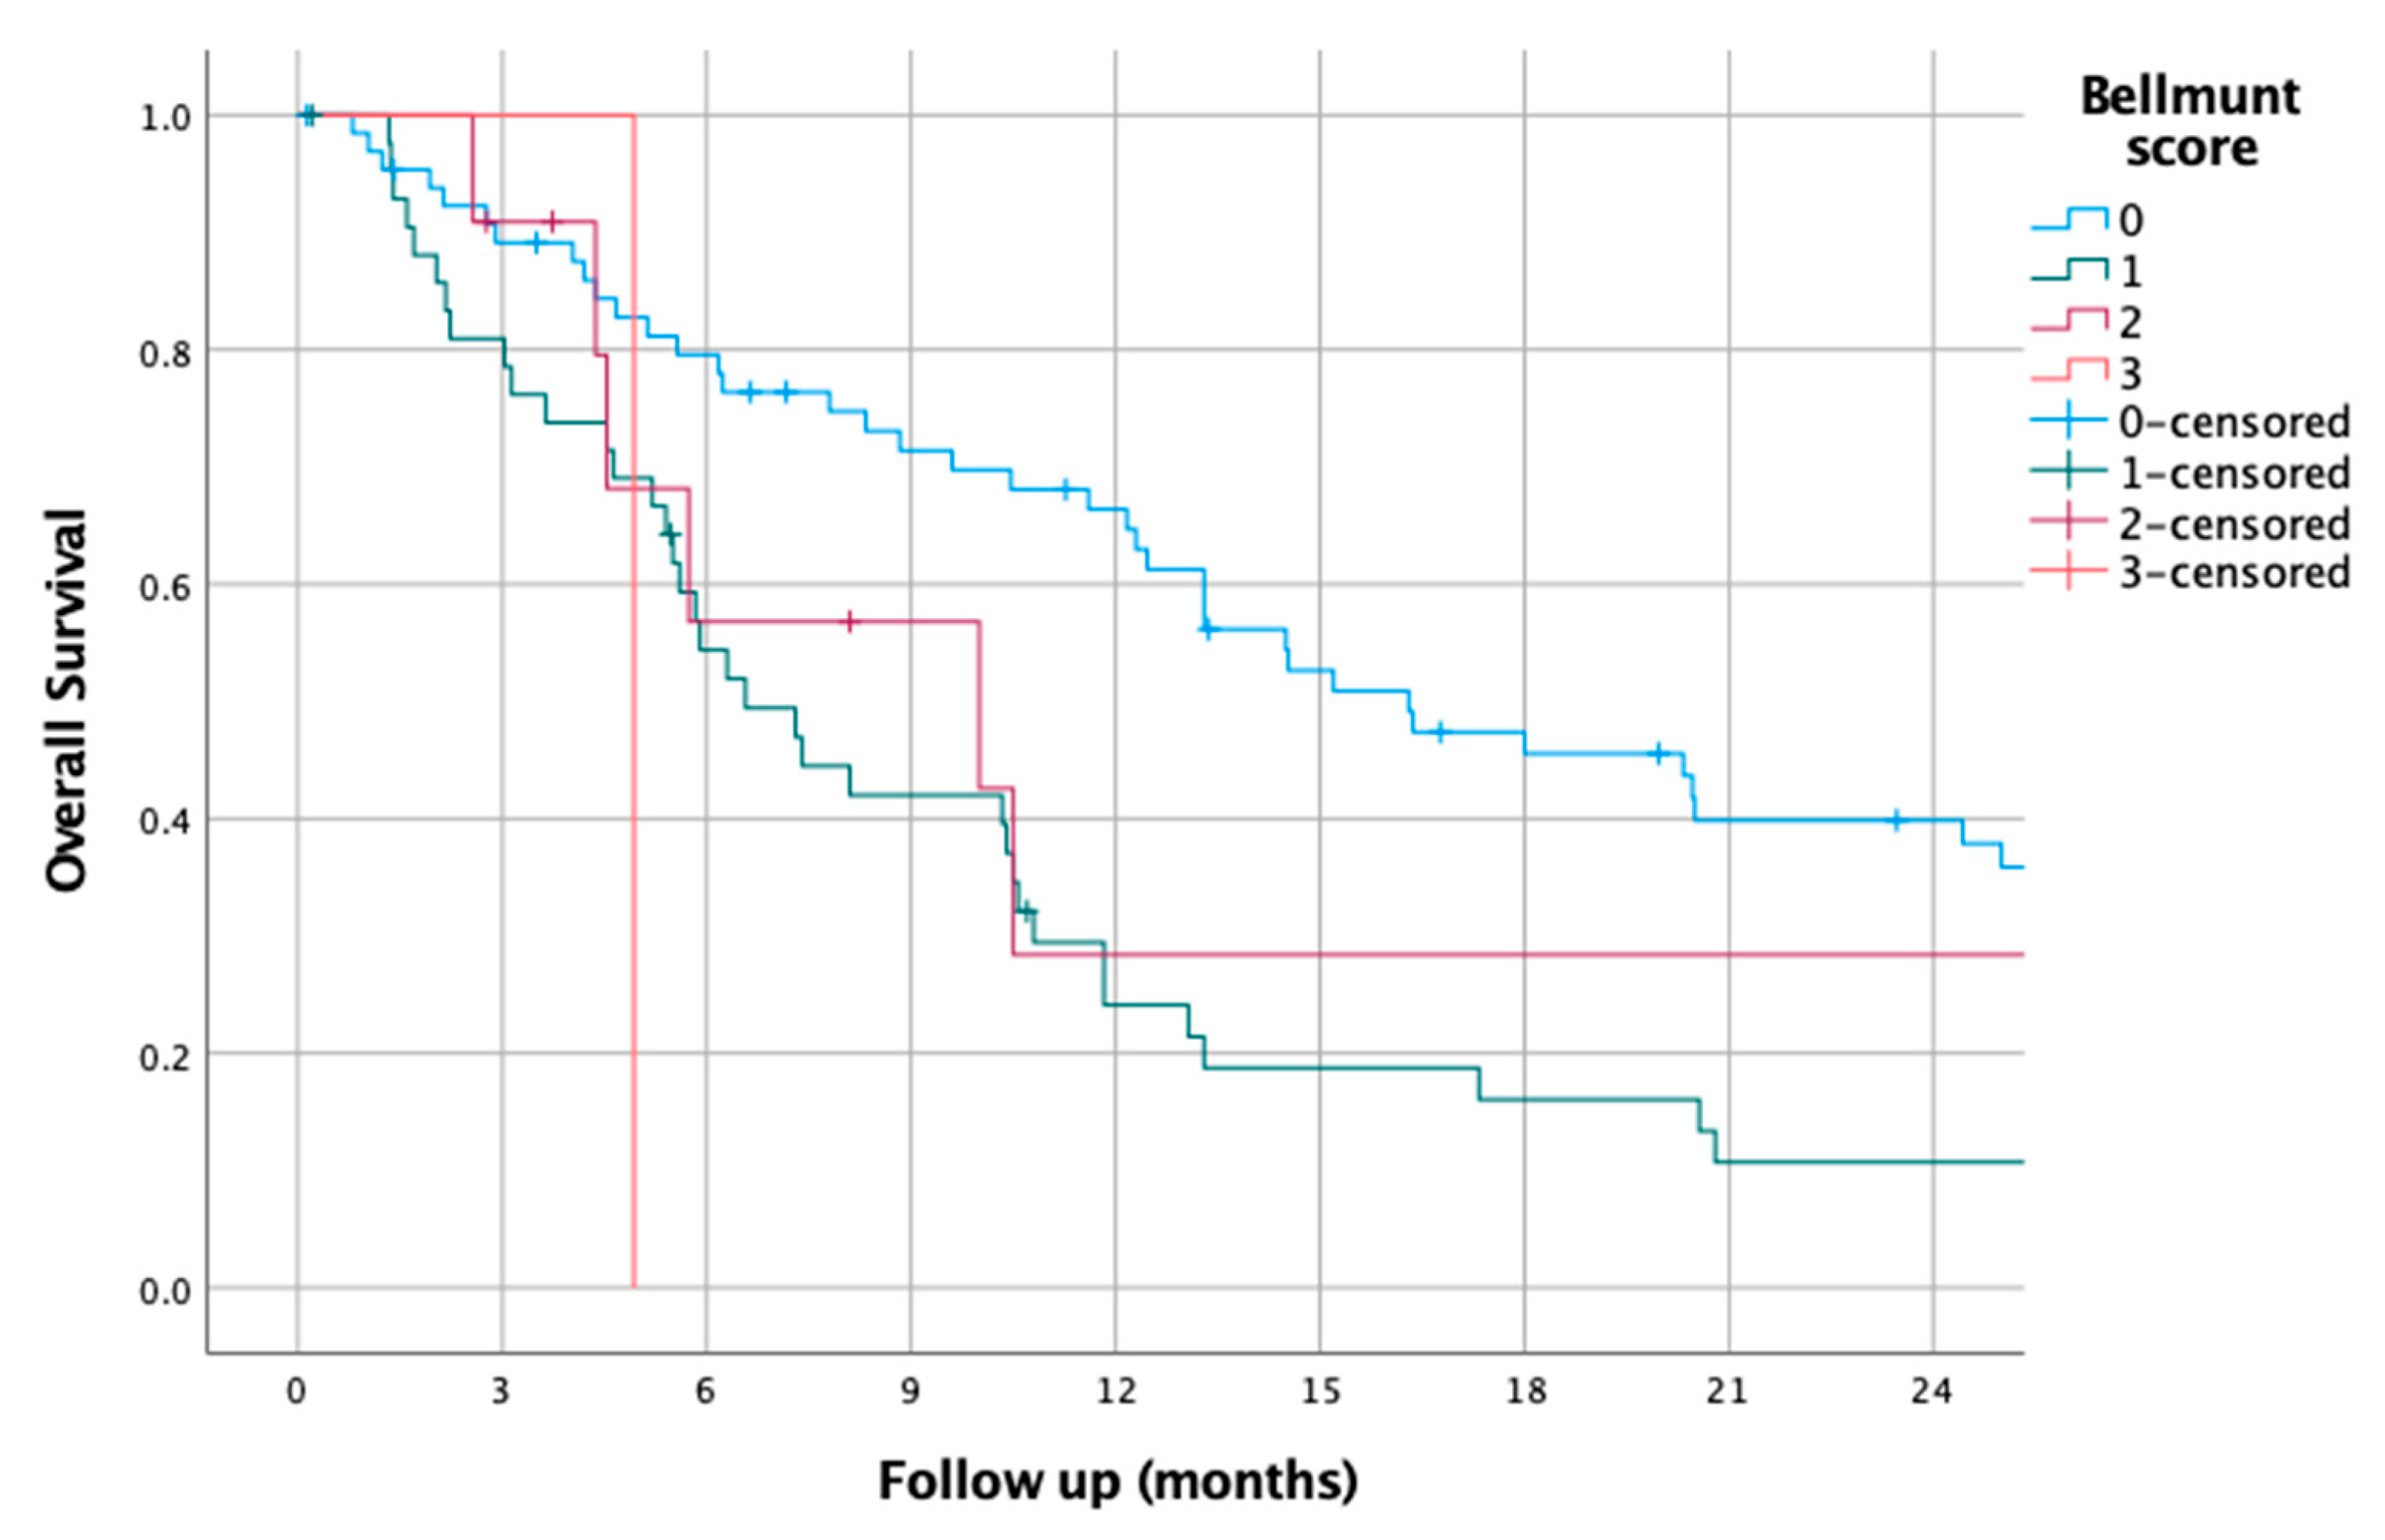
3.10. Bellmunt Score
4. Discussion
Author Contributions
Funding
Institutional Review Board Statement
Informed Consent Statement
Data Availability Statement
Conflicts of Interest
References
- Saginala, K.; Barsouk, A.; Aluru, J.S.; Rawla, P.; Padala, S.A.; Barsouk, A. Epidemiology of Bladder Cancer. Med. Sci. 2020, 8, 15. [Google Scholar] [CrossRef] [PubMed]
- Sung, H.; Ferlay, J.; Siegel, R.L.; Laversanne, M.; Soerjomataram, I.; Jemal, A.; Bray, F. Global Cancer Statistics 2020: GLOBOCAN Estimates of Incidence and Mortality Worldwide for 36 Cancers in 185 Countries. CA Cancer J. Clin. 2021, 71, 209–249. [Google Scholar] [CrossRef] [PubMed]
- Beigi, A.; Vafaei-Nodeh, S.; Huang, L.; Sun, S.Z.; Ko, J.J. Survival Outcomes Associated with First and Second-Line Palliative Systemic Therapies in Patients with Metastatic Bladder Cancer. Curr. Oncol. 2021, 28, 3812–3824. [Google Scholar] [CrossRef] [PubMed]
- Bellmunt, J.; Choueiri, T.K.; Fougeray, R.; Schutz, F.A.; Salhi, Y.; Winquist, E.; Culine, S.; von der Maase, H.; Vaughn, D.J.; Rosenberg, J.E. Prognostic factors in patients with advanced transitional cell carcinoma of the urothelial tract experiencing treatment failure with platinum-containing regimens. J. Clin. Oncol. 2010, 28, 1850–1855. [Google Scholar] [CrossRef]
- Yildirim, H.C.; Guven, D.C.; Aktepe, O.H.; Taban, H.; Yilmaz, F.; Yasar, S.; Aksoy, S.; Erman, M.; Kilickap, S.; Yalcin, S. Blood Based Biomarkers as Predictive Factors for Hyperprogressive Disease. J. Clin. Med. 2022, 11, 5171. [Google Scholar] [CrossRef]
- Guven, D.C.; Sahin, T.K.; Erul, E.; Cakir, I.Y.; Ucgul, E.; Yildirim, H.C.; Aktepe, O.H.; Erman, M.; Kilickap, S.; Aksoy, S.; et al. The Association between Early Changes in Neutrophil-Lymphocyte Ratio and Survival in Patients Treated with Immunotherapy. J. Clin. Med. 2022, 11, 4523. [Google Scholar] [CrossRef]
- Sudoł, D.; Widz, D.; Mitura, P.; Płaza, P.; Godzisz, M.; Kuliniec, I.; Yadlos, A.; Cabanek, M.; Bar, M.; Bar, K. Neutrophil-to-lymphocyte ratio as a predictor of overall survival and cancer advancement in patients undergoing radical cystectomy for bladder cancer. Cent. Eur. J. Urol. 2022, 75, 41–46. [Google Scholar] [CrossRef]
- Rajwa, P.; Życzkowski, M.; Paradysz, A.; Bujak, K.; Bryniarski, P. Evaluation of the prognostic value of LMR, PLR, NLR, and dNLR in urothelial bladder cancer patients treated with radical cystectomy. Eur. Rev. Med. Pharmacol. Sci. 2018, 22, 3027–3037. [Google Scholar] [CrossRef]
- Dalpiaz, O.; Pichler, M.; Mannweiler, S.; Martín Hernández, J.M.; Stojakovic, T.; Pummer, K.; Zigeuner, R.; Hutterer, G.C. Validation of the pretreatment derived neutrophil-lymphocyte ratio as a prognostic factor in a European cohort of patients with upper tract urothelial carcinoma. Br. J. Cancer 2014, 110, 2531–2536. [Google Scholar] [CrossRef]
- Russo, P.; Palermo, G.; Iacovelli, R.; Ragonese, M.; Ciccarese, C.; Maioriello, G.; Fantasia, F.; Bizzarri, F.P.; Marino, F.; Moosavi, K.; et al. Comparison of PIV and Other Immune Inflammation Markers of Oncological and Survival Outcomes in Patients Undergoing Radical Cystectomy. Cancers 2024, 16, 651. [Google Scholar] [CrossRef]
- Wu, M.; Zhou, Y.; Chen, Q.; Yu, Z.; Gu, H.; Lin, P.; Li, Y.; Liu, C. Prognostic Role of Pretreatment C-Reactive Protein to Albumin Ratio in Urological Cancers: A Systematic Review and Meta-Analysis. Front. Oncol. 2022, 12, 879803. [Google Scholar] [CrossRef] [PubMed]
- Zhang, W.; Wang, R.; Ma, W.; Wu, Y.; Maskey, N.; Guo, Y.; Liu, J.; Mao, S.; Zhang, J.; Yao, X.; et al. Systemic immune-inflammation index predicts prognosis of bladder cancer patients after radical cystectomy. Ann. Transl. Med. 2019, 7, 431. [Google Scholar] [CrossRef] [PubMed]
- Kikuchi, K.; Nakamura, R.; Segawa, T.; Oikawa, H.; Ariga, H. Modified Glasgow prognostic score can predict survival of muscle invasive bladder cancer patients after radiotherapy. J. Radiat. Res. 2020, 61, 616–621. [Google Scholar] [CrossRef]
- Nagai, T.; Naiki, T.; Isobe, T.; Sugiyama, Y.; Etani, T.; Iida, K.; Nozaki, S.; Noda, Y.; Shimizu, N.; Tasaki, Y.; et al. Modified Glasgow Prognostic Score 2 as a Prognostic Marker in Patients with Metastatic Urothelial Carcinoma. In Vivo 2021, 35, 2793–2800. [Google Scholar] [CrossRef]
- Kim, H.S.; Ku, J.H. Systemic Inflammatory Response Based on Neutrophil-to-Lymphocyte Ratio as a Prognostic Marker in Bladder Cancer. Dis. Markers 2016, 2016, 8345286. [Google Scholar] [CrossRef]
- Zhao, H.; Wu, L.; Yan, G.; Chen, Y.; Zhou, M.; Wu, Y.; Li, Y. Inflammation and tumor progression: Signaling pathways and targeted intervention. Signal Transduct. Target. Ther. 2021, 6, 263. [Google Scholar] [CrossRef] [PubMed]
- Bao, Y.; Wang, Y.; Li, X.; Pan, M.; Zhang, H.; Cheng, Z.; Wang, X. Prognostic significance of platelet-to-lymphocyte ratio in urothelial carcinoma patients: A meta-analysis. Cancer Cell Int. 2019, 19, 315. [Google Scholar] [CrossRef]
- Karan, C.; Yaren, A.; Demirel, B.C.; Dogan, T.; Ozdemir, M.; Demiray, A.G.; Taskoylu, B.Y.; Degirmencioglu, S.; Dogu, G.; Ozhan, N.; et al. Pretreatment PLR Is Preferable to NLR and LMR as a Predictor in Locally Advanced and Metastatic Bladder Cancer. Cancer Diagn. Progn. 2023, 3, 706–715. [Google Scholar] [CrossRef]
- Jan, H.C.; Wu, K.Y.; Tai, T.Y.; Weng, H.Y.; Yang, W.H.; Ou, C.H.; Hu, C.Y. The Systemic Immune-Inflammation Index (SII) Increases the Prognostic Significance of Lymphovascular Invasion in Upper Tract Urothelial Carcinoma After Radical Nephroureterectomy. Cancer Manag. Res. 2022, 14, 3139–3149. [Google Scholar] [CrossRef]
- Russo, P.; Marino, F.; Rossi, F.; Bizzarri, F.P.; Ragonese, M.; Dibitetto, F.; Filomena, G.B.; Marafon, D.P.; Ciccarese, C.; Iacovelli, R.; et al. Is Systemic Immune-Inflammation Index a Real Non-Invasive Biomarker to Predict Oncological Outcomes in Patients Eligible for Radical Cystectomy? Medicina 2023, 59, 2063. [Google Scholar] [CrossRef]
- Brown, J.T.; Liu, Y.; Shabto, J.M.; Martini, D.J.; Ravindranathan, D.; Hitron, E.E.; Russler, G.A.; Caulfield, S.; Yantorni, L.B.; Joshi, S.S.; et al. Baseline Modified Glasgow Prognostic Score Associated with Survival in Metastatic Urothelial Carcinoma Treated with Immune Checkpoint Inhibitors. Oncologist 2021, 26, 397–405. [Google Scholar] [CrossRef] [PubMed]
- Luan, C.W.; Tsai, Y.T.; Yang, H.Y.; Chen, K.Y.; Chen, P.H.; Chou, H.H. Pretreatment prognostic nutritional index as a prognostic marker in head and neck cancer: A systematic review and meta-analysis. Sci. Rep. 2021, 11, 17117. [Google Scholar] [CrossRef] [PubMed]
- Peng, D.; Gong, Y.Q.; Hao, H.; He, Z.S.; Li, X.S.; Zhang, C.J.; Zhou, L.Q. Preoperative Prognostic Nutritional Index is a Significant Predictor of Survival with Bladder Cancer after Radical Cystectomy: A retrospective study. BMC Cancer 2017, 17, 391. [Google Scholar] [CrossRef]
- Abuhelwa, A.Y.; Bellmunt, J.; Kichenadasse, G.; McKinnon, R.A.; Rowland, A.; Sorich, M.J.; Hopkins, A.M. Enhanced Bellmunt Risk Score for Survival Prediction in Urothelial Carcinoma Treated with Immunotherapy. Clin. Genitourin Cancer 2022, 20, 132–138. [Google Scholar] [CrossRef]
- Nardelli, C.; Aveta, A.; Pandolfo, S.D.; Tripodi, L.; Russo, F.; Imbimbo, C.; Castaldo, G.; Pastore, L. Microbiome Profiling in Bladder Cancer Patients Using the First-morning Urine Sample. Eur. Urol. Open Sci. 2024, 59, 18–26. [Google Scholar] [CrossRef]


| Variables | n or Median (Min–Max) |
|---|---|
| Age (years) | 67.7 (39.71–93.9) |
| Age group | |
| <70 | 79 (60.39) |
| >70 | 52 (39.7) |
| Gender | |
| Female | 17 (12.8) |
| Male | 116 (87.2) |
| ECOG | |
| 0–1 | 116 (87.9) |
| 2–3 | 16 (12.1) |
| BMI | 25.26 (17.17–41.4) |
| WBC | 8.2 (3.4–22.4) |
| Hgb | 11.9 (7.2–16.4) |
| Lymphocytes | 1.6 (0.1–4.6) |
| Neutrophils | 5.4 (2.1–20.8) |
| Monocytes | 0.6 (0.1–1.65) |
| Platelets | 283 (92–635) |
| Albumin | 3.8 (1.99–4.79) |
| Globulin | 3.28 (1.77–4.71) |
| CRP | 3.47 (0.15–46.3) |
| PFS | 5.98 (0.1–35.6) |
| OS | 10.4 (0.13–89.4) |
| Deceased | |
| No | 29 (21.8) |
| Yes | 104 (78.2) |
| Biomarker | HR | 95% CI for HR | p-Value |
|---|---|---|---|
| Bellmunt score | 1.064 | 0.71–1.6 | 0.76 |
| SII | 2.170 | 0.55–8.6 | 0.27 |
| PLR | 0.670 | 0.23–1.95 | 0.46 |
| NLR | 1.530 | 0.37–6.4 | 0.56 |
| dNLR | 0.944 | 0.34–2.6 | 0.91 |
| LMR | 0.480 | 0.18–1.29 | 0.14 |
| PIV | 0.484 | 0.16–1.5 | 0.203 |
| AGR | 0.509 | 0.2–1.15 | 0.1 |
| CAR | 0.603 | 0.2–1.6 | 0.32 |
| mGPS | 1.984 | 1.16–3.4 | 0.013 |
| PNI | 1.001 | 0.99–1.008 | 0.87 |
Disclaimer/Publisher’s Note: The statements, opinions and data contained in all publications are solely those of the individual author(s) and contributor(s) and not of MDPI and/or the editor(s). MDPI and/or the editor(s) disclaim responsibility for any injury to people or property resulting from any ideas, methods, instructions or products referred to in the content. |
© 2025 by the authors. Licensee MDPI, Basel, Switzerland. This article is an open access article distributed under the terms and conditions of the Creative Commons Attribution (CC BY) license (https://creativecommons.org/licenses/by/4.0/).
Share and Cite
Kus, F.; Guven, D.C.; Yildirim, H.C.; Chalabiyev, E.; Koc, I.; Tatar, O.D.; Sirvan, F.; Sahin, Y.B.; Karaca, E.; Kabukcu, F.; et al. Comparative Analysis of Prognostic Potential of Pretreatment Blood-Based Biomarkers in Metastatic Bladder Cancer: Modified Glasgow Prognostic Score. J. Clin. Med. 2025, 14, 1954. https://doi.org/10.3390/jcm14061954
Kus F, Guven DC, Yildirim HC, Chalabiyev E, Koc I, Tatar OD, Sirvan F, Sahin YB, Karaca E, Kabukcu F, et al. Comparative Analysis of Prognostic Potential of Pretreatment Blood-Based Biomarkers in Metastatic Bladder Cancer: Modified Glasgow Prognostic Score. Journal of Clinical Medicine. 2025; 14(6):1954. https://doi.org/10.3390/jcm14061954
Chicago/Turabian StyleKus, Fatih, Deniz Can Guven, Hasan Cagri Yildirim, Elvin Chalabiyev, Ilgin Koc, Omer Denizhan Tatar, Firat Sirvan, Yigit Berk Sahin, Ece Karaca, Furkan Kabukcu, and et al. 2025. "Comparative Analysis of Prognostic Potential of Pretreatment Blood-Based Biomarkers in Metastatic Bladder Cancer: Modified Glasgow Prognostic Score" Journal of Clinical Medicine 14, no. 6: 1954. https://doi.org/10.3390/jcm14061954
APA StyleKus, F., Guven, D. C., Yildirim, H. C., Chalabiyev, E., Koc, I., Tatar, O. D., Sirvan, F., Sahin, Y. B., Karaca, E., Kabukcu, F., Bay, B. A., Kavruk, O., & Erman, M. (2025). Comparative Analysis of Prognostic Potential of Pretreatment Blood-Based Biomarkers in Metastatic Bladder Cancer: Modified Glasgow Prognostic Score. Journal of Clinical Medicine, 14(6), 1954. https://doi.org/10.3390/jcm14061954