
The Burden of Diabetic Foot Ulcers on Hospital Admissions and Costs in Romania


Abstract
:1. Introduction
2. Materials and Methods
2.1. Data Source and Study Sample
2.2. Costs of Hospitalization
2.3. Statistical Analysis
3. Results
3.1. Study Sample
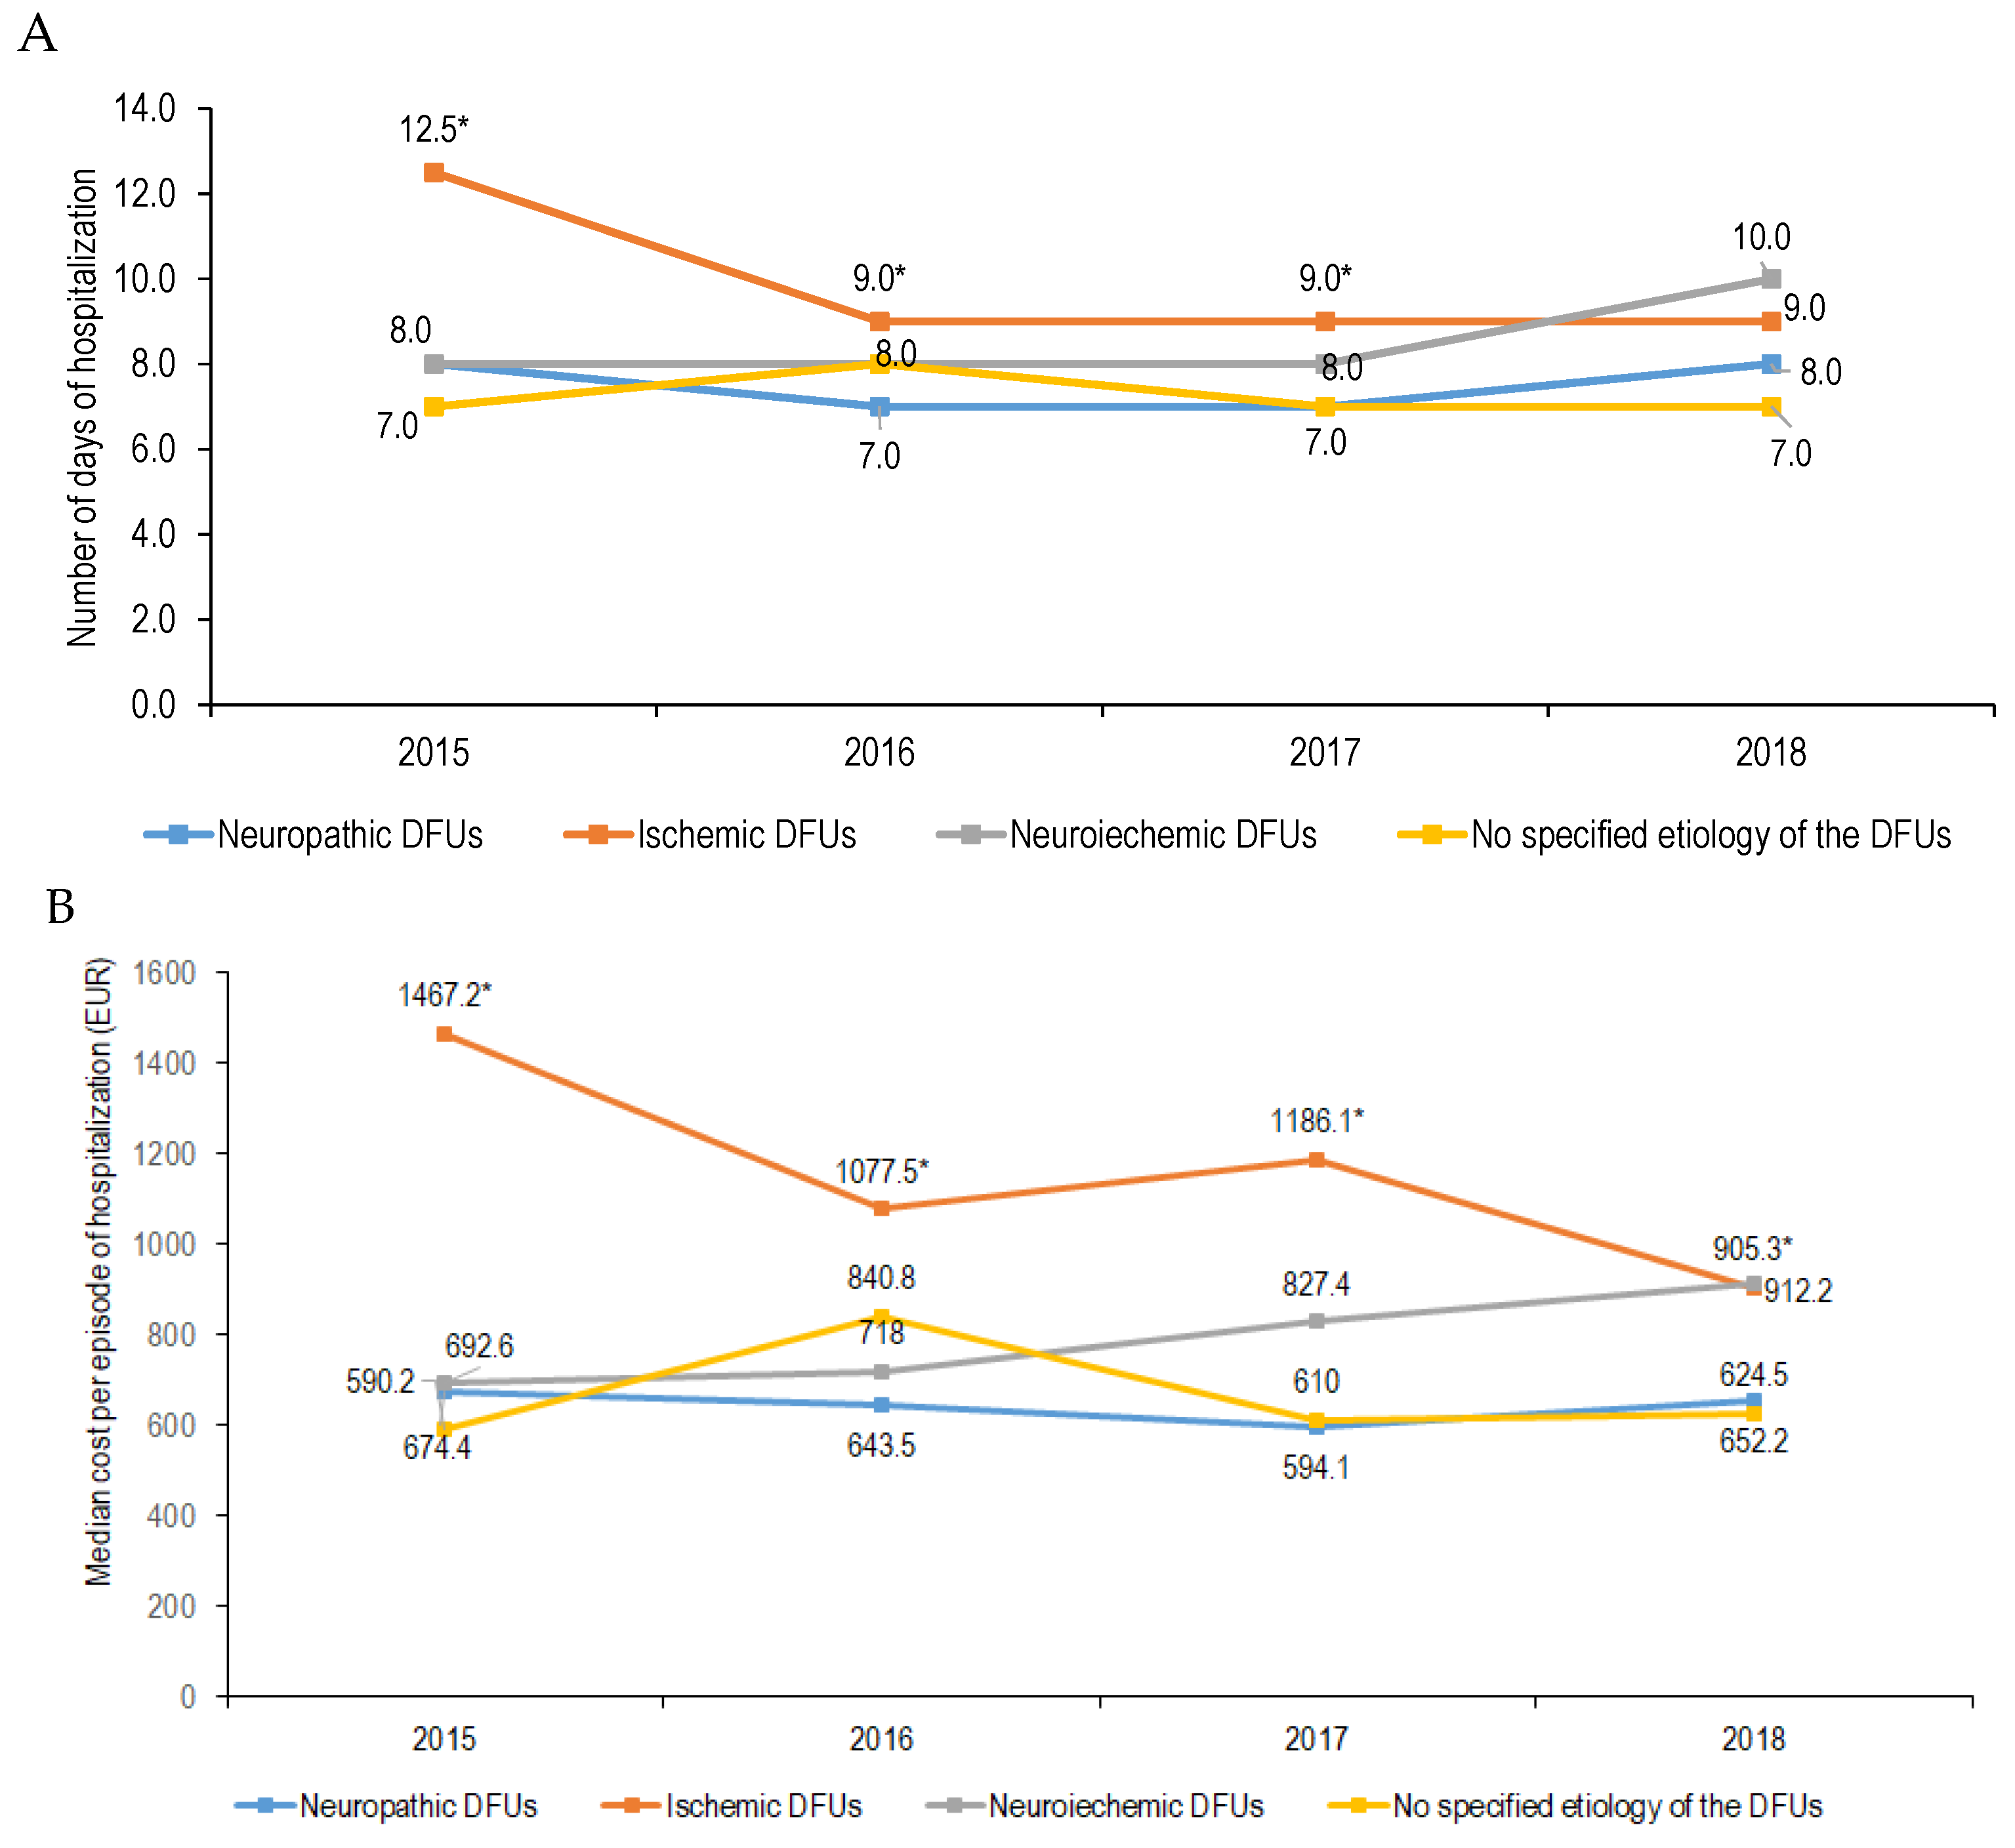
3.2. Length of Hospital Stay for Foot Ulcers
3.3. Cost of Hospitalization During the Analyzed Period for Foot Ulcers
4. Discussion
5. Conclusions
Supplementary Materials
Author Contributions
Funding
Institutional Review Board Statement
Informed Consent Statement
Data Availability Statement
Conflicts of Interest
References
- International Diabetes Federation. IDF Diabetes Atlas, 10th ed.; International Diabetes Federation: Brussels, Belgium, 2021. [Google Scholar]
- Amin, N.; Doupis, J. Diabetic foot disease: From the evaluation of the “foot at risk” to the novel diabetic ulcer treatment modalities. World J. Diabetes 2016, 7, 153–164. [Google Scholar] [CrossRef] [PubMed]
- American Diabetes Association. Economic costs of diabetes in the U.S. in 2012. Diabetes Care 2013, 36, 1033–1046. [Google Scholar] [CrossRef] [PubMed]
- Zhang, Y.; Lazzarini, P.A.; McPhail, S.M.; van Netten, J.J.; Armstrong, D.G.; Pacella, R.E. Global Disability Burdens of Diabetes-Related Lower-Extremity Complications in 1990 and 2016. Diabetes Care 2020, 43, 964–974. [Google Scholar] [CrossRef]
- Jodheea-Jutton, A.; Hindocha, S.; Bhaw-Luximon, A. Health economics of diabetic foot ulcer and recent trends to accelerate treatment. Foot 2022, 52, 101909. [Google Scholar] [CrossRef]
- Driver, V.R.; Fabbi, M.; Lavery, L.A.; Gibbons, G. The costs of diabetic foot: The economic case for the limb salvage team. J. Vasc. Surg. 2010, 52 (Suppl. S3), 17S–22S. [Google Scholar] [CrossRef]
- Sima, D.I.; Bondor, C.I.; Vereşiu, I.A.; Gâvan, N.A.; Borzan, C.M. Hospitalization Costs of Lower Limb Ulcerations and Amputations in Patients with Diabetes in Romania. Int. J. Environ. Res. Public Health 2021, 18, 2230. [Google Scholar] [CrossRef]
- Bala, C.; Rusu, A.; Ciobanu, D.; Roman, G. Length of Hospital Stay, Hospitalization Costs, and Their Drivers in Adults with Diabetes in the Romanian Public Hospital System. Int. J. Environ. Res. Public Health 2022, 19, 10035. [Google Scholar] [CrossRef]
- Spitalul Clinic Judetean de Urgenta Cluj-Napoca. Evaluarea Situatiei Generale a Spitalului Clinic Judetean de Urgenta Cluj-Napoca Pentru Perioada 01.01.2013–21.12.2019. Available online: https://scjucluj.ro/pdf/intpublic/00.%20Analiza_Spitalul%20Clinic%20Judetean%20de%20urgenta%20Cluj_10_12_2020.pdf (accessed on 28 January 2025).
- Radu, C.P.; Chiriac, D.N.; Vladescu, C. Changing patient classification system for hospital reimbursement in Romania. Croat. Med. J. 2010, 51, 250–258. [Google Scholar] [CrossRef]
- Radu, C.P.; Chiriac, D.N.; Pravat, M.A. Romanian Claw-Back Taxation: From A Financial Solution to A Challenge for Patients Access to Drugs. Value Health 2016, 17, A347–A766. [Google Scholar] [CrossRef]
- Skoupa, J.; Annemans, L.; Hajek, P. Health economic data requirements and availability in the European union: Results of a survey among 10 European countries. Value Health Reg. Issues 2014, 4, 53–57. [Google Scholar] [CrossRef]
- Lorenzovici, L.; Székely, A.; Csanádi, M.; Gaál, P. Cost Assessment of Inpatient Care Episodes of Stroke in Romania. Front. Public Health 2020, 8, 605919. [Google Scholar] [CrossRef] [PubMed]
- Tarricone, R. Cost-of-illness analysis: What room in health economics? Health Policy 2006, 77, 51–63. [Google Scholar] [CrossRef] [PubMed]
- CPI-Annual Data Series. Available online: http://www.insse.ro/cms/ro/content/ipc–serie-de-date-anuala (accessed on 21 June 2020).
- National Bank of Romania—Exchange Rates: Monthly, Quarterly and Annual Averages. Available online: https://www.bnr.ro/Exchange-Rates--3727.aspx (accessed on 21 June 2020).
- Rubio, J.A.; Jiménez, S.; Lázaro-Martínez, J.L. Mortality in Patients with Diabetic Foot Ulcers: Causes, Risk Factors, and Their Association with Evolution and Severity of Ulcer. J. Clin. Med. 2020, 9, 3009. [Google Scholar] [CrossRef] [PubMed]
- Keskek, S.O.; Kirim, S.; Yanmaz, N. Estimated costs of the treatment of diabetic foot ulcers in a tertiary hospital in Turkey. Pak. J. Med. Sci. 2014, 30, 968–971. [Google Scholar] [CrossRef]
- Syed, M.H.; Salata, K.; Hussain, M.A.; Zamzam, A.; de Mestral, C.; Wheatcroft, M.; Harlock, J.; Awartani, D.; Aljabri, B.; Verma, A.; et al. The economic burden of inpatient diabetic foot ulcers in Toronto, Canada. Vascular 2020, 28, 520–529. [Google Scholar] [CrossRef]
- Chan, B.; Cadarette, S.; Wodchis, W.; Wong, J.; Mittmann, N.; Krahn, M. Cost-of-illness studies in chronic ulcers: A systematic review. J. Wound Care 2017, 26 (Suppl. S4), S4–S14. [Google Scholar] [CrossRef] [PubMed]
- OECD. State of Health in the EU. Romania. Country Health Profile 2023. Available online: https://health.ec.europa.eu/system/files/2023-12/2023_chp_ro_english.pdf (accessed on 28 January 2025).
- Alzaid, A.; Ladrón de Guevara, P.; Beillat, M.; Lehner Martin, V.; Atanasov, P. Burden of disease and costs associated with type 2 diabetes in emerging and established markets: Systematic review analyses. Expert Rev. Pharm. Outcomes Res. 2021, 21, 785798. [Google Scholar] [CrossRef]
- Da Ros, R.; Assaloni, R.; Michelli, A.; Brunato, B.; Barro, E.; Meloni, M.; Miranda, C. Burden of Infected Diabetic Foot Ulcers on Hospital Admissions and Costs in a Third-Level Center. Diabetology 2024, 5, 141–150. [Google Scholar] [CrossRef]
- Lu, Q.; Wang, J.; Wei, X.; Wang, G.; Xu, Y.; Lu, Z.; Liu, P. Cost of Diabetic Foot Ulcer Management in China: A 7-Year Single-Center Retrospective Review. Diabetes Metab. Syndr. Obes. 2020, 13, 4249–4260. [Google Scholar] [CrossRef]
- Stockl, K.; Vanderplas, A. Costs of lower-extremity ulcers among patients with diabetes. Diabetes Care 2004, 27, 2129–2134. [Google Scholar] [CrossRef]
- Friel, K.M.; Gillespie, P.; Coates, V.; McCauley, C.; McCann, M.; O’Kane, M.; McGuigan, K.; Khamis, A.; Manktelow, M. Es-timating and examining the costs of inpatient diabetes care in an Irish Public Hospital. Diabet. Med. 2022, 39, e14753. [Google Scholar] [CrossRef]

| All Sample N = 1094 | 2015 N = 280 | 2016 N = 273 | 2017 N = 278 | 2018 N = 263 | p-Value for Trend | |
|---|---|---|---|---|---|---|
| Type of diabetes, n (%) | 0.853 | |||||
| Type 1 | 71 (6.5%) | 19 (6.8%) | 19 (7.0%) | 19 (6.8%) | 14 (5.3%) | |
| Type 2 | 1023 (93.5%) | 261 (93.2%) | 254 (93.0%) | 259 (93.2%) | 249 (94.7%) | |
| Age, years * | 65.0 | 64.0 | 65.0 | 65.0 | 67.0 | 0.269 |
| (59.0; 72.0) | (59.0; 71.0) | (59.0; 71.0) | (59.0; 73.0) | (60.0; 72.0) | ||
| Age groups, n (%) | 0.063 | |||||
| 18–40 years | 10 (0.9%) | 4 (1.4%) | 1 (0.4%) | 3 (1.1%) | 2 (0.8%) | |
| 40–65 years | 502 (45.6%) | 138 (49.3%) | 135 (49.5%) | 127 (45.7%) | 99 (37.6%) | |
| ≥65 years | 590 (53.5%) | 138 (49.3%) | 137 (50.2%) | 148 (53.2%) | 162 (61.6%) | |
| Men, n (%) | 783 (71.6%) | 202 (72.1%) | 189 (69.2%) | 210 (75.5%) | 182 (69.2%) | 0.301 |
| Foot ulcer etiology, n (%) | <0.001 | |||||
| Neuropathic | 283 (25.9%) | 91 (32.5%) | 63 (23.1%) | 86 (30.9%) | 43 (16.3%) | |
| Ischemic | 515 (47.1%) | 116 (41.4%) | 126 (46.2%) | 123 (44.2%) | 150 (57.0%) | |
| Neuroischemic | 182 (16.6%) | 59 (21.1%) | 46 (16.8%) | 36 (12.9%) | 41 (15.6%) | |
| Not specified etiology | 114 (10.4%) | 14 (5.0%) | 38 (13.9%) | 33 (11.9%) | 29 (11.0%) |
| All Sample N = 1094 | 2015 N = 280 | 2016 N = 273 | 2017 N = 278 | 2018 N = 263 | p-Value for Trend | |
| Overall cases with foot ulcers | 8.0 (6.0; 12.0) | 9.0 (7.0; 13.0) | 8.0 (6.0; 12.0) | 8.0 (6.0; 11.0) | 8.0 (6.0; 12.0) | 0.075 |
| Neuropathic DFUs | ||||||
| Type of diabetes | ||||||
| Type 1 | 7.0 (6.0; 9.0) | 8.0 (7.0; 8.5) | 7.0 (6.0; 9.0) | 7.0 (6.0; 8.5) | 7.0 (6.5; 9.0) | 0.867 |
| Type 2 | 7.0 (6.0; 9.0) | 8.0 (6.0; 10.0) | 7.0 (6.0; 10.0) | 7.0 (6.0; 8.0) | 8.0 (6.5; 10.0) | 0.050 |
| p-value | 0.915 | 0.893 | 0.909 | 0.660 | 0.595 | |
| By sex | ||||||
| Women | 9.0 (6.5; 11.5) | 10.0 (7.0; 12.0) | 8.5 (6.0; 13.0) | 7.0 (7.0; 9.0) | 7.5 (6.0; 10.0) | 0.343 |
| Men | 7.0 (6.0; 9.0) | 7.0 (6.0; 9.0) | 7.0 (6.0; 9.0) | 7.0 (6.0; 8.0) | 8.0 (7.0; 10.0) | 0.084 |
| p-value | 0.001 | 0.005 | 0.035 | 0.261 | 0.724 | |
| By age groups | ||||||
| 18–40 years | 7.0 (6.0; 11.0) | 7.0 (6.5; 10.5) | 11.0 | 4.0 | - | 0.344 |
| 40–65 years | 7.0 (6.0; 10.0) | 8.0 (7.0; 10.0) | 7.0 (6.0; 9.0) | 7.0 (6.0; 9.0) | 8.0 (7.0; 10.0) | 0.101 |
| ≥65 years | 7.0 (6.0; 10.0) | 8.0 (6.0; 10.0) | 6.0 (5.0; 9.0) | 7.0 (6.0; 8.0) | 8.0 (6.0; 10.0) | 0.406 |
| p-value | 0.829 | 0.972 | 0.232 | 0.369 | 0.483 | |
| Ischemic DFUs | ||||||
| Type of diabetes | ||||||
| Type 1 | 7.0 (6.0; 11.0) | 15.0 (11.0; 16.5) | 6.0 (4.0; 7.0) | 8.0 | 13.0 (11.0; 15.0) | 0.050 |
| Type 2 | 10.0 (6.0; 15.0) | 12.0 (8.0; 18.0) | 9.0 (7.0; 14.0) | 9.5 (6.0; 14.0) | 9.0 (6.0; 14.0) | 0.004 |
| p-value | 0.207 | 0.844 | 0.010 | 0.780 | 0.346 | |
| By sex | ||||||
| Women | 10.0 (6.0; 15.0) | 13.0 (8.5; 17.5) | 10.0 (6.0; 15.0) | 8.0 (5.0; 16.0) | 9.0 (6.0; 12.0) | 0.060 |
| Men | 10.0 (6.0; 14.0) | 11.5 (7.0; 18.0) | 8.0 (6.0; 13.0) | 10.0 (7.0; 13.5) | 9.0 (5.0; 14.0) | 0.047 |
| p-value | 0.601 | 0.624 | 0.282 | 0.500 | 0.945 | |
| By age groups | ||||||
| 18–40 years | 13.0 (8.0; 18.0) | - | - | 8.0 | 18.0 | 1.000 |
| 40–65 years | 10.0 (6.0; 15.5) | 12.5 (7.0; 22.0) | 9.0 (6.0; 14.0) | 8.0 (6.0; 12.0) | 8.0 (6.0; 14.0) | 0.092 |
| ≥65 years | 10.0 (6.0; 14.0) | 12.5 (8.0; 16.0) | 9.0 (7.0; 13.5) | 10.0 (6.0; 14.0) | 9.0 (5.0; 13.5) | 0.047 |
| p-value | 0.860 | 0.527 | 0.907 | 0.784 | 0.566 | |
| Neuroischemic DFUs | ||||||
| Type of diabetes | ||||||
| Type 1 | 8.0 (7.0; 11.0) | 7.0 (6.0; 8.0) | 8.0 (6.0; 8.5) | 10.0 (7.0; 13.0) | 11.0 (9.5; 11.5) | 0.295 |
| Type 2 | 8.0 (7.0; 11.0) | 8.0 (6.0; 11.0) | 8.0 (7.0; 11.0) | 8.0 (6.0; 12.0) | 10.0 (7.0; 12.0) | 0.821 |
| p-value | 0.934 | 0.359 | 0.496 | 0.548 | 0.584 | |
| By sex | ||||||
| Women | 8.0 (7.0; 12.5) | 7.0 (5.0; 8.0) | 10.0 (7.0; 21.0) | 8.0 (8.0; 9.0) | 11.0 (7.0; 15.0) | 0.359 |
| Men | 8.0 (7.0; 11.0) | 8.0 (7.0; 11.0) | 8.0 (7.0; 10.0) | 8.0 (6.0; 13.0) | 9.5 (7.0; 11.0) | 0.862 |
| p-value | 0.836 | 0.181 | 0.238 | 1.000 | 0.463 | |
| By age groups | ||||||
| 18–40 years | 7.0 | 7.0 | - | - | - | - |
| 40–65 years | 8.0 (7.0; 11.0) | 8.0 (6.5; 10.5) | 8.0 (7.0; 10.0) | 8.0 (7.0; 12.0) | 11.0 (8.5; 12.0) | 0.311 |
| ≥65 years | 8.0 (6.5; 11.0) | 8.0 (6.0; 11.0) | 7.0 (7.0; 11.0) | 8.0 (6.5; 12.5) | 9.5 (7.0; 11.0) | 0.939 |
| p-value | 0.821 | 0.864 | 0.876 | 0.754 | 0.204 | |
| No specified etiology of the DFUs | ||||||
| Type of diabetes | ||||||
| Type 1 | 12.0 (9.0; 19.5) | - | - | 12.0 | 16.5 (6.0; 27.0) | 1.000 |
| Type 2 | 7.0 (7.0; 10.0) | 7.0 (6.0; 8.0) | 8.0 (7.0; 12.0) | 7.0 (6.0; 10.5) | 7.0 (7.0; 9.5) | 0.171 |
| p-value | 0.338 | - | - | 0.303 | 0.650 | |
| By sex | ||||||
| Women | 7.0 (7.0; 10.0) | 7.0 (6.0; 7.0) | 10.0 (8.0; 13.5) | 7.0 (7.0; 11.5) | 7.0 (6.5; 9.5) | 0.008 |
| Men | 7.0 (6.0; 10.0) | 8.0 (6.0; 9.5) | 7.0 (7.0; 10.0) | 7.0 (6.0; 10.0) | 7.0 (7.0; 11.0) | 0.906 |
| p-value | 0.302 | 0.209 | 0.044 | 0.166 | 0.845 | |
| By age groups | ||||||
| 18–40 years | 19.0 (11.0; 27.0) | - | - | 11.0 | 27.0 | 1.000 |
| 40–65 years | 7.0 (7.0; 10.5) | 7.0 (7.0; 8.0) | 8.0 (7.0; 13.0) | 7.0 (7.0; 10.5) | 7.0 (7.0; 10.0) | 0.723 |
| ≥65 years | 7.0 (6.0; 10.0) | 6.5 (5.5; 8.5) | 8.5 (7.0; 11.0) | 7.0 (6.0; 10.0) | 7.0 (6.0; 7.5) | 0.167 |
| p-value | 0.125 | 0.755 | 0.675 | 0.455 | 0.134 | |
| Predictor | Length of Stay per Episode of Hospitalization | Adjusted Average Costs per Episode of Hospitalization | ||
|---|---|---|---|---|
| Standardized β Coefficient | p-Value | Standardized β Coefficient | p-Value | |
| Age, years | −0.019 | 0.552 | −0.019 | 0.217 |
| Sex (men vs. women) | −0.056 | 0.068 | −0.026 | 0.093 |
| Diabetes type (type 2 vs. type 1) | 0.042 | 0.184 | 0.023 | 0.146 |
| Etiology of DFUs (neuroischemic vs. ischemic vs. neuropathic) | 0.047 | 0.125 | 0.032 | 0.034 |
| Length of hospital stay, days | - | - | 0.860 | <0.001 |
| All Sample N = 1094 | 2015 N = 280 | 2016 N = 273 | 2017 N = 278 | 2018 N = 263 | p-Value for Trend | |
|---|---|---|---|---|---|---|
| Overall cases with foot ulcers | 810.8 (587.6; 1320.9) | 815.4 (590.9; 1462.4) | 814.6 (603.9; 1286.0) | 793.5 (559.8; 1258.2) | 816.2 (574.3; 1287.8) | 0.332 |
| Neuropathic DFUs | ||||||
| Type of diabetes | ||||||
| Type 1 | 621.5 | 674.6 | 627.4 | 621.3 | 568.4 | 0.900 |
| (531.8; 770.8) | (586.5; 772.6) | (519.9; 780.0) | (512.6; 704.4) | (503.9; 748.5) | ||
| Type 2 | 635.2 | 672.4 | 651.0 | 593.3 | 671.1 | 0.157 |
| (513.5; 829.9) | (529.9; 858.3) | (503.6; 838.0) | (507.3; 711.8) | (548.0; 848.2) | ||
| p-value | 0.887 | 0.990 | 0.853 | 0.556 | 0.488 | |
| By sex | ||||||
| Women | 782.3 | 840.5 | 796.2 | 609.1 | 625.2 | 0.271 |
| (557.5; 960.0) | (579.9; 1023.9) | (554.7; 1163.2) | (560.7; 826.5) | (477.9; 932.0) | ||
| Men | 607.5 | 618.5 | 596.4 | 593.5 | 652.2 | 0.358 |
| (509.0; 782.7) | (525.9; 762.2) | (491.8; 789.2) | (504.9; 704.5) | (539.8; 841.7) | ||
| p-value | 0.001 | 0.004 | 0.026 | 0.360 | 0.745 | |
| By age groups | ||||||
| 18–40 years | 574.0 | 574.0 | 4376.5 | 1627.2 | - | 0.344 |
| (498.7; 974.5) | (536.3; 876.8) | |||||
| 40–65 years | 651.0 | 672.5 | 691.0 | 603.8 | 698.2 | 0.194 |
| (527.4; 824.9) | (553.6; 838.7) | (531.3; 823.3) | (506.1; 736.6) | (568.4; 854.6) | ||
| ≥65 years | 596.4 | 674.8 | 554.7 | 582.7 | 632.4 | 0.603 |
| (497.8; 832.0) | (529.2; 885.8) | (453.7; 806.0) | (511.5; 698.1) | (477.9; 841.7) | ||
| p-value | 0.603 | 0.969 | 0.208 | 0.396 | 0.285 | |
| Ischemic DFUs | ||||||
| Type of diabetes | ||||||
| Type 1 | 825.3 | 1550.9 | 542.2 | 881.5 | 1404.7 | 0.118 |
| (530.1; 1216.9) | (1095.2; 1788.1) | (357.7; 829.8) | (1127.5; 1682.0) | |||
| Type 2 | 1178.4 | 1464.0 | 1149.4 | 1186.8 | 902.3 | 0.001 |
| (708.1; 1740.8) | (932.7; 2220.8) | (768.9; 1671.0) | (669.0; 1839.1) | (607.0; 1665.6) | ||
| p-value | 0.047 | 0.819 | 0.002 | 0.683 | 0.466 | |
| By sex | ||||||
| Women | 1158.8 | 1599.7 | 1220.2 | 1084.9 | 929.8 | 0.021 |
| (717.3; 1807.0) | (1031.7; 2033.0) | (779.8; 1839.1) | (624.0; 1933.1) | (622.5; 1400.2) | ||
| Men | 1173.7 | 1373.0 | 992.9 | 1199.9 | 902.3 | 0.023 |
| (691.2; 1708.1) | (801.2; 2533.6) | (730.3; 1556.2) | (751.5; 1816.2) | (607.0; 1711.7) | ||
| p-value | 0.569 | 0.519 | 0.203 | 0.678 | 0.802 | |
| By age groups | ||||||
| 18–40 years | 1237.1 | - | - | 1088.5 | 1385.6 | 1.000 |
| (1088.5; 1385.6) | ||||||
| 40–65 years | 1135.6 | 1611.3 | 890.5 | 1032.9 | 899.8 | 0.103 |
| (664.1; 1927.7) | (857.9; 2658.6) | (630.8; 1676.0) | (667.7; 1721.3) | (653.9; 1715.7) | ||
| ≥65 years | 1181.8 | 1409.8 | 1117.3 | 1216.9 | 905.3 | 0.007 |
| (713.1; 1693.3) | (939.3; 2025.2) | (788.1; 1584.9) | (713.1; 1857.4) | (602.8; 1602.6) | ||
| p-value | 0.982 | 0.527 | 0.526 | 0.705 | 0.723 | |
| Neuroischemic DFUs | ||||||
| Type of diabetes | ||||||
| Type 1 | 729.8 | 588.2 | 727.5 | 1107.8 | 1136.6 | 0.143 |
| (588.2; 1136.6) | (529.0; 692.1) | (569.4; 728.7) | (800.5; 1481.1) | (885.2; 1149.7) | ||
| Type 2 | 733.1 | 697.8 | 708.5 | 807.4 | 895.1 | 0.627 |
| (596.4; 1232.0) | (582.0; 1085.4) | (598.3; 1109.7) | (609.1; 1434.8) | (579.8; 1418.3) | ||
| p-value | 0.708 | 0.203 | 0.442 | 0.548 | 0.944 | |
| By sex | ||||||
| Women | 964.2 | 588.2 | 1161.0 | 895.5 | 1382.2 | 0.425 |
| (584.0; 1607.1) | (535.4; 1032.9) | (677.1; 2236.4) | (843.9; 1095.0) | (579.8; 1767.1) | ||
| Men | 727.2 | 697.8 | 708.5 | 770.9 | 840.8 | 0.634 |
| (596.4; 1136.6) | (589.8; 1036.6) | (590.5; 944.5) | (603.5; 1442.1) | (630.3; 1149.7) | ||
| p-value | 0.225 | 0.354 | 0.123 | 0.448 | 0.237 | |
| By age groups | ||||||
| 18–40 years | 1200.7 | 1200.7 | - | - | - | - |
| 40–65 years | 727.6 | 697.8 | 729.1 | 673.3 | 1025.9 | 0.516 |
| (600.4; 1095.0) | (589.0; 942.6) | (600.2; 884.9) | (609.1; 1274.3) | (705.5; 1149.7) | ||
| ≥65 years | 798.2 | 657.6 | 677.1 | 843.9 | 895.1 | 0.530 |
| (580.9; 1396.5) | (541.8; 1032.9) | (590.5; 1377.1) | (682.6; 1569.9) | (562.8; 1418.3) | ||
| p-value | 0.548 | 0.569 | 0.783 | 0.433 | 0.828 | |
| No specified etiology of the DFUs | ||||||
| Type of diabetes | ||||||
| Type 1 | 1107.5 | - | - | 1107.5 | 2722.0 | 1.000 |
| (806.5; 3023.1) | (505.4; 4938.6) | |||||
| Type 2 | 646.1 | 590.2 | 840.8 | 607.4 | 624.5 | 0.043 |
| (554.4; 919.8) | (487.5; 739.0) | (608.2; 1120.6) | (507.7; 893.0) | (524.0; 902.0) | ||
| p-value | 0.312 | - | - | 0.303 | 0.650 | |
| By sex | ||||||
| Women | 771.2 | 525.4 | 936.0 | 631.7 | 774.6 | 0.006 |
| (590.8; 936.0) | (493.8; 596.7) | (856.5; 1210.8) | (597.5; 1001.4) | (534.1; 890.2) | ||
| Men | 624.5 | 687.2 | 660.5 | 585.5 | 603.0 | 0.564 |
| (511.5; 917.4) | (519.6; 788.3) | (599.4; 1005.2) | (471.5; 890.7) | (517.0; 977.3) | ||
| p-value | 0.157 | 0.318 | 0.035 | 0.117 | 0.948 | |
| By age groups | ||||||
| 18–40 years | 2938.4 | - | - | 938.2 | 4938.7 | 1.000 |
| (938.2; 4938.6) | ||||||
| 40–65 years | 718.3 | 652.0 | 865.1 | 643.0 | 771.2 | 0.471 |
| (565.4; 955.4) | (535.4; 739.0) | (602.3; 1084.4) | (574.5; 904.1) | (531.0; 922.1) | ||
| ≥65 years | 632.1 | 531.8 | 840.8 | 602.3 | 603.0 | 0.065 |
| (507.7; 884.1) | (455.0; 733.7) | (637.2; 1143.6) | (504.0; 844.6) | (476.3; 762.7) | ||
| p-value | 0.122 | 0.755 | 0.897 | 0.420 | 0.146 | |
Disclaimer/Publisher’s Note: The statements, opinions and data contained in all publications are solely those of the individual author(s) and contributor(s) and not of MDPI and/or the editor(s). MDPI and/or the editor(s) disclaim responsibility for any injury to people or property resulting from any ideas, methods, instructions or products referred to in the content. |
© 2025 by the authors. Licensee MDPI, Basel, Switzerland. This article is an open access article distributed under the terms and conditions of the Creative Commons Attribution (CC BY) license (https://creativecommons.org/licenses/by/4.0/).
Share and Cite
Rusu, A.; Roman, G.; Stancu, B.; Bala, C. The Burden of Diabetic Foot Ulcers on Hospital Admissions and Costs in Romania. J. Clin. Med. 2025, 14, 1248. https://doi.org/10.3390/jcm14041248
Rusu A, Roman G, Stancu B, Bala C. The Burden of Diabetic Foot Ulcers on Hospital Admissions and Costs in Romania. Journal of Clinical Medicine. 2025; 14(4):1248. https://doi.org/10.3390/jcm14041248
Chicago/Turabian StyleRusu, Adriana, Gabriela Roman, Bogdan Stancu, and Cornelia Bala. 2025. "The Burden of Diabetic Foot Ulcers on Hospital Admissions and Costs in Romania" Journal of Clinical Medicine 14, no. 4: 1248. https://doi.org/10.3390/jcm14041248
APA StyleRusu, A., Roman, G., Stancu, B., & Bala, C. (2025). The Burden of Diabetic Foot Ulcers on Hospital Admissions and Costs in Romania. Journal of Clinical Medicine, 14(4), 1248. https://doi.org/10.3390/jcm14041248