2. Materials and Methods
2.1. Study Settings
In this monocentric, retrospective study, we reviewed data for consecutive patients who were diagnosed with diabetes and underwent PPV for ERM peeling at the Department of Ophthalmology of the University Medical Center Rostock between April 2013 and November 2022. The study complies with the ethical principles for medical research as outlined in the Declaration of Helsinki, and approval was given by the local ethics committee of the University Medical Center Rostock (IRB No. A 2022-0124).
This study included patients with mild, moderate, or severe non-proliferative diabetic retinopathy (NPDR) and those with proliferative diabetic retinopathy (PDR). The grading of DR stages followed the criteria outlined in the International Classification of Diabetic Retinopathy staging scale as previously defined [
7]. In the 30 cases where both eyes per patient fulfilled the eligibility criteria, only the eye operated on first was selected to prevent inter-eye correlation bias. We searched our database for all patients with diabetic retinopathy who underwent PPV for ERM peeling and included all cases with sufficient data on (1) pre- and postoperative spectral domain optical coherence tomography (OCT) measurements and (2) pre- and postoperative functional measurements, including best corrected visual acuity (BCVA). All patients experienced a decline in visual acuity associated with clinically significant ERM. Patients with the presence and/or absence of posterior vitreous detachment (PVD) were included.
Our exclusion criteria were diabetic tractional retinal detachment, significant fibrovascular proliferation, macular hole, manifest uveitis, history of retinal detachment, aphakia, history of perforating or non-perforating trauma, and any other intraocular surgery despite uncomplicated cataract surgery with posterior chamber lens implantation. Patients with insufficient data, follow-up of less than one month, or poor-quality images were excluded.
2.2. Ophthalmologic Examination
All patients underwent pre- and postsurgical comprehensive ophthalmological examinations, including BCVA in decimal, intraocular pressure measurement, slit-lamp biomicroscopy, lens status, dilated fundus examination, and grade classification of diabetic retinopathy. Furthermore, we documented the intravitreal therapy (IVT) of anti-vascular endothelial growth factor (VEGF) and corticosteroids prior to surgery, along with the duration of diabetes mellitus, HbA1c percentage, arterial hypertension, hypercholesterolemia, chronic kidney disease, and smoking status, if applicable.
2.3. Optic Coherence Tomography
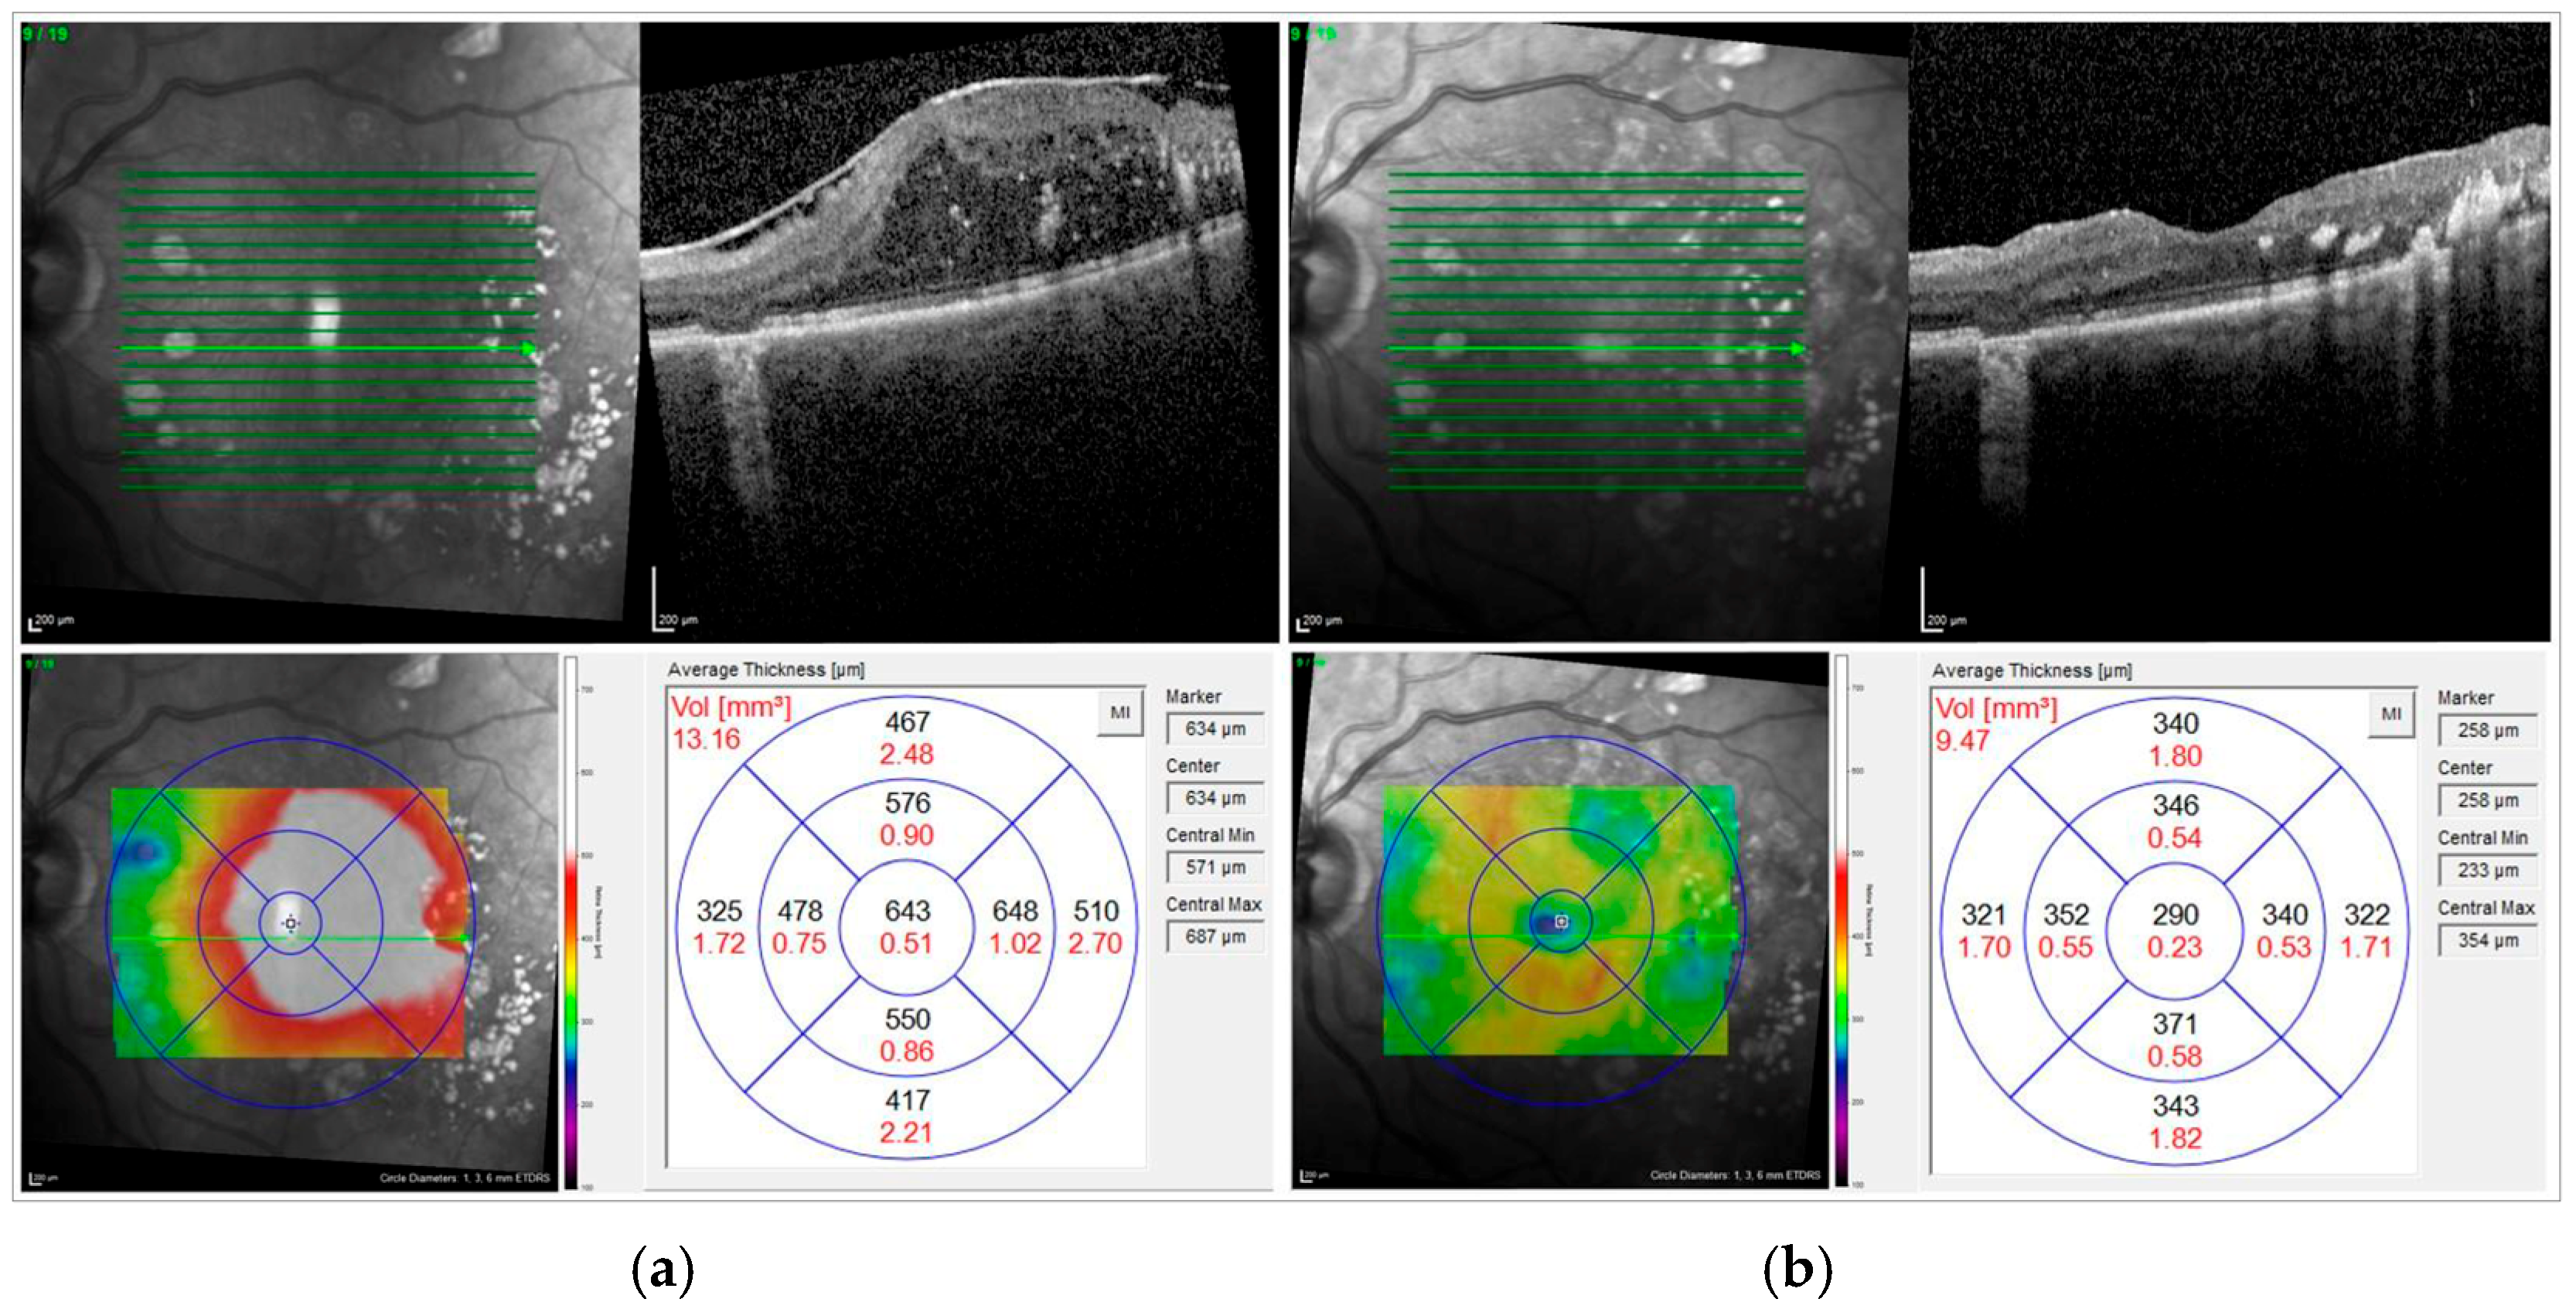
Preoperatively and at each postoperative visit, all eyes underwent macular examination with a spectral domain OCT using the Heidelberg Engineering Spectralis (Heidelberg Engineering GmbH, Heidelberg, Germany). The specific scan protocol was a custom raster scan pattern with 37 sections (512 A-scans each) in a 30° × 20° field of view. ERM was defined by visible epiretinal membranes and disappearance of physiological foveal depression in preoperative macular morphology assessment by OCT examination. Diabetic macular edema was defined as the presence of intraretinal fluid (IRF) and/or subretinal fluid (SRF) associated with increased central retinal thickness on OCT.
The following parameters were chosen for further analysis:
The standard settings for OCT recordings were a 20° × 20° volume scan: 49 sections at a distance of 122 μm. The average central subfield retinal thickness (CSRT) in µm was automatically calculated by the device software as the distance from the retinal pigment epithelium to the internal limiting membrane (ILM) at the highest point within a circle of 1 mm radius centered on the fovea. We further noted the thickness of the superior, inferior, temporal, and nasal subfields.
The macular volume (MV, in mm3) was extracted from the topographic map of the macular cube scan. The central subfield had an inner diameter of 1 mm. Furthermore, we analyzed the volume of the outer nine segments, covering a total area of 28.27 mm2, corresponding to a scan diameter of 6 mm. These volumetric measurements were used for both pre- and postsurgical comparisons. No additional correction for axial length was applied, since the OCT system automatically adjusts for this during image acquisition.
The presence of hyperreflective foci (HF), IRF, and SRF was assessed on a representative central horizontal scan through the fovea. HF were manually counted in each scan. Only HFs with the following morphologic characteristics were evaluated in order to exclude hard exudates and microaneurysms from the analysis: (1) reflectivity similar to that of the nerve fiber layer; (2) absence of back-shadowing; and (3) <30 μm diameter. IRF was defined as round, minimally reflective spaces within the neurosensory retina, located in the outer nuclear layer, inner nuclear layer, or ganglion cell layer. SRF was characterized by subfoveal neurosensory hyporeflective detachment due to fluid accumulation between the retina and the retinal pigment epithelium. The definitions for HF, IRF, and SRF were based on the criteria described by Panozzo et al. [
8].
Figure 1 shows the OCT scan of an example case before and after surgery.
2.4. Surgical Treatment
All patients underwent a three-port PPV, using either a 20-gauge or a sutureless 23- or 25-gauge technique, along with an ERM and ILM peeling. For staining of the ERM and ILM, Brilliant Peel® (Geuder Company GmbH, Heidelberg, Germany) or Twin Blue (AL.CHI.MI.A. S.R.L., Ponte San Nicolò, Italy) was used at the surgeon’s discretion. The selected endotamponade options included air, sulfur-hexafluoride (20%), silicone oil (Siluron® 2000 or 5000 cst; Geuder Company GmbH, Heidelberg, Germany), or balanced salt solution (BSS). For patients with concurrent cataracts, standard 2.2–2.8 mm clear cornea bimanual phacoemulsification was performed, followed by the implantation of a posterior chamber lens in the bag immediately before the PPV procedure. Additionally, any retinal breaks or degenerations identified during the surgery were treated with either laser retinopexy or cryoretinopexy. Furthermore, panretinal photocoagulation (PRP) or cryotherapy was performed in cases with severe NPDR or PDR at the discretion of the operating surgeon.
Postsurgical management included standard topical antibiotic and anti-inflammatory therapy, which was gradually tapered over at least two weeks. The procedures were performed by five different surgeons during the study period.
2.5. Main Outcome Measures
The primary outcome measures of this study were the functional assessment of BCVA and the morphological evaluation of CSRT and MV, analyzed at two time points: preoperatively and at the final postoperative follow-up. Secondary outcomes included the subgroup analysis of changes in BCVA in relation to perioperative lens status, DME, and stages of DR, as well as the subgroup analysis of qualitative OCT parameters in relation to both changes in BCVA and quantitative OCT metrics (CSRT and MV).
2.6. Statistical Methods
Statistical analysis was conducted using IBM SPSS Statistics for Windows, Version 26.0 (IBM Corp., Armonk, NY, USA). Data distribution was assessed using the Shapiro–Wilk test. Depending on distribution, paired t-tests were used for normally distributed variables, while the Wilcoxon signed-rank test was applied for non-normally distributed data. Descriptive statistics are reported as mean value ± standard deviation (SD). A p-value < 0.05 was considered statistically significant. Effect size was evaluated using Cohen’s d coefficient. As the focus was on changes within subjects rather than identifying independent predictors, no multivariable analysis was performed. To account for multiple comparisons, p-values were adjusted using the Bonferroni procedure to control the false discovery rate.
3. Results
3.1. Demographic Data and Clinical Characteristics
A total of 300 patients were initially screened for eligibility. Of these, 213 patients were excluded as they did not meet the inclusion criteria (IC) or fulfilled one or more of the exclusion criteria (EC). Consequently, 87 consecutive eyes of 87 patients were included in the final analysis. The mean age of the study population was 67.2 ± 10.2 years. The majority of patients were male (55/87, 63.2%), while 32/87 (36.8%) were female. The mean follow-up period was 26.3 ± 24.5 months (median 23.00 months). Regarding eye laterality, 36 eyes (41.4%) were right eyes, and 51 eyes (58.6%) were left eyes. The mean duration of diabetes mellitus (DM) was 19.8 ± 11.8 years. The majority of patients had type 2 DM (84/87, 96.6%); only three patients (3.4%) were diagnosed with type 1 DM. The mean HbA1c at baseline was 7.6 ± 1.1%, indicating moderate glycemic control across the cohort. Regarding lens status, 48 eyes (55.2%) were phakic and 39 eyes (44.8%) were pseudophakic at the time of surgery. DME was present in 56 patients (64.4%). Preoperative IVT for DME with either Anti-VEGF or corticosteroids was administered in 41 patients (47.1%).
Evaluation of the grade of DR showed that 11 patients (12.6%) had mild NPDR, moderate NPDR was observed in 17 patients (19.5%), and severe NPDR in 20 patients (23.0%). PDR was the largest subgroup, with 39 patients (44.8%). PRP was performed preoperatively in 63 eyes (mostly in patients with PDR, n = 37).
Table 1 summarizes all baseline characteristics.
Out of the 87 patients, 6 underwent a combined procedure of ERM peeling and cataract surgery. Intraoperative PRP was required in 46.0% of patients, cryotherapy in 2.3%, and a combination of both in 5.7%. The need for intraoperative retinal laser or cryotherapy was predominantly observed in eyes with PDR and severe NPDR. Specifically, 29 patients with active PDR underwent PRP, and in four of these cases, additional cryoretinopexy was performed. In terms of intraoperative endotamponade selection, air was utilized in most cases, accounting for 68 eyes (78.2%). This was followed by sulfur-hexafluoride (SF6) 25% gas in 10 eyes (11.5%), silicone oil 5000 cst. (Siluron 5000®, Geuder AG, Heidelberg, Germany) in 5 eyes (5.7%), BSS in 3 eyes (3.4%), and silicone oil 2000 cst. (Siluron 2000®, Geuder AG, Heidelberg, Germany) in 1 eye (0.9%).
3.2. Functional Outcomes
In the overall cohort, BCVA did not show statistically significant changes following ERM peeling. Mean BCVA was 0.54 ± 0.39 logMAR preoperatively and 0.63 ± 0.66 logMAR at the last follow-up (p = 0.878; 26.3 ± 24.5 months).
When stratified by severity of diabetic retinopathy, no significant improvement in BCVA was observed in any subgroup. In eyes with mild NPDR, BCVA decreased from 0.37 ± 0.23 to 0.33 ± 0.28 logMAR (p = 0.591). In moderate NPDR, BCVA changed from 0.36 ± 0.15 to 0.45 ± 0.50 logMAR (p = 0.822). Severe NPDR eyes showed a slight insignificant decrease from 0.64 ± 0.45 to 0.62 ± 0.56 logMAR (p = 0.445), and in PDR, BCVA increased from 0.62 ± 0.43 to 0.80 ± 0.73 logMAR (p = 0.392).
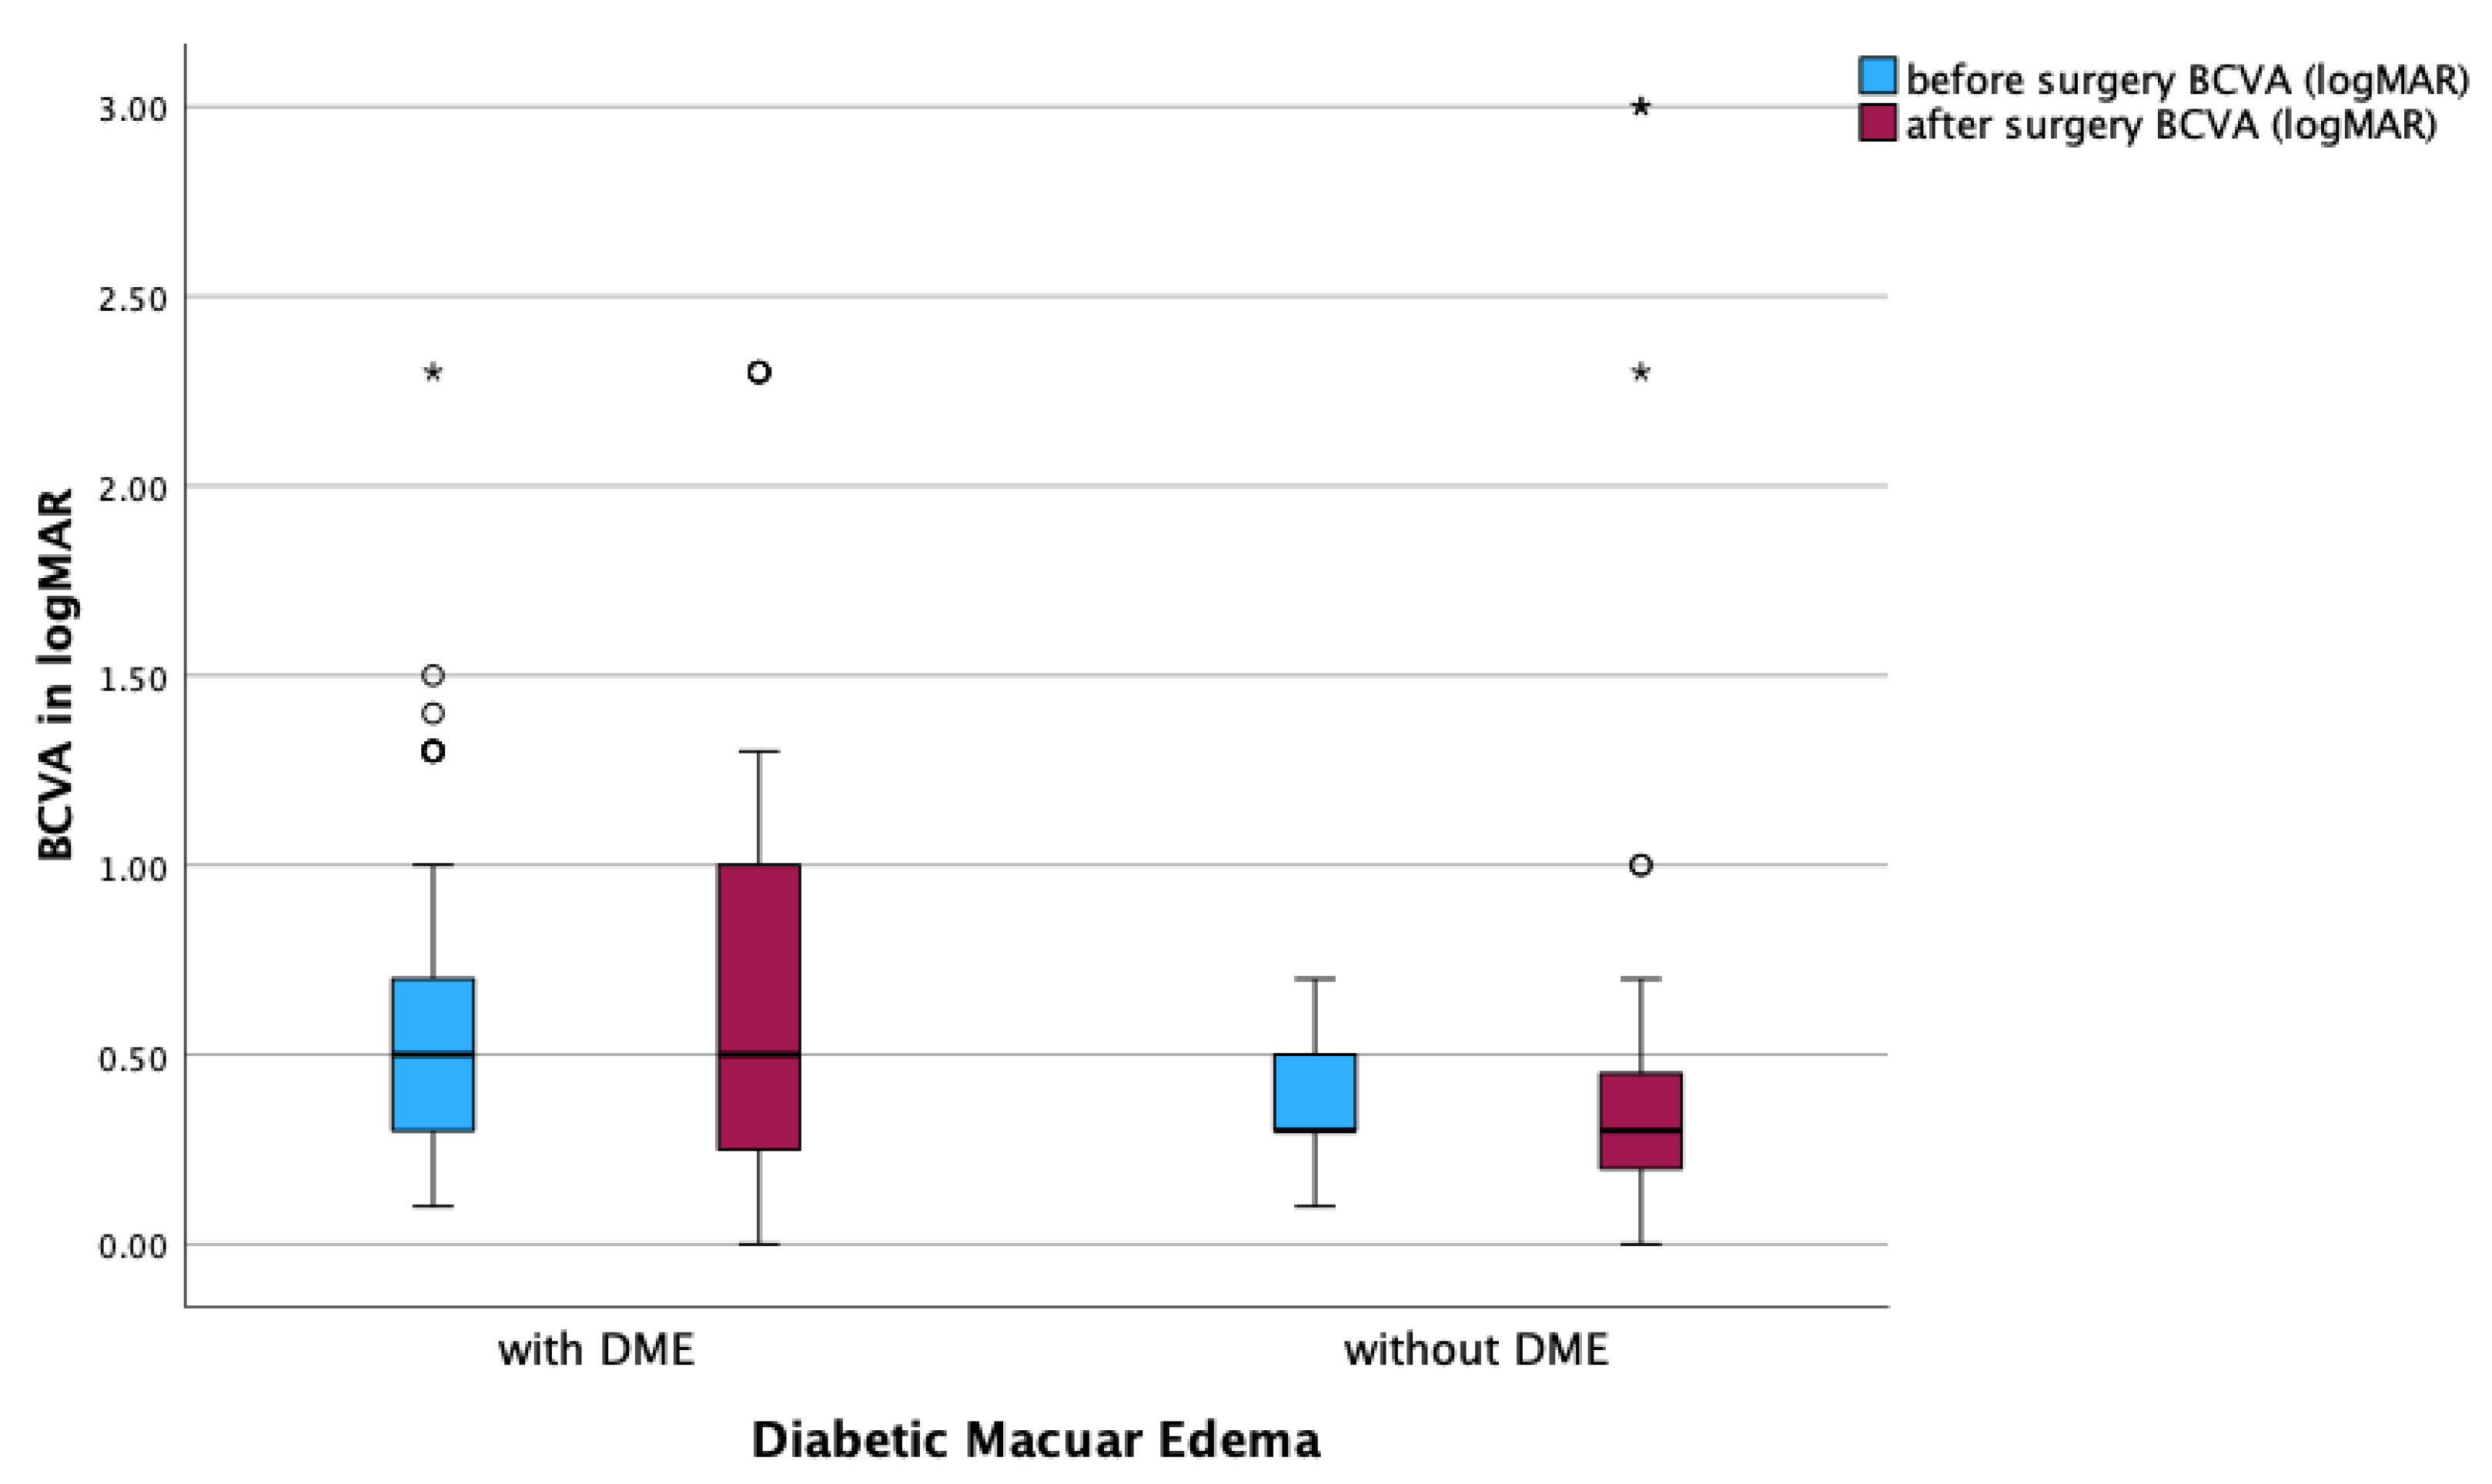
Eyes with concurrent DME demonstrated a non-significant decline in BCVA from 0.64 ± 0.44 to 0.67 ± 0.58 logMAR postoperatively (p = 0.833). In contrast, eyes without DME showed a minor, non-significant decrease from 0.37 ± 0.16 to 0.55 ± 0.78 logMAR (p = 0.991).
No significant differences were observed in the comparison of subgroups based on lens status. In phakic eyes, BCVA changed from 0.51 ± 0.33 to 0.57 ± 0.62 logMAR (p = 0.710). In pseudophakic eyes, BCVA was 0.57 ± 0.45 at baseline and 0.71 ± 0.70 logMAR at last follow-up (p = 0.551).
Evaluation of qualitative parameters detected by OCT provided further insight. The presence of HF did not result in significant postoperative changes in BCVA (0.71 ± 0.53 to 0.65 ± 0.52 logMAR, p = 0.453). This was also observed in eyes without HF change (0.48 ± 0.29 to 0.63 ± 0.71 logMAR, p = 0.480).
Assessment of retinal fluid status showed that eyes without IRF or SRF exhibited a non-significant increase in BCVA postoperatively (0.37 ± 0.16 to 0.61 ± 0.82 logMAR,
p = 0.605). Eyes with isolated IRF revealed a slight increase in BCVA postoperatively (0.61 ± 0.44 to 0.63 ± 0.59 logMAR,
p = 0.861). Notably, eyes with both IRF and SRF demonstrated stable BCVA following surgery (0.72 ± 0.39 to 0.72 ± 0.50 logMAR,
p = 0.713).
Table 2 provides a detailed overview of these findings.
Postoperative visual acuity worsened in 28 cases compared to baseline. Reported causes included optic nerve atrophy, secondary cataract formation, persistence or progression of DME, worsening of DR with subsequent vitreous hemorrhage, and, in one case, a corneal ulcer with vascularization.
3.3. Anatomical Outcomes
Following ERM peeling, significant anatomical reduction was observed in both the thickness of the central retinal subfield and the macular volume. The mean CSRT decreased from 377.20 ± 99.28 µm preoperatively to 337.99 ± 113.83 µm postoperatively (adjusted
p = 0.008). Similarly, the total MV showed a notable reduction, from 10.11 ± 1.46 mm
3 before surgery to 9.28 ± 1.07 mm
3 after the procedure (adjusted
p < 0.001). The central MV also decreased significantly, from 0.33 ± 0.81 mm
3 to 0.29 ± 0.69 mm
3 (adjusted
p < 0.001). The corresponding data is presented in
Table 3.
Association Between Qualitative and Quantitative OCT Parameters
Quantitative OCT evaluation showed postoperative reductions in CSRT and MV in subgroups stratified by qualitative OCT characteristics.
In eyes with HF, CSRT decreased from 386.33 ± 120.01 µm to 303.25 ± 127.77 µm (Cohen’s d = 0.622, adjusted p = 0.003), while MV decreased from 9.57 ± 1.24 mm3 to 9.45 ± 1.19 mm3 (Cohen’s d = 0.698, adjusted p = 0.035). In eyes without HF, CSRT changed from 373.66 ± 90.88 µm to 352.44 ± 106.60 µm without significance, and MV changed from 10.11 ± 1.46 mm3 to 9.45 ± 1.19 mm3 (Cohen’s d = 0.792, adjusted p = 0.005).
Eyes without IRF or SRF showed an insignificant decrease in CSRT from 334.62 ± 87.71 µm to 320.52 ± 99.58 µm and in MV from 9.72 ± 1.22 mm3 to 9.01 ± 0.94 mm3. Eyes with IRF but without SRF demonstrated a significant CSRT reduction from 388.04 ± 96.91 µm to 336.89 ± 117.22 µm (Cohen’s d = 0.415, adjusted p = 0.020) and a significant MV reduction from 10.42 ± 1.38 mm3 to 9.41 ± 1.09 mm3 (Cohen’s d = 0.746, adjusted p = 0.005).
In the subgroup with both IRF and SRF, CSRT decreased insignificantly from 464.17 ± 98.90 µm to 426.50 ± 120.88 µm, and MV decreased from 11.80 ± 1.48 mm
3 to 10.36 ± 1.65 mm
3 (Cohen’s d 3.192, adjusted
p = 0.04). These results are summarized in
Table 4 and
Table 5.
3.4. Subgroup Analysis of Anatomical and Functional Outcome
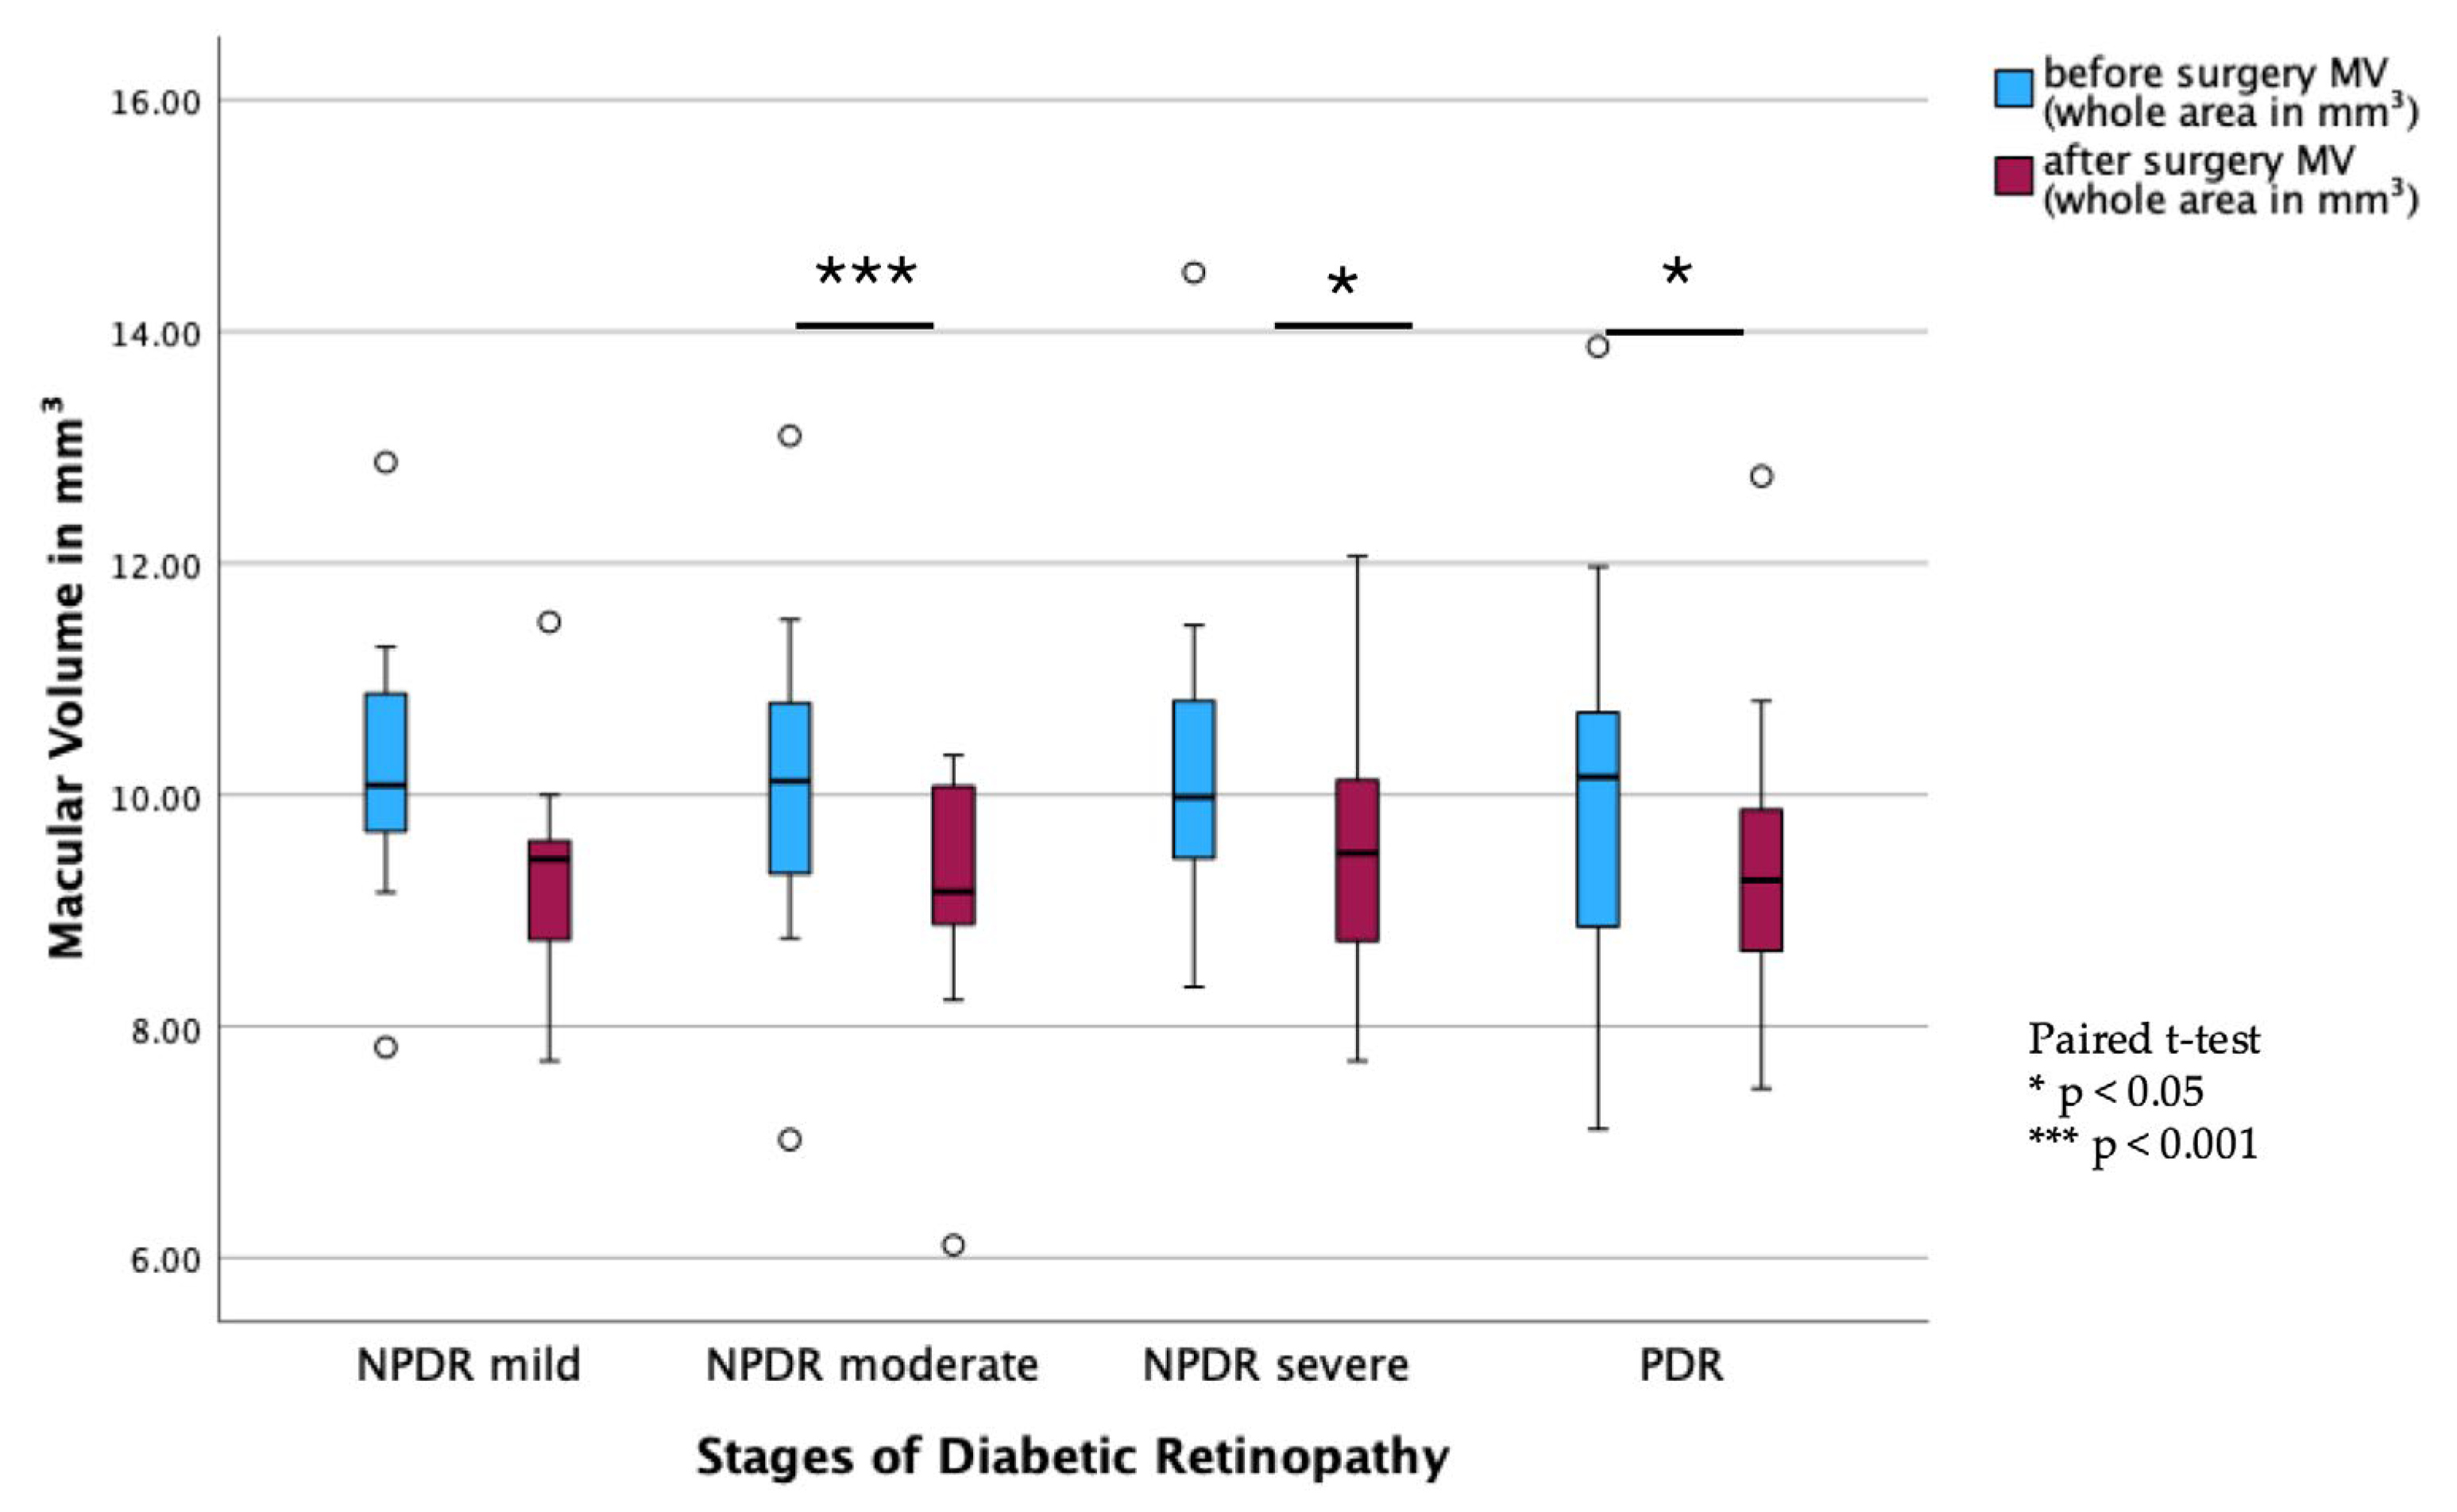
Subgroup analysis of DR stages showed a significant decrease in MV from pre- to postoperative measurements in all stages of DR, except in the mild NPDR group (PDR:
p < 0.001; moderate NPDR:
p = 0.003; severe NPDR:
p = 0.028;
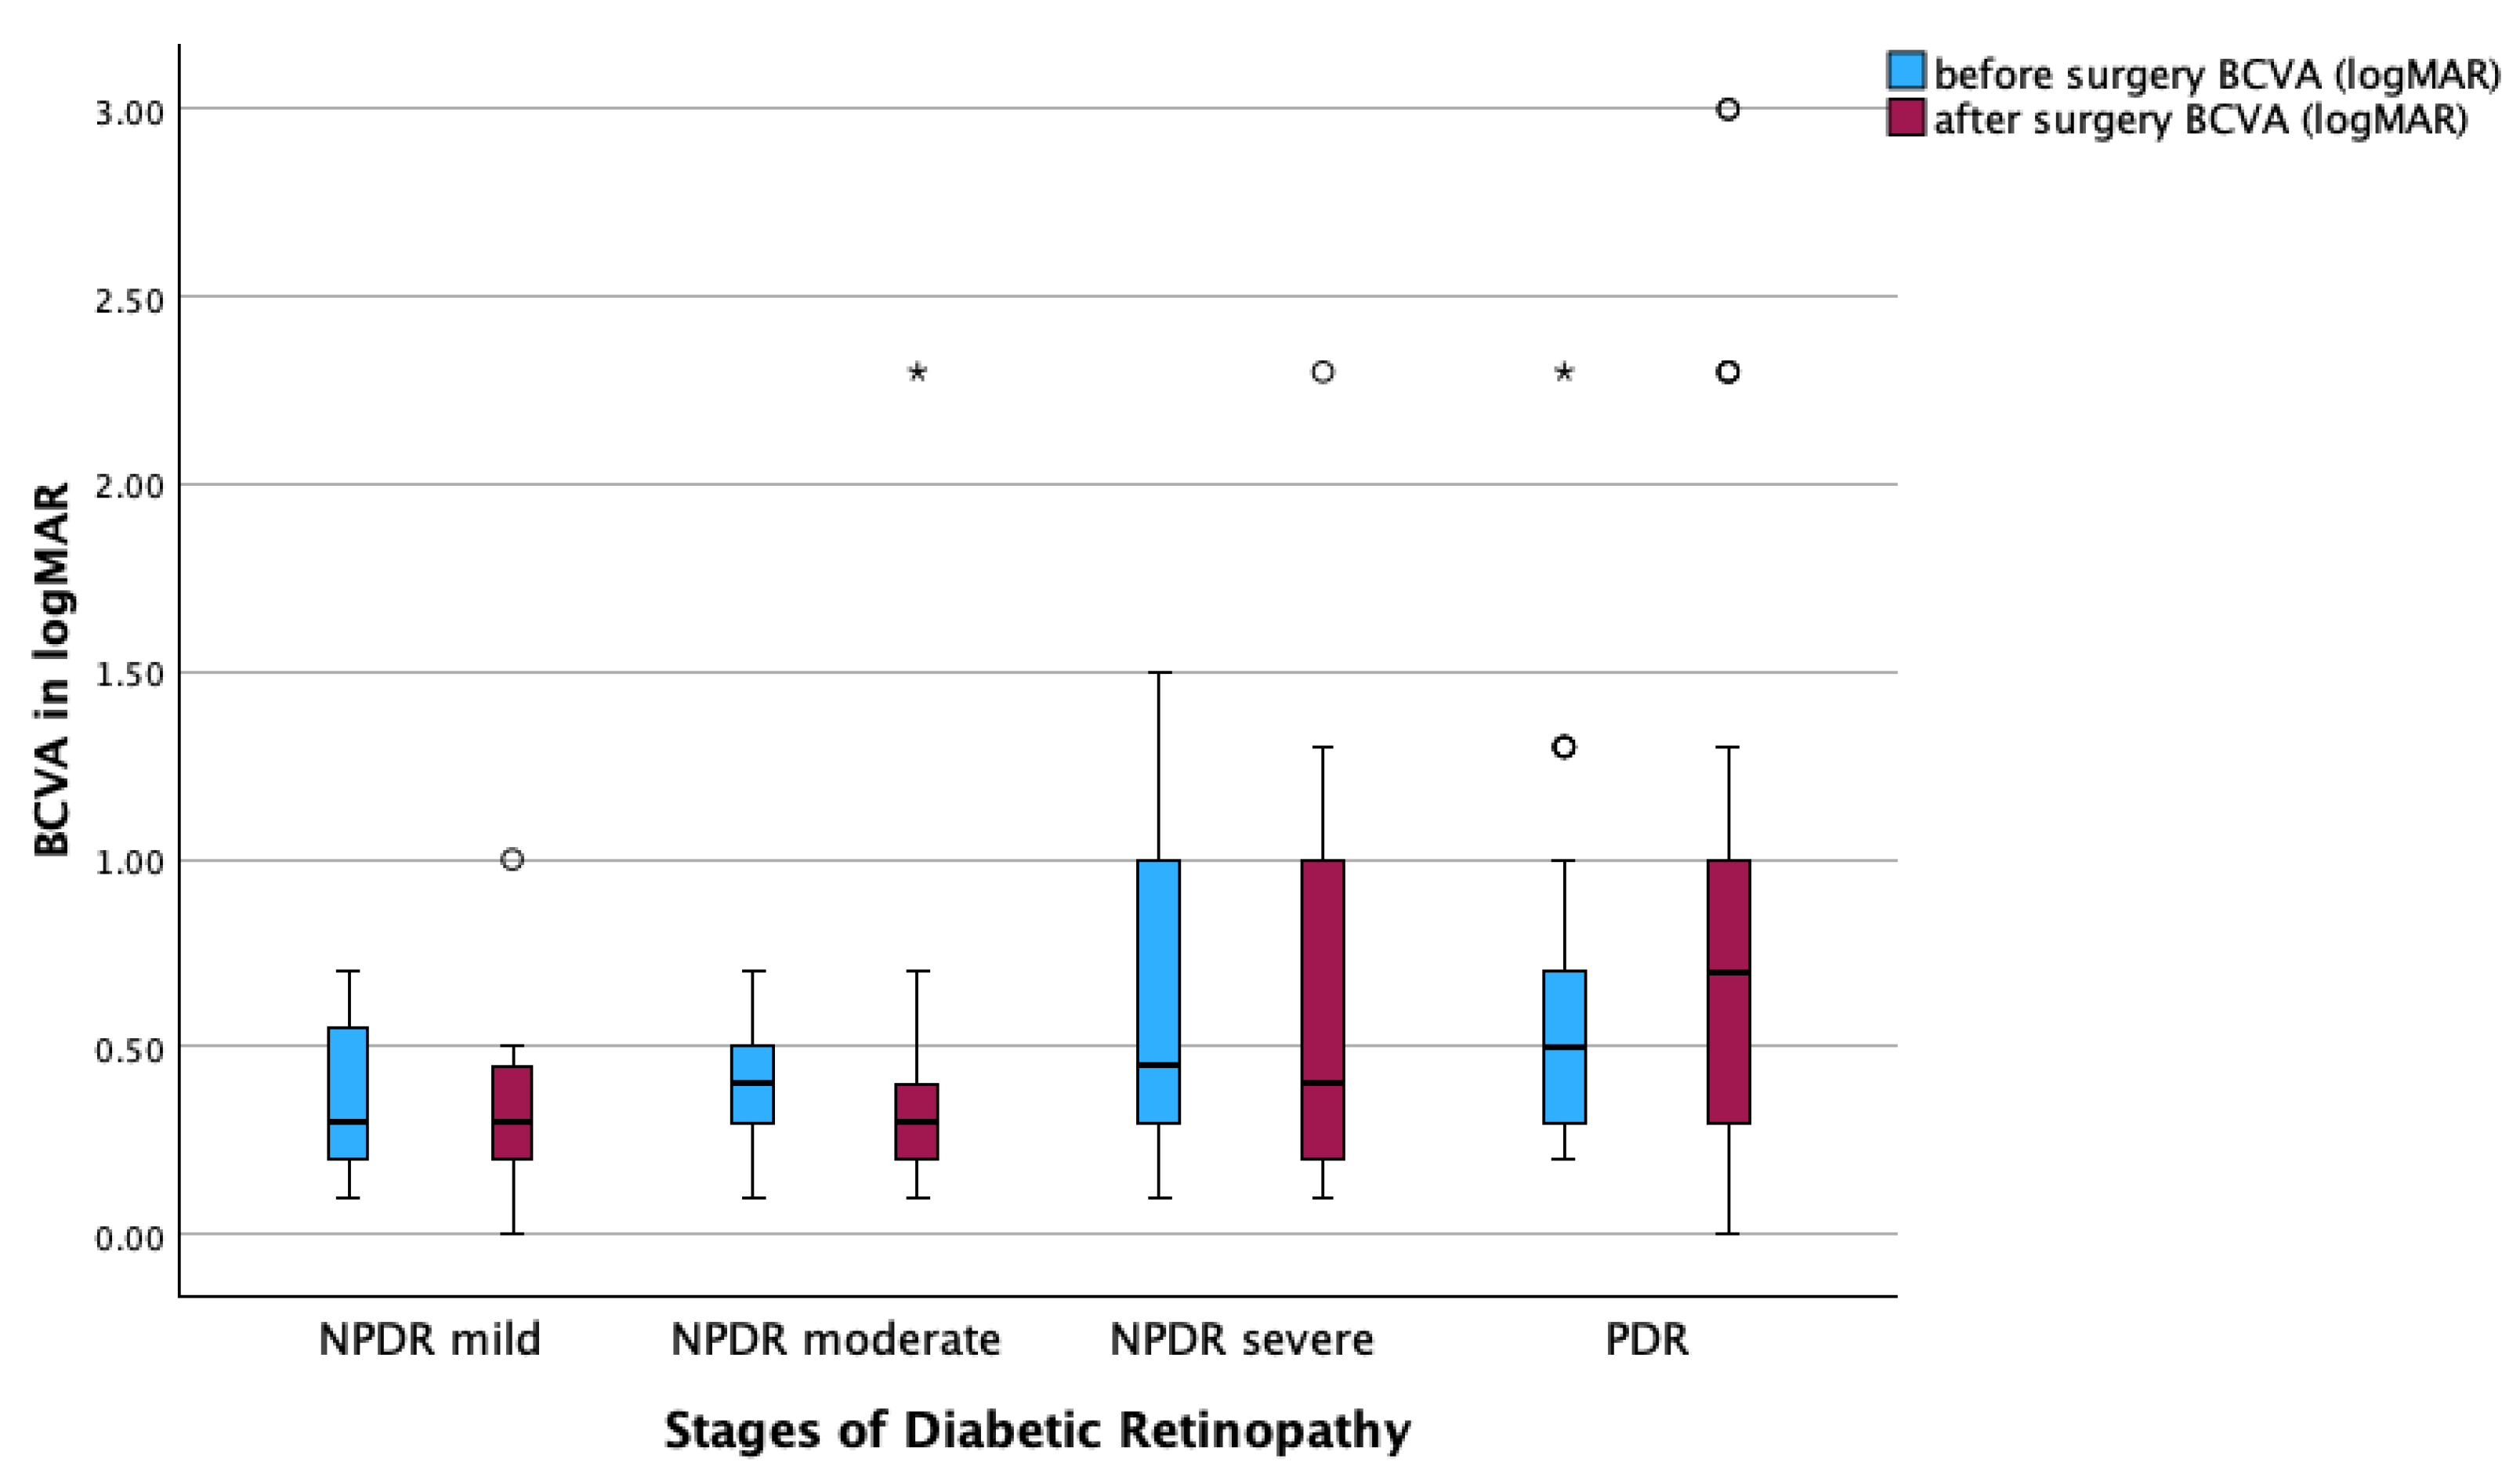
Figure 2). In contrast, there were no statistically significant changes in BCVA before and after surgery across all DR subgroups (
Figure 3).
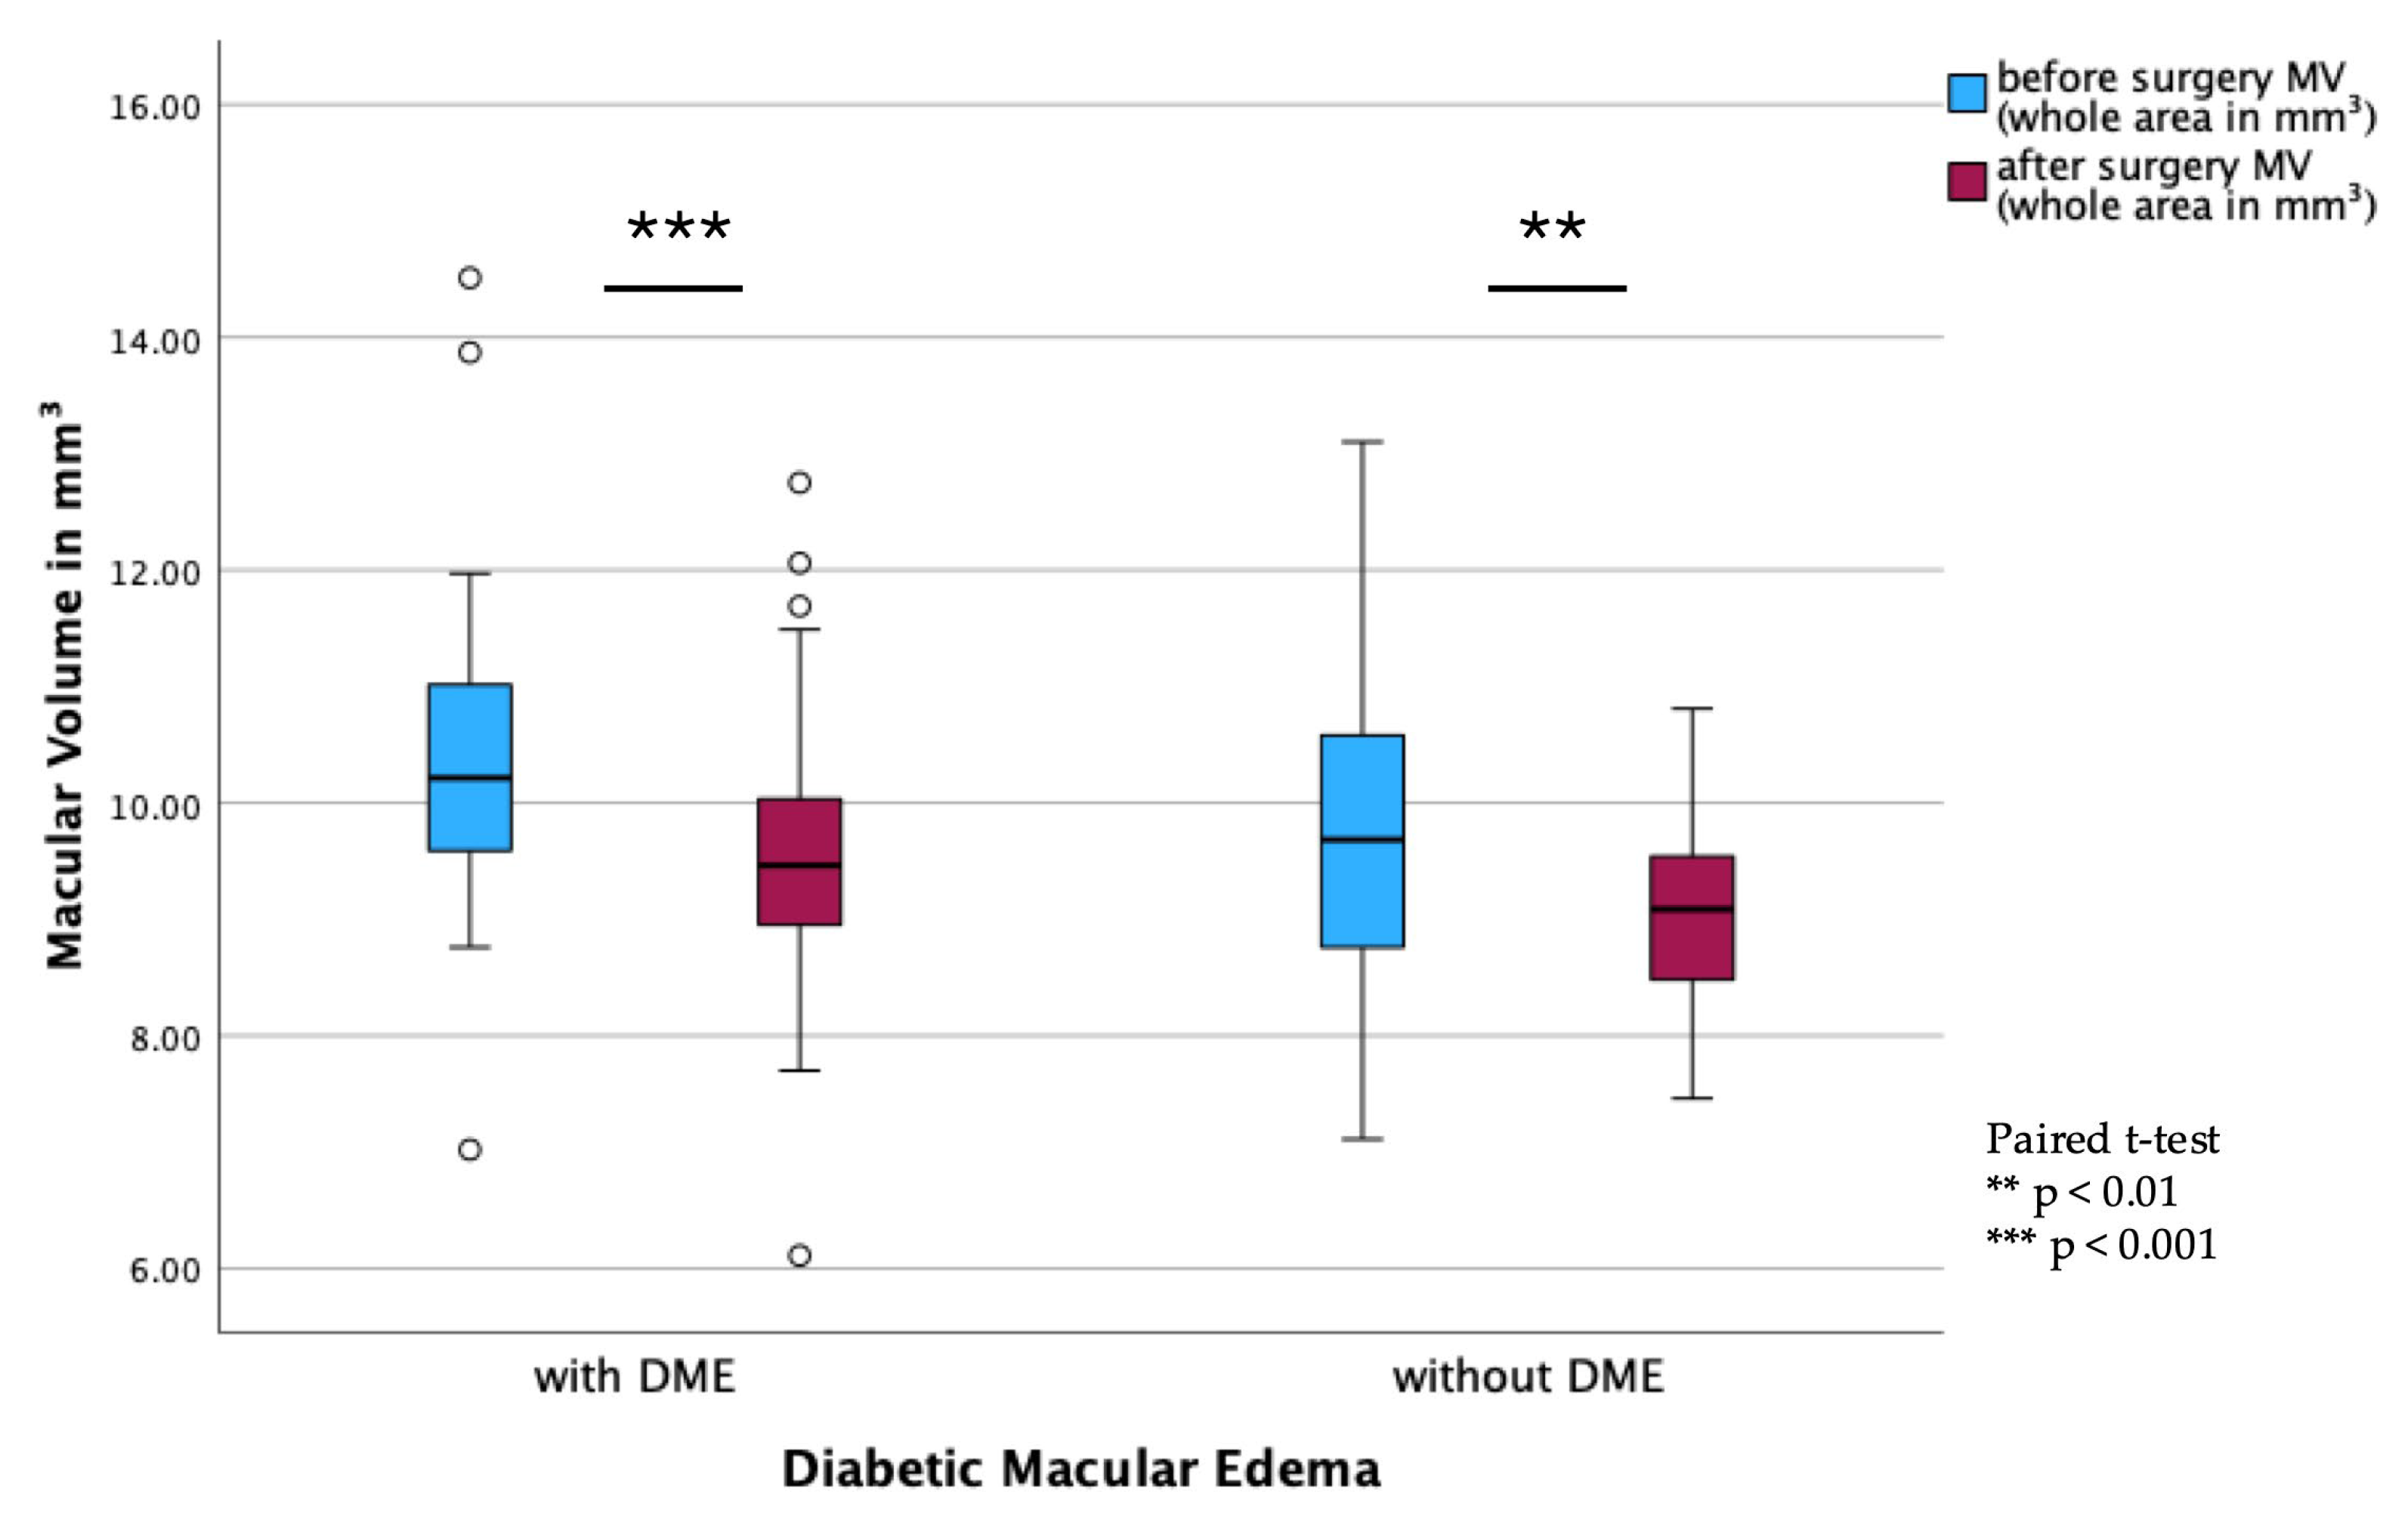
In the DME subgroups, a significant reduction in MV was observed in both DME (
p < 0.001) and non-DME patients (
p = 0.002;
Figure 4). However, BCVA remained stable postoperatively, with no significant differences observed between pre- and postoperative values (
Figure 5).
3.5. Complications
During the follow-up period, postoperative vitreous hemorrhage occurred in 2 of the 87 patients. One patient required reoperation 6 months after the initial procedure and subsequently developed a retinal detachment 13 months later, necessitating additional surgery. Among the phakic patients at baseline, 72.9% (35 out of 48 patients) required cataract surgery within 14.6 ± 21.2 months following ERM peeling. Postoperative OCT imaging revealed persistent diabetic macular edema (DME) in 85.0% of cases (51 of 60).
4. Discussion
Our study demonstrates significant anatomical improvements following vitrectomy with ERM peeling in patients with diabetic retinopathy, with a reduction in CSRT and MV. However, functional outcomes, as measured by BCVA, remained stable over time without significant long-term improvement. These findings suggest that, although anatomical restoration is achievable, sustained functional benefits may be limited by the progressive nature of diabetic retinal disease.
In our cohort, no significant improvements in BCVA were observed postoperatively. In patients with mild NPDR, there was a slight trend towards visual improvement, though it did not reach statistical significance. In contrast, eyes with more advanced stages of DR did not demonstrate visual rehabilitation. These findings differ from those reported by previous studies, which showed significant improvement in BCVA in diabetic patients who underwent ERM peeling [
4,
6,
9,
10]. A systematic review by Scheerlinck et al. focusing on patients with idiopathic ERM identified preoperative visual acuity as the most reliable predictive factor of postoperative visual acuity [
11]. The absence of visual improvement in eyes with advanced DR may be attributed to irreversible retinal damage. In proliferative DR, chronic ischemia and widespread microvascular degeneration result in structural alterations such as photoreceptor loss, inner retinal layer damage, and disruption of the neurovascular unit [
12]. While ERM peeling alleviates mechanical traction, it does not address these underlying degenerative pathologies. Moreover, advanced DR is frequently accompanied by macular ischemia and capillary dropout, which impair retinal perfusion and significantly limit the potential for postoperative visual recovery. Consequently, despite anatomical improvements, functional gains are unlikely in the presence of extensive neurovascular damage [
12,
13].
Our analysis showed significant reductions in CSRT, total MV, and central MV postoperatively, which align with previous studies reporting anatomical improvements following ERM removal in eyes with DME [
4,
9,
10].
Previous reports suggested that eyes with advanced fibrovascular proliferation may particularly benefit from the relief of tractional forces achieved via ILM peeling during PPV with a reduction of secondary ERM formation in comparison to a PDR group without ILM peeling [
14]. Furthermore, Le et al. published that the incidence of ERM formation following PRP was higher in patients with PDR (10.1%) compared to those with NPDR (5.7%), although this difference did not reach statistical significance [
15]. Despite the lack of statistical significance, this trend suggests a greater predisposition for ERM development in advanced stages of DR. This is consistent with our findings, where the PDR subgroup represented the largest portion of the cohort and had frequently undergone PRP prior to surgery (37 of 39 eyes with PDR).
The role of DME in surgical outcomes remains complex. Regarding OCT parameters, significant anatomical recovery was observed in eyes with and without DME after ERM peeling, including significant reductions in central retinal thickness and macular volume. However, eyes with DME showed no significant improvement in BCVA following surgery, which is consistent with the previous literature noting the chronic impact of DME on visual recovery [
9]. In contrast to our findings, Rabina et al. reported significant BCVA improvement following ERM peeling in patients with DME [
4]. This discrepancy may be attributed to the smaller sample size in their study (n = 23) and the high proportion of combined procedures, with cataract surgery performed in 43.5% of cases, which potentially may have contributed to the observed functional gains.
Although visual acuity improvements in patients without DME did not reach statistical significance, the overall trend suggests that the absence of chronic intraretinal fluid preserves retinal microstructure and facilitates better postoperative healing. These findings support the hypothesis that patients without DME may have a more favorable visual prognosis after ERM surgery due to less chronic retinal damage and better-preserved tissue integrity [
4].
Lens status did not influence the visual outcomes. We could not show significant improvements in both phakic and pseudophakic eyes. These findings are in contrast with Karger et al., who emphasized that while lens status influences visual rehabilitation, ERM removal independently contributes to visual improvement regardless of lens status [
16].
Postoperative analysis across subgroups defined by qualitative OCT parameters revealed distinct anatomical and functional patterns. Eyes without IRF or SRF demonstrated a decrease in BCVA alongside non-significant reductions in CSRT and MV. Although the anatomical results were not statistically significant, a medium effect size was observed. The limited functional response to surgery, in the absence of retinal fluid, possibly reflects structural damage that is not responsive to surgical intervention.
Eyes with IRF alone also showed anatomical improvements, particularly in CSRT and MV, while BCVA remained largely unchanged. This is consistent with previous studies, which demonstrated that eyes with secondary ERM due to diabetes exhibited more persistent intraretinal cysts and enlarged capillary-free zones on OCT angiography after ERM peeling compared to idiopathic cases [
17]. These changes have been attributed to Müller cell dysfunction and chronic retinal damage, potentially limiting visual recovery despite anatomical success [
17].
In eyes presenting with both IRF and SRF, reductions in CSRT and MV were noted, but BCVA tended to remain largely stable despite lower baseline visual acuity. Although based on a limited number of cases, the combination of IRF and SRF may indicate more advanced retinal pathologies and a poorer capacity for functional recovery following ERM peeling.
Regarding the presence of HF, BCVA decreased after surgery. Significant anatomical improvements were observed in MV and CSRT. These findings support the hypothesis that HF may reflect chronic retinal inflammation or microglial activation, which could limit visual recovery, particularly in eyes with DME, as suggested in previous studies [
18,
19,
20]. The group of patients without HF also showed similar visual outcomes but anatomical benefits after surgery.
Overall, the presence of IRF, SRF, and HF on OCT may indicate underlying retinal alterations that limit functional recovery despite anatomical improvements after ERM peeling in diabetic eyes.
This study has some limitations that should be acknowledged. First, the retrospective design and relatively limited sample size may affect the generalizability of our findings. Second, although we collected data on the duration of diabetes and glycemic control, other potential confounding factors—such as the timing and frequency of adjunctive treatments (e.g., IVF) and the presence of systemic comorbidities—were not fully controlled. Furthermore, we were unable to reliably assess the presence of ischemic maculopathy due to insufficient availability of preoperative fluorescein angiography or OCT angiography data. Additionally, the variability in follow-up duration across patients may have influenced the consistency of long-term visual outcome assessments. For patients who underwent surgery on both eyes, we selected the first-operated eye for analysis, as it typically represents the more severe case and has a longer follow-up period. We did not assess the presence or extent of posterior vitreous detachment using OCT, as this could not be reliably evaluated retrospectively in all cases using the available imaging data. Lastly, while significant anatomical improvements were observed, the relationship between these changes and functional visual recovery remains complex and warrants further investigation. Our findings underscore the multifactorial nature of visual outcomes in DR and the need for comprehensive management of both ocular and systemic comorbidities. Due to the retrospective nature of the study, no predictive conclusions regarding specific OCT features can be drawn. Further prospective studies with larger cohorts, additional imaging techniques (e.g., fluorescein angiography or OCT angiography), and standardized follow-up protocols are required to identify structural biomarkers associated with visual outcomes and to improve our understanding of the factors influencing visual and anatomical outcomes in this patient population.

 ,
, 
