
The General Movement Optimality Score-Revised (GMOS-R) with Socioeconomically Stratified Percentile Ranks

 ,
,  ,
,  , and
, and
Abstract
1. Introduction
2. Materials and Methods
2.1. Comparing the GMOS-R with the GMOS
2.2. Data
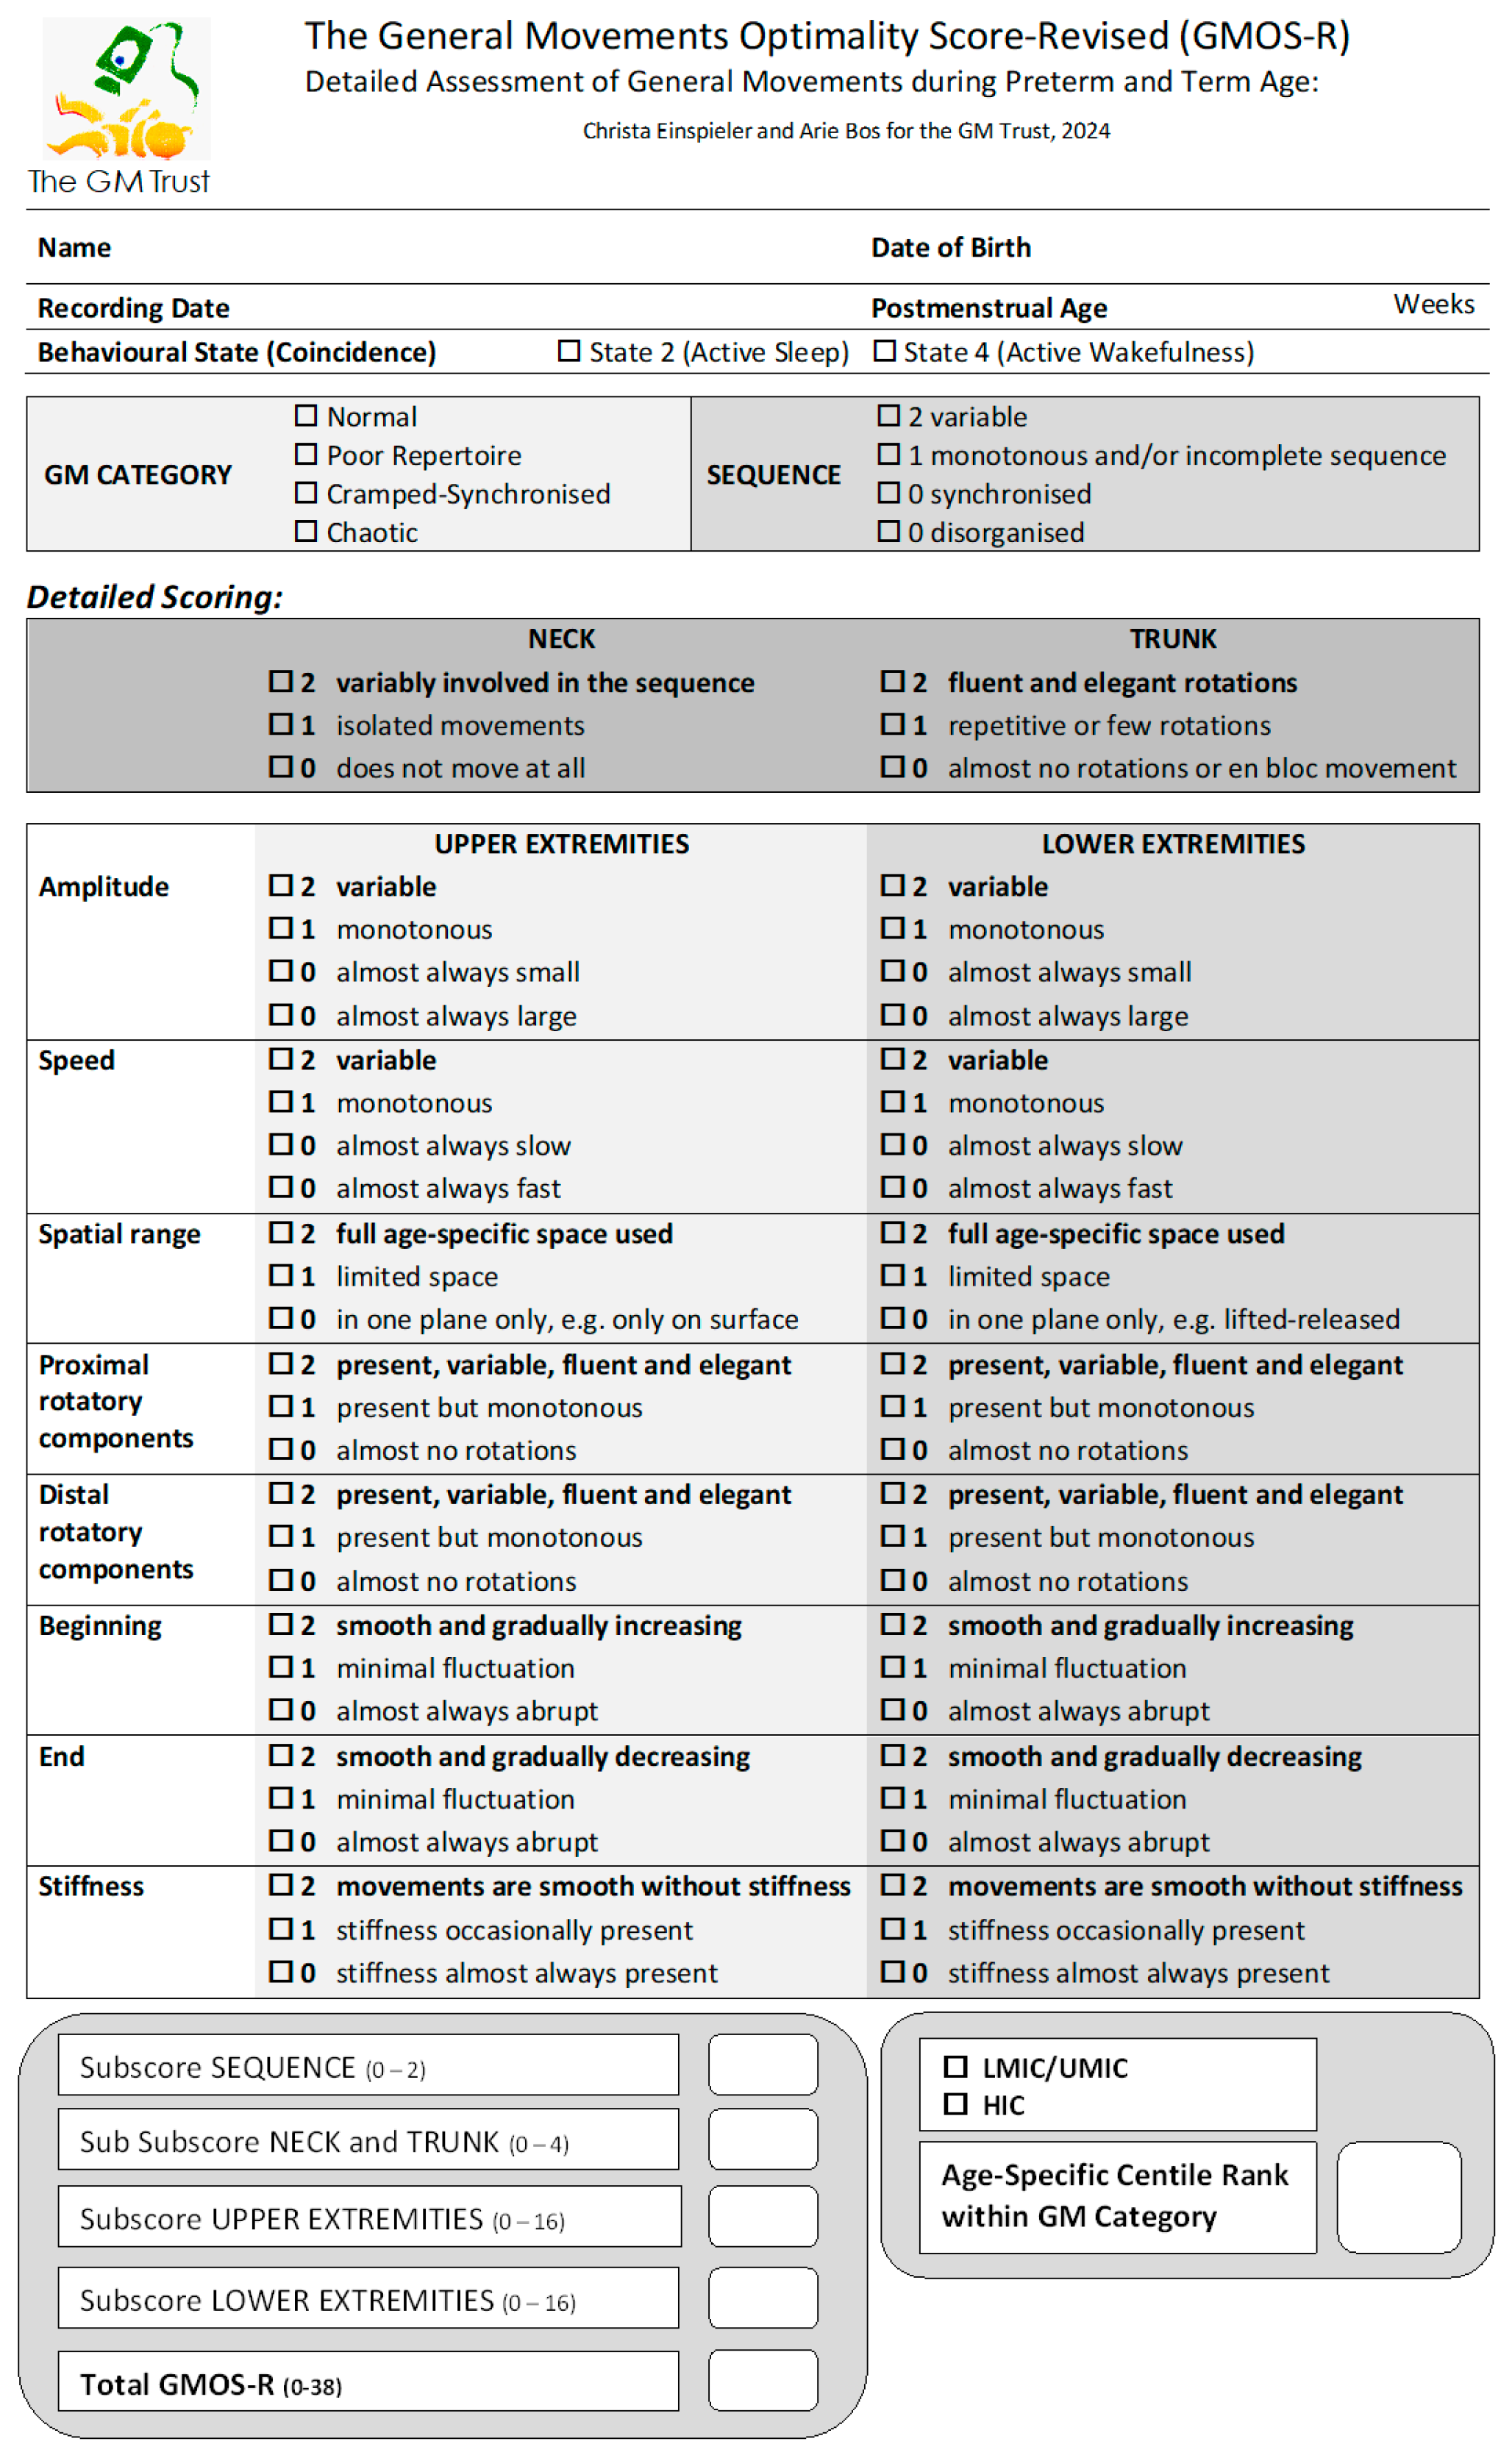
2.3. Scoring Procedure
2.4. Interscorer Agreement
2.5. Statistics
3. Results
3.1. Gestational Age at Birth and Sex
3.2. The Infants’ Country of Birth and Residence
3.3. Distribution of GMOS-R with Recording Age-Specific Percentiles
4. Discussion
4.1. Limitations
4.2. A Note of Caution
5. Conclusions
Supplementary Materials
Author Contributions
Funding
Institutional Review Board Statement
Informed Consent Statement
Data Availability Statement
Conflicts of Interest
References
- Prechtl, H.F.R. Qualitative changes of spontaneous movements in fetus and preterm infant are a marker of neurological dysfunction. Early Hum. Dev. 1990, 23, 151–158. [Google Scholar] [CrossRef] [PubMed]
- Prechtl, H.F.R.; Einspieler, C.; Cioni, G.; Bos, A.F.; Ferrari, F.; Sontheimer, D. An early marker for neurological deficits after perinatal brain lesions. Lancet 1997, 349, 1361–1363. [Google Scholar] [CrossRef] [PubMed]
- Einspieler, C.; Prechtl, H.F.R.; Bos, A.F.; Ferrari, F.; Cioni, G. Prechtl’s Method on the Qualitative Assessment of General Movements in Preterm, Term and Young Infants; Mac Keith Press: London, UK, 2004; pp. 1–104. [Google Scholar]
- Spittle, A.J.; Olsen, J.; Kwong, A.; Doyle, L.W.; Marschik, P.B.; Einspieler, C.; Cheong, J. The Baby Moves prospective cohort study protocol: Using a smartphone application with the General Movements Assessment to predict neurodevelopmental outcomes at age 2 years for extremely preterm or extremely low birthweight infants. BMJ Open 2016, 6, e013446. [Google Scholar] [CrossRef] [PubMed]
- Marschik, P.B.; Pokorny, F.B.; Peharz, R.; Zhang, D.; O’Muircheartaigh, J.; Roeyers, H.; Bölte, S.; Spittle, A.J.; Urlesberger, B.; Schuller, B.; et al. A novel way to measure and predict development: A heuristic approach to facilitate the early detection of neurodevelopmental disorders. Curr. Neurol. Neurosci. Rep. 2017, 17, 43. [Google Scholar] [CrossRef] [PubMed]
- Adde, L.; Brown, A.; van den Broeck, C.; DeCoen, K.; Eriksen, B.H.; Fjørtoft, T.; Groos, D.; Ihlen, E.A.F.; Osland, S.; Pascal, A.; et al. In-Motion-App for remote General Movement Assessment: A multi-site observational study. BMJ Open 2021, 11, e042147. [Google Scholar] [CrossRef]
- Irshad, M.T.; Nisar, M.A.; Gouverneur, P.; Rapp, M.; Grzegorzek, M. AI Approaches towards Prechtl’s assessment of general movements: A systematic literature review. Sensors 2020, 20, 5321. [Google Scholar] [CrossRef] [PubMed]
- Marschik, P.B.; Kulvicius, T.; Flügge, S.; Widmann, C.; Nielsen-Saines, K.; Schulte-Rüther, M.; Hüning, B.; Bölte, S.; Poustka, L.; Sigafoos, J.; et al. Open video data sharing in developmental science and clinical practice. iScience 2023, 26, 106348. [Google Scholar] [CrossRef] [PubMed]
- Silva, N.; Zhang, D.; Kulvicius, T.; Gail, A.; Barreiros, C.; Lindstaedt, S.; Kraft, M.; Bölte, S.; Poustka, L.; Nielsen-Saines, K.; et al. The future of General Movements Assessment: The role of computer vision and machine learning—A scoping review. Res. Dev. Disabil. 2021, 110, 103854. [Google Scholar] [CrossRef]
- Reich, S.; Zhang, D.; Kulvicius, T.; Bölte, S.; Nielsen-Saines, K.; Pokorny, F.B.; Peharz, R.; Poustka, L.; Wörgötter, F.; Einspieler, C.; et al. Novel AI driven approach to classify infant motor functions. Sci. Rep. 2021, 11, 9888. [Google Scholar] [CrossRef]
- Groos, D.; Adde, L.; Aubert, S.; Boswell, L.; de Regnier, R.A.; Fjørtoft, T.; Gaebler-Spira, D.; Haukeland, A.; Loennecken, M.; Msall, M.; et al. Development and validation of a deep learning method to predict cerebral palsy from spontaneous movements in infants at high risk. JAMA Netw. Open 2022, 5, e2221325. [Google Scholar] [CrossRef]
- Kulvicius, T.; Zhang, D.; Nielsen-Saines, K.; Bölte, S.; Kraft, M.; Einspieler, C.; Poustka, L.; Wörgötter, F.; Marschik, P.B. Infant movement classification through pressure distribution analysis—Added value for research and clinical implementation. Commun. Med. 2023, 3, 112. [Google Scholar] [CrossRef] [PubMed]
- Ma, L.; Yang, B.; Meng, L.; Wang, B.; Zheng, C.; Cao, A. Effect of early intervention on premature infants’ general movements. Brain Dev. 2015, 37, 387–393. [Google Scholar] [CrossRef] [PubMed]
- Raith, W.; Marschik, P.B.; Sommer, C.; Maurer-Fellbaum, U.; Amhofer, C.; Avian, A.; Löwenstein, E.; Soral, S.; Müller, W.; Einspieler, C.; et al. General movements in preterm infants undergoing craniosacral therapy: A randomised controlled pilot-trial. BMC Complement. Altern. Med. 2016, 16, 12. [Google Scholar] [CrossRef] [PubMed]
- Soloveichick, M.; Marschik, P.B.; Gover, A.; Molad, M.; Kessel, I.; Einspieler, C. Movement Imitation Therapy for Preterm Babies (MIT-PB): A novel approach to improve the neurodevelopmental outcome of infants at high-risk for cerebral palsy. J. Dev. Phys. Disabil. 2020, 32, 587–598. [Google Scholar] [CrossRef]
- Ustad, T.; Fjørtoft, T.; Øberg, G.K. General movement optimality score and general movements trajectories following early parent-administered physiotherapy in the neonatal intensive care unit. Early Hum. Dev. 2021, 163, 105488. [Google Scholar] [CrossRef] [PubMed]
- Bos, M.; van Dokkum, N.H.; Ravensbergen, A.G.; Kraft, K.E.; Bos, A.F.; Jaschke, A.C. Pilot study finds that performing live music therapy in intensive care units may be beneficial for infants’ neurodevelopment. Acta Paediatr. 2021, 110, 2350–2351. [Google Scholar] [CrossRef] [PubMed]
- Span, L.C.; van Dokkum, N.H.; Ravensbergen, A.G.; Bos, A.F.; Jaschke, A.C. Combining kangaroo care and live-performed music therapy: Effects on physiological stability and neurological functioning in extremely and very preterm infants. Int. J. Environ. Res. Public. Health 2021, 18, 6580. [Google Scholar] [CrossRef] [PubMed]
- Khurana, S.; Rao, B.K.; Lewis, L.; Kumaran, S.D.; Kamath, A.; Einspieler, C.; Dusing, S.C. Neonatal PT improves neurobehavior and general movements in moderate to late preterm infants born in India: An RCT. Pediatr. Phys. Ther. 2021, 33, 208–216. [Google Scholar] [CrossRef] [PubMed]
- Einspieler, C.; Marschik, P.B.; Pansy, J.; Scheuchenegger, A.; Krieber, M.; Yang, H.; Kornacka, M.K.; Rowinska, E.; Soloveichick, M.; Bos, A.F. The general movement optimality score: A detailed assessment of general movements during preterm and term age. Dev. Med. Child Neurol. 2016, 58, 361–368. [Google Scholar] [CrossRef]
- Prechtl, H.F.R. The optimality concept. Early Hum. Dev. 1980, 4, 201–205. [Google Scholar] [CrossRef]
- Barbosa, V.M.; Einspieler, C.; Smith, E.V.; Bos, A.F.; Cioni, G.; Ferrari, F.; Yang, H.; Urlesberger, B.; Marschik, P.B.; Zhang, D. Clinical implications of the general movement optimality score: Beyond the classes of Rasch analysis. J. Clin. Med. 2021, 10, 1069. [Google Scholar] [CrossRef] [PubMed]
- Yildirim, C.; Asalioğlu, A.; Coşkun, Y.; Acar, G.; Akman, I. General movement assessment and Alberta Infant Motor Scale in neurodevelopmental outcome of preterm infants. Pediatr. Neonatol. 2022, 63, 535–541. [Google Scholar] [CrossRef]
- Ustad, T.; Evensen, K.A.I.; Bertoncelli, N.; Frassodati, R.; Ferrari, F. Validity of the general movement optimality list in infants born preterm. Pediatr. Phys. Ther. 2017, 29, 315–320. [Google Scholar] [CrossRef] [PubMed]
- Zorzenon, R.F.M.; Takaara, L.K.; Linhares, M.B.M. General spontaneous movements in preterm infants differentiated by post-conceptional ages. Early Hum. Dev. 2019, 134, 1–6. [Google Scholar] [CrossRef] [PubMed]
- Maeda, T.; Iwata, H.; Sekiguchi, K.; Takahashi, M.; Ihara, K. The association between brain morphological development and the quality of general movements. Brain Dev. 2019, 41, 490–500. [Google Scholar] [CrossRef] [PubMed]
- Katušić, A.; Žunić Išasegi, I.; Radoš, M.; Raguž, M.; Grizelj, R.; Ferrari, F.; Kostović, I. Transient structural MRI patterns correlate with the motor functions in preterm infants. Brain Dev. 2021, 43, 363–371. [Google Scholar] [CrossRef]
- Wang, J.; Shen, X.; Hu, X.; Yang, H.; Yin, H.; Zhu, X.; Gao, H.; Wu, Y.; Meng, F. Early detection relationship of cerebral palsy markers using brain structure and general movements in infants born <32 weeks gestational age. Early Hum. Dev. 2021, 163, 105452. [Google Scholar] [CrossRef]
- Hempenius, M.A.; Verhagen, E.A.; Tanis, J.C.; Einspieler, C.; Bos, A.F. Early neonatal morbidities and neurological functioning of preterm infants 2 weeks after birth. J. Perinatol. 2018, 38, 1518–1525. [Google Scholar] [CrossRef] [PubMed]
- Maeda, T.; Inoue, M.; Sekiguchi, K.; Ihara, K. Aminophylline-associated irritable behaviour in preterm neonates. Early Hum. Dev. 2016, 99, 37–41. [Google Scholar] [CrossRef]
- Pansy, J.; Baik, N.; Schwaberger, B.; Scheuchenegger, A.; Pichler-Stachl, E.; Avian, A.; Schmölzer, G.M.; Urlesberger, B.; Pichler, G. Cerebral hypoxia during immediate transition after birth and short term neurological outcome. Early Hum. Dev. 2017, 110, 13–15. [Google Scholar] [CrossRef]
- Kalteren, W.S.; Mebius, M.J.; Verhagen, E.A.; Tanis, J.C.; Kooi, E.M.W.; Bos, A.F. Neonatal hemoglobin levels in preterm infants are associated with early neurological functioning. Neonatology 2021, 118, 593–599. [Google Scholar] [CrossRef] [PubMed]
- Rodijk, L.H.; Bos, A.F.; Verkade, H.J.; de Kleine, R.H.; Hulscher, J.B.F.; Bruggink, J.L.M. Early motor repertoire in infants with biliary atresia: A nationwide prospective cohort study. J. Pediatr. Gastroenterol. Nutr. 2021, 72, 592–596. [Google Scholar] [CrossRef] [PubMed]
- Robinson, H.; Hart, D.; Vollmer, B. Predictive validity of a qualitative and quantitative Prechtl’s General Movement Assessment at term age: Comparison between preterm infants and term infants with HIE. Early Hum. Dev. 2021, 161, 105449. [Google Scholar] [CrossRef] [PubMed]
- Yin, H.; Wang, X.; Yang, H.; Zhu, X.; Wang, J.; Li, Z. A pilot study of the General Movement Optimality Score detects early signs of motor disorder in neonates with arterial ischemic stroke. Early Hum. Dev. 2021, 163, 105484. [Google Scholar] [CrossRef] [PubMed]
- Barbosa, V.M.; Smith, E.V.; Bos, A.F.; Cioni, G.; Ferrari, F.; Guzzetta, A.; Marschik, P.B.; Pansy, J.; Urlesberger, B.; Yang, H.; et al. Psychometric properties of the general movement optimality score using Rasch measurement. J. Appl. Meas. 2020, 2, 17–37. [Google Scholar]
- Olsen, J.E.; Brown, N.C.; Eeles, A.L.; Einspieler, C.; Lee, K.J.; Thompson, D.K.; Anderson, P.J.; Cheong, J.L.; Doyle, L.W.; Spittle, A.J. Early general movements and brain magnetic resonance imaging at term-equivalent age in infants born <30 weeks’ gestation. Early Hum. Dev. 2016, 101, 63–68. [Google Scholar] [CrossRef] [PubMed]
- Fajardo Martinez, V.; Zhang, D.; Paiola, S.; Mok, T.; Cambou, M.C.; Kerin, T.; Rao, R.; Brasil, P.; Ferreira, F.; Fuller, T.; et al. Neuromotor repertoires in infants exposed to maternal COVID-19 during pregnancy: A cohort study. BMJ Open 2020, 13, e069194. [Google Scholar] [CrossRef] [PubMed]
- Ricci, E.; Einspieler, C.; Craig, A.K. Feasibility of using the general movements assessment of infants in the United States. Phys. Occup. Ther. Pediatr. 2018, 38, 269–279. [Google Scholar] [CrossRef]
- Toldo, M.; Varishtananda, S.; Einspieler, C.; Tripathi, N.; Singh, A.; Verma, S.K.; Vishwakarma, K.; Zhang, D.; Dwivedi, A.; Gupta, R.; et al. Enhancing early detection of neurological and developmental disorders and provision of intervention in low-resource settings in Uttar Pradesh; India: Study protocol of the G.A.N.E.S.H. programme. BMJ Open 2020, 10, e037335. [Google Scholar] [CrossRef]
- The World Bank Country Classifications by Income Level, 2022–2023. Available online: https://blogs.worldbank.org/opendata/new-world-bank-country-classifications-income-level-2022-2023 (accessed on 12 January 2024).
- Ferrari, F.; Cioni, G.; Prechtl, H.F.R. Qualitative changes of general movements in preterm infants with brain lesions. Early Hum. Dev. 1990, 23, 193–231. [Google Scholar] [CrossRef]
- De Vries, N.K.S.; van der Veere, C.N.; Reijneveld, S.A.; Bos, A.F. Early neurological outcome of young infants exposed to selective serotonin reuptake inhibitors during pregnancy: Results from the observational SMOK study. PLoS ONE 2013, 8, e64654. [Google Scholar] [CrossRef] [PubMed]
- Hitzert, M.M.; Benders, M.J.N.L.; Roescher, A.M.; van Bel, F.; de Vries, L.S.; Bos, A.F. Hydrocortisone vs dexamethasone treatment for bronchopulmonary dysplasia and their effects on general movements in preterm infants. Pediatr. Res. 2012, 71, 100–106. [Google Scholar] [CrossRef] [PubMed]
- Chawanpaiboon, S.; Vogel, J.P.; Moller, A.B.; Lumbiganon, P.; Petzold, M.; Hogan, D.; Landoulsi, S.; Jampathong, N.; Kongwattanakul, K.; Laopaiboon, M.; et al. Global, regional, and national estimates of levels of preterm birth in 2014: A systematic review and modelling analysis. Lancet Glob Health 2019, 7, e37–e46. [Google Scholar] [CrossRef] [PubMed]
- Olsen, J.E.; Brown, N.C.; Eeles, A.B.; Lee, K.J.; Anderson, P.J.; Cheong, J.L.; Doyle, L.W.; Spittle, A.J. Trajectories of general movements from birth to term-equivalent age in infants born <30 weeks’ gestation. Early Hum. Dev. 2015, 91, 683–688. [Google Scholar] [CrossRef] [PubMed]
- De Vries, N.K.; Bos, A.F. The quality of general movements in the first ten days of life in preterm infants. Early Hum. Dev. 2010, 86, 225–229. [Google Scholar] [CrossRef] [PubMed]
- Burger, M.; Hoosain, M.; Einspieler, C.; Unger, M.; Niehaus, D. Maternal perinatal mental health and infant and toddler neurodevelopment—Evidence from low and middle-income countries. A systematic review. J. Affect. Disord. 2020, 268, 158–172. [Google Scholar] [CrossRef] [PubMed]
- Tikmani, S.S.; Ali, S.A.; Saleem, S.; Bann, C.M.; Mwenechanya, M.; Carlo, W.A.; Figueroa, L.; Garces, A.L.; Krebs, N.F.; Patel, A.; et al. Trends of antenatal care during pregnancy in low- and middle-income countries: Findings from the global network maternal and newborn health registry. Semin. Perinatol. 2019, 43, 297–307. [Google Scholar] [CrossRef]
- Krishnan, V.; Kumar, V.; Variane, G.F.T.; Carlo, W.A.; Bhutta, Z.A.; Sizonenko, S.; Hansen, A.; Shankaran, S.; Thayyil, S. Need for more evidence in the prevention and management of perinatal asphyxia and neonatal encephalopathy in low and middle income countries: A call for action. Semin. Fetal Neonatal Med. 2021, 26, 101271. [Google Scholar] [CrossRef] [PubMed]
- Mabrouk, A.; Abubakar, A.; Too, E.K.; Chongwo, E.; Adetifa, I.M. A scoping review of preterm births in sub-Saharan Africa: Burden, risk factors and outcomes. Int. J. Environ. Res. Public. Health 2022, 19, 10537. [Google Scholar] [CrossRef]
- Cao, G.; Liu, J.; Liu, M. Global, regional, and national incidence and mortality of neonatal preterm birth, 1990–2019. JAMA Pediatr. 2022, 176, 787–796. [Google Scholar] [CrossRef]
- Seesahai, J.; Luther, M.; Church, P.T.; Maddalena, P.; Asztalos, E.; Rotter, T.; Banihani, R. The assessment of general movements in term and late preterm infants diagnosed with neonatal encephalopathy as a predictive tool of cerebral palsy by 2 years of age—A scoping review. Syst. Rev. 2021, 10, 226. [Google Scholar] [CrossRef] [PubMed]
- Einspieler, C.; Utsch, F.; Brasil, P.; Panvequio Aizawa, C.Y.; Peyton, C.; Hydee Hasue, R.; Françoso Genovesi, F.; Damasceno, L.; Moreira, M.E.; Adachi, K.; et al. Association of infants exposed to prenatal Zika virus infection with their clinical, neurologic, and developmental status evaluated via the general movement assessment tool. JAMA Netw. Open 2019, 2, e187235. [Google Scholar] [CrossRef] [PubMed]
- Bölte, S.; Neufeld, J.; Marschik, P.B.; Williams, Z.J.; Gallagher, L.; Lai, M.C. Sex and gender in neurodevelopmental conditions. Nat. Rev. Neurol. 2023, 19, 136–159. [Google Scholar] [CrossRef] [PubMed]
- Cioni, G.; Prechtl, H.F.R. Preterm and early post-term motor behaviour in low-risk premature infants. Early Hum. Dev. 1990, 23, 159–191. [Google Scholar] [CrossRef] [PubMed]
- PEW Research Center, Washington DC, USA. Available online: https://www.pewresearch.org/global/interactives/global-population-by-income/ (accessed on 12 January 2024).
- Ramaswamy, V.V.; Abiramalatha, T.; Bandyopadhyay, T.; Shaik, N.B.; Bandiya, P.; Nanda, D.; Pullattayil S., A.K.; Murki, S.; Roehr, C.C. ELBW and ELGAN outcomes in developing nations–Systematic review and meta-analysis. PLoS ONE 2021, 16, e0255352. [Google Scholar] [CrossRef] [PubMed]
- Tomantschger, I.; Herrero, D.; Einspieler, C.; Hamamura, C.; Calil Voos, M.; Marschik, P.B. The general movement assessment in non-European low- and middle-income countries. Rev. Saude Publica 2018, 52, 6. [Google Scholar] [CrossRef]
- Novak, I.; Morgan, C.; Adde, L.; Blackman, J.; Boyd, R.N.; Brunstrom-Hernandez, J.; Cioni, G.; Damiano, D.; Darrah, J.; Eliasson, A.C.; et al. Early, accurate diagnosis and early intervention in cerebral palsy: Advances in diagnosis and treatment. JAMA Pediatr. 2017, 171, 897–907. [Google Scholar] [CrossRef]

| Female/Male | Pre-/Fullterm | Total | |
|---|---|---|---|
| North America | |||
| UMICs a (n = 10) | 2/4 | 5/4 | |
| HICs b (n = 120) | 24/32 | 78/29 | 130 (6.6%) |
| Not diclosed/not known | 68 | 14 | |
| South America | |||
| LMICs c and UMICs d (n = 123) | 44/46 | 85/5 | |
| HICs e (n = 18) | 7/11 | 16/2 | 141 (7.1%) |
| Not diclosed/not known | 33 | 33 | |
| Europe | |||
| HICs f | 429/625 | 1023/50 | 1168 (58.9%) |
| Not diclosed/not known | 114 | 95 | |
| Africa | |||
| LMICs g and UMICs h | 39/38 | 112/21 | 151 (7.6%) |
| Not diclosed/not known | 74 | 18 | |
| Asia | |||
| LMICs i and UMICs j (n = 225) | 58/64 | 99/80 | |
| HICs k (n = 65) | 11/19 | 46/9 | 290 (14.6%) |
| Not diclosed/not known | 138 | 56 | |
| Australia and NewZealand | |||
| HICs | 22/35 | 46/9 | 103 (5.2%) |
| Not disclosed/not known | 46 | 56 | |
| Total | 636/874 | 1544/205 | 1983 (100%) |
| Not disclosed/not known | 473 | 234 |
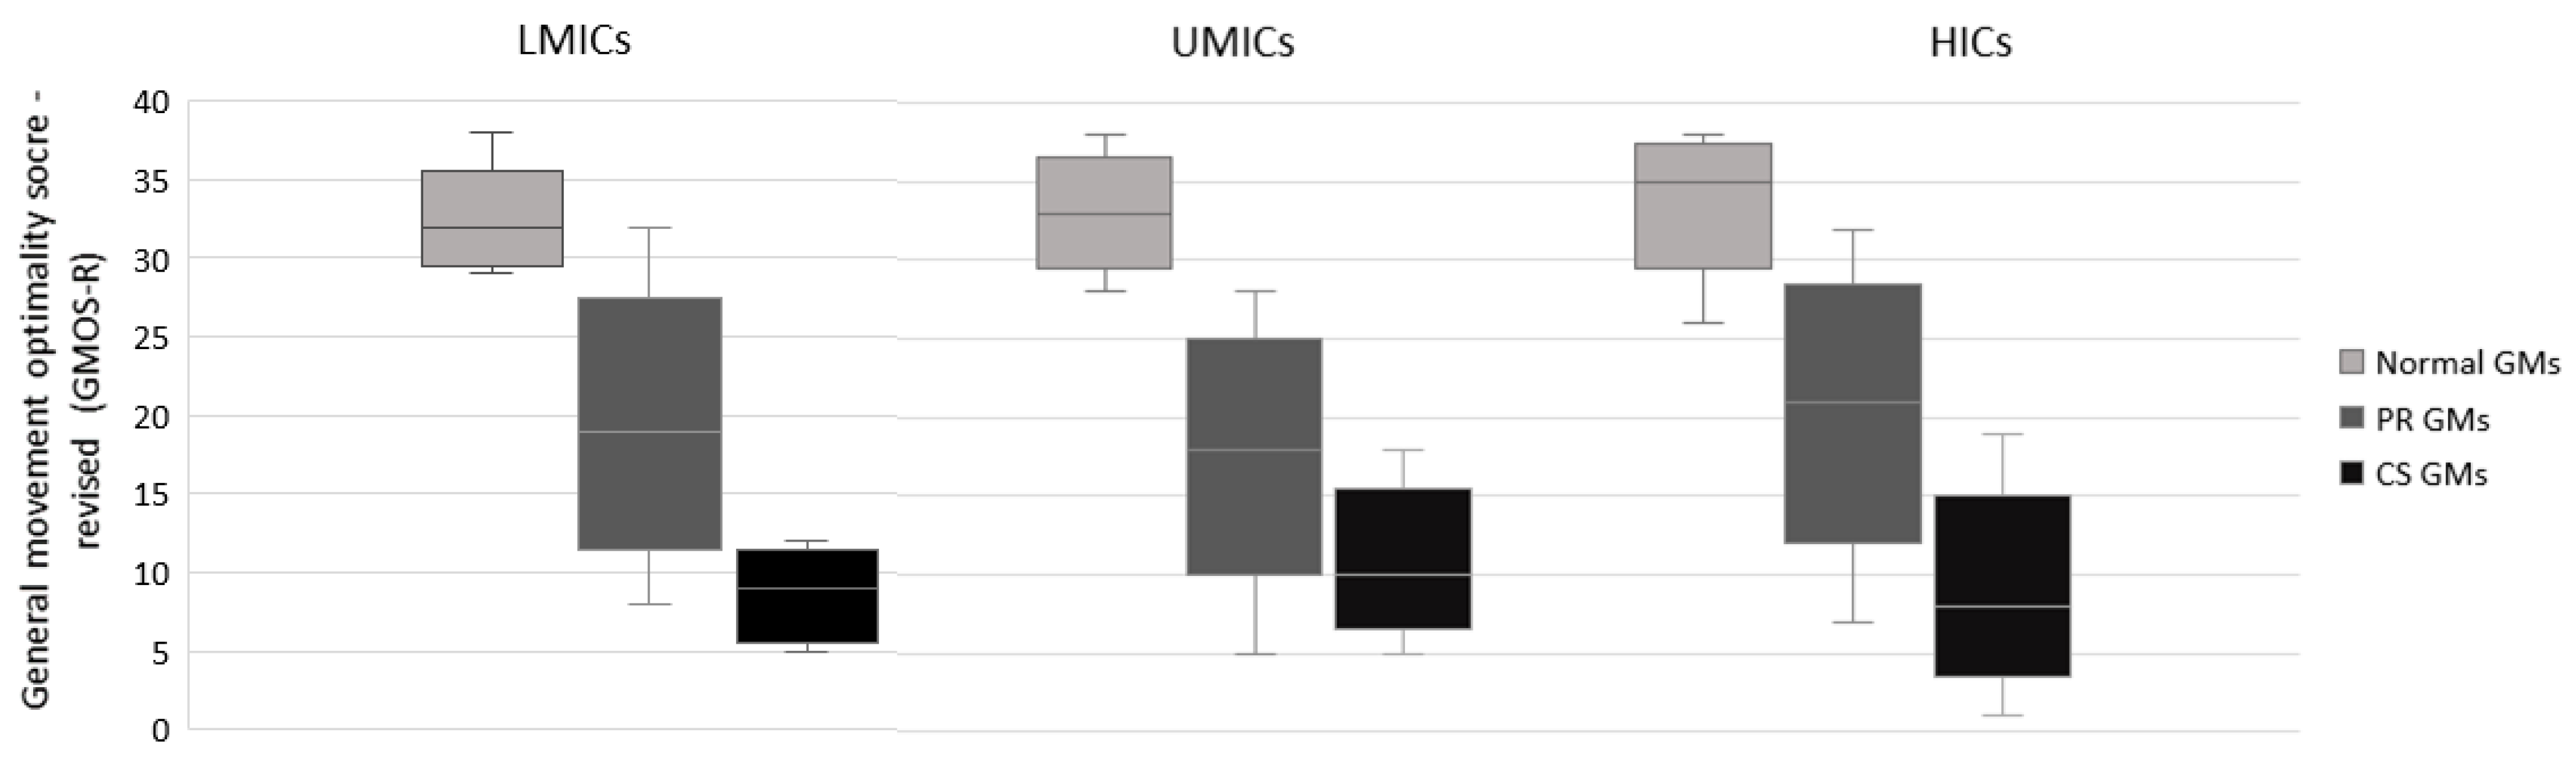
| LMICs | UMICs | HICs | |
|---|---|---|---|
| Median = 32 | Median = 33 | Median = 33 | |
| P25–P75 = 30–33 | P25–P75 = 31–35 | P25–P75 = 33–37 | |
| Normal GMs | Min–Max = 29–38 | Min–Max = 28–38 | Min–Max = 26–38 |
| n = 50 | n = 78 | n = 355 | |
| LMICs vs. UMICs: Z = −2.61; p = 0.009 | |||
| LMICs vs. HICs: Z = −5.58; p < 0.001 | |||
| UMICs vs. HICs: Z = −3.59; p < 0.001 | |||
| LMICs and UMICs vs. HICs: Z = −5.84; p < 0.001 | |||
| Median = 19 | Median = 18 | Median = 21 | |
| P25–P75 = 15–23 | P25–P75 = 15–22 | P25–P75 = 17–25 | |
| PR GMs | Min–Max = 8–32 | Min–Max = 5–28 | Min–Max = 7–32 |
| n = 91 | n = 236 | n = 848 | |
| LMICs vs. UMICs: Z = 1.14; p = 0.253 | |||
| LMICs vs. HICs: Z = −3.34; p < 0.001 | |||
| UMICs vs. HICs: Z = −6.85; p < 0.001 | |||
| LMICs and UMICs vs. HICs: Z = −7.16; p < 0.001 | |||
| Median = 9 | Median = 10 | Median = 8 | |
| P25–P75 = 6–11 | P25–P75 = 8–13 | P25–P75 = 6–11 | |
| CS GMs | Min–Max = 5–12 | Min–Max = 5–18 | Min–Max = 1–19 |
| n = 13 | n = 35 | n = 251 | |
| LMICs vs. UMICs: Z = −1.63; p = 0.102 | |||
| LMICs vs. HICs: Z = 0.34; p = 0.735 | |||
| UMICs vs. HICs: Z = 3.16; p = 0.002 | |||
| LMICs and UMICs vs. HICs: Z = 2.80; p = 0.005 | |||
| Median = 11 | |||
| P25–P75 = 8–15 | |||
| Chaotic GMs | Min–Max = 11–16 | Min–Max = 8–14 | Min–Max = 6–22 |
| n = 2 | n = 4 | n = 20 | |
| LMICs and UMICs vs. HICs: Z = −0.31; p = 0.760 | |||
| Age Period of Assessment | Normal GMs | PR GMs | CS GMs | Chaotic GMs | Total |
|---|---|---|---|---|---|
| Extremely preterm | n = 16 | ||||
| LMICs | 0 | 0 | 0 | 0 | |
| UMICs | 0 | 8 | 0 | 0 | 8 |
| HICs | 5 | 3 | 0 | 0 | 8 |
| Distribution | 31% | 69% | |||
| Very preterm | n = 185 | ||||
| LMICs | 2 | 4 | 0 | 0 | 6 |
| UMICs | 1 | 5 | 1 | 0 | 7 |
| HICs | 35 | 134 | 3 | 0 | 172 |
| Distribution | 21% | 77% | 2% | ||
| Moderate preterm | n = 234 | ||||
| LMICs | 1 | 3 | 0 | 0 | 4 |
| UMICs | 3 | 9 | 0 | 0 | 12 |
| HICs | 35 | 150 | 32 | 1 | 218 |
| Distribution | 17% | 69% | 14% | ||
| Late preterm | n = 437 | ||||
| LMICs | 6 | 10 | 0 | 1 | 17 |
| UMICs | 14 | 29 | 7 | 2 | 52 |
| HICs | 94 | 180 | 78 | 16 | 368 |
| Distribution | 26% | 50% | 20% | 4% | |
| Term | n = 492 | ||||
| LMICs | 9 | 26 | 6 | 1 | 42 |
| UMICs | 28 | 76 | 16 | 2 | 122 |
| HICs | 71 | 176 | 78 | 3 | 328 |
| Distribution | 22% | 57% | 20% | 1% | |
| Post-term | n = 619 | ||||
| LMICs | 32 | 48 | 7 | 0 | 87 |
| UMICs | 32 | 109 | 11 | 0 | 152 |
| HICs | 115 | 205 | 60 | 0 | 380 |
| Distribution | 29% | 58% | 13% | ||
| Total | n = 1983 | ||||
| LMICs | 50 | 91 | 13 | 2 | 156 |
| UMICs | 78 | 236 | 35 | 4 | 353 |
| HICs | 355 | 848 | 251 | 20 | 1474 |
| Recording Age | <316 Weeks | 320–336 Weeks | 340–366 Weeks | ||||||||||||
| N | PR | N | PR | CS | N | PR | CS | ||||||||
| n = 3 | n = 17 | n = 4 | n = 12 | n = 0 | n = 20 | n = 39 | n = 7 | ||||||||
| LMICs and UMICs | Max | n.a. | 24 | n.a. | n.a. | n.a. | 37 | 27 | n.a. | ||||||
| P90 | 23 | 37 | 25 | ||||||||||||
| P75 | 19 | 34 | 22 | ||||||||||||
| P50 | 14 | 32 | 20 | ||||||||||||
| P25 | 12 | 31 | 15 | ||||||||||||
| P10 | 8 | 29 | 10 | ||||||||||||
| Min | 8 | 29 | 5 | ||||||||||||
| Recording Age | <316 Weeks | 320–336 Weeks | 340–366 Weeks | ||||||||||||
| N | PR | N | PR | CS | N | PR | CS | ||||||||
| n = 40 | n = 137 | n = 35 | n = 150 | n = 32 | n = 94 | n = 180 | n = 78 | ||||||||
| HICs | Max | 38 | 32 | 38 | 32 | 16 | 38 | 32 | 18 | ||||||
| P90 | 37 | 31 | 38 | 31 | 15 | 38 | 27 | 13 | |||||||
| P75 | 35 | 28 | 37 | 28 | 12 | 37 | 25 | 11 | |||||||
| P50 | 34 | 23 | 35 | 23 | 8 | 36 | 21 | 7 | |||||||
| P25 | 32 | 18 | 33 | 19 | 6 | 33 | 17 | 5 | |||||||
| P10 | 31 | 15 | 31 | 16 | 3 | 32 | 14 | 4 | |||||||
| Min | 26 | 9 | 31 | 7 | 2 | 29 | 8 | 1 | |||||||
| Recording Age | 370–416 Weeks | 420–456 Weeks | |||||||||||||
| N | PR | CS | N | PR | CS | ||||||||||
| n = 37 | n = 102 | n = 22 | n = 64 | n = 157 | n = 18 | ||||||||||
| LMICs and UMICs | Max | 38 | 28 | 17 | 38 | 32 | 17 | ||||||||
| P90 | 37 | 26 | 13 | 36 | 25 | 14 | |||||||||
| P75 | 34 | 23 | 12 | 35 | 22 | 11 | |||||||||
| P50 | 33 | 18 | 10 | 33 | 19 | 9 | |||||||||
| P25 | 31 | 15 | 7 | 31 | 16 | 8 | |||||||||
| P10 | 30 | 11 | 6 | 29 | 14 | 5 | |||||||||
| Min | 29 | 6 | 5 | 28 | 10 | 5 | |||||||||
| Recording Age | 370–416 Weeks | 420–456 Weeks | |||||||||||||
| N | PR | CS | N | PR | CS | ||||||||||
| n = 71 | n = 176 | n = 78 | n = 115 | n = 204 | n = 60 | ||||||||||
| HICs | Max | 38 | 32 | 19 | 38 | 32 | 16 | ||||||||
| P90 | 38 | 28 | 14 | 37 | 27 | 15 | |||||||||
| P75 | 37 | 24 | 11 | 36 | 24 | 12 | |||||||||
| P50 | 35 | 20 | 9 | 34 | 20 | 9 | |||||||||
| P25 | 31 | 17 | 6 | 32 | 16 | 6 | |||||||||
| P10 | 28 | 14 | 4 | 30 | 14 | 5 | |||||||||
| Min | 26 | 8 | 3 | 26 | 7 | 1 | |||||||||
Disclaimer/Publisher’s Note: The statements, opinions and data contained in all publications are solely those of the individual author(s) and contributor(s) and not of MDPI and/or the editor(s). MDPI and/or the editor(s) disclaim responsibility for any injury to people or property resulting from any ideas, methods, instructions or products referred to in the content. |
© 2024 by the authors. Licensee MDPI, Basel, Switzerland. This article is an open access article distributed under the terms and conditions of the Creative Commons Attribution (CC BY) license (https://creativecommons.org/licenses/by/4.0/).
Share and Cite
Einspieler, C.; Bos, A.F.; Spittle, A.J.; Bertoncelli, N.; Burger, M.; Peyton, C.; Toldo, M.; Utsch, F.; Zhang, D.; Marschik, P.B. The General Movement Optimality Score-Revised (GMOS-R) with Socioeconomically Stratified Percentile Ranks. J. Clin. Med. 2024, 13, 2260. https://doi.org/10.3390/jcm13082260
Einspieler C, Bos AF, Spittle AJ, Bertoncelli N, Burger M, Peyton C, Toldo M, Utsch F, Zhang D, Marschik PB. The General Movement Optimality Score-Revised (GMOS-R) with Socioeconomically Stratified Percentile Ranks. Journal of Clinical Medicine. 2024; 13(8):2260. https://doi.org/10.3390/jcm13082260
Chicago/Turabian StyleEinspieler, Christa, Arend F. Bos, Alicia J. Spittle, Natascia Bertoncelli, Marlette Burger, Colleen Peyton, Moreno Toldo, Fabiana Utsch, Dajie Zhang, and Peter B. Marschik. 2024. "The General Movement Optimality Score-Revised (GMOS-R) with Socioeconomically Stratified Percentile Ranks" Journal of Clinical Medicine 13, no. 8: 2260. https://doi.org/10.3390/jcm13082260
APA StyleEinspieler, C., Bos, A. F., Spittle, A. J., Bertoncelli, N., Burger, M., Peyton, C., Toldo, M., Utsch, F., Zhang, D., & Marschik, P. B. (2024). The General Movement Optimality Score-Revised (GMOS-R) with Socioeconomically Stratified Percentile Ranks. Journal of Clinical Medicine, 13(8), 2260. https://doi.org/10.3390/jcm13082260