

COVID-19: The Development and Validation of a New Mortality Risk Score
 , ,
, ,  ,
,  , , , ,
  and
and 
Abstract
1. Introduction
2. Materials and Methods
2.1. Study Design, Setting, and Study Population
2.2. Data Collection
2.3. Statistical Analyses
2.3.1. Development of a New Risk Scoring System
2.3.2. Performances Evaluation and Comparison
3. Results
3.1. Study Population, Univariate and Multivariable Analysis
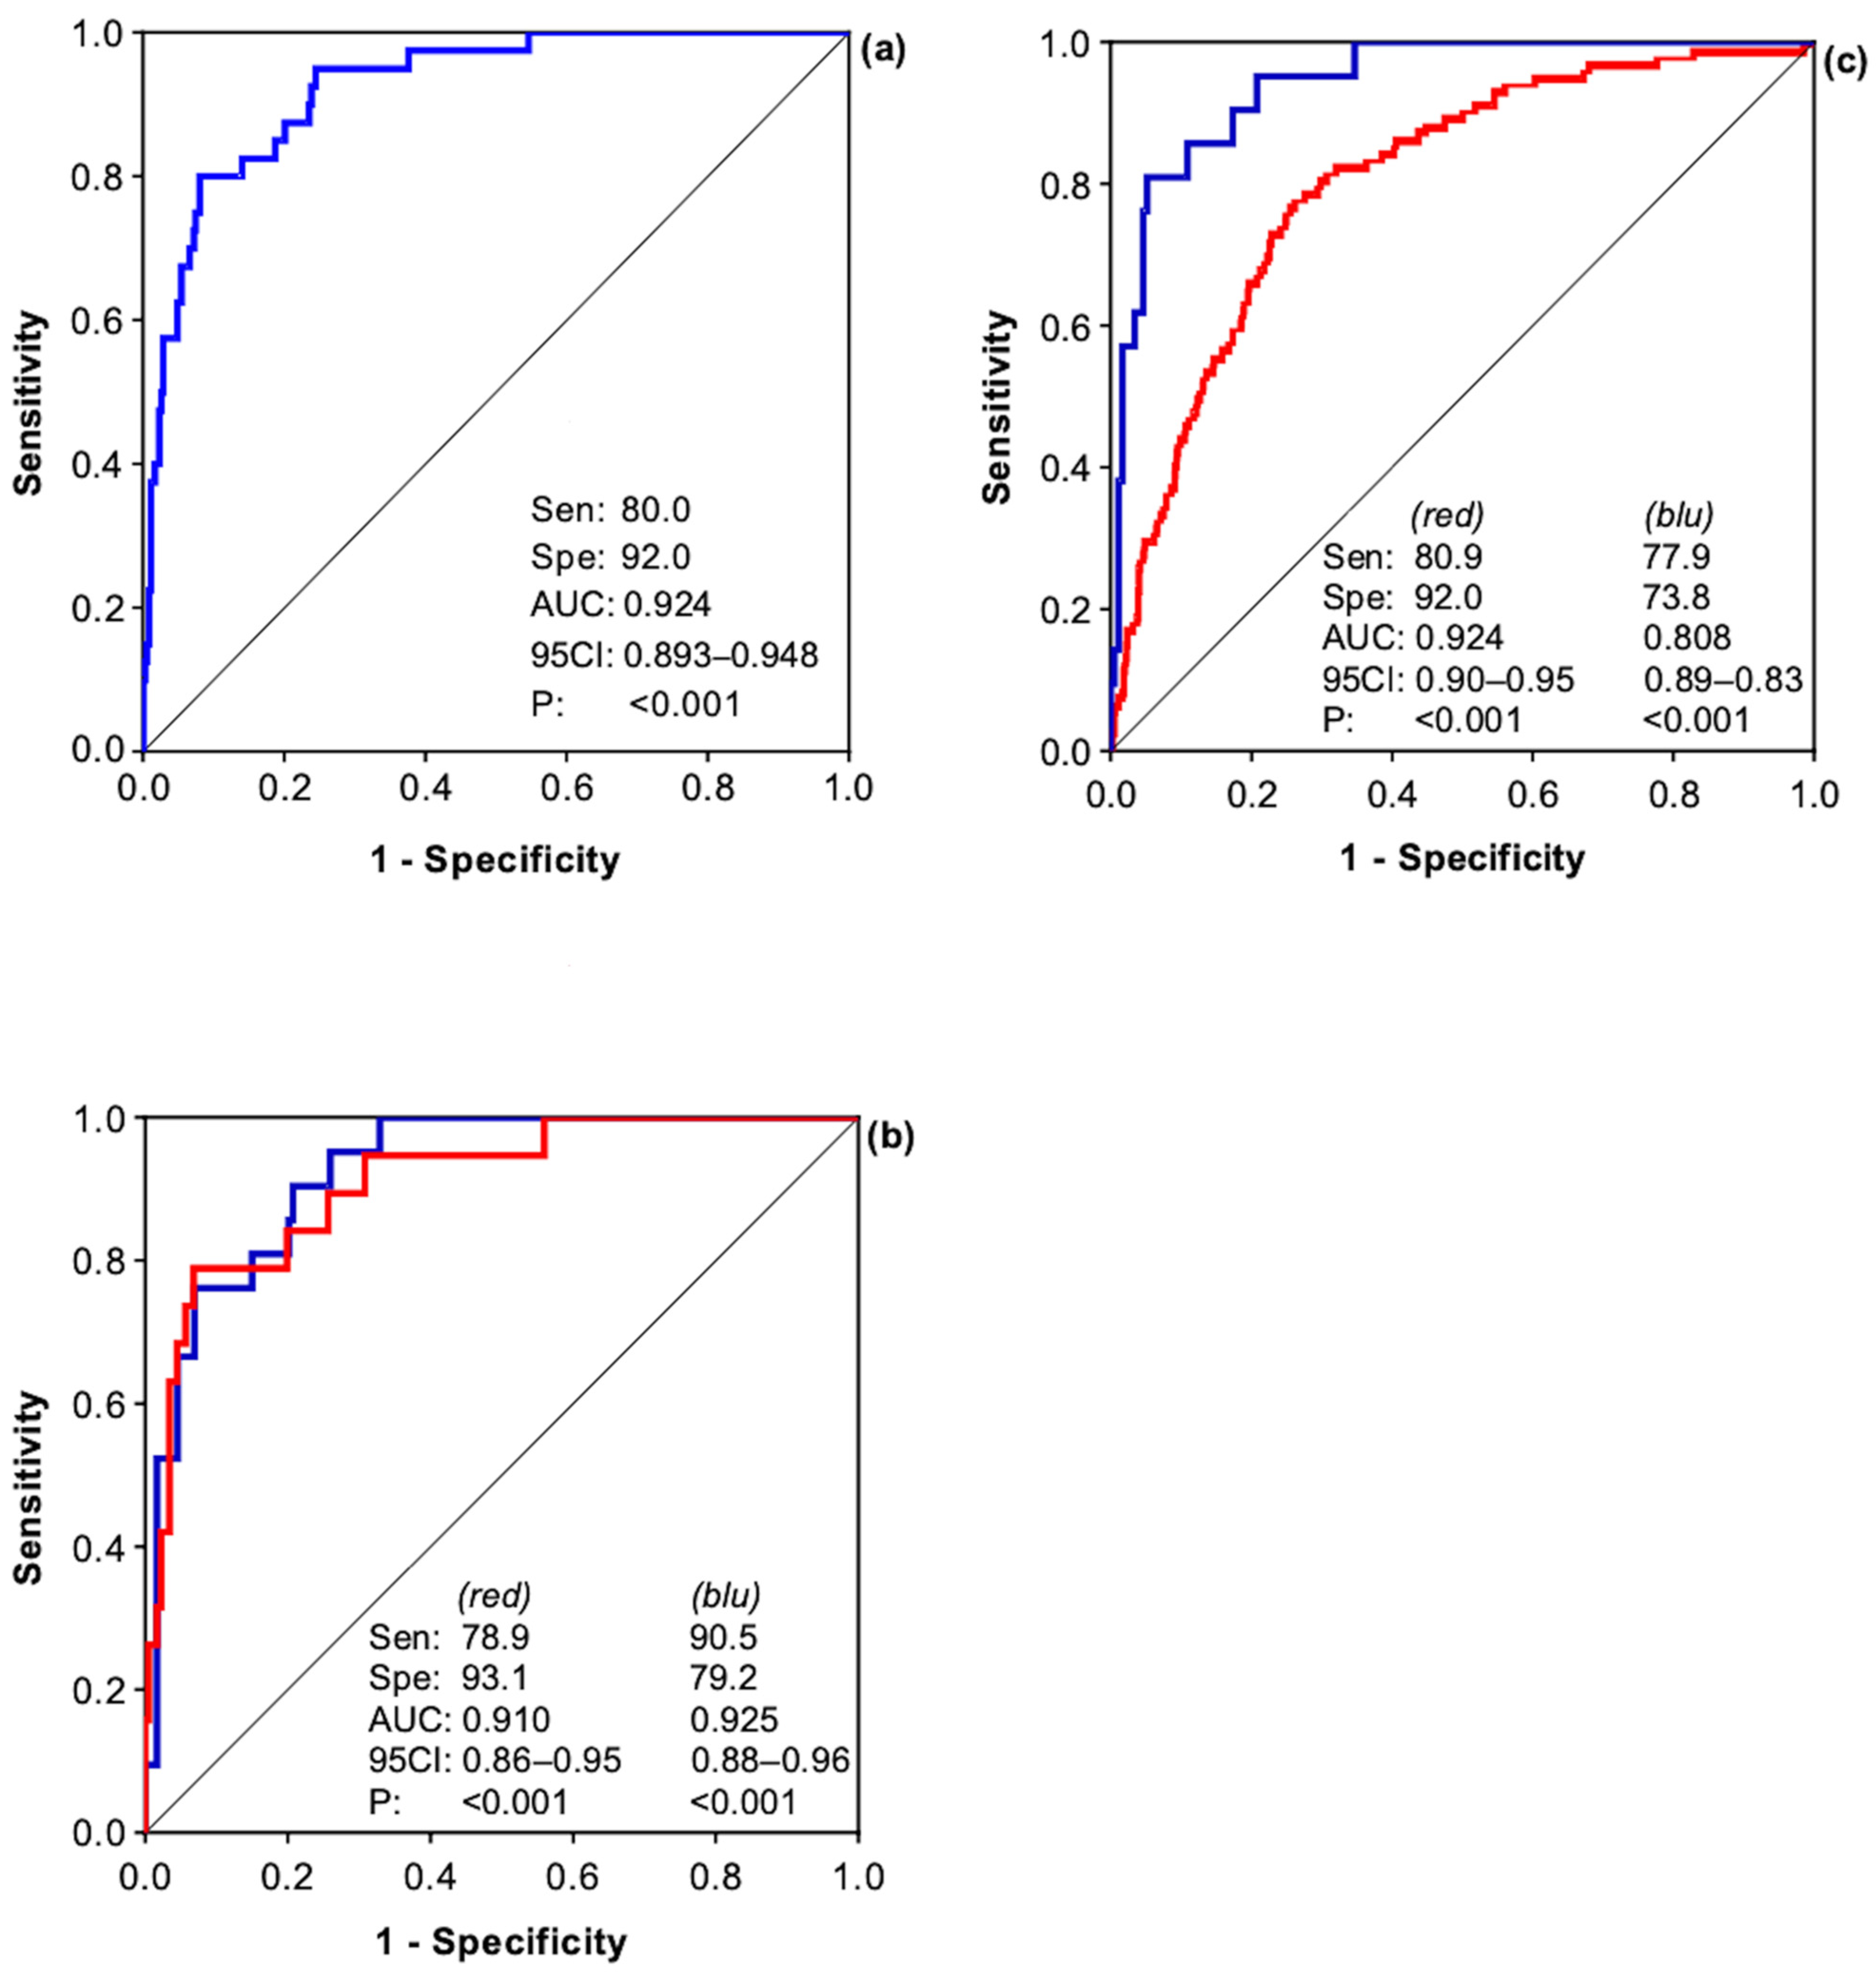
3.2. Prognostic Model COVID-19 Mortality
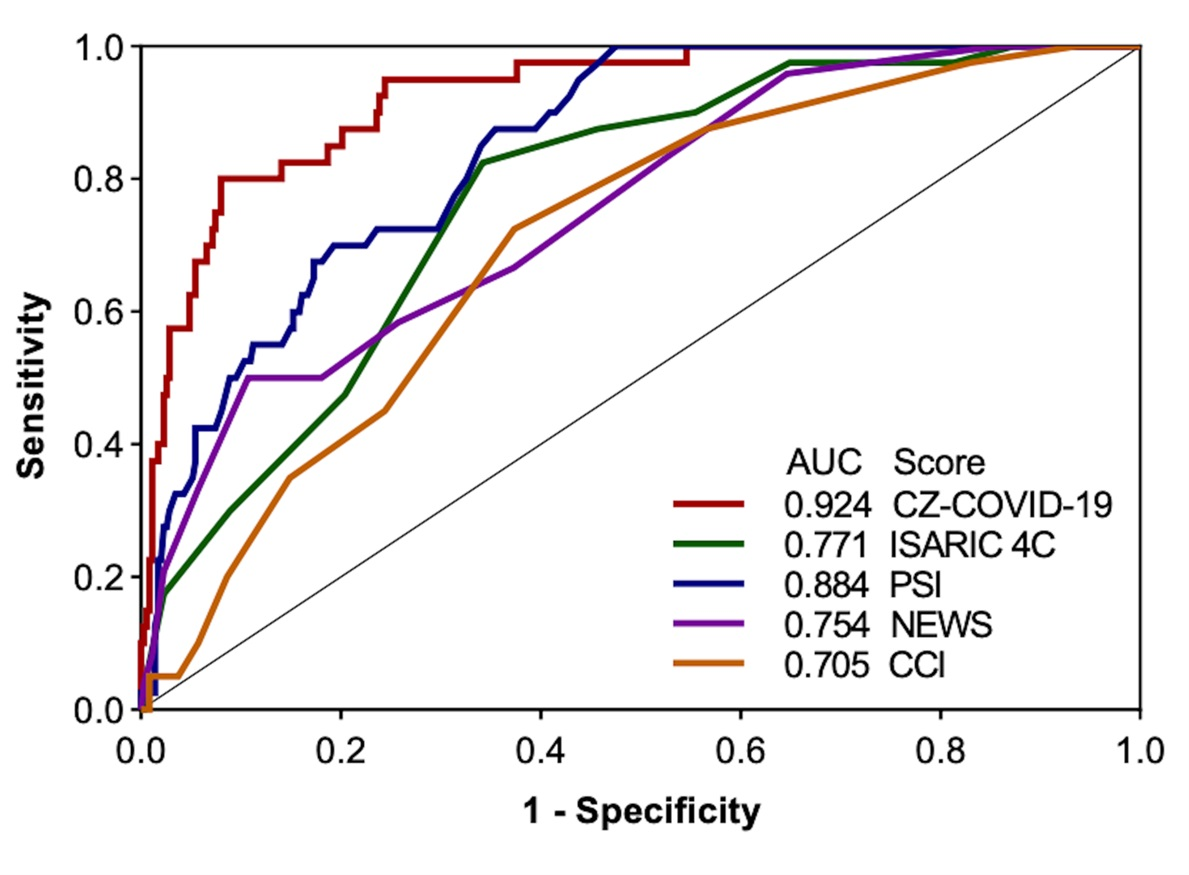
3.3. Comparison with Other Standard Scores
4. Discussion
5. Conclusions
Supplementary Materials
Author Contributions
Funding
Institutional Review Board Statement
Informed Consent Statement
Data Availability Statement
Conflicts of Interest
References
- Dorrucci, M.; Minelli, G.; Boros, S.; Manno, V.; Prati, S.; Battaglini, M.; Corsetti, G.; Andrianou, X.; Riccardo, F.; Fabiani, M.; et al. Excess Mortality in Italy During the COVID-19 Pandemic: Assessing the Differences Between the First and the Second Wave, Year 2020. Front. Public Health 2021, 9, 669209. [Google Scholar] [CrossRef]
- Grande, E.; Fedeli, U.; Pappagallo, M.; Crialesi, R.; Marchetti, S.; Minelli, G.; Iavarone, I.; Frova, L.; Onder, G.; Grippo, F. Variation in Cause-Specific Mortality Rates in Italy during the First Wave of the COVID-19 Pandemic: A Study Based on Nationwide Data. Int. J. Environ. Res. Public Health 2022, 19, 805. [Google Scholar] [CrossRef] [PubMed]
- Garattini, L.; Zanetti, M.; Freemantle, N. The Italian NHS: What Lessons to Draw from COVID-19? Appl. Health Econ. Health Policy 2020, 18, 463–466. [Google Scholar] [CrossRef] [PubMed]
- Suter, F.; Consolaro, E.; Pedroni, S.; Moroni, C.; Pastò, E.; Paganini, M.V.; Pravettoni, G.; Cantarelli, U.; Rubis, N.; Perico, N.; et al. A simple, home-therapy algorithm to prevent hospitalisation for COVID-19 patients: A retrospective observational matched-cohort study. EClinicalMedicine 2021, 37, 100941. [Google Scholar] [CrossRef] [PubMed]
- Incerti, D.; Rizzo, S.; Li, X.; Lindsay, L.; Yau, V.; Keebler, D.; Chia, J.; Tsai, L. Prognostic model to identify and quantify risk factors for mortality among hospitalised patients with COVID-19 in the USA. BMJ Open 2021, 11, e047121. [Google Scholar] [CrossRef]
- Wynants, L.; Van Calster, B.; Collins, G.S.; Riley, R.D.; Heinze, G.; Schuit, E.; Bonten, M.M.J.; Dahly, D.L.; Damen, J.A.; Debray, T.P.A.; et al. Prediction models for diagnosis and prognosis of COVID-19: Systematic review and critical appraisal. BMJ 2020, 369, m1328. [Google Scholar] [CrossRef]
- Kojima, N.; Adams, K.; Self, W.H.; Gaglani, M.; McNeal, T.; Ghamande, S.; Steingrub, J.S.; Shapiro, N.I.; Duggal, A.; Busse, L.W.; et al. Changing Severity and Epidemiology of Adults Hospitalized With Coronavirus Disease 2019 (COVID-19) in the United States After Introduction of COVID-19 Vaccines, March 2021-August 2022. Clin. Infect. Dis. 2023, 77, 547–557. [Google Scholar] [CrossRef] [PubMed]
- De Vito, A.; Colpani, A.; Saderi, L.; Puci, M.; Zauli, B.; Meloni, M.C.; Fois, M.; Bitti, A.; Di Castri, C.; Fiore, V.; et al. Is the 4C Score Still a Valid Item to Predict In-Hospital Mortality in People with SARS-CoV-2 Infections in the Omicron Variant Era? Life 2023, 13, 183. [Google Scholar] [CrossRef]
- Moons, K.G.M.; Altman, D.G.; Reitsma, J.B.; Ioannidis, J.P.A.; Macaskill, P.; Steyerberg, E.W.; Vickers, A.J.; Ransohoff, D.F.; Collins, G.S. Transparent Reporting of a multivariable prediction model for Individual Prognosis or Diagnosis (TRIPOD): Explanation and elaboration. Ann. Intern. Med. 2015, 162, W1–W73. [Google Scholar] [CrossRef]
- Christensen, D.M.; Strange, J.E.; Gislason, G.; Torp-Pedersen, C.; Gerds, T.; Fosbøl, E.; Phelps, M. Charlson Comorbidity Index Score and Risk of Severe Outcome and Death in Danish COVID-19 Patients. J. Gen. Intern. Med. 2020, 35, 2801–2803. [Google Scholar] [CrossRef]
- Spagnolli, W.; Rigoni, M.; Torri, E.; Cozzio, S.; Vettorato, E.; Nollo, G. Application of the National Early Warning Score (NEWS) as a stratification tool on admission in an Italian acute medical ward: A perspective study. Int. J. Clin. Pract. 2017, 71, e12934. [Google Scholar] [CrossRef] [PubMed]
- Ortega, L.; Sierra, M.; Domínguez, J.; Martínez, J.; Matas, L.; Bastart, F.; Galí, N.; Ausina, V. Utility of a pneumonia severity index in the optimization of the diagnostic and therapeutic effort for community-acquired pneumonia. Scand. J. Infect. Dis. 2005, 37, 657–663. [Google Scholar] [CrossRef]
- Royston, P.; Moons, K.G.M.; Altman, D.G.; Vergouwe, Y. Prognosis and prognostic research: Developing a prognostic model. BMJ 2009, 338, b604. [Google Scholar] [CrossRef] [PubMed]
- Li, J.; Liang, X.; You, S.; Feng, T.; Zhou, X.; Zhu, B.; Luo, J.; Xin, J.; Jiang, J.; Shi, D.; et al. Chinese Group on the Study of Severe Hepatitis B (COSSH). Development and validation of a new prognostic score for hepatitis B virus-related acute-on-chronic liver failure. J. Hepatol. 2021, 75, 1104–1115. [Google Scholar] [CrossRef] [PubMed]
- Yuan, Y.; Sun, C.; Tang, X.; Cheng, C.; Mombaerts, L.; Wang, M.; Hu, T.; Sun, C.; Guo, Y.; Li, X.; et al. Development and Validation of a Prognostic Risk Score System for COVID-19 Inpatients: A Multi-Center Retrospective Study in China. Engineering 2022, 8, 116–121. [Google Scholar] [CrossRef]
- Knight, S.R.; Ho, A.; Pius, R.; Buchan, I.; Carson, G.; Drake, T.M.; Dunning, J.; Fairfield, C.J.; Gamble, C.; Green, C.A.; et al. Risk stratification of patients admitted to hospital with COVID-19 using the ISARIC WHO Clinical Characterisation Protocol: Development and validation of the 4C Mortality Score. BMJ 2020, 370, m3339. [Google Scholar] [CrossRef]
- Douillet, D.; Riou, J.; Morin, F.; Mahieu, R.; Chauvin, A.; Gennai, S.; Ferrant, L.; Lopez, R.; Sebbane, M.; Plantefeve, G.; et al. Derivation and validation of a risk-stratification model for patients with probable or proven COVID-19 in EDs: The revised HOME-CoV score. Emerg. Med. J. 2024, emermed-2022-212631. [Google Scholar] [CrossRef]
- Marcolino, M.S.; Pires, M.C.; Ramos, L.E.F.; Silva, R.T.; Oliveira, L.M.; Carvalho, R.L.; Mourato, R.L.S.; Sánchez-Montalvá, A.; Raventós, B.; Anschau, F.; et al. ABC2-SPH risk score for in-hospital mortality in COVID-19 patients: Development, external validation and comparison with other available scores. Int. J. Infect. Dis. 2021, 110, 281–308. [Google Scholar] [CrossRef]
- Werfel, S.; Jakob, C.E.M.; Borgmann, S.; Schneider, J.; Spinner, C.; Schons, M.; Hower, M.; Wille, K.; Haselberger, M.; Heuzeroth, H.; et al. Development and validation of a simplified risk score for the prediction of critical COVID-19 illness in newly diagnosed patients. J. Med. Virol. 2021, 93, 6703–6713. [Google Scholar] [CrossRef] [PubMed]
- Chua, F.; Vancheeswaran, R.; Draper, A.; Vaghela, T.; Knight, M.; Mogal, R.; Singh, J.; Spencer, L.G.; Thwaite, E.; Mitchell, H.; et al. Early prognostication of COVID-19 to guide hospitalisation versus outpatient monitoring using a point-of-test risk prediction score. Thorax 2021, 76, 696–703. [Google Scholar] [CrossRef]
- Huespe, I.; Bisso, I.C.; Di Stefano, S.; Terrasa, S.; Gemelli, N.; Heras, M.L. COVID-19 Severity Index: A predictive score for hospitalized patients. Med. Intensiv. (Engl. Ed.) 2022, 46, 98–101. [Google Scholar] [CrossRef]
- Scotto, R.; Lanzardo, A.; Buonomo, A.R.; Pinchera, B.; Cattaneo, L.; Sardanelli, A.; Mercinelli, S.; Viceconte, G.; Perrella, A.; Esposito, V.; et al. A Simple Non-Invasive Score Based on Baseline Parameters Can Predict Outcome in Patients with COVID-19. Vaccines 2022, 10, 2043. [Google Scholar] [CrossRef]
- Klén, R.; Huespe, I.A.; Gregalio, F.A.; Lalueza Blanco, A.L.; Pedrera Jimenez, M.; Garcia Barrio, N.; Valdez, P.R.; Mirofsky, M.A.; Boietti, B.; Gómez-Huelgas, R.; et al. Development and validation of COEWS (COVID-19 Early Warning Score) for hospitalized COVID-19 with laboratory features: A multicontinental retrospective study. eLife 2023, 12, e85618. [Google Scholar] [CrossRef]
- Trongtrakul, K.; Tajarernmuang, P.; Limsukon, A.; Theerakittikul, T.; Niyatiwatchanchai, N.; Surasit, K.; Glunriangsang, P.; Liwsrisakun, C.; Bumroongkit, C.; Pothirat, C.; et al. The National Early Warning Score 2 with Age and Body Mass Index (NEWS2 Plus) to Determine Patients with Severe COVID-19 Pneumonia. J. Clin. Med. 2024, 13, 298. [Google Scholar] [CrossRef]
- Reade, M.C.; Weissfeld, L.; Angus, D.C.; A Kellum, J.; Milbrandt, E.B. The prevalence of anemia and its association with 90-day mortality in hospitalized community-acquired pneumonia. BMC Pulm. Med. 2010, 10, 15. [Google Scholar] [CrossRef]
- Tao, Z.; Xu, J.; Chen, W.; Yang, Z.; Xu, X.; Liu, L.; Chen, R.; Xie, J.; Liu, M.; Wu, J.; et al. Anemia is associated with severe illness in COVID-19: A retrospective cohort study. J. Med. Virol. 2021, 93, 1478–1488. [Google Scholar] [CrossRef]
- Choi, K.W.; Nin Chau, T.; Tsang, O.; Tso, E.; Chiu, M.C.; Tong, W.L.; Lee, P.O.; Ng, T.K.; Ng, W.F.; Lee, K.C.; et al. Outcomes and prognostic factors in 267 patients with severe acute respiratory syndrome in Hong Kong. Ann. Intern. Med. 2003, 139, 715–723. [Google Scholar] [CrossRef]
- Mistry, N.; Mazer, C.D.; Sled, J.G.; Lazarus, A.H.; Cahill, L.S.; Solish, M.; Zhou, Y.-Q.; Romanova, N.; Hare, A.G.M.; Doctor, A.; et al. Red blood cell antibody-induced anemia causes differential degrees of tissue hypoxia in kidney and brain. Am. J. Physiol. Regul. Integr. Comp. Physiol. 2018, 314, R611–R622. [Google Scholar] [CrossRef] [PubMed]
- Bartsch, P.E.; Waber, U.; Haeberli, A.N.; Maggiorini, M.A.; Kriemler, S.U.; Oelz, O.S.; Straub, W.P. Enhanced fibrin formation in high-altitude pulmonary edema. J. Appl. Physiol. (1985) 1987, 63, 752–757. [Google Scholar] [CrossRef] [PubMed]
- Patiño-Aldana, A.F.; Sternberg, Á.M.R.; Rondón, Á.M.P.; Molano-Gonzalez, N.; Lima, D.R.R. Interaction Effect Between Hemoglobin and Hypoxemia on COVID-19 Mortality: An observational study from Bogotá, Colombia. Int. J. Gen. Med. 2022, 15, 6965–6976. [Google Scholar] [CrossRef]
- Wessling-Resnick, M. Crossing the Iron Gate: Why and How Transferrin Receptors Mediate Viral Entry. Annu. Rev. Nutr. 2018, 38, 431–458. [Google Scholar] [CrossRef]
- Melazzini, F.; Lenti, M.V.; Mauro, A.; De Grazia, F.; Di Sabatino, A. Peptic Ulcer Disease as a Common Cause of Bleeding in Patients with Coronavirus Disease 2019. Am. J. Gastroenterol. 2020, 115, 1139–1140. [Google Scholar] [CrossRef]
- Wang, L.; He, W.; Yu, X.; Hu, D.; Bao, M.; Liu, H.; Zhou, J.; Jiang, H. Coronavirus disease 2019 in elderly patients: Characteristics and prognostic factors based on 4-week follow-up. J. Infect. 2020, 80, 639–645. [Google Scholar] [CrossRef] [PubMed]
- Weiss, G.; Ganz, T.; Goodnough, L.T. Anemia of inflammation. Blood 2019, 133, 40–50. [Google Scholar] [CrossRef]
- Taneri, P.E.; Gómez-Ochoa, S.A.; Llanaj, E.; Raguindin, P.F.; Rojas, L.Z.; Roa-Díaz, Z.M.; Salvador, D., Jr.; Groothof, D.; Minder, B.; Kopp-Heim, D.; et al. Anemia and iron metabolism in COVID-19: A systematic review and meta-analysis. Eur. J. Epidemiol. 2020, 35, 763–773. [Google Scholar] [CrossRef]
- Fan, B.E.; Ong, K.H.; Chan, S.S.W.; Young, B.E.; Chong, V.C.L.; Chen, S.P.C.; Lim, S.P.; Lim, G.P.; Kuperan, P. Blood and blood product use during COVID-19 infection. Am. J. Hematol. 2020, 95, E158–E160. [Google Scholar] [CrossRef]
- Kuno, T.; Miyamoto, Y.; Iwagami, M.; Ishimaru, M.; So, M.; Takahashi, M.; Egorova, N.N. The association of hemoglobin drop with in-hospital outcomes in COVID-19 patients. QJM 2022, 114, 789–794. [Google Scholar] [CrossRef]
- Asadzadeh, R.; Mozafari, A.; Shafiei, E.; Kaffashian, M.; Ahmadi, I.; Darvish, M.; Bastaminejad, S. On-Admission Anemia and Survival Rate in COVID-19 Patients. Iran. Biomed. J. 2022, 26, 389–397. [Google Scholar] [CrossRef]
- Wang, Y.; Nan, L.; Hu, M.; Zhang, R.; Hao, Y.; Wang, Y.; Yang, H. Significant association between anemia and higher risk for COVID-19 mortality: A meta-analysis of adjusted effect estimates. Am. J. Emerg. Med. 2022, 58, 281–285. [Google Scholar] [CrossRef]
- Veronese, N.; Segala, F.V.; Carruba, L.; La Carrubba, A.; Pollicino, F.; Di Franco, G.; Guido, G.; Cormio, M.; Lugli, A.; De Santis, L.; et al. Anemia as a risk factor for disease progression in patients admitted for COVID-19: Data from a large, multicenter cohort study. Sci. Rep. 2023, 13, 9035. [Google Scholar] [CrossRef]
- Silva, B.R.S.; Jara, C.P.; Sidarta-Oliveira, D.; Velloso, L.A.; Velander, W.H.; Araújo, E.P. Downregulation of the Protein C Signaling System Is Associated with COVID-19 Hypercoagulability-A Single-Cell Transcriptomics Analysis. Viruses 2022, 14, 2753. [Google Scholar] [CrossRef]
- Obi, A.T.; Barnes, G.D.; Napolitano, L.M.; Henke, P.K.; Wakefield, T.W. Venous thrombosis epidemiology, pathophysiology, and anticoagulant therapies and trials in severe acute respiratory syndrome coronavirus 2 infection. J. Vasc. Surg. Venous Lymphat. Disord. 2021, 9, 23–35. [Google Scholar] [CrossRef]
- Wójcik, K.; Bazan-Socha, S.; Celejewska-Wójcik, N.; Górka, K.; Lichołai, S.; Polok, K.; Stachura, T.; Zaręba, L.; Dziedzic, R.; Gradzikiewicz, A.; et al. Decreased protein C activity, lower ADAMTS13 antigen and free protein S levels accompanied by unchanged thrombin generation potential in hospitalized COVID-19 patients. Thromb. Res. 2023, 223, 80–86. [Google Scholar] [CrossRef] [PubMed]
- Wellbelove, Z.; Walsh, C.; Perinpanathan, T.; Lillie, P.; Barlow, G. Comparing the 4C mortality score for COVID-19 to established scores (CURB65, CRB65, qSOFA, NEWS) for respiratory infection patients. J. Infect. 2021, 82, 414–451. [Google Scholar] [CrossRef] [PubMed]
- Crocker-Buque, T.; Myles, J.; Brentnall, A.; Gabe, R.; Duffy, S.; Williams, S.; Tiberi, S. Using ISARIC 4C mortality score to predict dynamic changes in mortality risk in COVID-19 patients during hospital admission. PLoS ONE 2022, 17, e0274158. [Google Scholar] [CrossRef]
- Jones, A.; Pitre, T.; Junek, M.; Kapralik, J.; Patel, R.; Feng, E.; Dawson, L.; Tsang, J.L.Y.; Duong, M.; Ho, T.; et al. External validation of the 4C mortality score among COVID-19 patients admitted to hospital in Ontario, Canada: A retrospective study. Sci. Rep. 2021, 11, 18638. [Google Scholar] [CrossRef] [PubMed]
- Khatib, M.Y.; Ananthegowda, D.C.; Elshafei, M.S.; El-Zeer, H.; Abdaljawad, W.I.; Shaheen, M.A.; Ibrahim, A.S.; Abujaber, A.A.; Soliman, A.A.; Mohamed, A.S.; et al. Predictors of mortality and morbidity in critically ill COVID-19 patients: An experience from a low mortality country. Health Sci. Rep. 2022, 5, e542. [Google Scholar] [CrossRef]
- Grasselli, G.; Zangrillo, A.; Zanella, A.; Antonelli, M.; Cabrini, L.; Castelli, A.; Cereda, D.; Coluccello, A.; Foti, G.; Fumagalli, R.; et al. Baseline Characteristics and Outcomes of 1591 Patients Infected With SARS-CoV-2 Admitted to ICUs of the Lombardy Region, Italy. JAMA 2020, 323, 1574–1581. [Google Scholar] [CrossRef]
- Başaran, N.Ç.; Özdede, M.; Uyaroğlu, O.A.; Şahin, T.K.; Özcan, B.; Oral, H.; Özışık, L.; Güven, G.S.; Tanrıöver, M.D. Independent predictors of in-hospital mortality and the need for intensive care in hospitalized non-critical COVID-19 patients: A prospective cohort study. Intern. Emerg. Med. 2022, 17, 1413–1424. [Google Scholar] [CrossRef]
- Tian, R.; Wu, W.; Wang, C.; Pang, H.; Zhang, Z.; Xu, H.; Luo, Q.; Gao, P.; Shi, J.; Li, W.; et al. Clinical characteristics and survival analysis in critical and non-critical patients with COVID-19 in Wuhan, China: A single-center retrospective case control study. Sci. Rep. 2020, 10, 17524. [Google Scholar] [CrossRef]
- Soliman, A.; Nair, A.P.; Al Masalamani, M.S.; De Sanctis, V.; Khattab, M.A.A.; Alsaud, A.E.; Sasi, S.; Ali, E.A.; Hassan, O.A.; Iqbal, F.M.; et al. Prevalence, clinical manifestations, and biochemical data of type 2 diabetes mellitus versus nondiabetic symptomatic patients with COVID-19: A comparative study. Acta Biomed. 2020, 91, e20200. [Google Scholar]
- De Sanctis, V. Prevalence, Clinical Manifestations, and Biochemical Data of Hypertensive versus Normotensive Symptomatic Patients with COVID-19: A Comparative Study. Acta Biomed. 2020, 91, e2020164. [Google Scholar]
- Kim, D.; Alshuwaykh, O.; Dennis, B.B.; Cholankeril, G.; Ahmed, A. Trends in Etiology-based Mortality From Chronic Liver Disease Before and During COVID-19 Pandemic in the United States. Clin Gastroenterol Hepatol. 2022, 20, 2307–2316.e3. [Google Scholar] [CrossRef] [PubMed]
- Harrison, S.L.; Buckley, B.J.R.; Rivera-Caravaca, J.M.; Zhang, J.; Lip, G.Y.H. Cardiovascular risk factors, cardiovascular disease, and COVID-19: An umbrella review of systematic reviews. Eur. Heart J. Qual. Care Clin. Outcomes 2021, 7, 330–339. [Google Scholar] [CrossRef]
- Gibertoni, D.; Reno, C.; Rucci, P.; Fantini, M.P.; Buscaroli, A.; Mosconi, G.; Rigotti, A.; Giudicissi, A.; Mambelli, E.; Righini, M.; et al. COVID-19 incidence and mortality in non-dialysis chronic kidney disease patients. PLoS ONE 2021, 16, e0254525. [Google Scholar] [CrossRef]
- Park, J.M.; Woo, W.; Lee, S.C.; Park, S.; Yon, D.K.; Lee, S.W.; Smith, L.; Koyanagi, A.; Shin, J.I.; Kim, Y.W. Prevalence and Mortality Risk of Neurological Disorders during the COVID-19 Pandemic: An Umbrella Review of the Current Evidence. Neuroepidemiology 2023, 57, 129–147. [Google Scholar] [CrossRef]


| Variables | Vital Status at Discharge | p Value | ||
|---|---|---|---|---|
| All Patients | Alive | Dead | ||
| Derivation Cohort Validation Cohort * | n: 388 n: 1357 * | n: 348 n: 1253 * | n: 40 n: 104 * | |
| Demographics | ||||
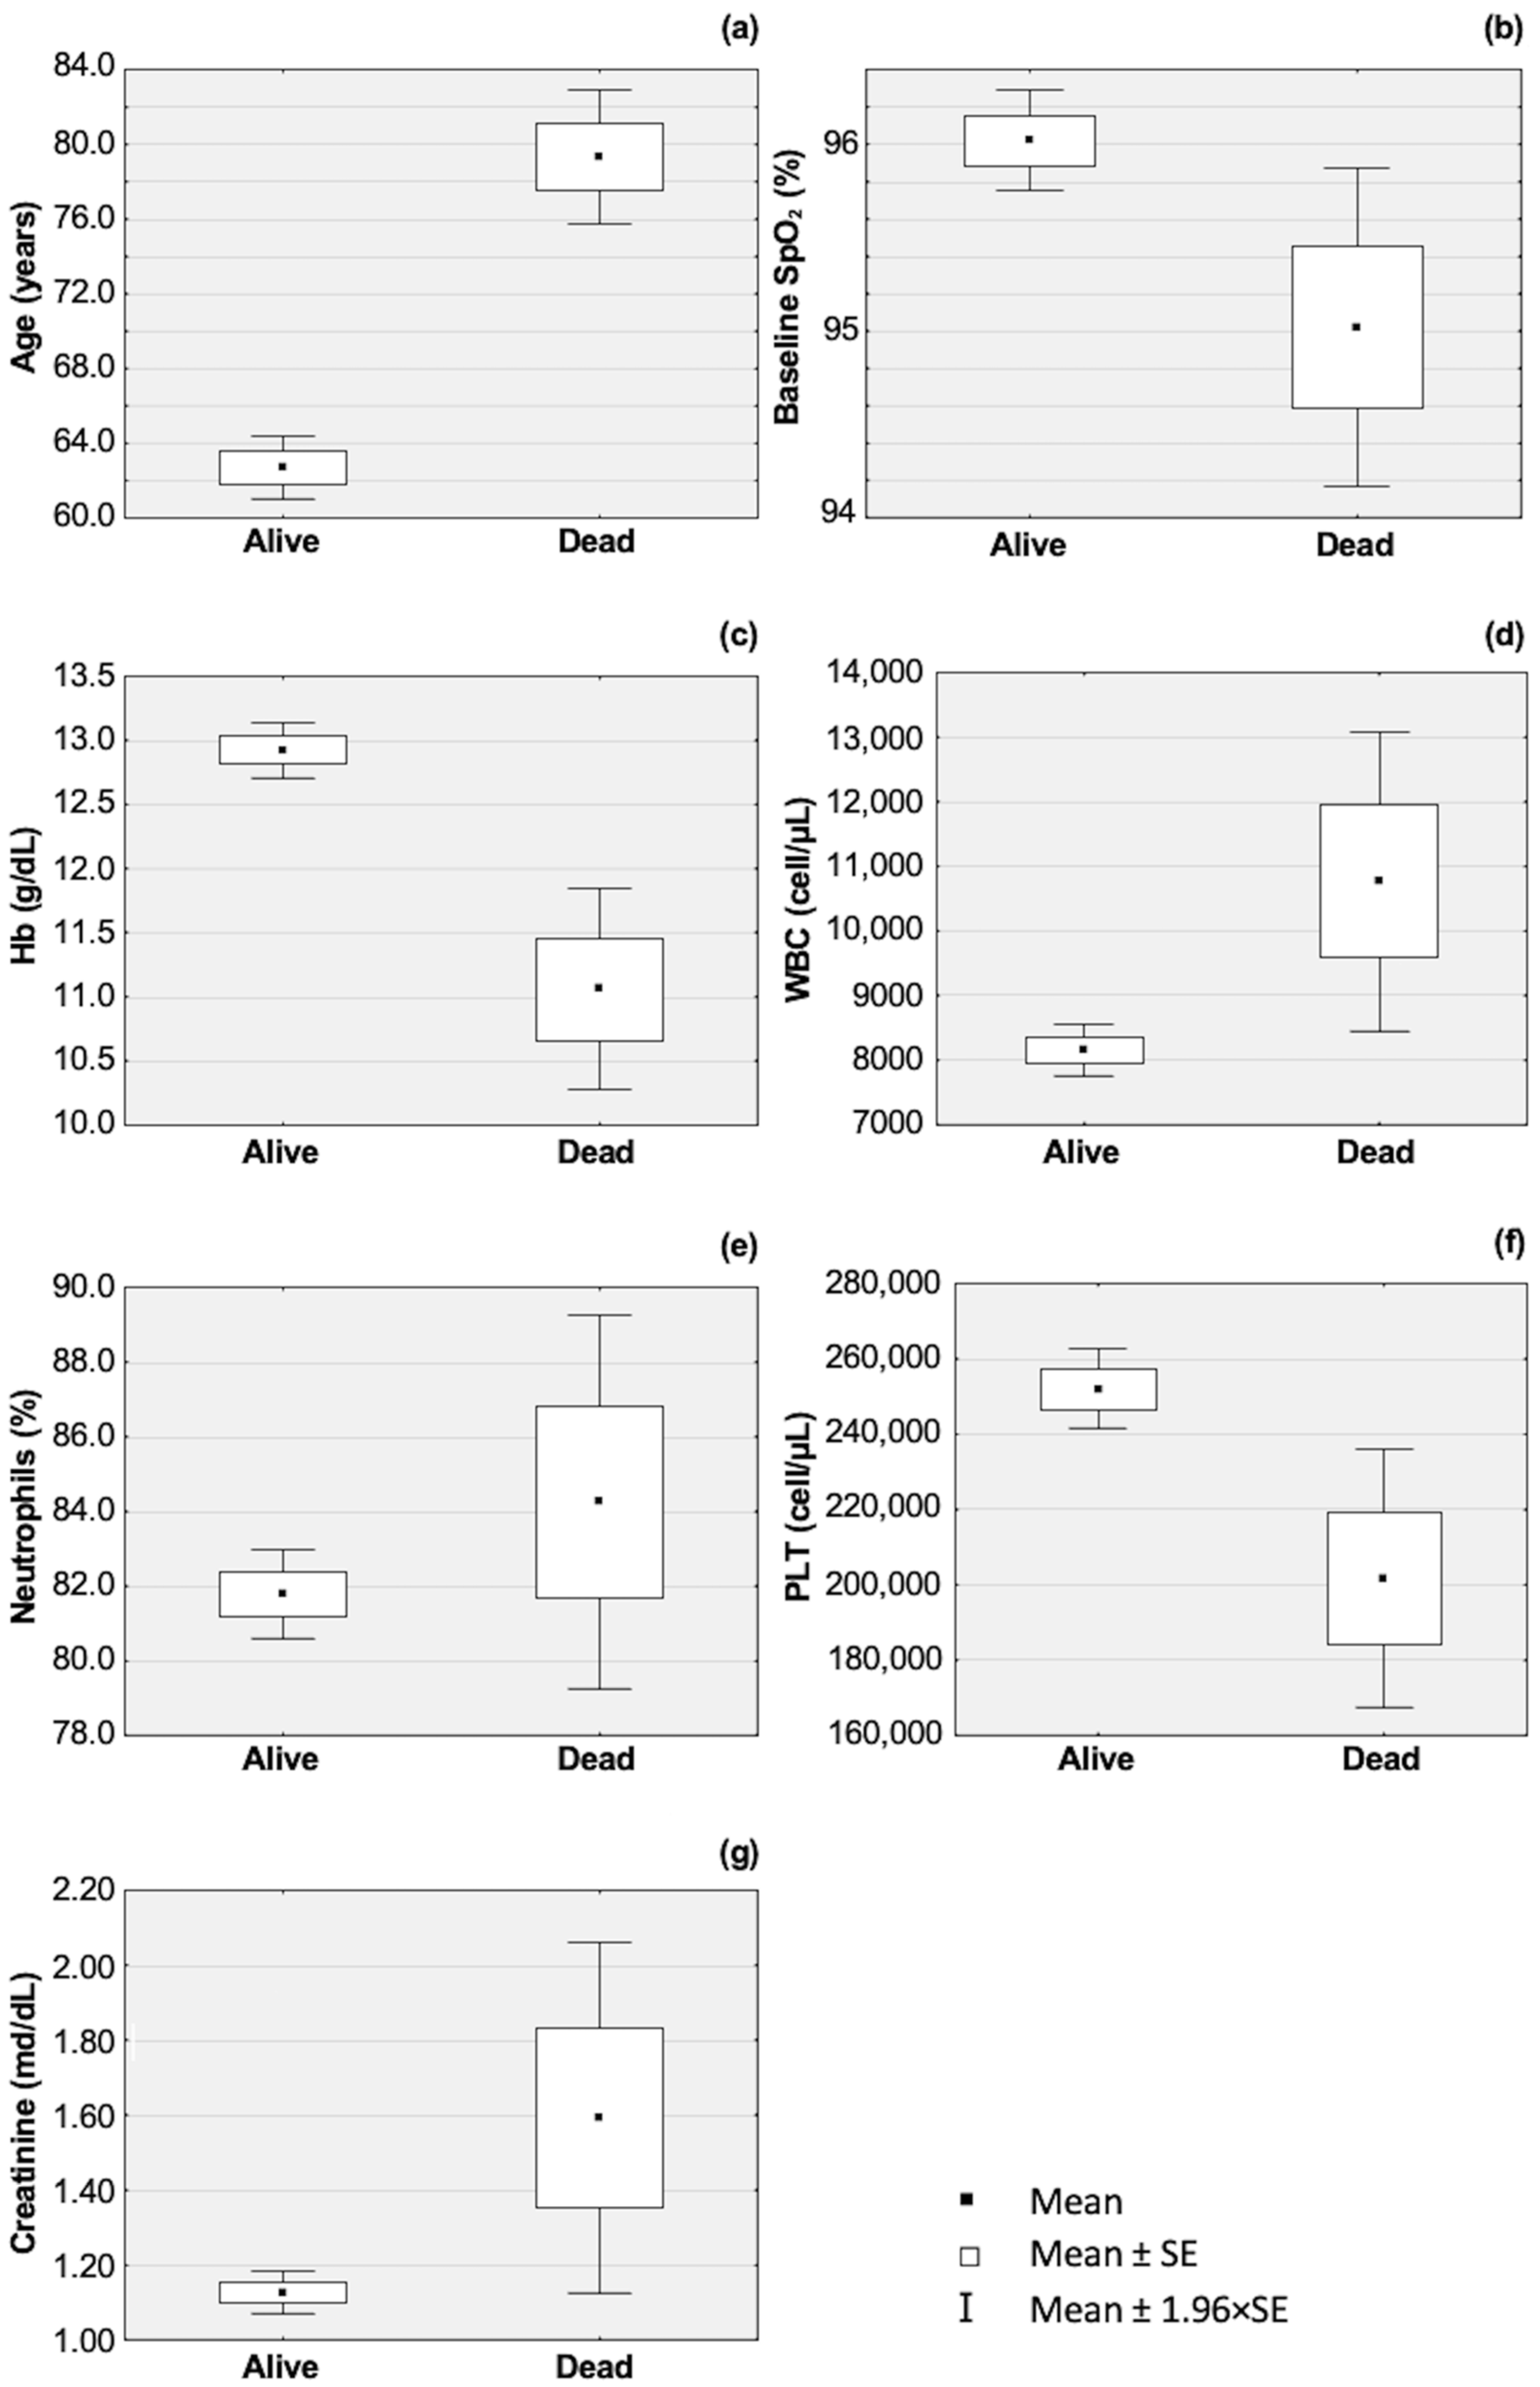
| Age (mean ± SD) Age (n: 388) Age (n: 1357) * | 64.4 ± 16.5 61.3 ± 16.1 | 62.7 ± 16.1 60.0 ± 15.5 | 79.4 ± 11.5 78.4 ± 12.8 | <0.001 0.001 |
| Sex (n: 388) | ||||
| Male (%) | 231 (59.5%) | 212 (60.9%) | 19 (47.5%) | 0.101 |
| Female (%) | 157 (40.5%) | 136 (39.1%) | 21 (52.5%) | |
| Sex (n: 1357) * | ||||
| Male (%) * | 826 (60.7%) | 770 (61.5%) | 56 (53.8%) | 0.127 |
| Female (%) * | 531 (39.0%) | 483 (38.5%) | 48 (46.2%) | |
| Comorbidities (%) | ||||
| Mute past medical history (n: 388) | 39 (10.1%) | 39 (11.1%) | 0 (0%) | 0.026 |
| Obesity (n: 388) | 31 (8.0%) | 29 (8.3%) | 2 (5.0%) | 0.462 |
| Diabetes (n: 388) | 118 (30.4%) | 105 (30.2%) | 13 (32.5%) | 0.762 |
| Hypertension (n: 388) | 207 (53.4%) | 182 (52.3%) | 25 (65.5%) | 0.221 |
| COPD (n: 388) | 29 (7.5%) | 24 (6.9%) | 5 (12.5%) | 0.202 |
| Asthma (n: 388) | 6 (1.5%) | 6 (1.7%) | 0 (0%) | 0.403 |
| TB (n: 388) | 3 (0.8%) | 2 (0.6%) | 0 (0%) | 0.188 |
| Other lung diseases (n: 388) | 12 (5.4%) | 16 (4.6%) | 5 (12.5%) | 0.036 |
| Active smoking (n: 388) | 13 (3.4%) | 11 (3.2%) | 2 (5.0%) | 0.540 |
| IV Drugs (n: 388) | 1 (0.3%) | 1 (0.3%) | 0 (0%) | 0.734 |
| Alcoholism (n: 388) | 4 (1.0%) | 4 (1.1%) | 0 (0%) | 0.496 |
| Depression (n: 388) | 17 (4.4%) | 17 (4.9%) | 0 (0%) | 0.153 |
| Suicidal ideation (n: 388) | 1 (0.3%) | 1 (0.3%) | 0 (0%) | 0.734 |
| Hepatosplenomegaly (n: 388) | 3 (0.8%) | 2 (0.6%) | 1 (2.5%) | 0.188 |
| Gastrointestinal bleeding (n: 388) | 2 (0.5%) | 2 (0.6%) | 0 (0%) | 0.631 |
| Hyperglycemia (n: 388) | 58 (14.9%) | 51 (14.7%) | 7 (17.5%) | 0.633 |
| HIV+ (n: 388) | 3 (0.8%) | 2 (0.6%) | 1 (2.5%) | 0.188 |
| Chronic liver disease (n: 388) | 22 (5.7%) | 14 (4.0%) | 8 (20.0%) | <0.001 |
| Cardiovascular disease (n: 388) | 82 (21.1%) | 66 (19.0%) | 16 (40.0%) | 0.002 |
| Other heart conditions (n: 388) | 61 (15.7%) | 52 (14.9%) | 9 (22.5%) | 0.214 |
| CKD (n: 388) | 32 (8.2%) | 24 (6.9%) | 8 (20.0%) | 0.004 |
| AKI (n: 388) | 5 (1.3%) | 4 (1.1%) | 1 (2.5%) | 0.473 |
| Hemodialysis (n: 388) | 1 (0.3%) | 1 (0.3%) | 0 (0%) | 0.734 |
| Diseases of the CNS (n: 388) | 39 (10.1%) | 29 (8.3%) | 10 (25.0%) | 0.001 |
| Organ transplant (n: 388) | 5 (1.3%) | 5 (1.4%) | 0 (0%) | 0.445 |
| Other comorbidities (n: 388) | 253 (65.2%) | 221 (63.5%) | 32 (80.0%) | 0.038 |
| Scores (median IQR) | ||||
| CCI (n:388) | 4 (2–6) | 4 (2–5) | 5 (4–7) | <0.001 |
| NEWS (n: 284) | 3 (1–5) | 3 (1–5) | 6 (3–8) | <0.001 |
| PSI (n: 388) | 3 (2–3) | 2 (2–3) | 4 (3–5) | <0.001 |
| Time passed (median IQR) | ||||
| Days of hospitalization (n: 386) Days of hospitalization (n: 1357) * | 12 (8–18) 16 (15–16) | 12 (8–17) 16 (16–18) | 19 (13–29) 12 (11–14) | 0.002 0.003 |
| Days from symptom onset to hospitalization (n: 309) | 6 (3–10) | 7 (3–10) | 4 (1–8) | 0.025 |
| Days from positive swab to hospitalization (n: 360) | 1 (0–3) | 1 (0–3) | 1 (0–2) | 0.521 |
| Days from symptom onset to positive swab (n: 302) | 3 (0–7) | 4 (0–7) | 2 (0–3) | 0.034 |
| Symptoms clinical onset (%) | ||||
| Fever (n: 388) | 201 (51.8%) | 183 (52.6%) | 18 (45.0%) | 0.363 |
| Cough (n: 388) | 95 (24.2%) | 93 (26.7%) | 2 (5.0%) | 0.002 |
| Sputum (n: 388) | 4 (1.0%) | 3 (0.9%) | 1 (2.5%) | 0.331 |
| Asthenia (n: 388) | 71 (18.3%) | 64 (18.4) | 7 (17.5%) | 0.890 |
| Dyspnoea (n: 388) | 144 (36.9%) | 129 (37.1%) | 15 (37.5%) | 0.957 |
| Anorexia (n: 388) | 4 (1.0%) | 4 (1.1%) | 0 (0%) | 0.496 |
| Myalgia (n: 388) | 24 (6.2%) | 22 (6.3%) | 2 (5.0%) | 0.742 |
| Arthalgia (n: 388) | 25 (6.4%) | 24 (6.9%) | 1 (2.5%) | 0.283 |
| Loss of smell (n: 388) | 13 (3.4%) | 13 (3.7%) | 0 (0%) | 0.214 |
| Loss of taste (n: 388) | 13 (3.4%) | 13 (3.7%) | 0 (0%) | 0.214 |
| Diarrhea (n: 388) | 34 (8.8%) | 33 (9.5%) | 1 (2.5%) | 0.139 |
| Vomit (n: 388) | 18 (4.6%) | 16 (4.6%) | 2 (5.0%) | 0.909 |
| Headache (n: 388) | 27 (7.0%) | 27 (7.8%) | 0 (0%) | 0.068 |
| Chest pain (n: 388) | 19 (4.9%) | 18 (5.2%) | 1 (2.5%) | 0.458 |
| Abdominal pain (n: 388) | 22 (5.7%) | 22 (6.3%) | 0 (0%) | 0.102 |
| Gastrointestinal bleeding (n: 388) | 2 (0.5%) | 2 (0.6%) | 0 (0%) | 0.631 |
| Other symptoms (n: 388) | 88 (22.7%) | 77 (22.1%) | 11 (27.5%) | 0.448 |
| Laboratory test (mean ± SD) | ||||
| Hb (g/dL) (n: 386) Hb (g/dL) (n: 1357) * | 12.7 ± 2.2 13.7 ± 1.3 | 12.9 ± 2.1 13.7 ± 1.3 | 11.0 ± 2.5 13.4 ± 1.1 | <0.001 0.050 |
| WBC (cell/µL) (n: 387) WBC (cell/µL) (n: 1357) * | 8418 ± 4506 8700 ± 3971 | 8146 ± 3955 8615 ± 3863 | 10,765 ± 7476 9723 ± 5008 | <0.001 0.006 |
| Number of neutrophils (cell/µL) (n: 381) Number of neutrophils (cell/µL) (n: 1357) * | 7067 ± 4263 7071 ± 3668 | 6827 ± 3847 6977 ± 3551 | 9223 ± 6679 8201 ± 4743 | <0.001 0.001 |
| Percentage of neutrophils (%) (n: 381) Percentage of neutrophils (%) (n: 1357) * | 82.1 ± 12.0 79.3 ± 11.5 | 81.9 ± 11.4 79.0 ± 11.4 | 84.3 ± 16.6 82.9 ± 12.3 | 0.258 0.001 |
| Number of lymphocytes (cell/µL) (n: 381) Number of lymphocytes (cell/µL) (n: 1357) * | 1307 ± 1071 1049 ± 904 | 1328 ± 1099 1051 ± 834 | 1112 ± 755 1023 ± 1514 | 0.239 0.762 |
| Percentage of lymphocytes (%) (n: 381) Percentage of lymphocytes (%) (n: 1357) * | 17.9 ± 12.0 13.8 ± 9.6 | 18.1 ± 11.4 14.0 ± 9.4 | 15.8 ± 16.5 11.3 ± 10.8 | 0.258 0.005 |
| PLT (×103/µL) (n: 383) PLT (×103/µL) (n: 1357) * | 248 ± 104 291 ± 110 | 252 ± 103 290 ± 111 | 202 ± 111 305 ± 107 | 0.004 0.174 |
| Creatinine (mg/dL) (n: 388) Creatinine (mg/dL) (n: 1357) * | 1.06 ± 0.86 0.99 ± 0.86 | 0.99 ± 0.67 0.96 ± 0.83 | 1.75 ± 1.81 1.32 ± 1.00 | <0.001 <0.001 |
| LDH (U/L) (n: 261) | 268 ± 108 | 265 ± 104 | 294 ± 137 | 0.239 |
| PT/INR (n: 356) | 1.78 ± 7.72 | 1.80 ± 8.09 | 1.64 ± 1.77 | 0.910 |
| aPTT (seconds) (n: 246) | 29.6 ± 14.8 | 29.5 ± 14.7 | 30.9 ± 15.7 | 0.691 |
| Fibrinogen (mg/dL) (n: 308) | 522 ± 187 | 522 ± 182 | 516 ± 236 | 0.879 |
| D-Dimer (ng/mL EFU) (n: 319) | 2749 ± 7796 | 2647 ± 7876 | 3763 ± 6987 | 0.463 |
| CRP (mg/L) (n: 356) | 50.0 ± 58.4 | 48.9 ± 57.9 | 60.8 ± 63.6 | 0.275 |
| PCT (µg/L) (n: 196) | 1.4 ± 8.4 | 1.5 ± 9.0 | 0.5 ± 0.6 | 0.571 |
| IL-6 (pg/mL) (n: 232) | 47.9 ± 166.3 | 47.2 ± 174.3 | 54.5 ± 55.5 | 0.842 |
| Triglycerides (mg/dL) (n: 97) | 133 ± 62 | 134 ± 65 | 125 ± 26 | 0.677 |
| Ferritin (ng/mL) (n: 111) | 729 ± 786 | 663 ± 705 | 1263 ± 1184 | 0.012 |
| Troponin (mg/L) (n: 56) | 163 ± 674 | 180 ± 712 | 15 ± 16 | 0.576 |
| BNPT (pg/mL) (n: 58) | 1265 ± 2289 | 1377 ± 2408 | 444 ± 748 | 0.316 |
| Respiratory function (mean ± SD) | ||||
| Acts breath/minute (n: 140) | 18 ± 5 | 18 ± 5 | 21 ± 6 | 0.014 |
| HR (n: 287) | 83 ± 14 | 83 ± 14 | 84 ± 13 | 0.735 |
| Baseline SpO2 (n: 361) Baseline SpO2 (n: 1357) * | 96 ± 3 88 ± 6 | 96 ± 3 89 ± 7 | 95 ± 3 85 ± 6 | 0.013 <0.001 |
| pH (n:200) | 7.43 ± 0.05 | 7.44 ± 0.05 | 7.46 ± 0.08 | 0.047 |
| PaO2 (n: 211) | 82.1 ± 21.5 | 82.9 ± 21.2 | 73.4 ± 23.3 | 0.065 |
| PaCO2 (n: 206) | 36.8 ± 5.2 | 36.7 ± 5.0 | 37.7 ± 7.1 | 0.416 |
| PaO2/FiO2 (n: 210) | 328 ± 113 | 332 ± 113 | 287 ± 106 | 0.102 |
| PaO2St (n: 206) | 76.9 ± 21.6 | 77.7 ± 22.0 | 68.5 ± 15.4 | 0.084 |
| PaO2St/FiO2 (n: 205) PaO2St/FiO2 (n: 1178) * | 307 ± 108 239 ± 107 | 311 ± 110 244 ± 108 | 269 ± 82 175 ± 98 | 0.130 <0.001 |
| Imaging (%) | ||||
| Single-sided ground glass thickening (n: 360) | 14 (3.9%) | 12 (3.7%) | 4 (11.8%) | 0.034 |
| Bilateral ground glass thickening (n: 360) | 275 (76.4%) | 252 (77.3%) | 23 (67.6%) | 0.079 |
| Unilateral parenchymal consolidation (n: 360) | 30 (8.3%) | 27 (8.3%) | 3 (8.8%) | 0.954 |
| Bilateral parenchymal consolidation (n: 360) | 69 (19.2%) | 64 (19.6%) | 5 (14.7%) | 0.356 |
| Unilateral pleural effusion (n: 360) | 15 (4.2%) | 12 (3.7%) | 3 (8.8%) | 0.034 |
| Bilateral pleural effusion (n: 360) | 30 (7.7%) | 21 (6.4%) | 9 (26.5%) | <0.001 |
| Hospital oxygen therapy (%) | ||||
| Breathe in ambient air (n: 388) | 220 (56.7%) | 201 (57.8%) | 19 (40.0%) | 0.215 |
| Nasal cannulas (n: 386) | 65 (16.8%) | 58 (16.8%) | 7 (17.5%) | 0.906 |
| Facial mask (n: 386) | 18 (4.7%) | 14 (4.0%) | 4 (10.0%) | 0.091 |
| Venturi mask (n: 386) | 75 (19.4%) | 66 (19.1%) | 9 (22.5%) | 0.604 |
| NIV (n: 386) | 2 (0.5%) | 2 (0.6%) | 0 (0%) | 0.630 |
| IMV (n: 388) | 8 (2.1%) | 7 (2.0%) | 1 (2.1%) | 0.837 |
| Clinical outcome (%) | ||||
| Discharged home (n: 388) | 261 (67.3%) | 261 (75.0%) | 0 (0%) | <0.001 |
| Transferred to COVID-19 hotel (n: 388) | 65 (16.8%) | 65 (18.7%) | 0 (0%) | 0.003 |
| Transferred to another department (n: 388) | 22 (5.7%) | 22 (6.3%) | 0 (0%) | 0.120 |
| Variables | B | Sig. | OR | 95% CI for OR | |
|---|---|---|---|---|---|
| Lower | Upper | ||||
| Age (years) | 0.116 | 0.000 | 1.124 | 1.07 | 1.18 |
| Baseline SpO2 (%) | −0.175 | 0.026 | 0.840 | 0.72 | 0.98 |
| Hb (g/dL) | −0.459 | 0.000 | 0.632 | 0.51 | 0.78 |
| In [WBC (cell/µL)] | 1.935 | 0.000 | 6.924 | 2.27 | 20.98 |
| Neutrophils (%) | −0.045 | 0.051 | 0.956 | 0.913 | 1.00 |
| In [PLT (cell/µL)] | −2.327 | 0.000 | 0.98 | 0.37 | 0.26 |
| In [Creatinine (mg/dL)] | 1.108 | 0.034 | 3.027 | 1.085 | 8.445 |
| Constant | 26.084 | 0.010 | |||
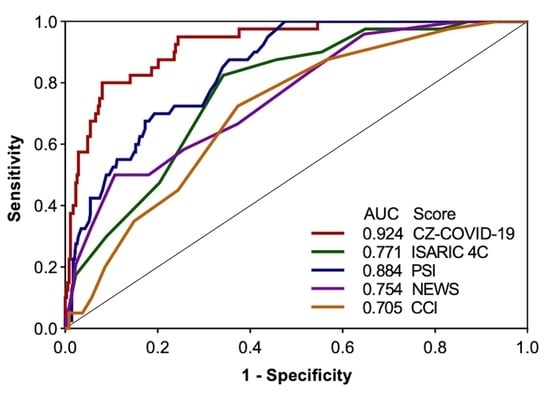
| Score | Year of Birth | Nation of Birth | External Validation of Score | Derivation Cohort (n) | Criteria for Score (n) | AUC * | 95% CI * | Sensitivity (%) ** | Specificity (%) ** | AUC ** | 95% CI ** | p-Value ** | p-Value *** |
|---|---|---|---|---|---|---|---|---|---|---|---|---|---|
| CCI [10] | 1987 | USA | Yes | 604 | 17 | NA | NA | 72.5 | 62.6 | 0.705 | 0.657–0.750 | <0.001 | <0.001 |
| PSI [12] | 1998 | USA | Yes | 38,000 | 20 | NA | NA | 99.9 | 52.4 | 0.884 | 0.804–0.879 | <0.001 | 0.300 |
| NEWS [11] | 2012 | UK | Yes | 35,585 | 8 | NA | NA | 50.0 | 89.2 | 0.754 | 0.700–0.803 | <0.001 | 0.011 |
| ISARIC 4C [16] | 2020 | UK | Yes | 66,705 | 11 | 0.790 | 0.780–0.790 | 82.5 | 65.8 | 0.771 | 0.726–0.812 | <0.001 | <0.001 |
| HOME-CoV [17] | 2020 | FR | Yes | 1696 | 7 | 0.876 | 0.847–0.906 | 95.0 | 42.5 | 0.710 | 0.677–0.768 | <0.001 | <0.001 |
| ABC2-SPH [18] | 2021 | ES | Yes | 3978 | 7 | 0.844 | 0.829–0.919 | 87.5 | 65.8 | 0.804 | 0.761–0.842 | <0.001 | 0.014 |
| CAPS-D [19] | 2021 | GER | Yes | 1297 | 5 | 0.810 | 0.77–0.850 | 82.5 | 48.0 | 0.692 | 0.644–0.738 | <0.001 | 0.007 |
| SOARS [20] | 2021 | UK | Yes | 983 | 5 | 0.820 | NA | 65.0 | 80.8 | 0.796 | 0.752–0.835 | <0.001 | <0.001 |
| COVID-19 Sever Index $ [21] | 2021 | ARG | Yes | 220 | 16 | 0.940 $ | NA | 80.0 | 55.5 | 0.755 | 0.709–0.797 | <0.001 | 0.002 |
| ASCL $$ [22] | 2022 | ITA | Yes | 390 | 11 | 0.713 $$ | NA | 77.5 | 64.4 | 0.724 | 0.677–0.768 | <0.001 | <0.001 |
| COEWS [23] | 2023 | m | Yes | 3539 | 7 | 0.743 | 0.703–0.784 | 85.0 | 52.9 | 0.754 | 0.708–0.796 | <0.001 | 0.001 |
| NEWS 2 Plus [24] | 2024 | TH | ? | 725 | 10 | 0.798 | 0.767–0.830 | 70.8 | 80.0 | 0.815 | 0.765–0.858 | <0.001 | 0.054 |
| CZ COVID-19 | 2024 | ITA | Yes | 388 | 7 | - | - | 80.0 | 92.0 | 0.924 | 0.893–0.948 | <0.001 | - |
Disclaimer/Publisher’s Note: The statements, opinions and data contained in all publications are solely those of the individual author(s) and contributor(s) and not of MDPI and/or the editor(s). MDPI and/or the editor(s) disclaim responsibility for any injury to people or property resulting from any ideas, methods, instructions or products referred to in the content. |
© 2024 by the authors. Licensee MDPI, Basel, Switzerland. This article is an open access article distributed under the terms and conditions of the Creative Commons Attribution (CC BY) license (https://creativecommons.org/licenses/by/4.0/).
Share and Cite
Zinna, G.; Pipitò, L.; Colomba, C.; Scichilone, N.; Licata, A.; Barbagallo, M.; Russo, A.; Almasio, P.L.; Coppola, N.; Cascio, A. COVID-19: The Development and Validation of a New Mortality Risk Score. J. Clin. Med. 2024, 13, 1832. https://doi.org/10.3390/jcm13071832
Zinna G, Pipitò L, Colomba C, Scichilone N, Licata A, Barbagallo M, Russo A, Almasio PL, Coppola N, Cascio A. COVID-19: The Development and Validation of a New Mortality Risk Score. Journal of Clinical Medicine. 2024; 13(7):1832. https://doi.org/10.3390/jcm13071832
Chicago/Turabian StyleZinna, Giuseppe, Luca Pipitò, Claudia Colomba, Nicola Scichilone, Anna Licata, Mario Barbagallo, Antonio Russo, Piero Luigi Almasio, Nicola Coppola, and Antonio Cascio. 2024. "COVID-19: The Development and Validation of a New Mortality Risk Score" Journal of Clinical Medicine 13, no. 7: 1832. https://doi.org/10.3390/jcm13071832
APA StyleZinna, G., Pipitò, L., Colomba, C., Scichilone, N., Licata, A., Barbagallo, M., Russo, A., Almasio, P. L., Coppola, N., & Cascio, A. (2024). COVID-19: The Development and Validation of a New Mortality Risk Score. Journal of Clinical Medicine, 13(7), 1832. https://doi.org/10.3390/jcm13071832