Increased Expression of Proinflammatory Genes in Peripheral Blood Cells Is Associated with Cardiac Cachexia in Patients with Heart Failure with Reduced Ejection Fraction

 , , ,
, , ,  ,
, 

Abstract
1. Introduction
2. Methods
2.1. Clinical Assessments
2.2. RNA Isolation, Reverse Transcription, and qRT-PCR
2.3. Biomarker Measurements
2.4. Cell Stimulation Assays
2.5. Skeletal Muscle Tissue Biopsy
2.6. Statistical Analysis
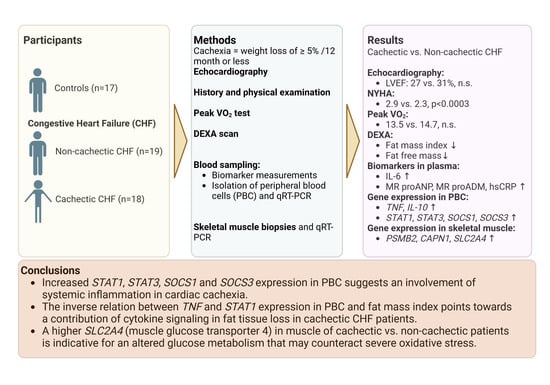
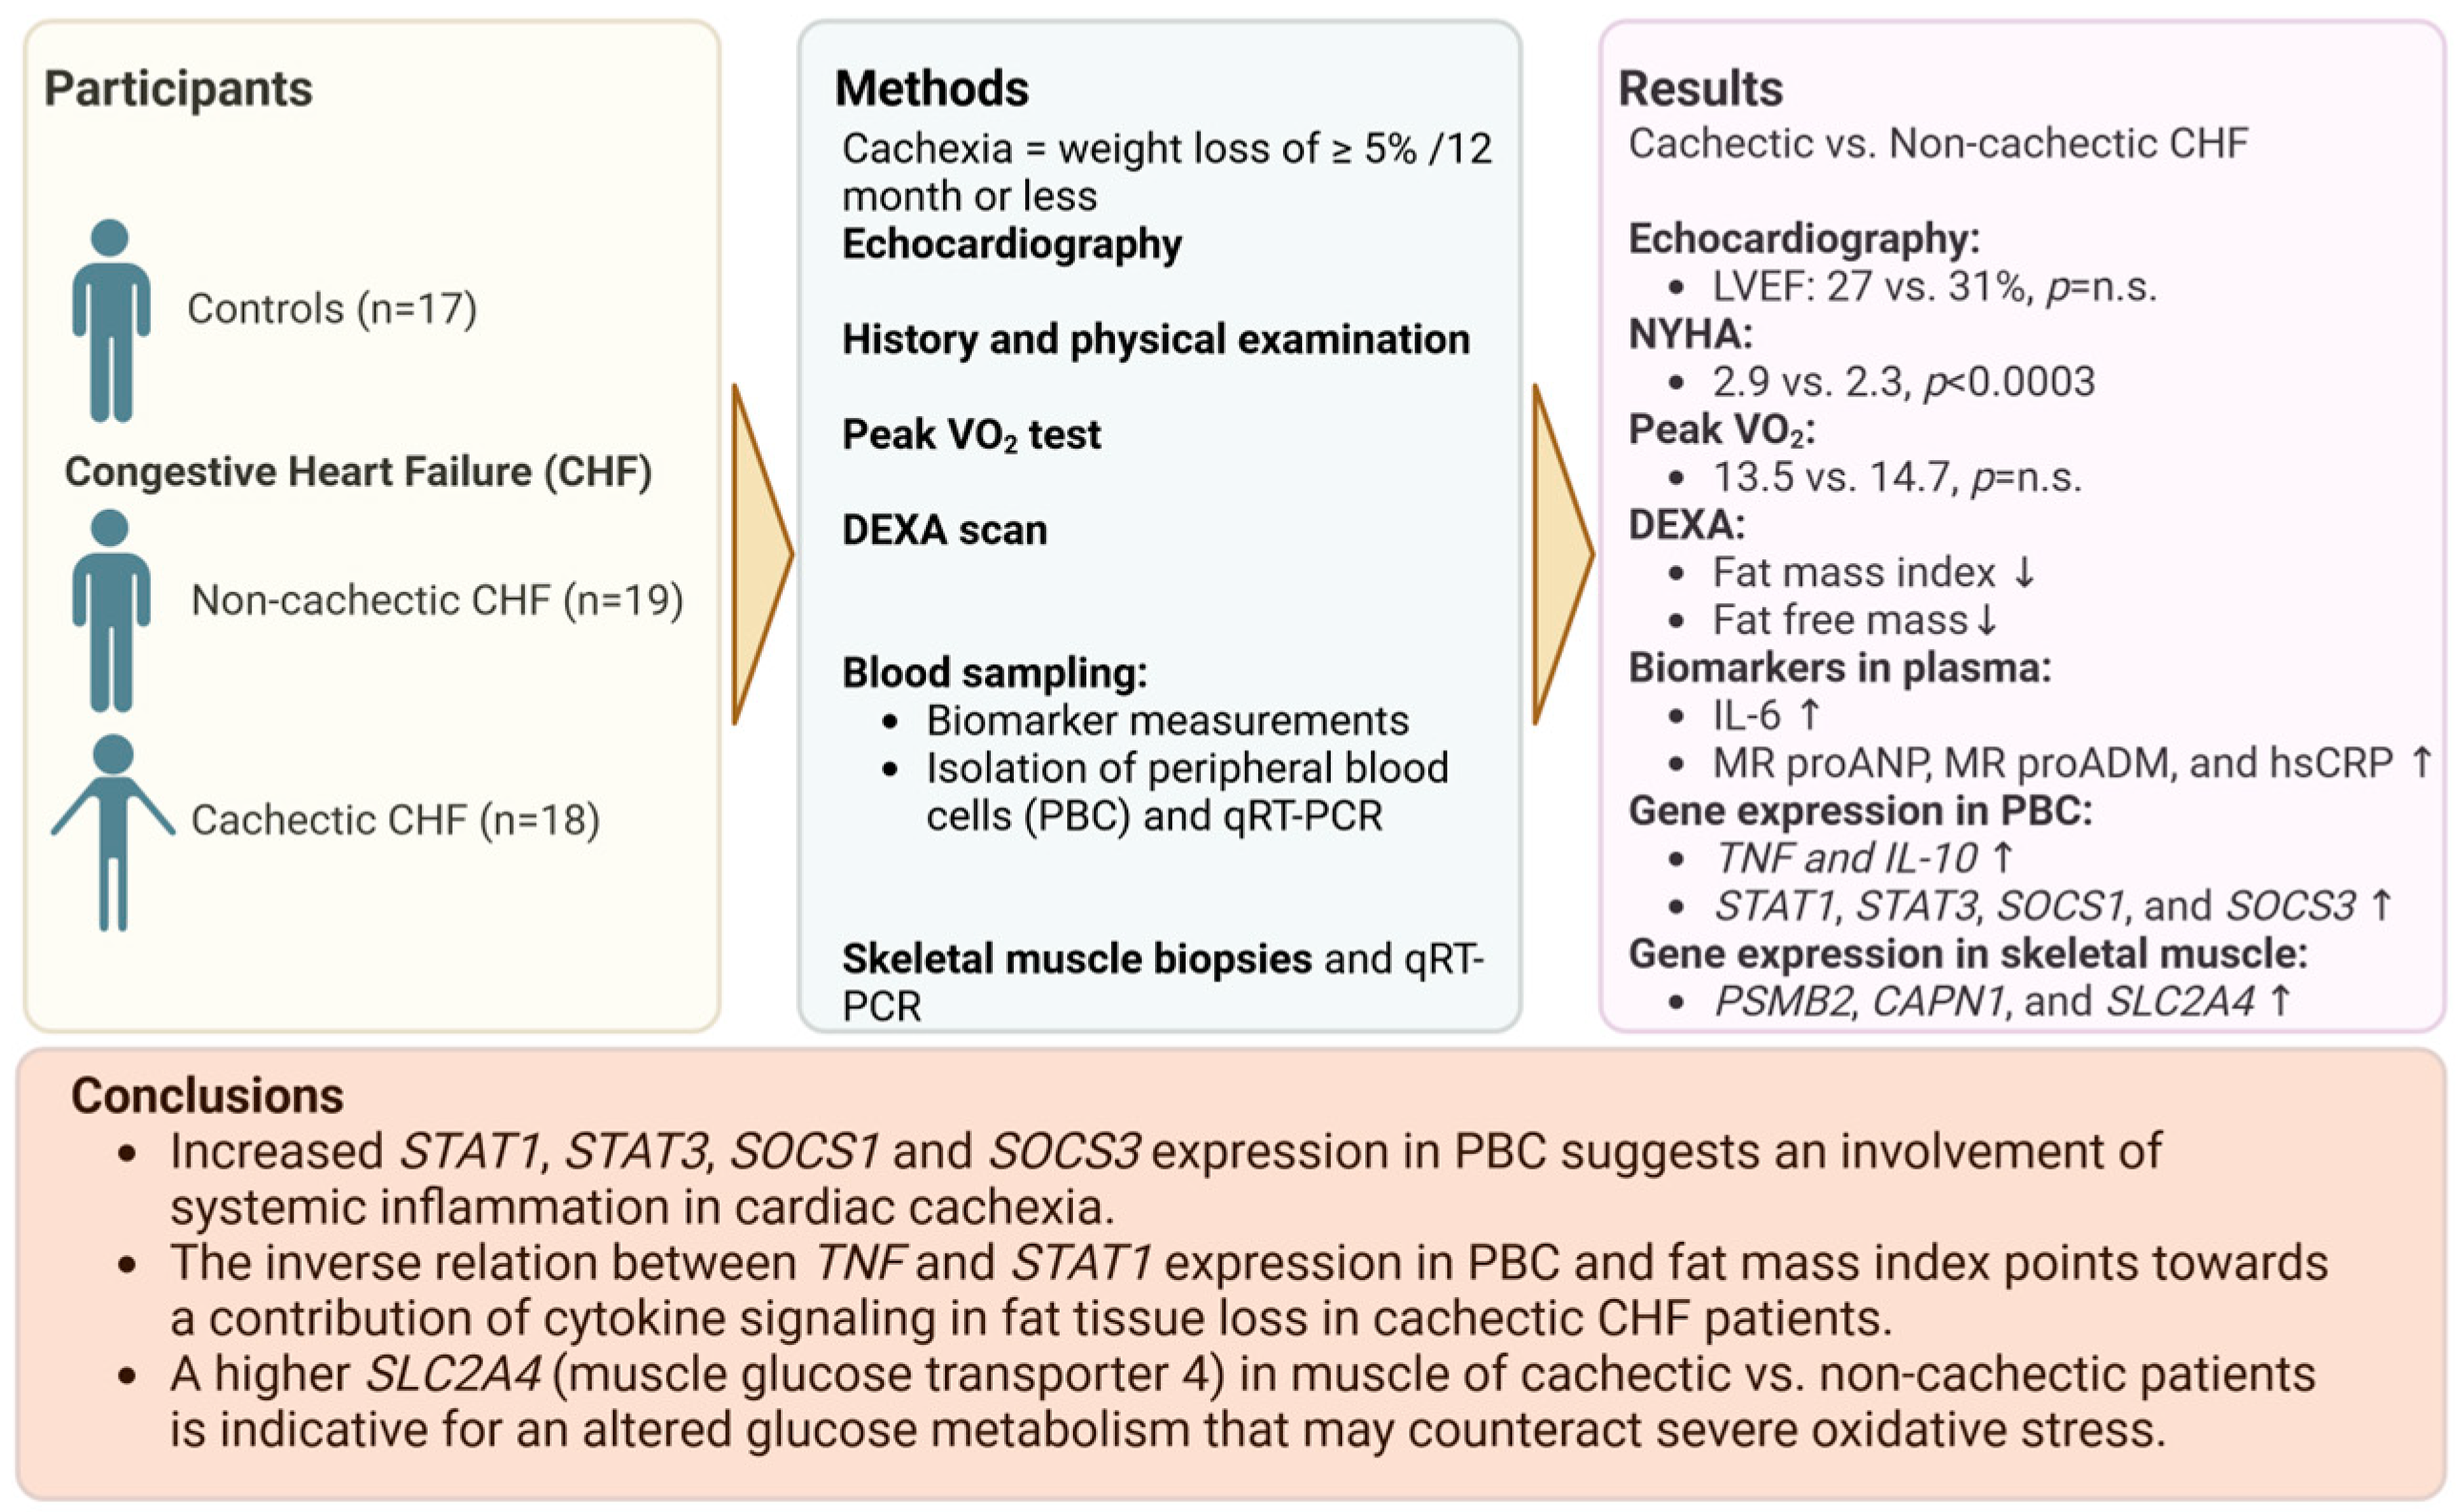
3. Results
3.1. Baseline Characteristics
3.1.1. Body Composition
3.1.2. Oxygen Consumption
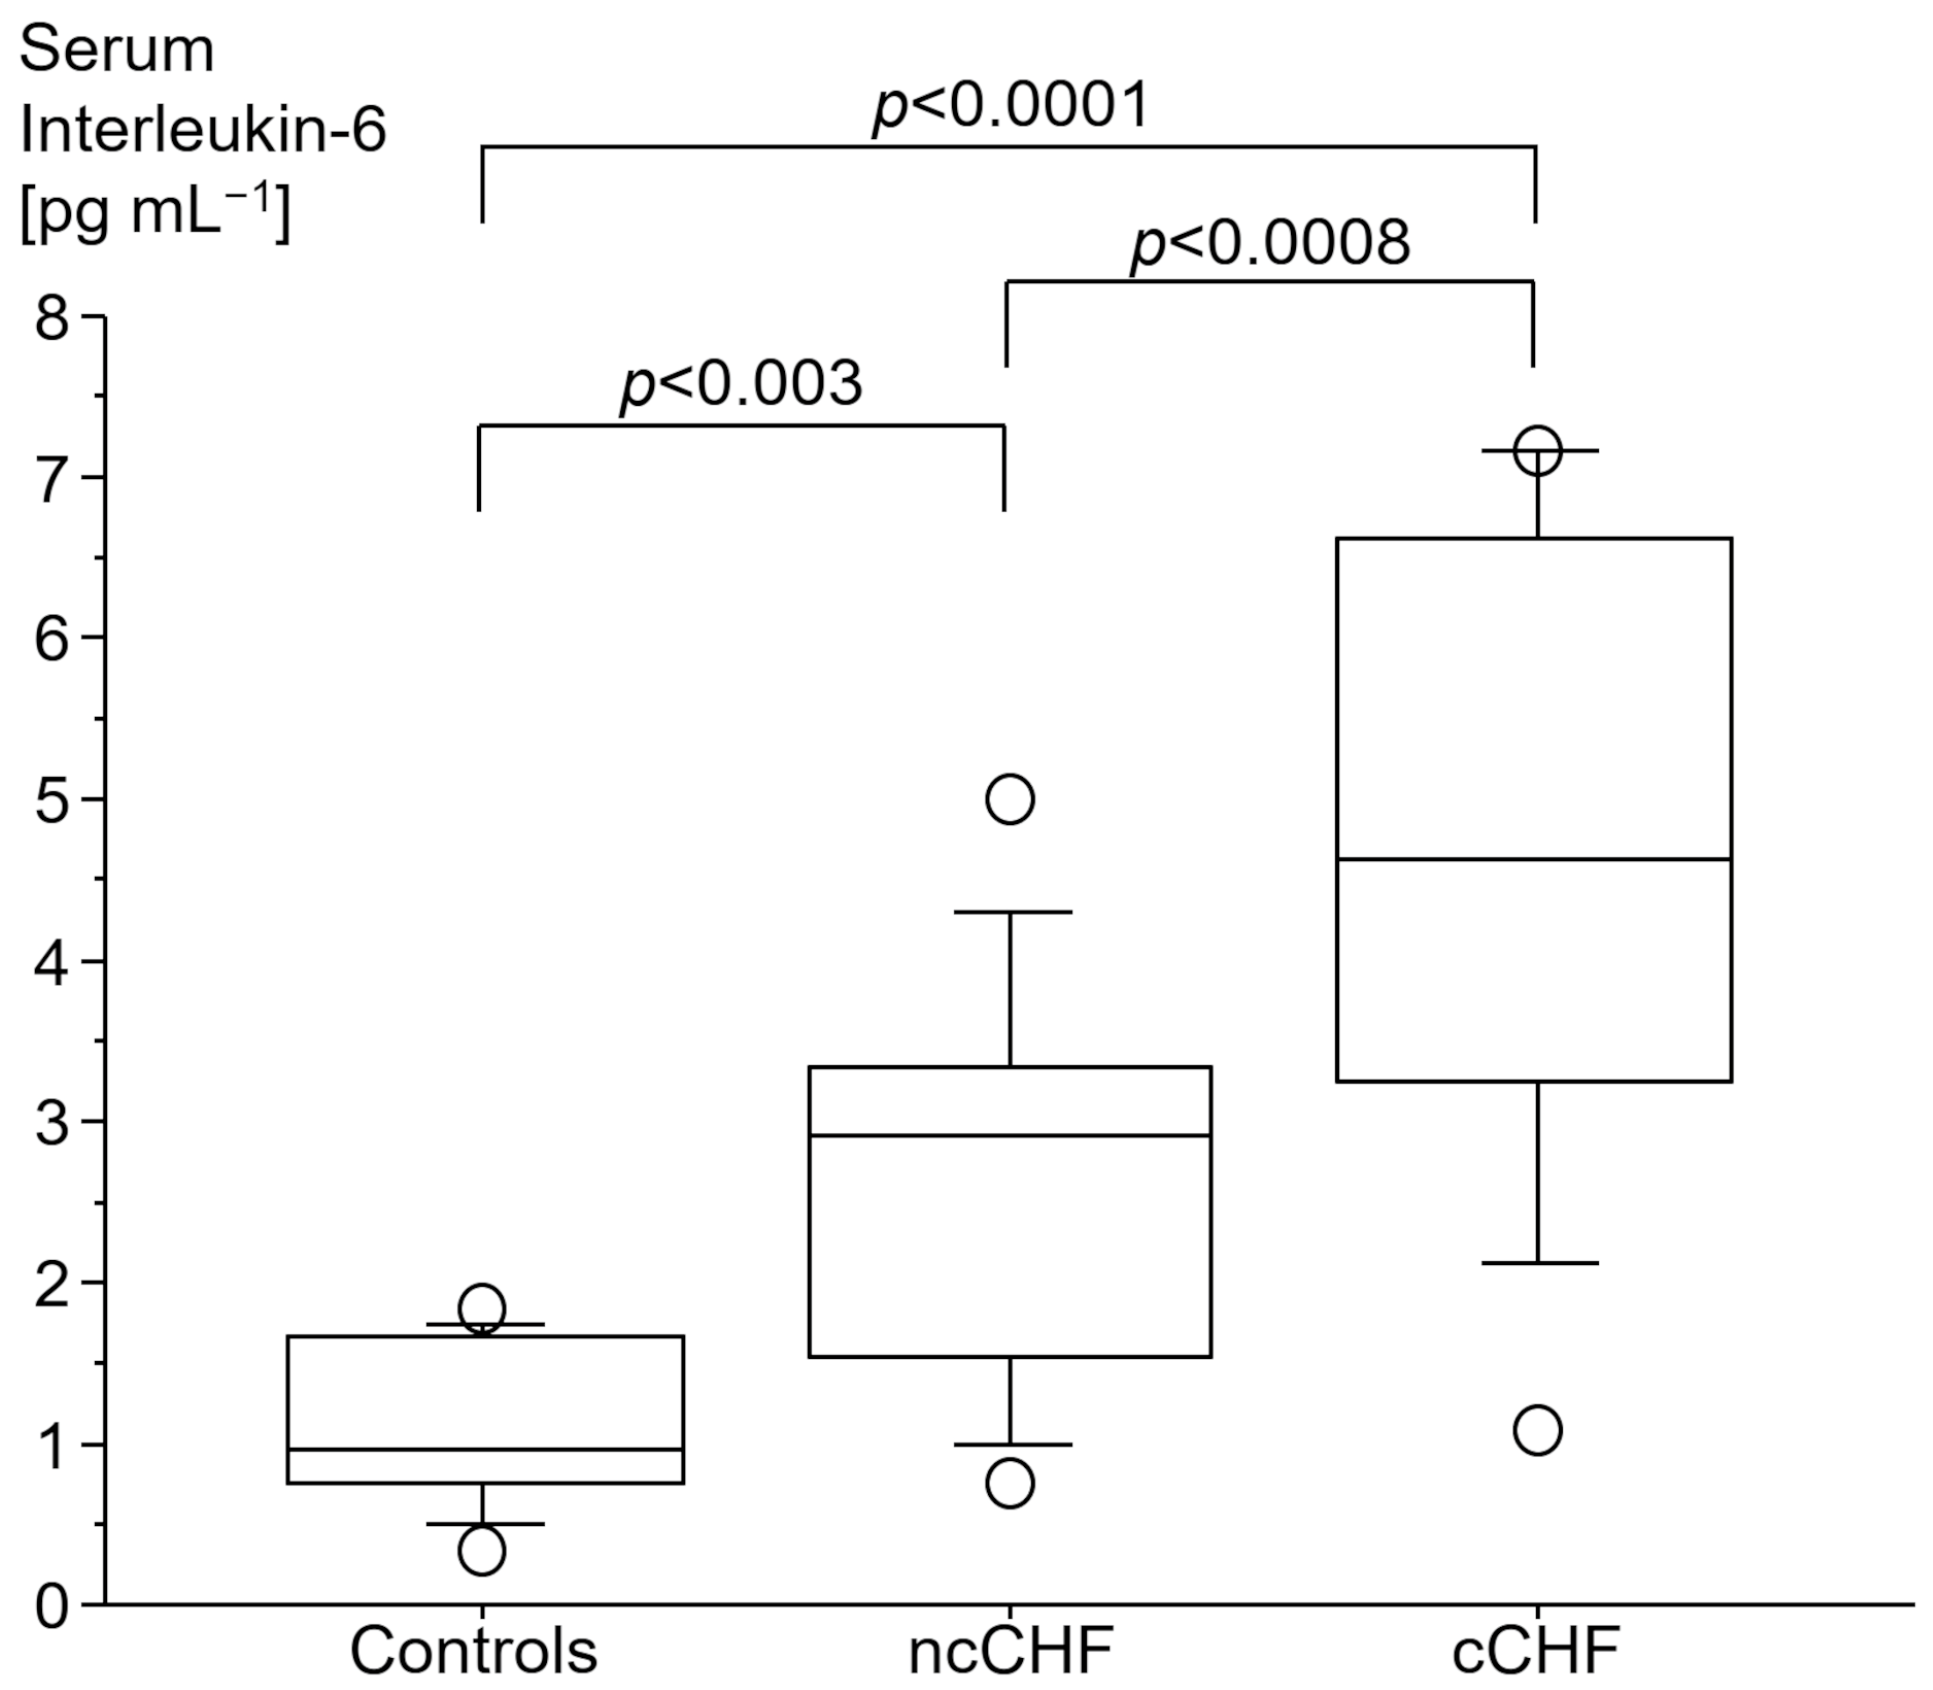
3.2. Immune Markers
3.2.1. Cytokine Gene Expression
3.2.2. LPS Stimulation
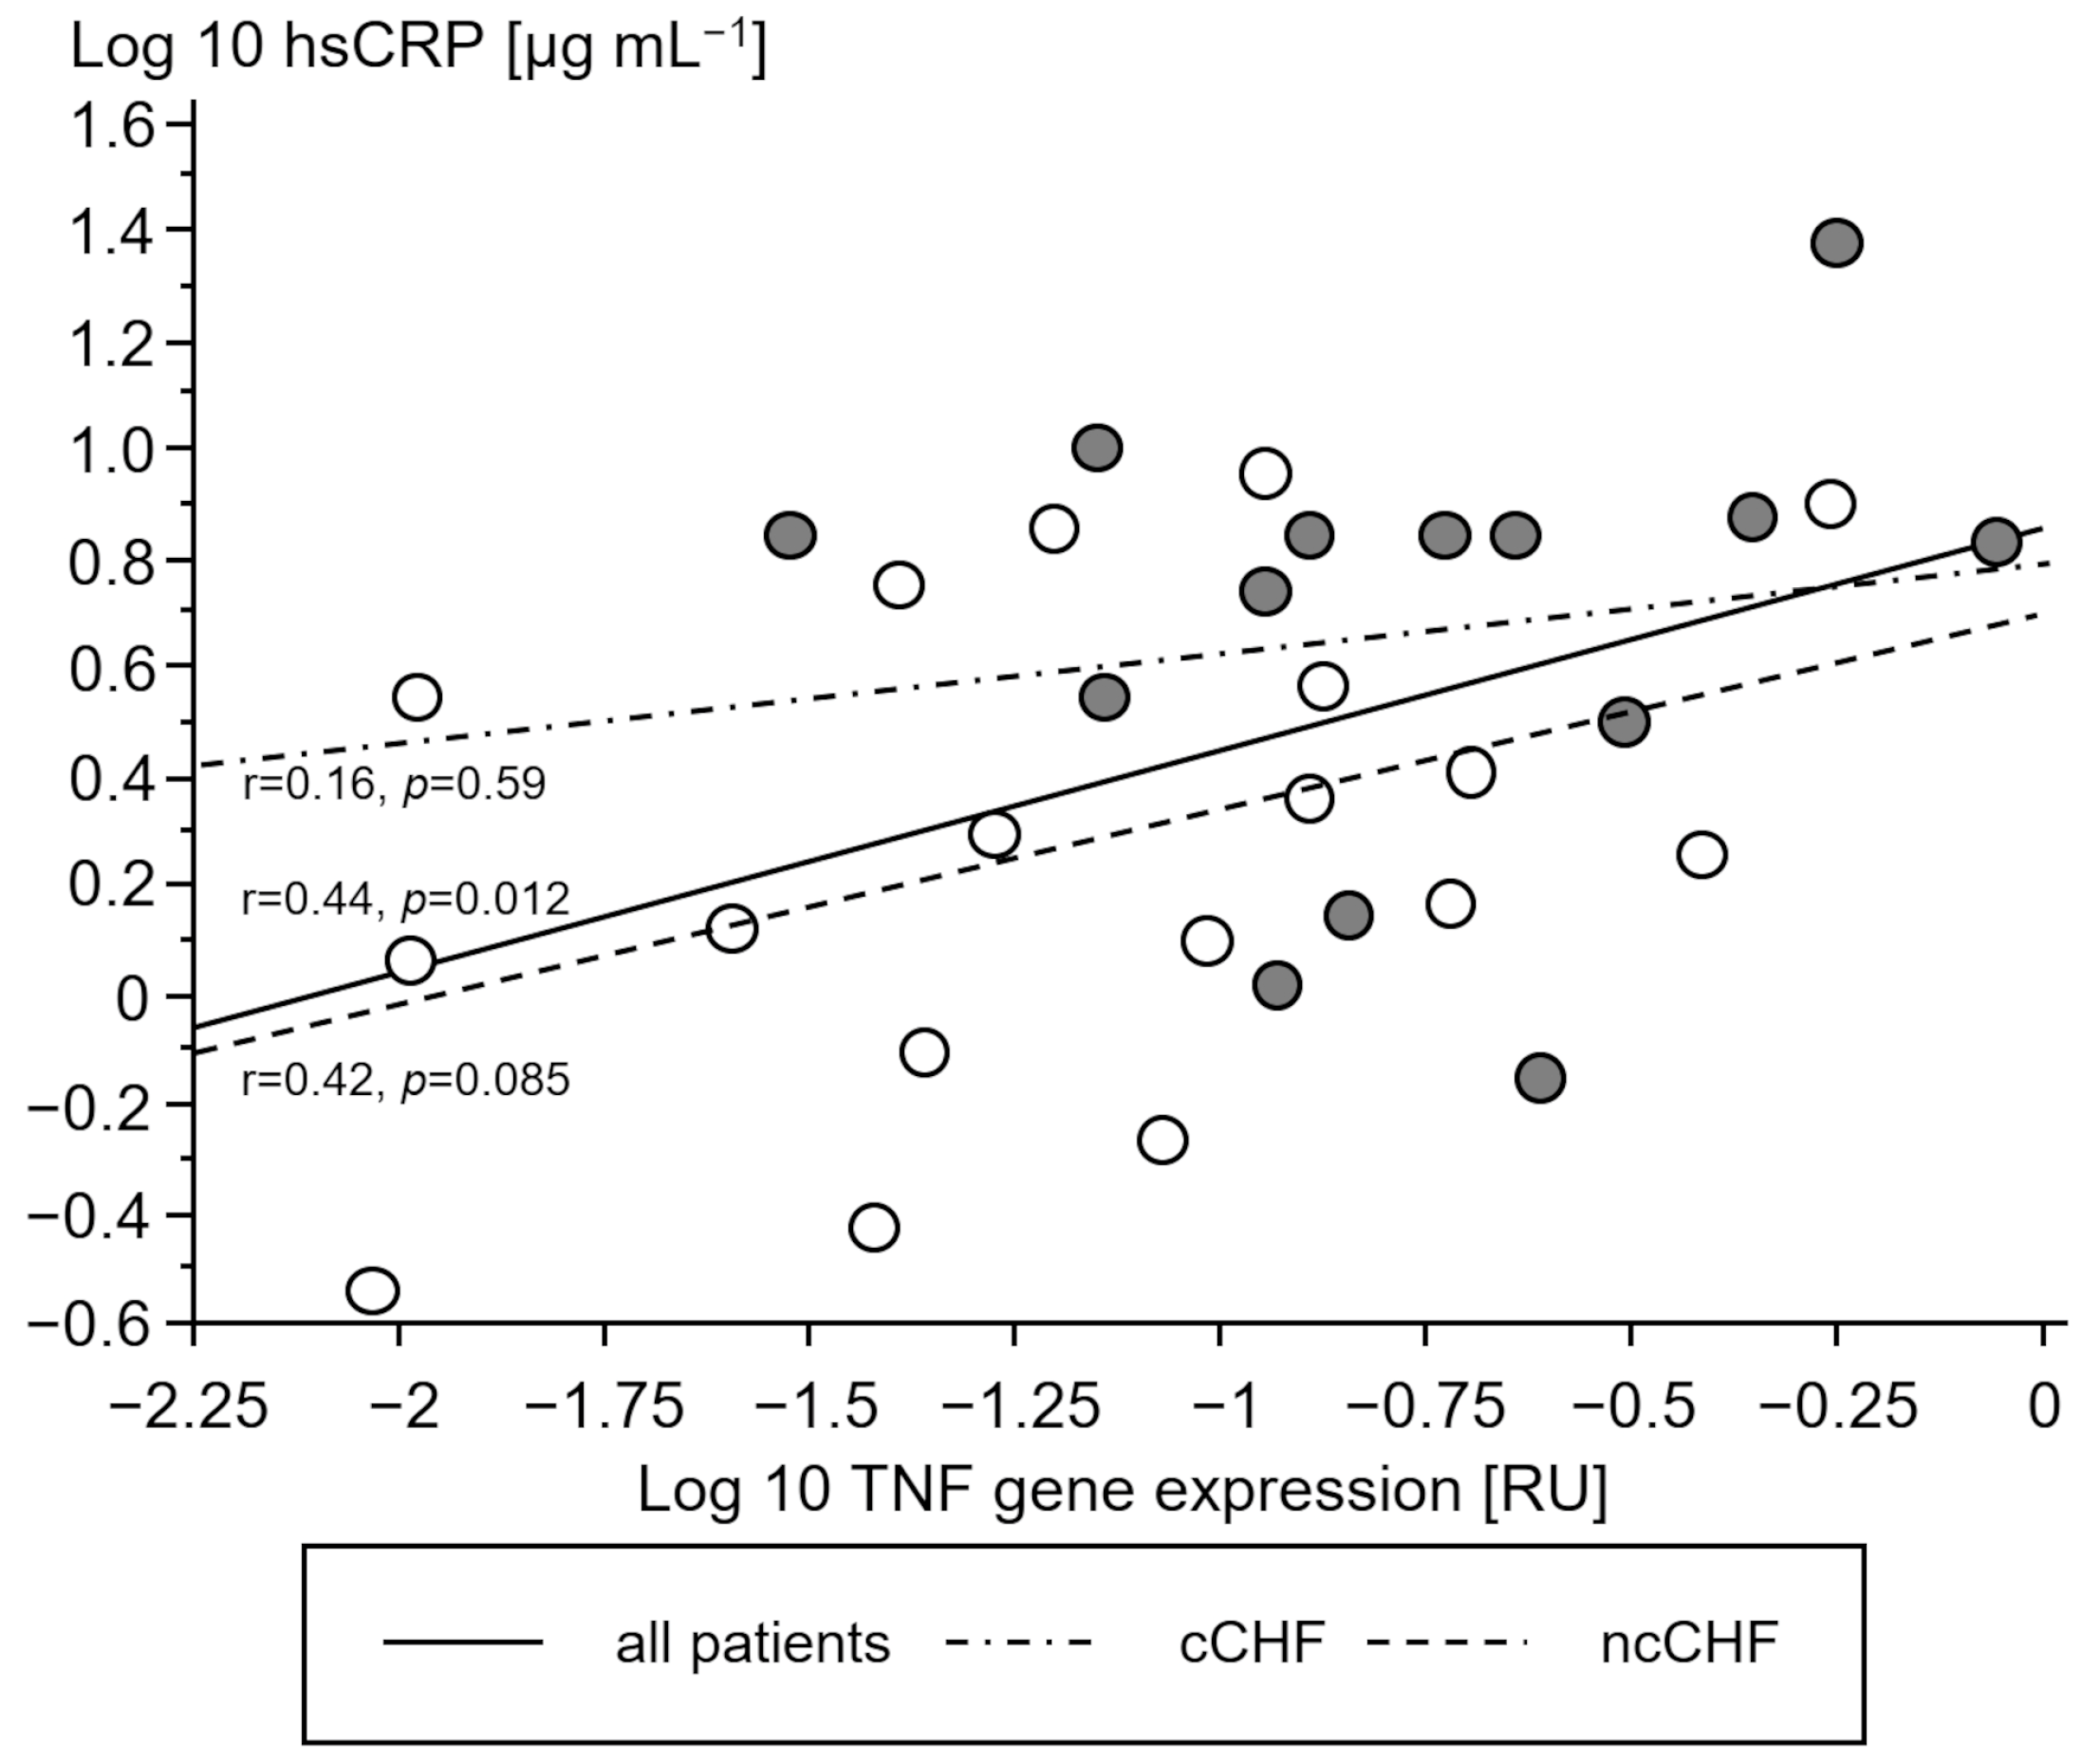
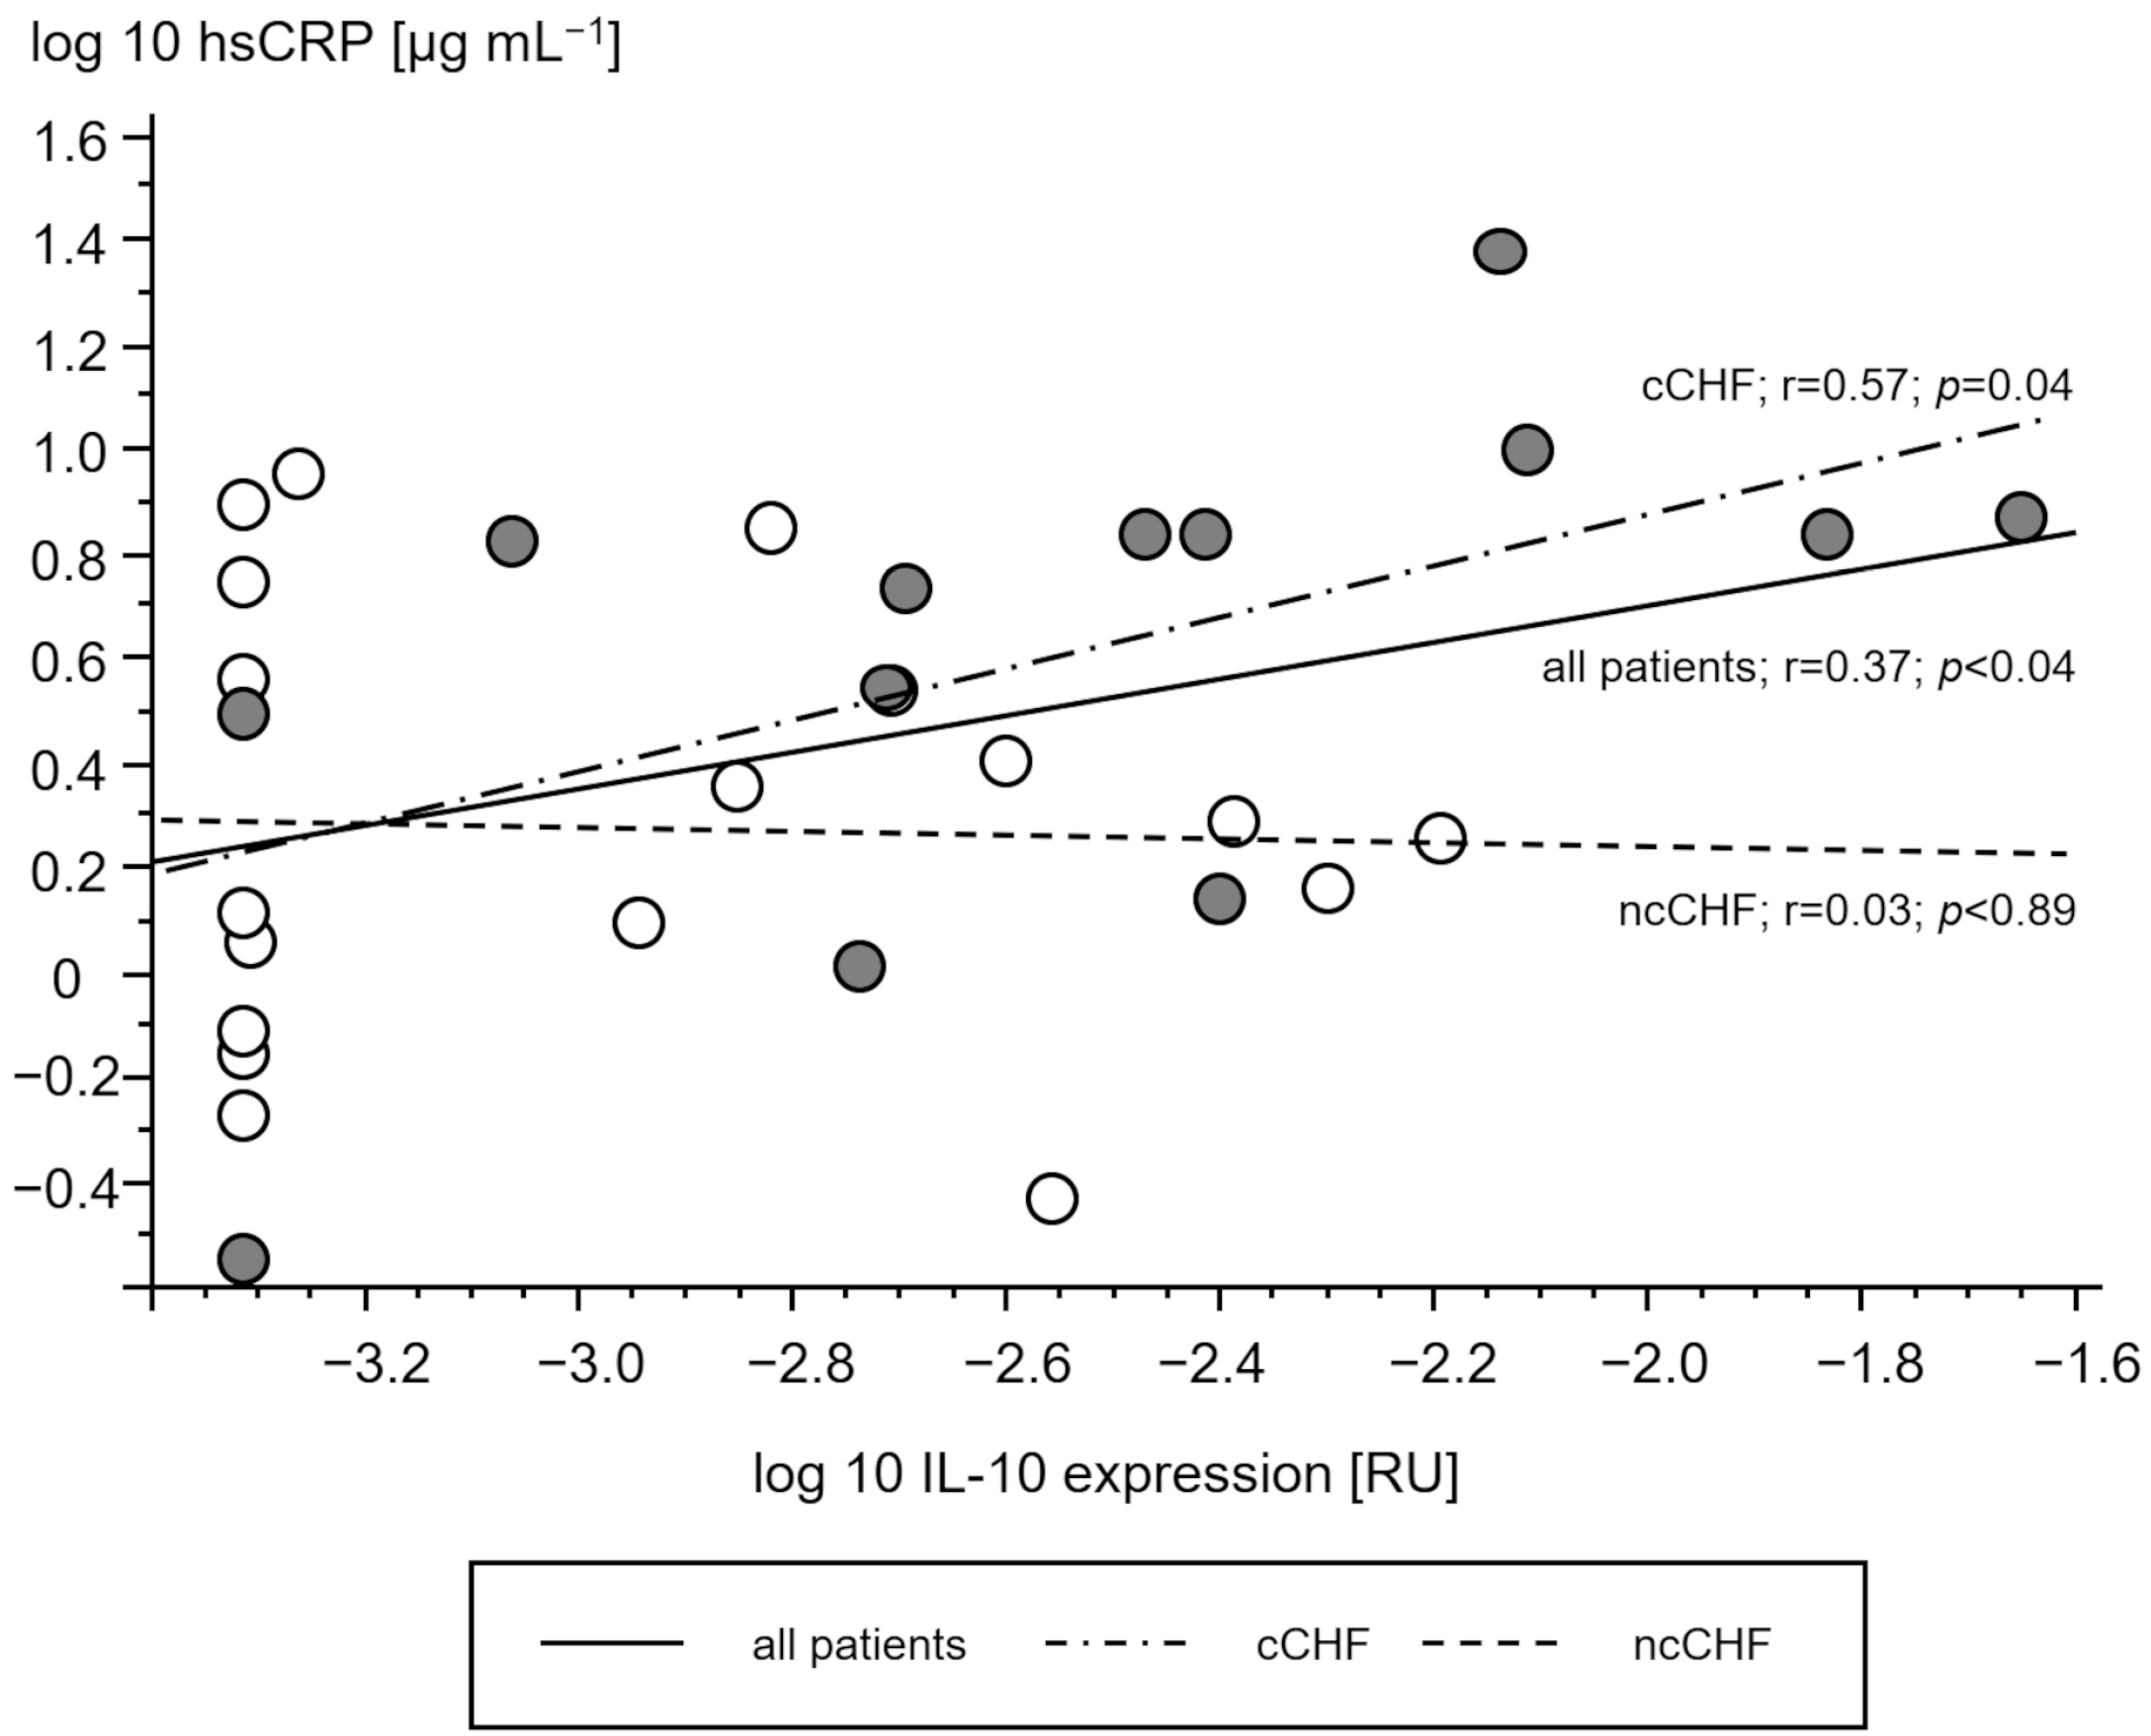
3.2.3. Association of STAT and SOCS Genes with Cytokine Gene Expression
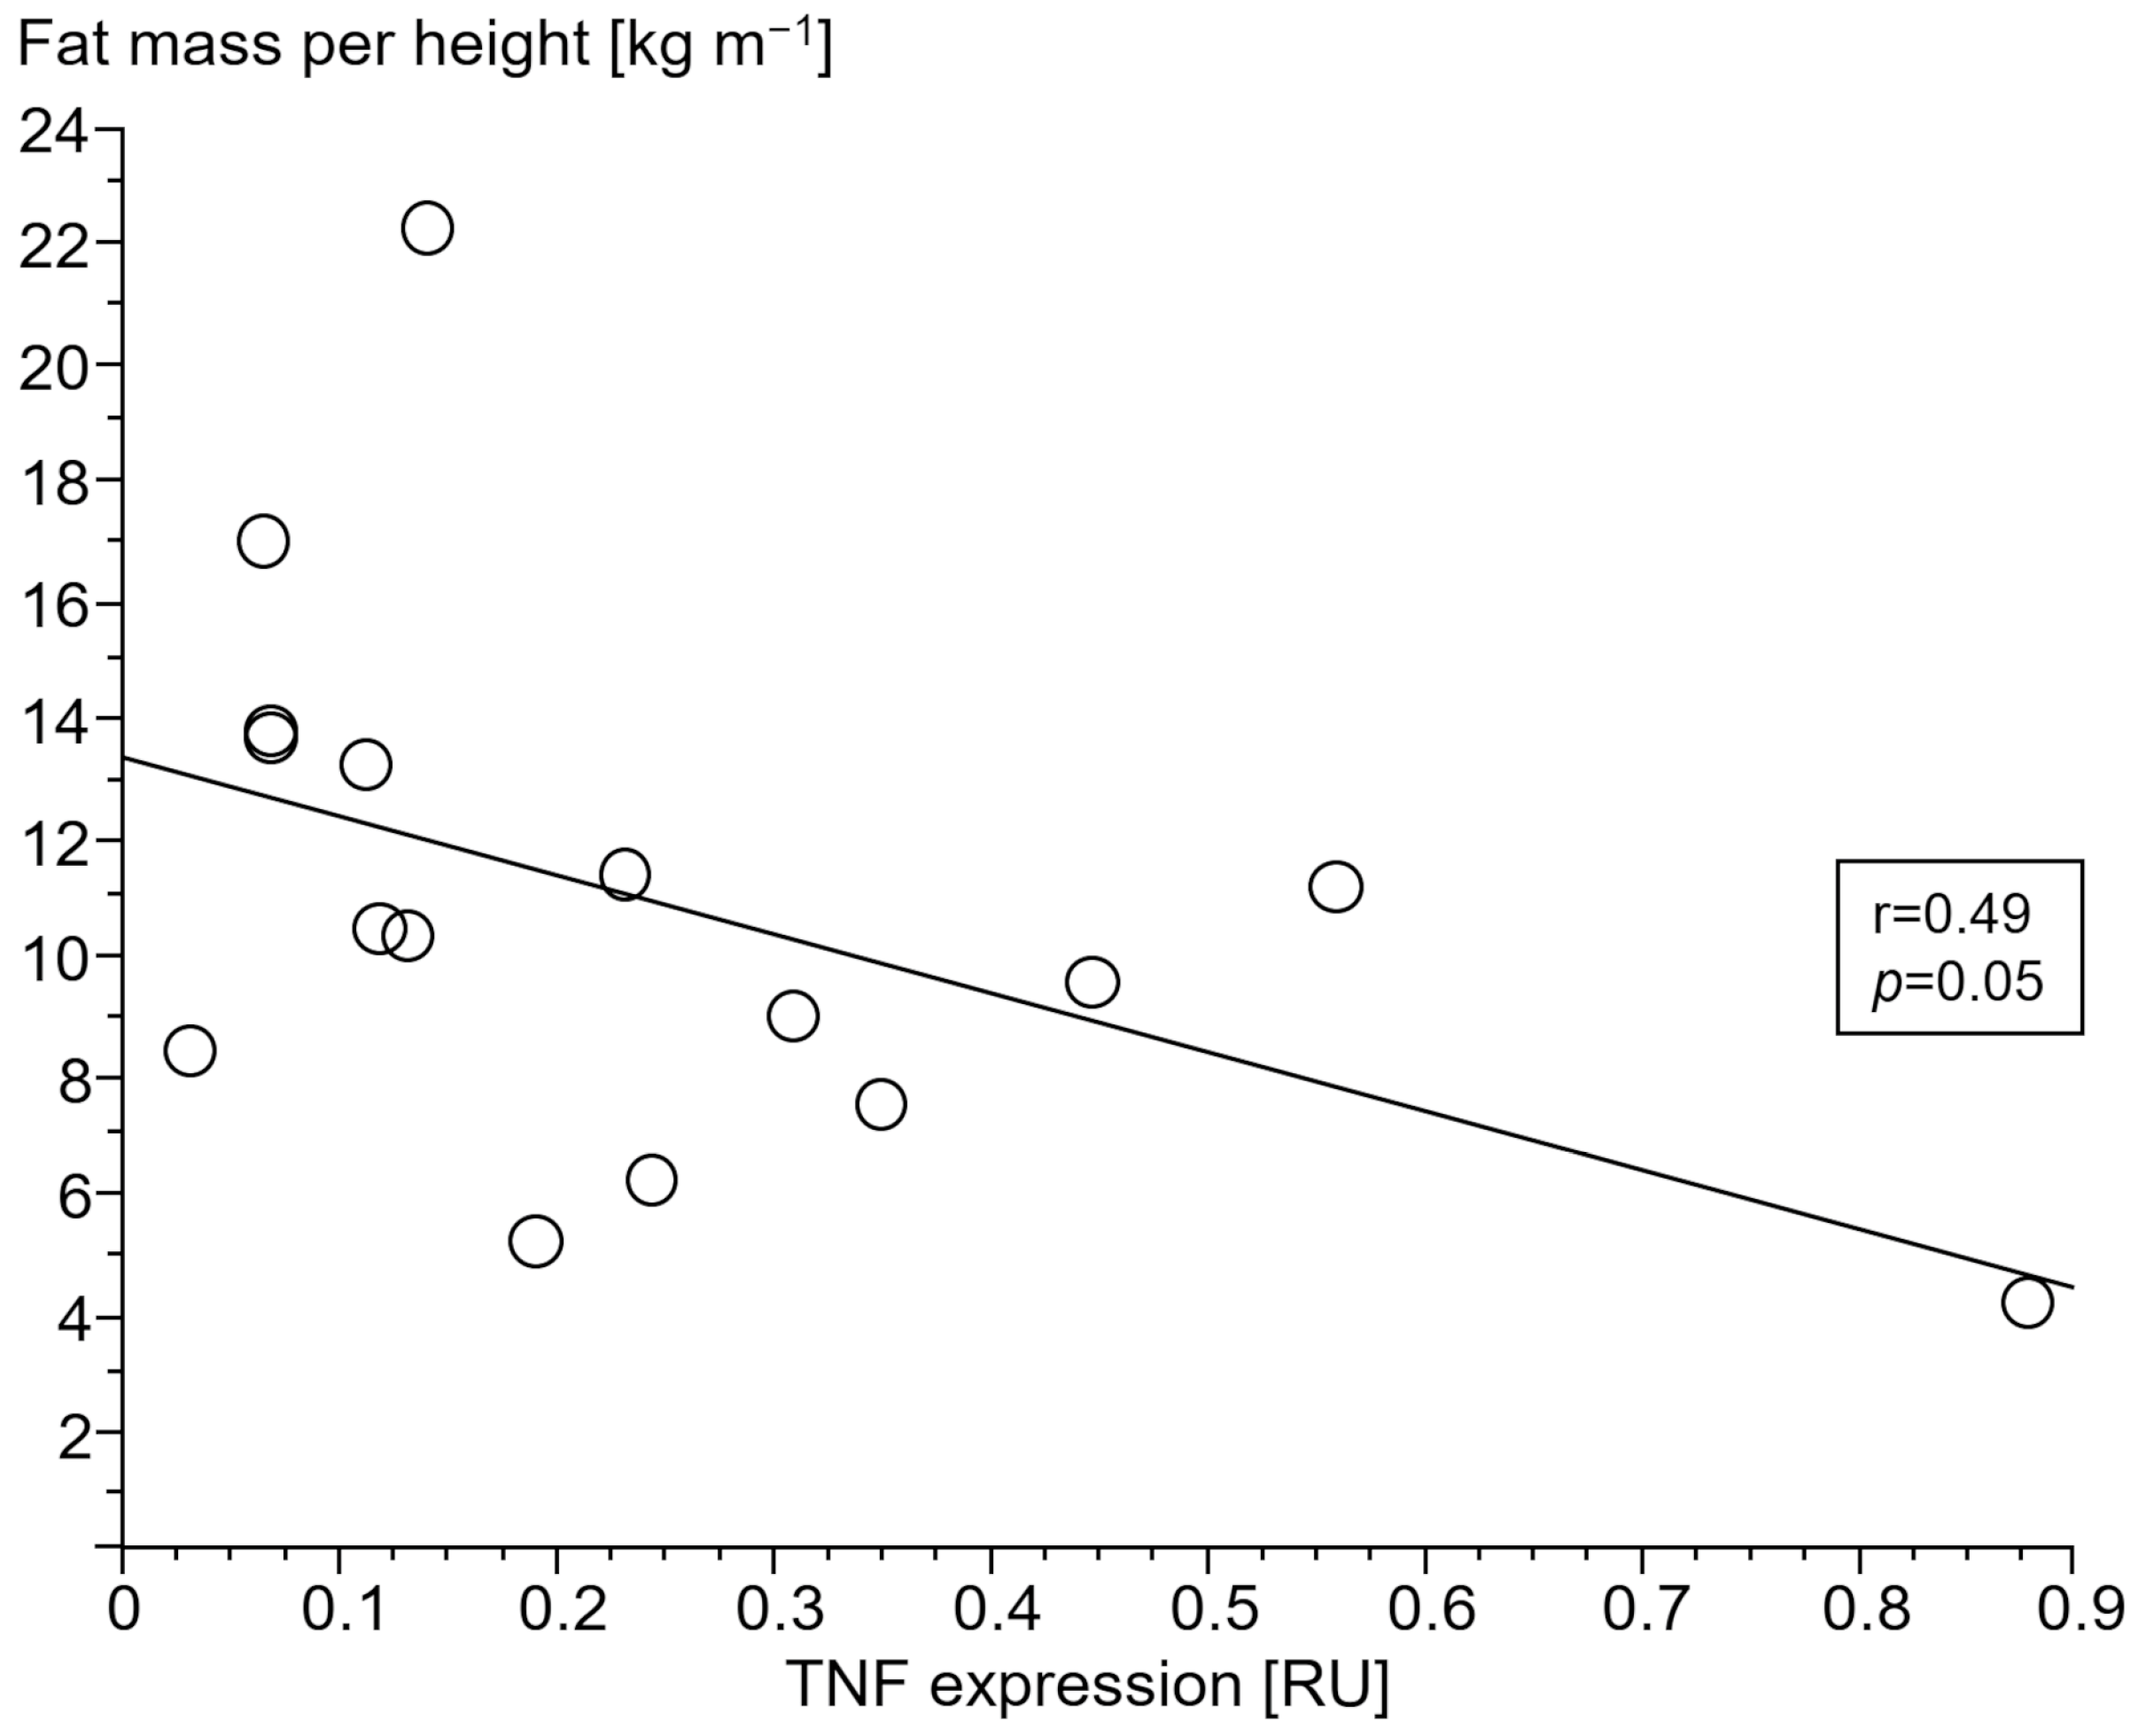
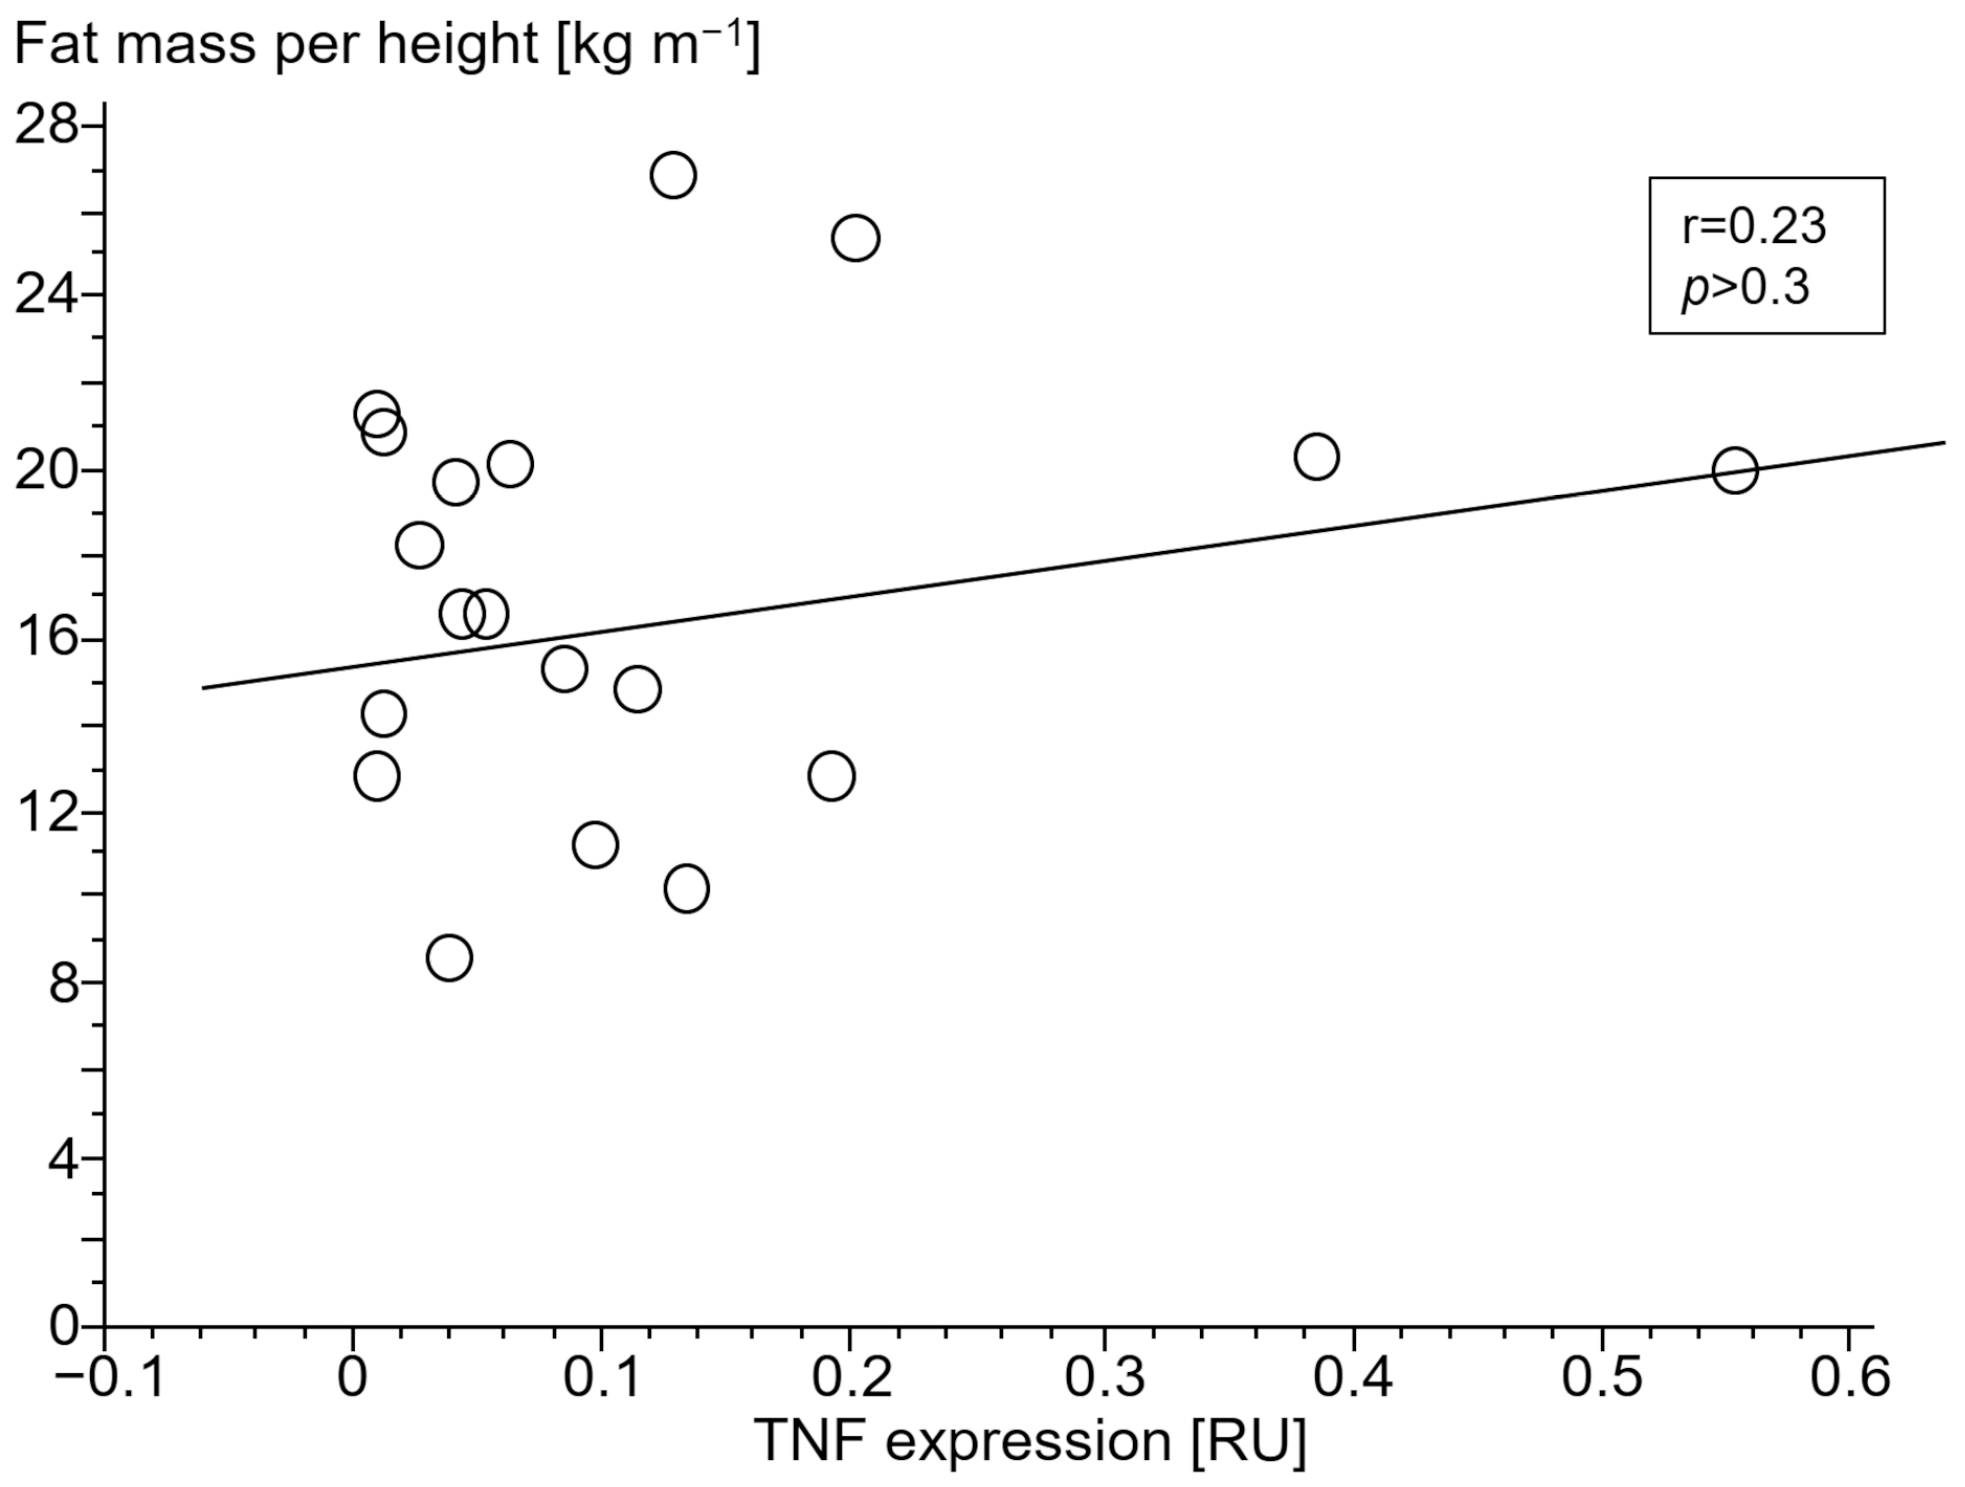
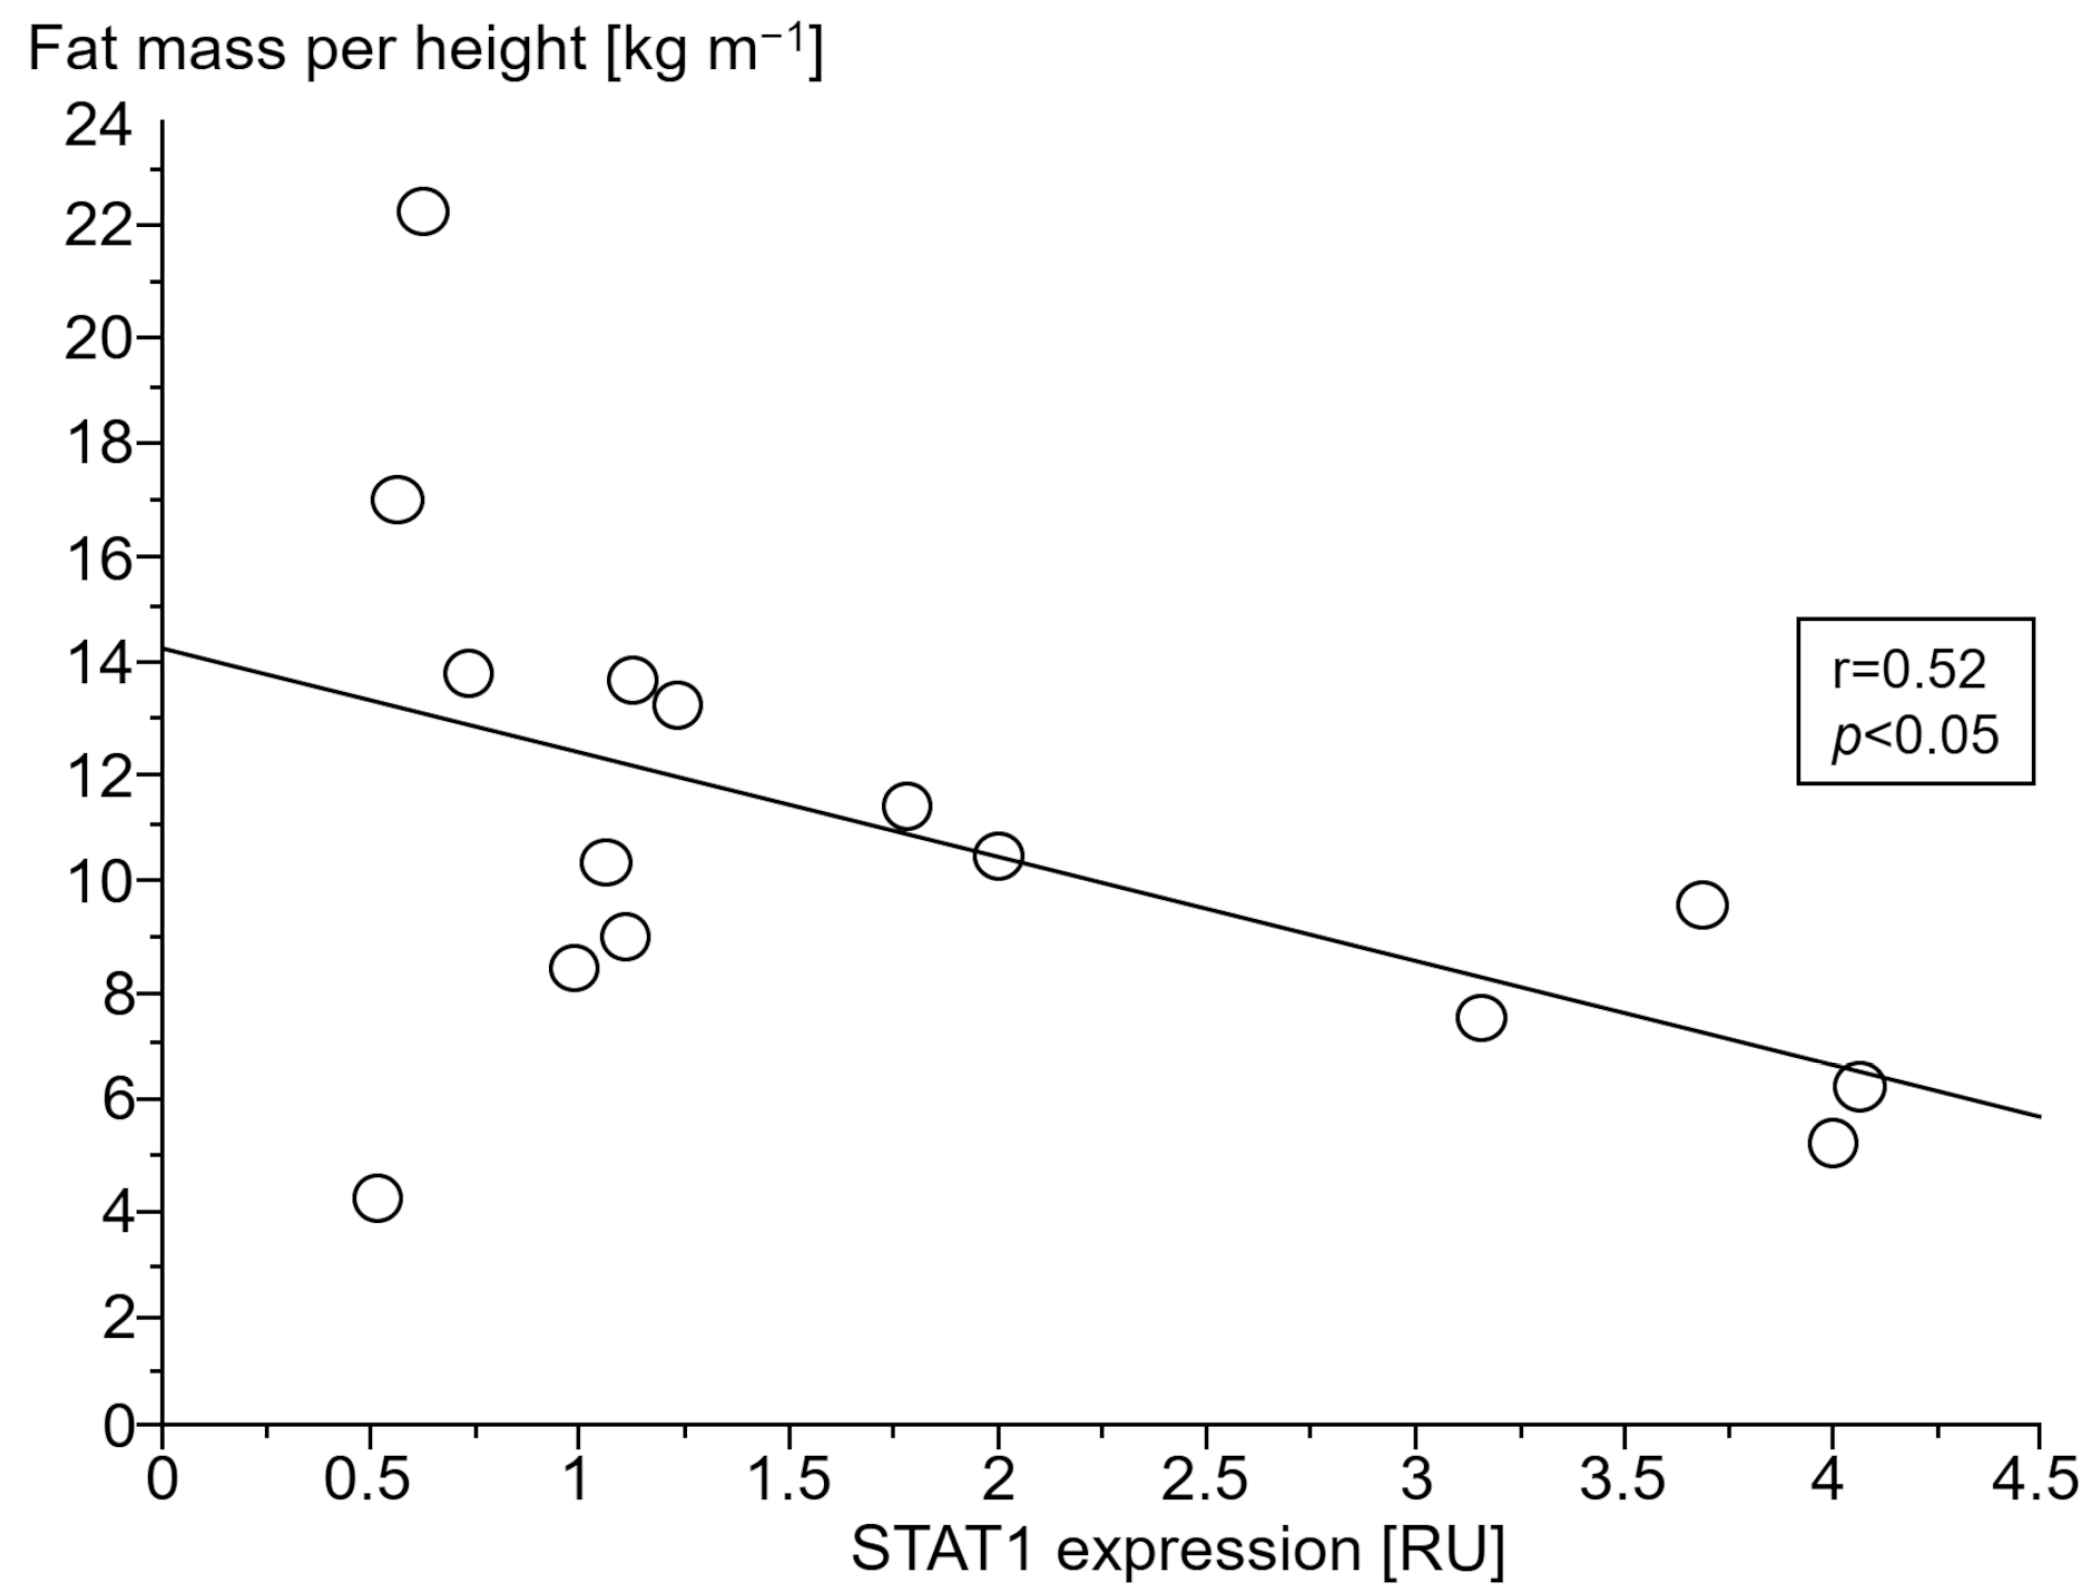
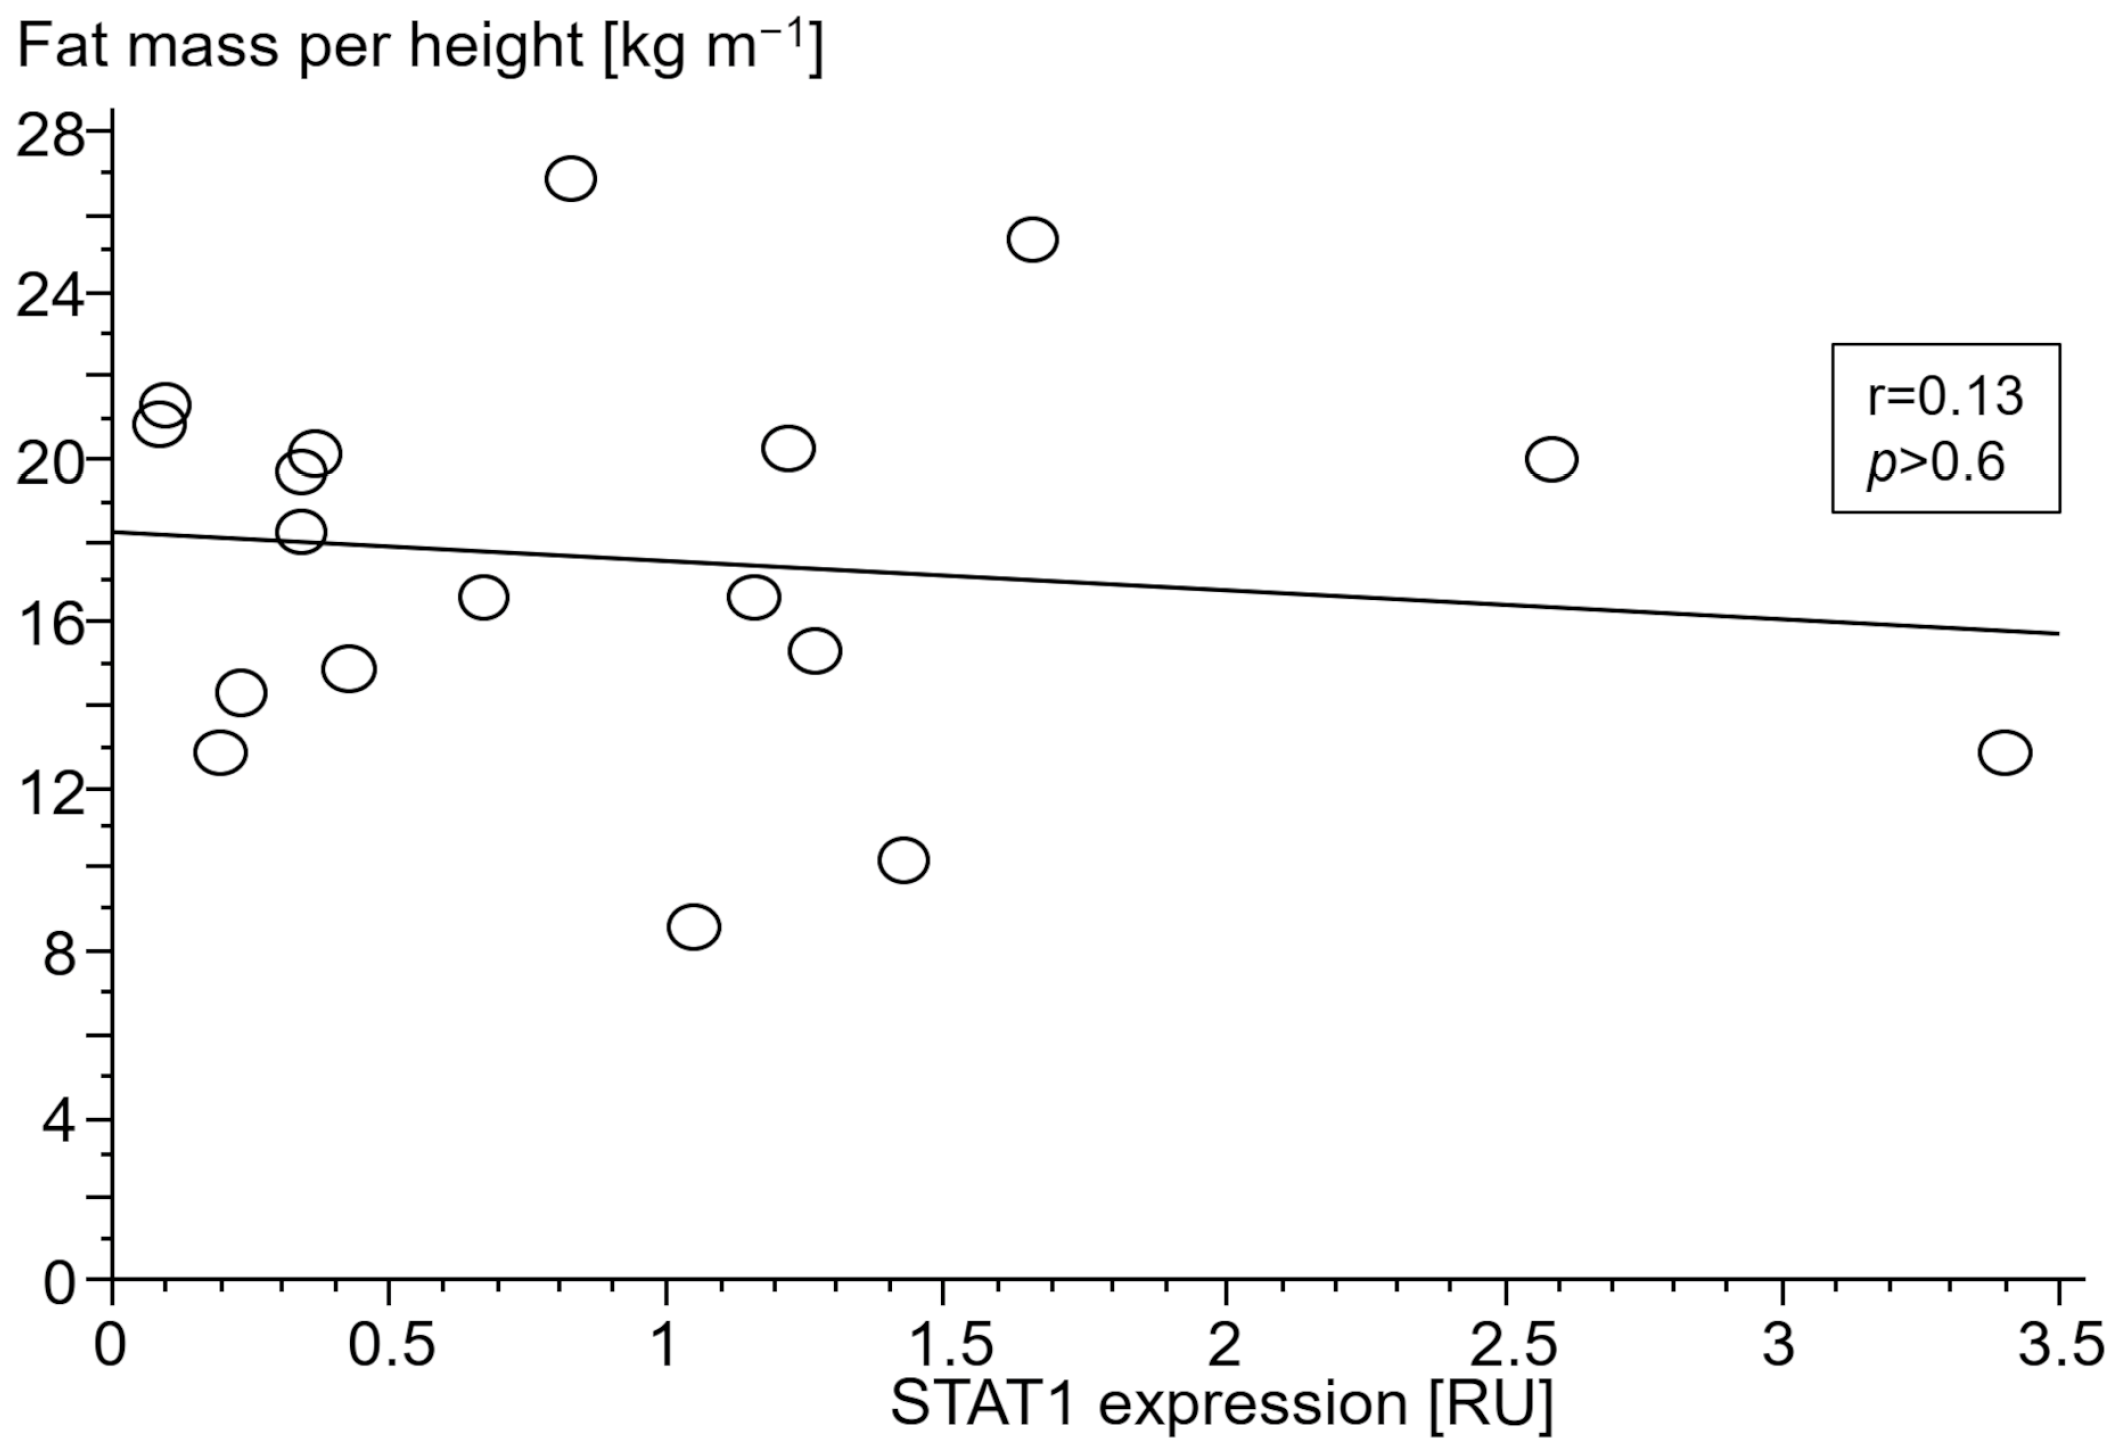
3.2.4. Association of Gene Expressions with Body Composition
3.2.5. Association of STAT- and SOCS Expression with Cytokine Release upon LPS Stimulation
3.3. Markers of Oxidative Stress and Vasoconstriction
3.3.1. Mid-Regional Pro-Adrenomedullin
3.3.2. C-Terminal Pro-Endothelin 1
3.4. Skeletal Muscle Biopsies
3.4.1. Proteasome 20S Subunit Beta 2 (PSMB2)
3.4.2. Calpain-1 Catalytic Subunit (CAPN1)
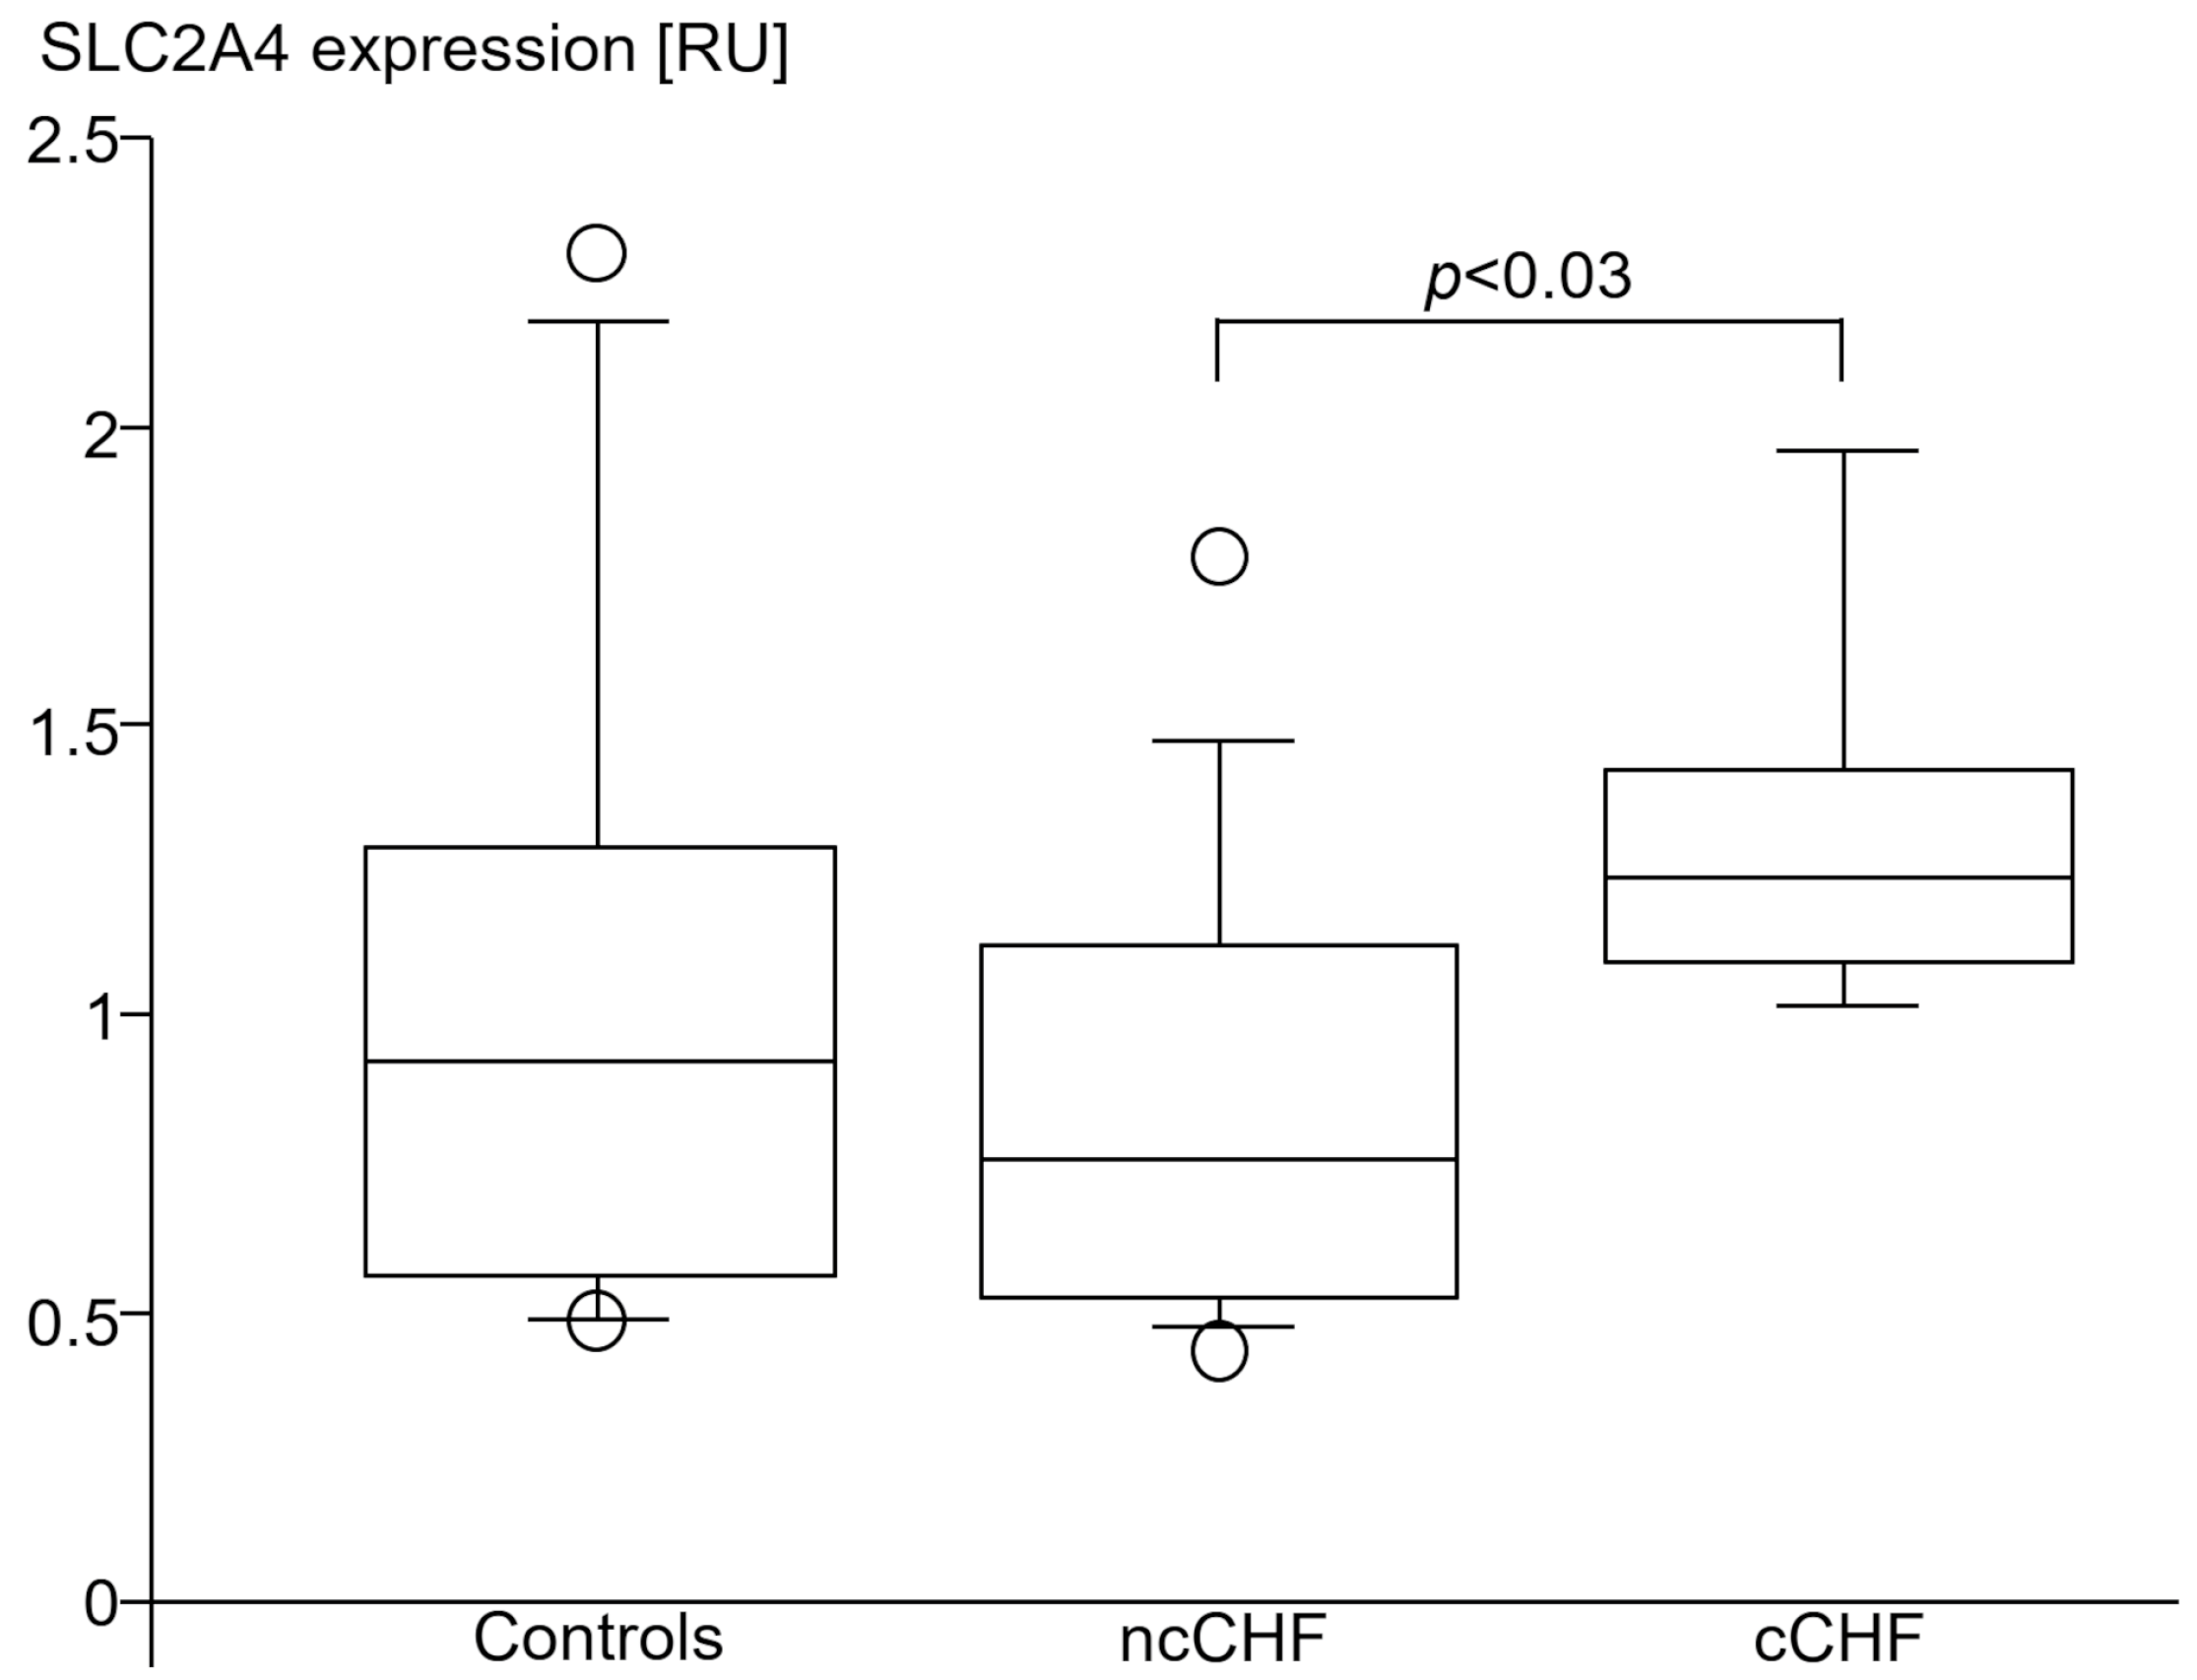
3.4.3. Solute Carrier Family 2 Member 4 (SLC2A4)
3.5. Cytokine, STAT and SOCS Expressions and Severity of CHF
4. Discussion
4.1. Inflammation Is Increased in Cardiac Cachexia
4.2. Cytokine-Induced Cellular Stress and Damage in the Cachectic Muscle
4.3. SLC2A4 Expression of the Skeletal Muscle
4.4. Lipolysis
5. Conclusions
6. Limitations
Author Contributions
Funding
Institutional Review Board Statement
Informed Consent Statement
Data Availability Statement
Acknowledgments
Conflicts of Interest
Abbreviations
| CAPN1 | calpain-1 catalytic subunit |
| CHF | chronic heart failure |
| cCHF | chronic heart failure patients with cachexia |
| Glucose Transporter 4 | Glut4 |
| hs | high sensitivity |
| ncCHF | chronic heart failure patients without cachexia |
| Peak VO2 | maximum oxygen consumption |
| LVEF | left ventricular ejection fraction |
| TNF | tumor necrosis factor |
| TGF | transforming growth factor |
| IL | interleukin |
| TNF | tumor necrosis factor |
| JAK | janus (tandem) kinase |
| PBC | peripheral blood cells |
| STAT | signal transducer and activator of transcription |
| SOCS | suppressors of cytokine signaling |
| PSMB2 | proteasome 20S subunit beta 2 |
| SLC2A4 | solute carrier family 2 member 4 |
References
- Philippou, A.; Xanthis, D.; Chryssanthopοulos, C.; Maridaki, M.; Koutsilieris, M. Heart Failure-Induced Skeletal Muscle Wasting. Curr. Heart Fail. Rep. 2020, 17, 299–308. [Google Scholar] [CrossRef] [PubMed]
- Levine, B.; Kalman, J.; Mayer, L.; Fillit, H.M.; Packer, M. Elevated circulating levels of tumor necrosis factor in severe chronic heart failure. N. Engl. J. Med. 1990, 323, 236–241. [Google Scholar] [CrossRef] [PubMed]
- Josiak, K.; Jankowska, E.A.; Piepoli, M.F.; Banasiak, W.; Ponikowski, P. Skeletal myopathy in patients with chronic heart failure: Significance of anabolic-androgenic hormones. J. Cachexia Sarcopenia Muscle 2014, 5, 287–296. [Google Scholar] [CrossRef]
- Nagaya, N.; Uematsu, M.; Kojima, M.; Date, Y.; Nakazato, M.; Okumura, H.; Hosoda, H.; Shimizu, W.; Yamagishi, M.; Oya, H.; et al. Elevated circulating level of ghrelin in cachexia associated with chronic heart failure: Relationships between ghrelin and anabolic/catabolic factors. Circulation 2001, 104, 2034–2038. [Google Scholar] [CrossRef] [PubMed]
- Rahman, A.; Jafry, S.; Jeejeebhoy, K.; Nagpal, A.D.; Pisani, B.; Agarwala, R. Malnutrition and Cachexia in Heart Failure. JPEN J. Parenter. Enteral Nutr. 2016, 4, 475–486. [Google Scholar] [CrossRef] [PubMed]
- Matsukawa, A. STAT proteins in innate immunity during sepsis: Lessons from gene knockout mice. Acta Med. Okayama 2007, 61, 239–245. [Google Scholar]
- Ponikowski, P.; Voors, A.A.; Anker, S.D.; Bueno, H.; Cleland, J.G.F.; Coats, A.J.S.; Falk, V.; González-Juanatey, J.R.; Harjola, V.P.; Jankowska, E.A.; et al. 2016 ESC Guidelines for the diagnosis and treatment of acute and chronic heart failure: The Task Force for the diagnosis and treatment of acute and chronic heart failure of the European Society of Cardiology (ESC) Developed with the special contribution of the Heart Failure Association (HFA) of the ESC. Eur. Heart J. 2016, 37, 2129–2200. [Google Scholar]
- Evans, W.J.; Morley, J.E.; Argilés, J.; Bales, C.; Baracos, V.; Guttridge, D.; Jatoi, A.; Kalantar-Zadeh, K.; Lochs, H.; Mantovani, G.; et al. Cachexia: A new definition. Clin. Nutr. 2008, 27, 793–799. [Google Scholar] [CrossRef]
- Riggio, O.; Andreoli, A.; Diana, F.; Fiore, P.; Meddi, P.; Lionetti, R.; Montagnese, F.; Merli, M.; Capocaccia, L.; De Lorenzo, A. Whole body and regional body composition analysis by dual-energy X-ray absorptiometry in cirrhotic patients. Eur. J. Clin. Nutr. 1997, 12, 810–814. [Google Scholar] [CrossRef]
- Platzer, C.; Ode-Hakim, S.; Reinke, P.; Docke, W.D.; Ewert, R. Volk HD: Quantitative PCR analysis of cytokine transcription patterns in peripheral mononuclear cells after anti-CD3 rejection therapy using two novel multispecific competitor fragments. Transplantation 1994, 58, 264–268. [Google Scholar] [CrossRef]
- Morgenthaler, N.G.; Struck, J.; Alonso, C.; Bergmann, A. Measurement of midregional proadrenomedullin in plasma with an immunoluminometric assay. Clin. Chem. 2005, 51, 1823–1829. [Google Scholar] [CrossRef]
- Maisel, A.; Mueller, C.; Nowak, R.; Peacock, W.F.; Landsberg, J.W.; Ponikowski, P.; Mockel, M.; Hogan, C.; Wu, A.H.; Richards, M.; et al. Mid-region pro-hormone markers for diagnosis and prognosis in acute dyspnea: Results from the BACH (Biomarkers in Acute Heart Failure) trial. J. Am. Coll. Cardiol. 2010, 55, 2062–2076. [Google Scholar] [CrossRef]
- Ferro, C.J.; Spratt, J.C.; Haynes, W.G.; Webb, D.J. Inhibition of neutral endopeptidase causes vasoconstriction of human resistance vessels in vivo. Circulation 1998, 97, 2323–2330. [Google Scholar] [CrossRef]
- Bergstrom, J. Percutaneous needle biopsy of skeletal muscle in physiological and clinical research. Scand. J. Clin. Lab. Investig. 1975, 35, 609–616. [Google Scholar] [CrossRef]
- Oliver, W.T.; Keel, B.N.; Lindholm-Perry, A.K.; Horodyska, J.; Foote, A.P. The effects of Capn1 gene inactivation on the differential expression of genes in skeletal muscle. Gene 2018, 668, 54–58. [Google Scholar] [CrossRef] [PubMed]
- Costelli, P.; De Tullio, R.; Baccino, F.M.; Melloni, E. Activation of Ca(2+)-dependent proteolysis in skeletal muscle and heart in cancer cachexia. Br. J. Cancer 2001, 84, 946–950. [Google Scholar] [CrossRef] [PubMed]
- Todorov, P.; Cariuk, P.; McDevitt, T.; Coles, B.; Fearon, K.; Tisdale, M. Characterization of a cancer cachectic factor. Nature 1996, 379, 739–742. [Google Scholar] [CrossRef]
- Wyke, S.M.; Tisdale, M.J. NF-kappaB mediates proteolysis-inducing factor induced protein degradation and expression of the ubiquitin-proteasome system in skeletal muscle. Br. J. Cancer 2005, 92, 711–721. [Google Scholar] [CrossRef] [PubMed]
- Skuratovskaia, D.; Komar, A.; Vulf, M.; Quang, H.V.; Shunkin, E.; Volkova, L.; Gazatova, N.; Zatolokin, P.; Litvinova, L. IL-6 Reduces Mitochondrial Replication, and IL-6 Receptors Reduce Chronic Inflammation in NAFLD and Type 2 Diabetes. Int. J. Mol. Sci. 2021, 22, 1774. [Google Scholar] [CrossRef]
- Ji, C.; Chen, X.; Gao, C.; Jiao, L.; Wang, J.; Xu, G.; Fu, H.; Guo, X.; Zhao, Y. IL-6 induces lipolysis and mitochondrial dysfunction, but does not affect insulin-mediated glucose transport in 3T3-L1 adipocytes. J. Bioenerg. Biomembr. 2011, 43, 367–375. [Google Scholar] [CrossRef]
- Abid, H.; Ryan, Z.C.; Delmotte, P.; Sieck, G.C.; Lanza, I.R. Extramyocellular interleukin-6 influences skeletal muscle mitochondrial physiology through canonical JAK/STAT signaling pathways. FASEB J. 2020, 34, 14458–14472. [Google Scholar] [CrossRef]
- Qualls, A.E.; Southern, W.M.; Call, J.A. Mitochondria-cytokine crosstalk following skeletal muscle injury and disuse: A mini-review. Am. J. Physiol-Cell Physiol. 2021, 320, C681–C688. [Google Scholar] [CrossRef] [PubMed]
- Carson, J.A.; Hardee, J.P.; VanderVeen, B.N. The emerging role of skeletal muscle oxidative metabolism as a biological target and cellular regulator of cancer-induced muscle wasting. Semin. Cell Dev. Biol. 2016, 54, 53–67. [Google Scholar] [CrossRef] [PubMed]
- Ozturk, K.; Demir, B.; Oke, R.; Durmaz, H. Dose-related effects of recombinant human interleukin-10 on hypoxia-induced skeletal muscle injury in immature rats. J. Orthop. Sci. 2006, 11, 620–625. [Google Scholar] [CrossRef] [PubMed]
- Latorre, E.; Matheus, N.; Layunta, E.; Alcalde, A.I.; Mesonero, J.E. IL-10 counteracts proinflammatory mediator evoked oxidative stress in Caco-2 cells. Mediat. Inflamm. 2014, 2014, 982639. [Google Scholar] [CrossRef] [PubMed]
- Huang, S.; Czech, M.P. The GLUT4 glucose transporter. Cell Metab. 2007, 5, 237–252. [Google Scholar] [CrossRef]
- Ke, R.; Xu, Q.; Li, C.; Luo, L.; Huang, D. Mechanisms of AMPK in the maintenance of ATP balance during energy metabolism. Cell Biol. Int. 2018, 42, 384–392. [Google Scholar] [CrossRef] [PubMed]
- Lv, J.; Li, Y.; Shi, S.; Xu, X.; Wu, H.; Zhang, B.; Song, Q. Skeletal muscle mitochondrial remodeling in heart failure: An update on mechanisms and therapeutic opportunities. Biomed. Pharmacother. 2022, 155, 113833. [Google Scholar] [CrossRef]
- Furuya, D.T.; Neri, E.A.; Poletto, A.C.; Anhê, G.F.; Freitas, H.S.; Campello, R.S.; Rebouças, N.A.; Machado, U.F. Identification of nuclear factor-κB sites in the Slc2a4 gene promoter. Mol. Cell Endocrinol. 2013, 370, 87–95. [Google Scholar] [CrossRef]
- Ebersbach-Silva, P.; Poletto, A.C.; David-Silva, A.; Seraphim, P.M.; Anhê, G.F.; Passarelli, M.; Furuya, D.T.; Machado, U.F. Palmitate-induced Slc2a4/GLUT4 downregulation in L6 muscle cells: Evidence of inflammatory and endoplasmic reticulum stress involvement. Lipids Health Dis. 2018, 17, 64. [Google Scholar] [CrossRef]
- Doehner, W.; Gathercole, D.; Cicoira, M.; Krack, A.; Coats, A.J.; Camici, P.G.; Anker, S.D. Reduced glucose transporter GLUT4 in skeletal muscle predicts insulin resistance in non-diabetic chronic heart failure patients independently of body composition. Int. J. Cardiol. 2010, 138, 19–24. [Google Scholar] [CrossRef] [PubMed]
- Calegari, V.C.; Alves, M.; Picardi, P.K.; Inoue, R.Y.; Franchini, K.G.; Saad, M.J.; Velloso, L.A. Suppressor of cytokine signaling-3 Provides a novel interface in the cross-talk between angiotensin II and insulin signaling systems. Endocrinology 2005, 146, 579–588. [Google Scholar] [CrossRef] [PubMed]
- Kalra, P.R.; Tigas, S. Regulation of lipolysis: Natriuretic peptides and the development of cachexia. Int. J. Cardiol. 2002, 85, 125–132. [Google Scholar] [CrossRef]
- Bordicchia, M.; Liu, D.; Amri, E.Z.; Ailhaud, G.; Dessì-Fulgheri, P.; Zhang, C.; Takahashi, N.; Sarzani, R.; Collins, S. Cardiac natriuretic peptides act via p38 MAPK to induce the brown fat thermogenic program in mouse and human adipocytes. J. Clin. Investig. 2012, 122, 1022–1036. [Google Scholar] [CrossRef] [PubMed]
- Christensen, H.M.; Kistorp, C.; Schou, M.; Keller, N.; Zerahn, B.; Frystyk, J.; Flyvbjerg, A.; Faber, J. Cross-talk between the heart and adipose tissue in cachectic heart failure patients with respect to alterations in body composition: A prospective study. Metabolism 2014, 63, 141–149. [Google Scholar] [CrossRef] [PubMed]
- Huang, Q.; Wu, M.; Wu, X.; Zhang, Y.; Xia, Y. Muscle-to-tumor crosstalk: The effect of exercise-induced myokine on cancer progression. Biochim. Biophys. Acta Rev. Cancer 2022, 1877, 188761. [Google Scholar] [CrossRef]
- Ponikowski, P.; Piepoli, M.; Chua, T.P.; Banasiak, W.; Francis, D.; Anker, S.D.; Coats, A.J. The impact of cachexia on cardiorespiratory reflex control in chronic heart failure. Eur. Heart J. 1999, 22, 1667–1675. [Google Scholar] [CrossRef]
- Ripamonti, C.; Bruera, E. Dyspnea: Pathophysiology and assessment. J. Pain Symptom Manag. 1997, 4, 220–232. [Google Scholar] [CrossRef]
- Dudgeon, D.; Baracos, V.E. Physiological and functional failure in chronic obstructive pulmonary disease, congestive heart failure and cancer: A debilitating intersection of sarcopenia, cachexia and breathlessness. Curr. Opin. Support. Palliat. Care 2016, 10, 236–241. [Google Scholar] [CrossRef]
- Coats, A.J. Origin of symptoms in patients with cachexia with special reference to weakness and shortness of breath. Int. J. Cardiol. 2002, 85, 133–139. [Google Scholar] [CrossRef]


| Control Subjects (n = 17) | ncCHF Patients (n = 19) | cCHF Patients (n = 18) | cCHF vs. ncCHF Patients p-Value | ANOVA-p | |
|---|---|---|---|---|---|
| Number (female) | 11(6) | 14 (5) | 15 (3) | 0.5 | |
| NYHA class | 2.3 ± 0.5 | 2.9 ± 0.3 | 0.0003 | ||
| Ejection Fraction (%) | 70± 7 | 31 ± 7 * | 27 ± 7 * | 0.1 | <0.0001 |
| Ischaemic aetiology | 13/19 | 13/18 | 0.9 | ||
| Age (years) | 63.4 ± 5.7 | 67.6 ± 8.8 | 66.9 ± 10.2 | 0.8 | |
| Weight (kg) | 80.8 ± 14.5 | 93.9 ± 22.7 * | 71.8 ± 9.2 | 0.0003 | 0.001 |
| Height (cm) | 173.4 ± 9.7 | 175.6 ± 9.6 | 171.6 ± 6.0 | 0.3 | |
| BMI (kg/m2) | 27.5 ± 4.6 | 30.2 ± 5.0 | 24.3 ± 2.5 * | 0.0002 | 0.0008 |
| Fat mass/height [kg/m] | 14.9 ± 6.6 | 17.2 ± 4.9 * | 10.8 ± 4.5 | 0.002 | 0.0077 |
| Fat free mass/height [kg/m] | 30.0 ± 5.1 | 34.4 ± 6.6 * | 29.5 ± 3.0 | 0.008 | 0.01 |
| Bone mass/height [kg/m] | 1.6 ± 0.2 | 1.6 ± 0.2 | 1.6 ± 0.2 | 0.97 | |
| Peak VO2 (mL/min/kg body weight) | 24.9 ± 7.1 | 14.7 ± 4.6 * | 13.5 ± 3.2 * | 0.5 | <0.0001 |
| Mid regional pro atrial natriuretic peptide (pmol/L) | 73 ± 32 | 165 ± 102 * | 341 ± 165 * | p < 0.0001 | <0.0001 |
| Mid regional pro Adrenomedullin (nmol/L) | 0.5 ± 0.1 | 0.9 ± 0.5 * | 1.1 ± 0.7 * | 0.08 | <0.0001 |
| White Blood Cells (×109/L) | 6.6 ± 1.2 | 7.3 ± 1.6 | 7.0 ± 1.9 | 0.4 | |
| High sensitive C-reactive Protein (µg/mL) | 2.4 ± 3.6 | 2.9 ± 2.7 | 6.5 ± 5.8 * | p < 0.05 | <0.006 |
| Beta blocker | 84% | 94% | 0.3 | ||
| Angiotensin converting enzyme (ACE) inhibitor | 74% | 56% | 0.4 | ||
| AT1 receptor blocker (ARB) | 32% | 39% | 0.6 | ||
| Mineralocorticoid receptor antagonist | 53% | 83% | 0.08 | ||
| Loop diuretic | 63% | 89% | 0.2 | ||
| Statin | 74% | 83% | 0.7 |
| Gene Expression [RU +] | Control Subjects (n = 17) | All CHF Patients (n = 36) | ncCHF Patients (n = 19) | cCHF Patients (n = 18) | p-Value cCHF vs. ncCHF | ANOVA-p |
|---|---|---|---|---|---|---|
| STAT1 | 0.97 ± 0.76 | 1.30 ± 1.13 | 0.96 ± 0.90 | 1.67 ± 1.26 * | <0.03 | <0.05 |
| STAT3 | 3.70 ± 2.49 | 4.40 ± 3.14 | 3.63 ± 3.03 | 5.20 ± 3.12 | <0.05 | 0.07 |
| SOCS1 | 0.47 ± 0.30 | 0.88 ± 0.68 | 0.50 ± 0.32 | 1.22 ± 0.73 * | <0.0003 | <0.0002 |
| SOCS3 | 1.0 ± 0.92 | 1.80 ± 2.80 | 0.90 ±1.46 | 2.51 ± 3.51 * | <0.01 | <0.03 |
| TNF | 0.12 ± 0.10 | 0.20 ± 0.24 | 0.12 ± 0.14 | 0.28 ± 0.30 * | <0.004 | <0.009 |
| IL10 | 0.002 ± 0.004 | 0.003 ± 0.005 | 0.002 ± 0.002 | 0.005 ± 0.006 * | <0.008 | <0.02 |
| TGFB1 | 88.9 ± 63.8 | 85.6 ± 60.6 | 85.4 ± 74.3 | 83.4 ± 47.7 | 0.2 | 0.4 |
| Control Subjects (n = 12) | All CHF Patients (19) | ncCHF Patients (n = 14) | cCHF Patients (n = 5) | All CHF Patients vs. Controls p-Value | |
|---|---|---|---|---|---|
| Stimulated tumor necrosis factor per blood cells [pg × 10−6] | 2.26 ± 1.18 | 4.41 ± 2.34 | 4.31 ± 2.30 | 4.64 ± 2.69 | 0.007 |
| Stimulated interleukin 10 per blood cells [pg × 10−6] | 0.17 ± 0.12 | 0.38 ± 0.28 | 0.35 ± 0.24 | 0.43 ± 0.38 | 0.02 |
| White blood Cells (×109/L) | 6.7 ± 1.1 | 7.6 ± 1.6 | 7.5 ± 1.6 | 8.0 ± 1.6 | 0.07 |
| Red blood cells (×109/L) | 4.5 ± 0.4 | 4.4 ± 0.5 | 4.4 ± 0.5 | 4.2 ± 0.5 | 0.6 |
| Blood thrombocytes (×109/L) | 228 ± 39 | 222 ± 85 | 232 ± 97 | 199 ± 48 | 0.6 |
| Number (female) | 6 (6) | 15 (4) | 10 (4) | 5 (0) | 0.13 |
| Age (years) | 66 ± 4 | 68 ± 9 | 67 ± 9 | 72 ± 10 | 0.3 |
| NYHA class | 2.3 ± 0.5 | 2.1 ± 0.4 | 2.8 ± 0.4 | ||
| Ejection Fraction (%) | 71 ± 7 | 31 ± 7 | 32 ± 6 | 28 ± 8 | |
| Ischaemic aetiology | 14/19 | 10/14 | 4/5 | ||
| BMI (kg/m2) | 28 ± 5 | 28 ± 5 | 29 ± 5 | 24 ± 2 | 0.8 |
| Fat mass/height [kg/m] | 16.4 ± 6.3 | 14.7 ± 5.7 | 16.5 ± 5.0 | 9.8 ± 2.6 | 0.4 |
| Fat-free mass/height [kg/m] | 29.2 ± 5.4 | 32.6 ± 6.0 | 33.6 ± 6.7 | 29.8 ± 1.9 | 0.13 |
| Peak VO2 (mL/min/kg body weight) | 22.6 ± 4.2 | 15.0 ± 4.5 | 15.9 ± 4.3 | 12.1 ± 4.2 | <0.0001 |
| Mid regional pro atrial natriuretic peptide (pmol/L) | 75 ± 35 | 176 ± 113 | 130 ± 68 | 304 ± 121 | 0.006 |
| Mid regional pro Adrenomedullin (nmol/L) | 0.5 ± 0.8 | 0.8 ± 0.3 | 0.7 ± 0.3 | 1.0 ± 0.3 | 0.005 |
| High sensitive C-reactive Protein (µg/mL) | 3.3 ± 4.0 | 3.7 ± 5.4 | 2.1 ± 2.0 | 8.2 ± 9.3 | 0.8 |
| Beta blocker | 89% | 86% | 100% | ||
| Angiotensin converting enzyme (ACE) inhibitor | 74% | 71% | 80% | ||
| AT1 receptor blocker (ARB) | 32% | 36% | 20% | ||
| Mineralocorticoid receptor antagonist | 68% | 64% | 80% | ||
| Loop diuretic | 58% | 50% | 80% | ||
| Statin | 74% | 71% | 80% |
| Gene Expression | |||||
|---|---|---|---|---|---|
| STAT1 | STAT3 | SOCS1 | SOCS3 | ||
| Controls | blood hsCRP levels | p = 0.4, r = 0.1 | p = 0.6, r = 0.1 | p = 0.5, r = 0.2 | p = 0.6, r = 0.2 |
| blood IL-6 levels | p = 0.5, r = 0.2 | p = 0.6, r = 0.2 | p = 1.0, r = 0.01 | p = 0.4, r = 0.3 | |
| TNF expression | p = 0.0005, r = 0.8 | p < 0.0001, r = 0.9 | p < 0.0001, r = 0.9 | p < 0.0001, r = 0.9 | |
| IL-10 expression | p = 0.1, r = 0.4 | p = 0.051, r = 0.5 | p = 0.02, r = 0.6 | p < 0.0001, r = 0.9 | |
| TGFβ1 expression | p < 0.0001, r = 0.8 | p < 0.0001, r = 1.0 | p < 0.0001, r = 0.8 | p < 0.0001, r = 0.9 | |
| ncCHF | blood hsCRP levels | p = 0.8, r = 0.1 | p = 0.8, r = 0.1 | p = 0.14, r = 0.4 | p = 0.5, r = 0.2 |
| blood IL-6 levels | p = 1.0, r = 0.01 | p = 0.7, r = 0.1 | p = 0.2, r = 0.4 | p = 0.6, r = 0.2 | |
| TNF expression | p < 0.0001, r = 0.9 | p = 0.0002, r = 0.8 | p < 0.0001, r = 0.8 | p < 0.0001, r = 0.9 | |
| IL-10 expression | p = 0.054, r = 0.5 | p = 0.1, r = 0.4 | p = 0.2, r = 0.3 | p < 0.0001, r = 0.9 | |
| TGFβ1 expression | p = 0.001, r = 0.7 | p = 0.0002, r = 0.7 | p = 0.007, r = 0.6 | p = 0.0002, r = 0.7 | |
| cCHF | blood hsCRP levels | p = 0.5, r = 0.2 | p = 0.3, r = 0.3 | p = 0.4, r = 0.3 | p = 0.8, r = 0.1 |
| blood IL-6 levels | p = 0.2, r = 0.5 | p = 0.4, r = 0.3 | p = 0.3, r = 0.4 | p = 0.1, r = 0.6 | |
| TNF expression | p = 0.4, r = 0.2 | p = 0.01, r = 0.6 | p = 0.4, r = 0.2 | p = 0.6, r = 0.1 | |
| IL-10 expression | p = 0.5, r = 0.2 | p = 0.5, r = 0.2 | p = 0.5, r = 0.2 | p = 0.6, r = 0.1 | |
| TGFβ1 expression | p = 0.06, r = 0.5 | p < 0.0001, r = 0.9 | p = 0.4, r = 0.2 | p = 0.9, r = 0.03 | |
| Control Subjects (n = 12) | ncCHF Patients (n = 10) | cCHF Patients (n = 5) | cCHF vs. ncCHF Patients p-Value | |
|---|---|---|---|---|
| Proteasome 20S subunit beta 2 | 1.0 ± 0.6 | 0.7 ± 0.2 | 0.9 ± 0.2 | 0.086 |
| Calpain-1 catalytic subunit | 0.6 ± 0.4 | 0.7 ± 0.3 | 1.1 ± 0.5 | 0.086 |
| Solute carrier family 2 member 4 | 1.1 ± 0.6 | 0.8 ± 0.4 | 1.3 ± 0.4 | <0.03 |
Disclaimer/Publisher’s Note: The statements, opinions and data contained in all publications are solely those of the individual author(s) and contributor(s) and not of MDPI and/or the editor(s). MDPI and/or the editor(s) disclaim responsibility for any injury to people or property resulting from any ideas, methods, instructions or products referred to in the content. |
© 2024 by the authors. Licensee MDPI, Basel, Switzerland. This article is an open access article distributed under the terms and conditions of the Creative Commons Attribution (CC BY) license (https://creativecommons.org/licenses/by/4.0/).
Share and Cite
Sandek, A.; Gertler, C.; Valentova, M.; Jauert, N.; Wallbach, M.; Doehner, W.; von Haehling, S.; Anker, S.D.; Fielitz, J.; Volk, H.-D. Increased Expression of Proinflammatory Genes in Peripheral Blood Cells Is Associated with Cardiac Cachexia in Patients with Heart Failure with Reduced Ejection Fraction. J. Clin. Med. 2024, 13, 733. https://doi.org/10.3390/jcm13030733
Sandek A, Gertler C, Valentova M, Jauert N, Wallbach M, Doehner W, von Haehling S, Anker SD, Fielitz J, Volk H-D. Increased Expression of Proinflammatory Genes in Peripheral Blood Cells Is Associated with Cardiac Cachexia in Patients with Heart Failure with Reduced Ejection Fraction. Journal of Clinical Medicine. 2024; 13(3):733. https://doi.org/10.3390/jcm13030733
Chicago/Turabian StyleSandek, Anja, Christoph Gertler, Miroslava Valentova, Nadja Jauert, Manuel Wallbach, Wolfram Doehner, Stephan von Haehling, Stefan D. Anker, Jens Fielitz, and Hans-Dieter Volk. 2024. "Increased Expression of Proinflammatory Genes in Peripheral Blood Cells Is Associated with Cardiac Cachexia in Patients with Heart Failure with Reduced Ejection Fraction" Journal of Clinical Medicine 13, no. 3: 733. https://doi.org/10.3390/jcm13030733
APA StyleSandek, A., Gertler, C., Valentova, M., Jauert, N., Wallbach, M., Doehner, W., von Haehling, S., Anker, S. D., Fielitz, J., & Volk, H.-D. (2024). Increased Expression of Proinflammatory Genes in Peripheral Blood Cells Is Associated with Cardiac Cachexia in Patients with Heart Failure with Reduced Ejection Fraction. Journal of Clinical Medicine, 13(3), 733. https://doi.org/10.3390/jcm13030733