
Socioeconomic Status and Clinical Outcomes in Chronic Kidney Disease: Bootstrap Validation of a Simple Indicator

 and
and
Abstract
1. Introduction
2. Materials and Methods
2.1. Patients
2.2. Follow-Up and Study Outcome
2.3. Laboratory Measurements
2.4. Office Blood Pressure (BP) Measurements
2.5. Quality of Life, Income, and Educational Level
2.6. Statistical Analysis
3. Results
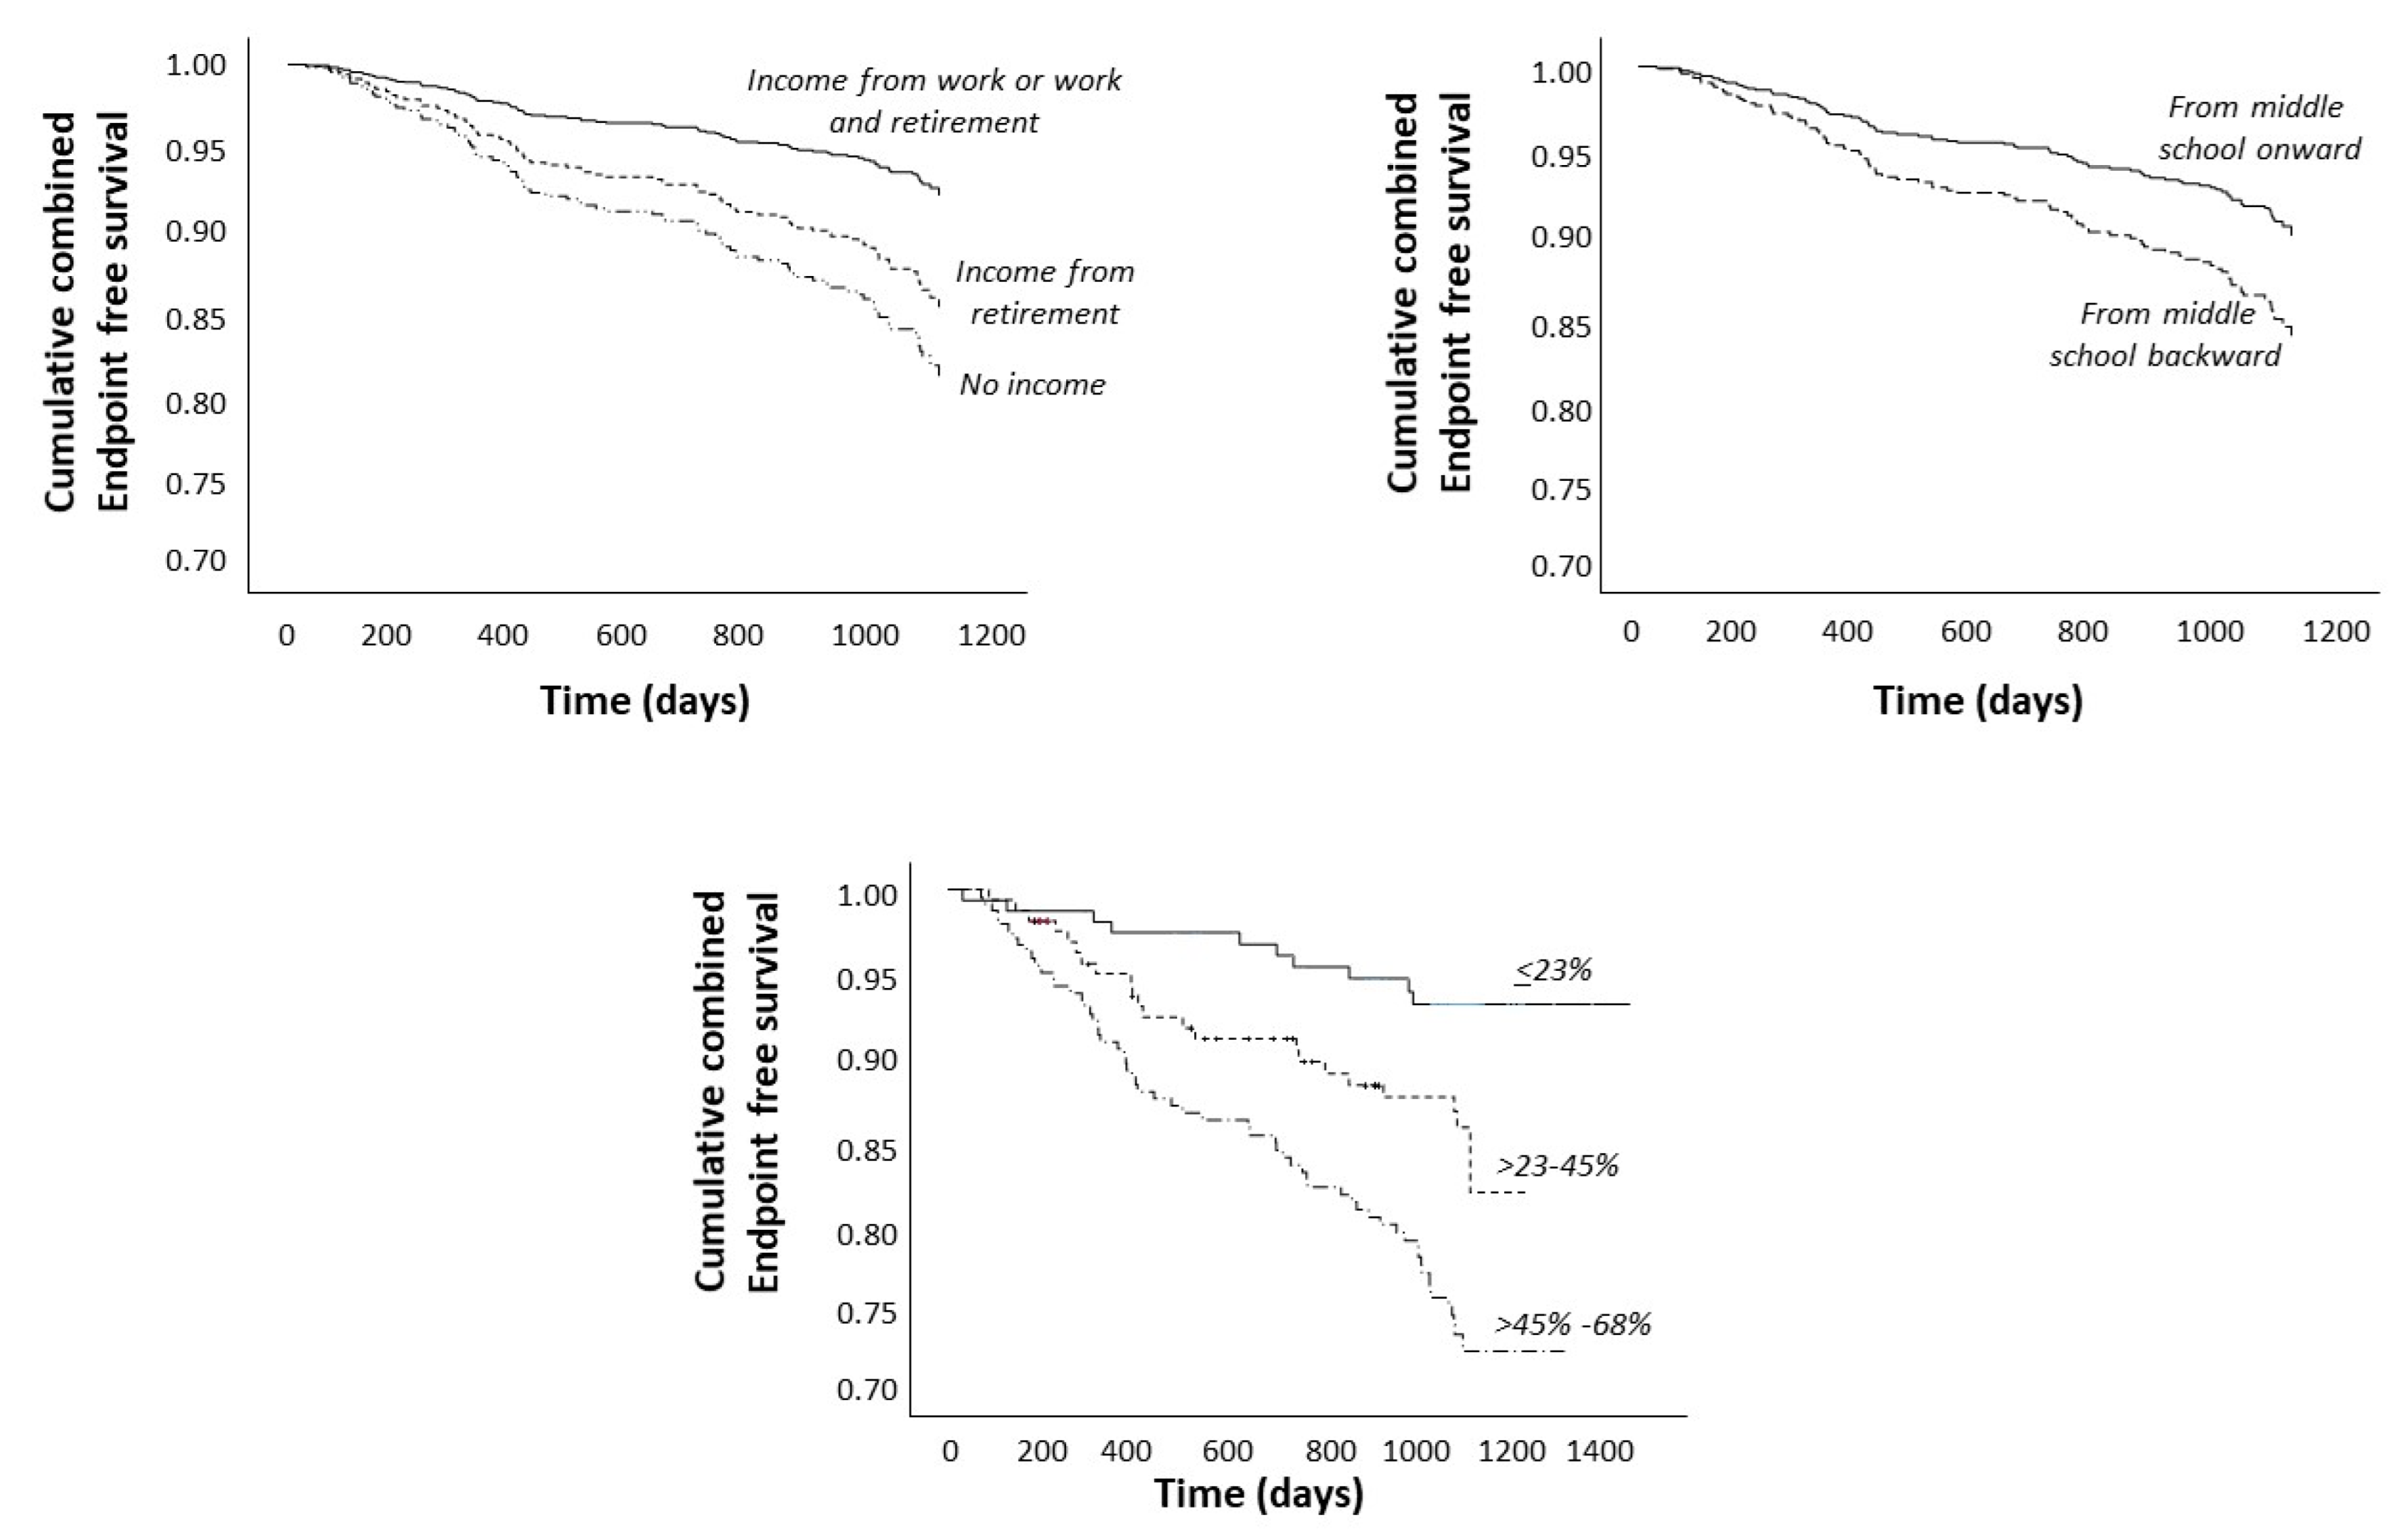
Survival Analysis
4. Discussion
Supplementary Materials
Author Contributions
Funding
Institutional Review Board Statement
Informed Consent Statement
Data Availability Statement
Conflicts of Interest
References
- Jager, K.J.; Kovesdy, C.; Langham, R.; Rosenberg, M.; Jha, V.; Zoccali, C. A Single Number for Advocacy and Communication—Worldwide More than 850 Million Individuals Have Kidney Diseases. Kidney Int. 2019, 96, 1048–1050. [Google Scholar] [CrossRef] [PubMed]
- de Mestral, C.; Stringhini, S. Socioeconomic Status and Cardiovascular Disease: An Update. Curr. Cardiol. Rep. 2017, 19, 115. [Google Scholar] [CrossRef] [PubMed]
- Sen, S. Socioeconomic Status and Mental Health: What Is the Causal Relationship? Acta Psychiatr. Scand. 2012, 125, 187–188. [Google Scholar] [CrossRef] [PubMed]
- Khodayari Moez, E.; Maximova, K.; Sim, S.; Senthilselvan, A.; Pabayo, R. Developing a Socioeconomic Status Index for Chronic Disease Prevention Research in Canada. Int. J. Environ. Res. Public Health 2022, 19, 7800. [Google Scholar] [CrossRef] [PubMed]
- Zhang, Y.-B.; Chen, C.; Pan, X.-F.; Guo, J.; Li, Y.; Franco, O.H.; Liu, G.; Pan, A. Associations of Healthy Lifestyle and Socioeconomic Status with Mortality and Incident Cardiovascular Disease: Two Prospective Cohort Studies. BMJ 2021, 373, n604. [Google Scholar] [CrossRef] [PubMed]
- Ward, M.M. Socioeconomic Status and the Incidence of ESRD. Am. J. Kidney Dis. 2008, 51, 563–572. [Google Scholar] [CrossRef] [PubMed]
- Patzer, R.E.; McClellan, W.M. Influence of Race, Ethnicity and Socioeconomic Status on Kidney Disease. Nat. Rev. Nephrol. 2012, 8, 533–541. [Google Scholar] [CrossRef] [PubMed]
- Ng, M.S.N.; Chan, D.N.S.; Cheng, Q.; Miaskowski, C.; So, W.K.W. Association between Financial Hardship and Symptom Burden in Patients Receiving Maintenance Dialysis: A Systematic Review. Int. J. Environ. Res. Public Health 2021, 18, 9541. [Google Scholar] [CrossRef] [PubMed]
- Morton, R.L.; Schlackow, I.; Staplin, N.; Gray, A.; Cass, A.; Haynes, R.; Emberson, J.; Herrington, W.; Landray, M.J.; Baigent, C.; et al. Impact of Educational Attainment on Health Outcomes in Moderate to Severe CKD. Am. J. Kidney Dis. 2016, 67, 31–39. [Google Scholar] [CrossRef]
- Braveman, P.A.; Cubbin, C.; Egerter, S.; Chideya, S.; Marchi, K.S.; Metzler, M.; Posner, S. Socioeconomic Status in Health Research. JAMA 2005, 294, 2879. [Google Scholar] [CrossRef]
- Zeng, X.; Liu, J.; Tao, S.; Hong, H.G.; Li, Y.; Fu, P. Associations between Socioeconomic Status and Chronic Kidney Disease: A Meta-Analysis. J. Epidemiol. Community Health 2018, 72, 270–279. [Google Scholar] [CrossRef] [PubMed]
- Bello, A.K.; Peters, J.; Rigby, J.; Rahman, A.A.; El Nahas, M. Socioeconomic Status and Chronic Kidney Disease at Presentation to a Renal Service in the United Kingdom. Clin. J. Am. Soc. Nephrol. 2008, 3, 1316–1323. [Google Scholar] [CrossRef] [PubMed]
- Lindberg, M.H.; Chen, G.; Olsen, J.A.; Abelsen, B. Combining Education and Income into a Socioeconomic Position Score for Use in Studies of Health Inequalities. BMC Public Health 2022, 22, 969. [Google Scholar] [CrossRef] [PubMed]
- Zoccali, C.; Leonardis, D.; Enia, G.; Postorino, M.; Mallamaci, F. The MAURO Study: Multiple Intervention and Audit in Renal Diseases to Optimize Care. J. Nephrol. 2008, 21, 20–22. [Google Scholar] [PubMed]
- Leonardis, D.; Mallamaci, F.; Enia, G.; Postorino, M.; Tripepi, G.; Zoccali, C. The MAURO Study: Baseline Characteristics and Compliance with Guidelines Targets. J. Nephrol. 2012, 25, 1081–1090. [Google Scholar] [CrossRef] [PubMed]
- Levey, A.S.; Bosch, J.P.; Lewis, J.B.; Greene, T.; Rogers, N.; Roth, D. A More Accurate Method to Estimate Glomerular Filtration Rate from Serum Creatinine: A New Prediction Equation. Ann. Intern. Med. 1999, 130, 461–470. [Google Scholar] [CrossRef]
- Mapes, D.L.; Bragg-Gresham, J.L.; Bommer, J.; Fukuhara, S.; McKevitt, P.; Wikström, B.; Lopes, A.A. Health-Related Quality of Life in the Dialysis Outcomes and Practice Patterns Study (DOPPS). Am. J. Kidney Dis. 2004, 44, 54–60. [Google Scholar] [CrossRef] [PubMed]
- Diaz-Buxo, J.A.; Lowrie, E.G.; Lew, N.L.; Zhang, H.; Lazarus, J.M. Quality-of-Life Evaluation Using Short Form 36: Comparison in Hemodialysis and Peritoneal Dialysis Patients. Am. J. Kidney Dis. 2000, 35, 293–300. [Google Scholar] [CrossRef]
- Klersy, C.; Callegari, A.; Giorgi, I.; Sepe, V.; Efficace, E.; Politi, P. Italian Translation, Cultural Adaptation and Validation of KDQOL-SF, Version 1.3, in Patients with Severe Renal Failure. J. Nephrol. 2007, 20, 43–51. [Google Scholar]
- Davison, A.C.; Hinkley, D.V. Bootstrap Methods and Their Application; Cambridge University Press: Cambridge, UK, 1997; ISBN 9780521573917. [Google Scholar]
- Zoccali, C.; Mallamaci, F.; Adamczak, M.; De Oliveira, R.B.; Massy, Z.A.; Sarafidis, P.; Agarwal, R.; Mark, P.B.; Kotanko, P.; Ferro, C.J.; et al. Cardiovascular Complications in Chronic Kidney Disease: A Review from the European Renal and Cardiovascular Medicine Working Group of the European Renal Association. Cardiovasc. Res. 2023, 119, 2017–2032. [Google Scholar] [CrossRef]
- Pollack, C.E.; Griffin, B.A.; Lynch, J. Housing Affordability and Health Among Homeowners and Renters. Am. J. Prev. Med. 2010, 39, 515–521. [Google Scholar] [CrossRef] [PubMed]
- Stringhini, S.; Dugravot, A.; Shipley, M.; Goldberg, M.; Zins, M.; Kivimäki, M.; Marmot, M.; Sabia, S.; Singh-Manoux, A. Health Behaviours, Socioeconomic Status, and Mortality: Further Analyses of the British Whitehall II and the French GAZEL Prospective Cohorts. PLoS Med. 2011, 8, e1000419. [Google Scholar] [CrossRef] [PubMed]
- Adler, N.E.; Boyce, T.; Chesney, M.A.; Cohen, S.; Folkman, S.; Kahn, R.L.; Syme, S.L. Socioeconomic Status and Health: The Challenge of the Gradient. Am. Psychol. 1994, 49, 15–24. [Google Scholar] [CrossRef] [PubMed]

| No Declared Income (n = 112) | Declared Income from Retirement (n = 293) | Declared Income from Work or Work plus Retirement (n = 156) | p-Value | |
|---|---|---|---|---|
| Age, year | 57 ± 13 | 67 ± 7 | 53 ± 11 | <0.001 |
| Male gender, % | 23% | 66% | 78% | <0.001 |
| Educational level, % | ||||
| ≤primary school | 53% | 62% | 24% | <0.001 |
| ≥middle school | 47% | 38% | 76% | |
| Homeownership, (%) | 90% | 90% | 92% | 0.660 |
| Average number of cars per capita, % | ||||
| No car | 13% | 18% | 3% | <0.001 |
| Less than one | 81% | 70% | 81% | |
| One or more | 5% | 12% | 15% | |
| Alcohol use, % | ||||
| No | 87% | 63% | 65% | <0.001 |
| Current | 13% | 30% | 27% | |
| Former | 1% | 7% | 8% | |
| Smoking, % | 27% | 53% | 58% | <0.001 |
| Diabetes, % | 27% | 42% | 20% | <0.001 |
| Hemoglobin, g/dL | 12.6 ± 2 | 12.9 ± 2 | 13.2 ± 2 | 0.027 |
| Total cholesterol, mg/dL | 192 ± 43 | 187 ± 45 | 187 ± 43 | 0.679 |
| Systolic blood pressure, mmHg | 132 ± 19 | 136 ± 17 | 129 ± 18 | <0.001 |
| CRP high sensitivity, mg/L | 2.1 (0.9–5.9) | 2.5 (1.1–5.4) | 1.9 (0.9–4) | 0.036 |
| Phosphate mg/dL | 3.9 ± 0.7 | 3.6 ± 0.8 | 3.7 ± 0.7 | 0.001 |
| eGFR, mil/min/1.73 m2 | 33.4 (25.1–43.6) | 35.8 (26.3–45.2) | 35.8 (25.7–47.6) | 0.321 |
| Mental component score, MCS | 42 (33.2–51.4) | 45.6 (34–53.2) | 46.5 (37.2–54.1) | 0.041 |
| Physical component score, PCS | 45.1 (34.7–51.4) | 42 (33.9–48.9) | 46.2 (39.7–52.3) | <0.001 |
| Hazard Ratio, 95% CI, and p Value | ||||
|---|---|---|---|---|
| Crude Model | Model 1 | Model 2 | Model 3 | |
| Declared income source | ||||
| Income from work or work and retirement | 1 * | 1 * | 1 * | 1 * |
| With income from retirement | 3.85 (2.13–9.53). | 2.07 (0.98–5.21) | 1.96 (0.93–4.87) | 2.01 (1.02–5.44) |
| p = 0.002 | p = 0.070 | p = 0.078 | p = 0.066 | |
| With no income | 2.50 (1.18–9.53). | 2.89 (1.18–7.79) | 2.8 (1.16–8.3) | 2.72 (1.16–7.72) |
| p = 0.016 | 0.015 | p = 0.019 | p = 0.020 | |
| Age, year | 1.07 (1.03–1.11) | 1.07 (1.03–1.12) | 1.07 (1.03–1.12) | |
| p = 0.001 | p = 0.002 | p = 0.001 | ||
| Male sex | 2.3 (1.2–4.66) | 2.19 (1.14–4.45) | 3.13 (1.51–6.53) | |
| p = 0.011 | p = 0.020 | p = 0.002 | ||
| From middle school education onward to lower or no education | 1.65 (1.08–2.67) | 1.69 (1.12–2.81) | 1.67 (1.04–2.95) | |
| p = 0.023 | p = 0.018 | p = 0.034 | ||
| Smoking, yes | 1.21 (0.7–2.22) | 1.25 (0.7–2.41) | 1.19 (0.68–2.43) | |
| p = 0.480 | p = 0.483 | p = 0.572 | ||
| Alcohol use | ||||
| No | 1 * | 1 * | 1 * | |
| Current | 0.57 (0.32–0.97) | 0.59 (0.31–0.99) | 0.55 (0.3–0.95) | |
| p = 0.041 | p = 0.059 | p = 0.027 | ||
| Former | 1.13 (0.51–2.1) | 1.11 (0.48–2.2) | 1.03 (0.41–2.15) | |
| p = 0.743 | p = 0.764 | p = 0.929 | ||
| Diabetes, yes | 1.32 (0.83–2.09) | 1.1 (0.68–1.81) | ||
| p = 0.227 | p = 0.690 | |||
| Hemoglobin, g/dL | 0.84 (0.73–0.98) | |||
| p = 0.023 | ||||
| Systolic blood pressure, mmHg | 1 (0.99–1.01) | |||
| p = 0.807 | ||||
| Phosphate mg/dL | 1.34 (0.99–1.84) | |||
| p = 0.050 | ||||
| Risk Score (%) | |
|---|---|
| High income and high educational level | 0 |
| High income and low educational level | 23 |
| Intermediate income and high educational level | 32 |
| Low income and high educational level | 45 |
| Intermediate income and low educational level | 55 |
| Low income and low educational level | 68 |
Disclaimer/Publisher’s Note: The statements, opinions and data contained in all publications are solely those of the individual author(s) and contributor(s) and not of MDPI and/or the editor(s). MDPI and/or the editor(s) disclaim responsibility for any injury to people or property resulting from any ideas, methods, instructions or products referred to in the content. |
© 2024 by the authors. Licensee MDPI, Basel, Switzerland. This article is an open access article distributed under the terms and conditions of the Creative Commons Attribution (CC BY) license (https://creativecommons.org/licenses/by/4.0/).
Share and Cite
Pitino, A.; D’Arrigo, G.; Marino, C.; Pizzini, P.; Caridi, G.; Mallamaci, F.; Tripepi, G.; Zoccali, C. Socioeconomic Status and Clinical Outcomes in Chronic Kidney Disease: Bootstrap Validation of a Simple Indicator. J. Clin. Med. 2024, 13, 3600. https://doi.org/10.3390/jcm13123600
Pitino A, D’Arrigo G, Marino C, Pizzini P, Caridi G, Mallamaci F, Tripepi G, Zoccali C. Socioeconomic Status and Clinical Outcomes in Chronic Kidney Disease: Bootstrap Validation of a Simple Indicator. Journal of Clinical Medicine. 2024; 13(12):3600. https://doi.org/10.3390/jcm13123600
Chicago/Turabian StylePitino, Annalisa, Graziella D’Arrigo, Carmela Marino, Patrizia Pizzini, Graziella Caridi, Francesca Mallamaci, Giovanni Tripepi, and Carmine Zoccali. 2024. "Socioeconomic Status and Clinical Outcomes in Chronic Kidney Disease: Bootstrap Validation of a Simple Indicator" Journal of Clinical Medicine 13, no. 12: 3600. https://doi.org/10.3390/jcm13123600
APA StylePitino, A., D’Arrigo, G., Marino, C., Pizzini, P., Caridi, G., Mallamaci, F., Tripepi, G., & Zoccali, C. (2024). Socioeconomic Status and Clinical Outcomes in Chronic Kidney Disease: Bootstrap Validation of a Simple Indicator. Journal of Clinical Medicine, 13(12), 3600. https://doi.org/10.3390/jcm13123600