
Albumin–Globulin Score Combined with Skeletal Muscle Index as a Novel Prognostic Marker for Hepatocellular Carcinoma Patients Undergoing Liver Transplantation

Abstract
1. Introduction
2. Methods
2.1. Study Population
2.2. Preoperative Evaluation
2.3. Diagnostic Criteria and Definitions
2.4. Nutritional and Inflammation Assessment
2.5. Follow-Up
2.6. Statistical Analysis
3. Results
3.1. Patient Baseline Characteristics
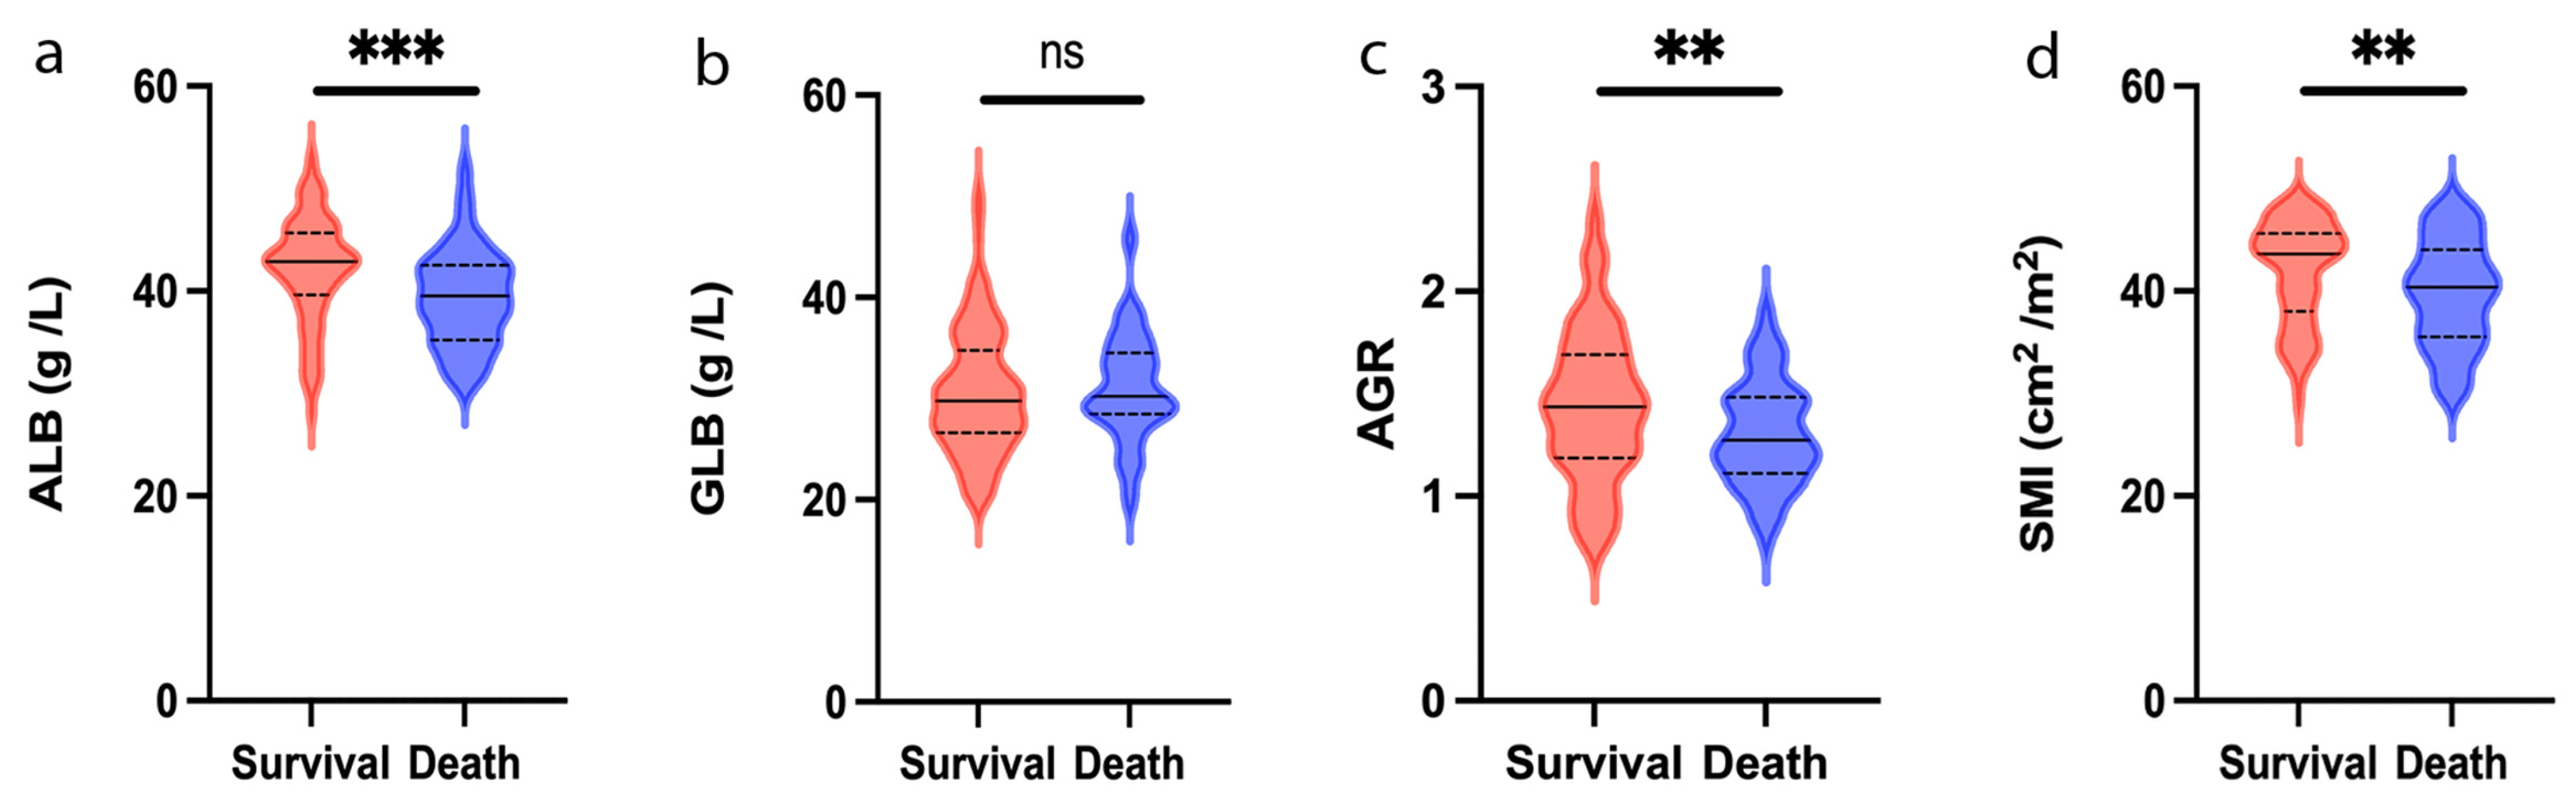
3.2. Clinical Characteristics Related to ALB, GLB and AGR
3.3. Outcome Analyses according to AGS
3.4. Outcome Analyses according to SMI
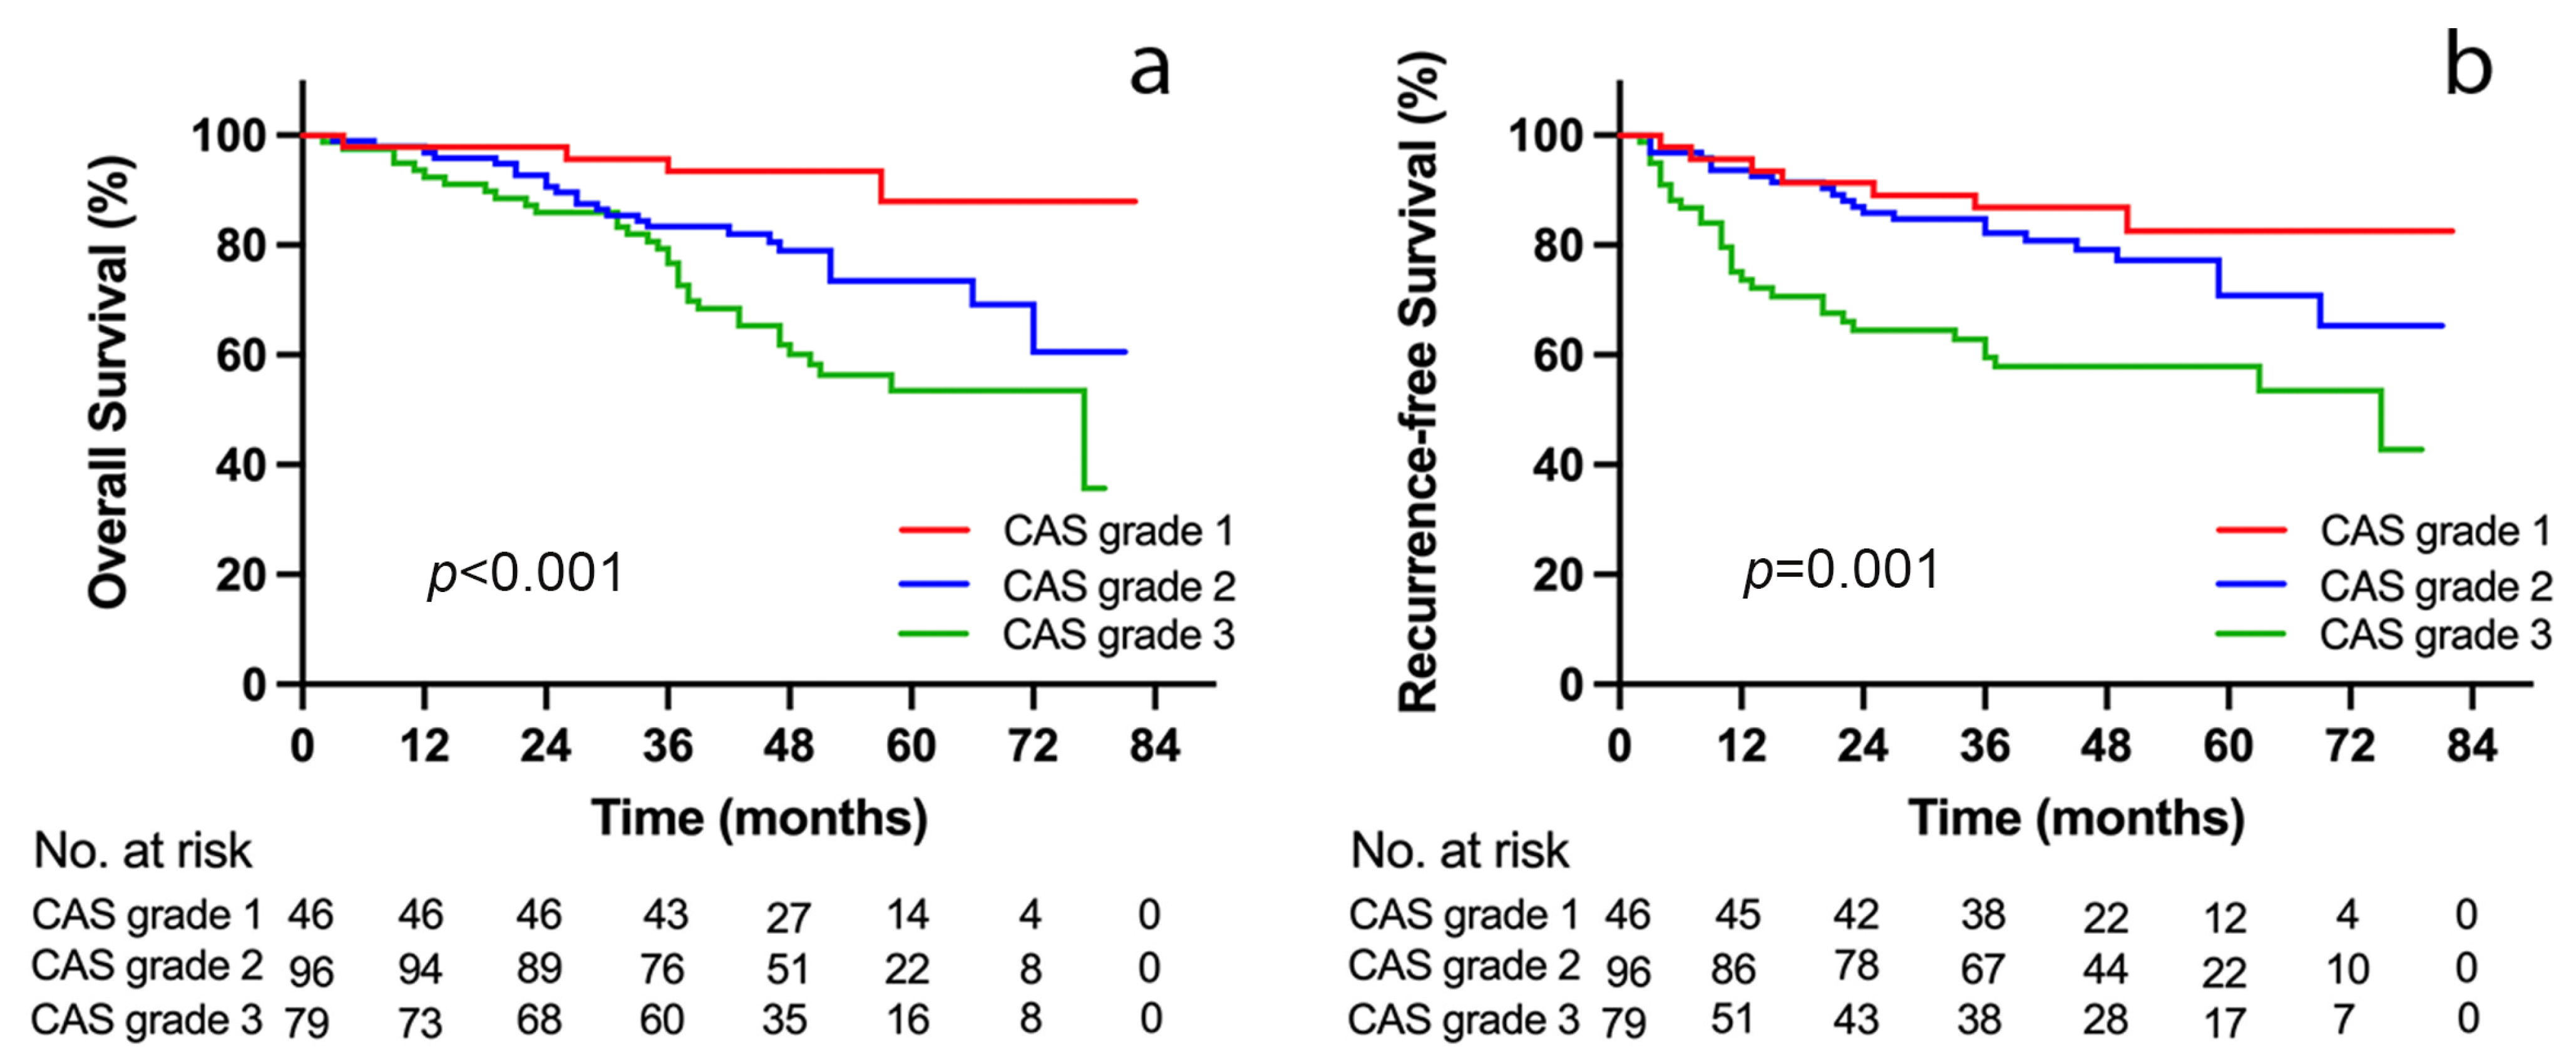
3.5. Outcome Analyses according to CAS Grade
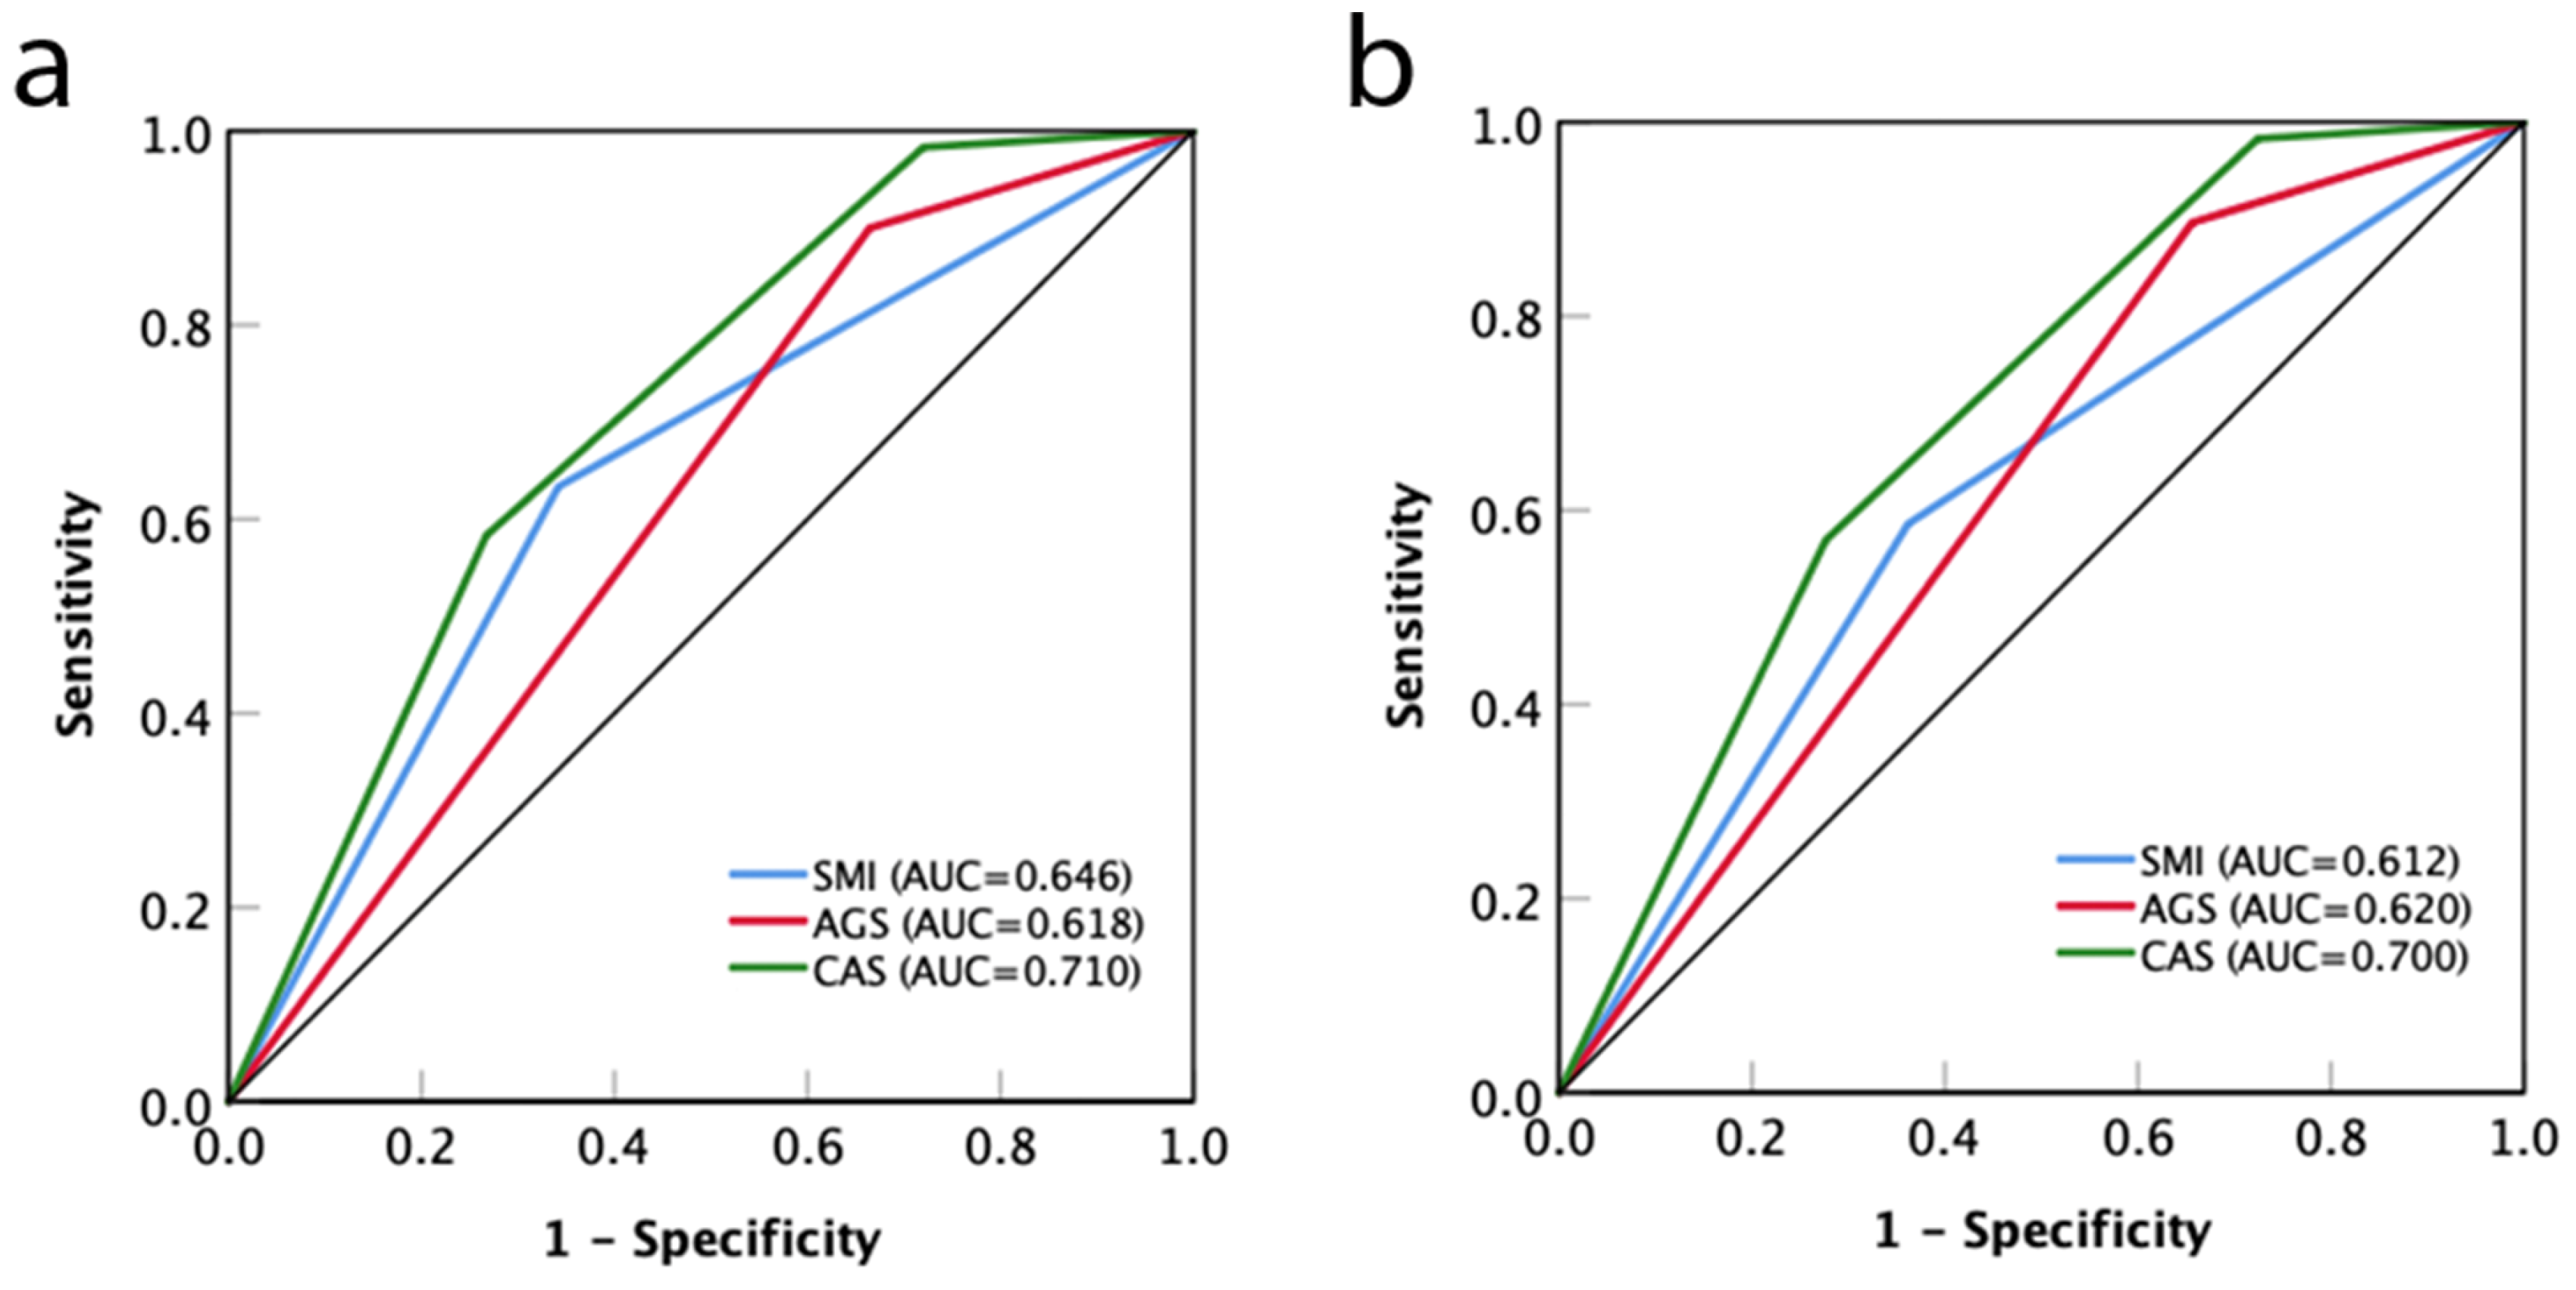
3.6. ROC Curve Analysis and risk Factor Analysis
4. Discussion
5. Conclusions
Author Contributions
Funding
Institutional Review Board Statement
Informed Consent Statement
Data Availability Statement
Conflicts of Interest
References
- Bertuccio, P.; Turati, F.; Carioli, G.; Rodriguez, T.; La Vecchia, C.; Malvezzi, M.; Negri, E. Global trends and predictions in hepatocellular carcinoma mortality. J. Hepatol. 2017, 67, 302–309. [Google Scholar] [CrossRef] [PubMed]
- Bruix, J.; Llovet, J.M. Major achievements in hepatocellular carcinoma. Lancet 2009, 373, 614–616. [Google Scholar] [CrossRef] [PubMed]
- Bruix, J.; Sherman, M. Management of hepatocellular carcinoma: An update. Hepatology 2011, 53, 1020–1022. [Google Scholar] [CrossRef] [PubMed]
- Xu, X.; Pu, X.; Jiang, L.; Huang, Y.; Yan, L.; Yang, J.; Wen, T.; Li, B.; Wu, H.; Wang, W. Living donor liver transplantation or hepatic resection combined with intraoperative radiofrequency ablation for Child-Pugh A hepatocellular carcinoma patient with Multifocal Tumours Meeting the University of California San Francisco (UCSF) criteria. J. Cancer Res. Clin. Oncol. 2021, 147, 607–618. [Google Scholar] [CrossRef] [PubMed]
- Boecker, J.; Czigany, Z.; Bednarsch, J.; Amygdalos, I.; Meister, F.; Santana, D.A.M.; Liu, W.J.; Strnad, P.; Neumann, U.P.; Lurje, G. Potential value and limitations of different clinical scoring systems in the assessment of short- and long-term outcome following orthotopic liver transplantation. PLoS ONE 2019, 14, e0214221. [Google Scholar] [CrossRef] [PubMed]
- de Martel, C.; Maucort-Boulch, D.; Plummer, M.; Franceschi, S. World-wide relative contribution of hepatitis B and C viruses in hepatocellular carcinoma. Hepatology 2015, 62, 1190–1200. [Google Scholar] [CrossRef] [PubMed]
- Zhuang, Z.; Li, Y.; Hong, Y.; Chen, L.; Qian, J.; Lin, J.; Chen, Q.; Qiu, Y.; Lin, L.; Shi, B.; et al. A novel prognostic score based on systemic inflammatory biomarkers for patients with oral squamous cell carcinoma. Oral Dis. 2022, 28, 631–638. [Google Scholar] [CrossRef] [PubMed]
- Diakos, C.I.; Charles, K.A.; McMillan, D.C.; Clarke, S.J. Cancer-related inflammation and treatment effectiveness. Lancet Oncol. 2014, 15, e493–e503. [Google Scholar] [CrossRef]
- McMillan, D.C. Systemic inflammation, nutritional status and survival in patients with cancer. Curr. Opin. Clin. Nutr. Metab. Care 2009, 12, 223–226. [Google Scholar] [CrossRef]
- Ha, Y.; Mohamed Ali, M.A.; Petersen, M.M.; Harmsen, W.S.; Therneau, T.M.; Lee, H.C.; Ryoo, B.Y.; Bampoh, S.; Valles, K.A.; Mady, M.; et al. Lymphocyte to monocyte ratio-based nomogram for predicting outcomes of hepatocellular carcinoma treated with sorafenib. Hepatol. Int. 2020, 14, 776–787. [Google Scholar] [CrossRef]
- Wang, Q.; Blank, S.; Fiel, M.I.; Kadri, H.; Luan, W.; Warren, L.; Zhu, A.; Deaderick, P.A.; Sarpel, U.; Labow, D.M.; et al. The Severity of Liver Fibrosis Influences the Prognostic Value of Inflammation-Based Scores in Hepatitis B-Associated Hepatocellular Carcinoma. Ann. Surg. Oncol. 2015, 22 (Suppl. S3), S1125–S1132. [Google Scholar] [CrossRef]
- Yildirim, M.; Yildiz, M.; Duman, E.; Goktas, S.; Kaya, V. Prognostic importance of the nutritional status and systemic inflammatory response in non-small cell lung cancer. J. BUON 2013, 18, 728–732. [Google Scholar] [PubMed]
- Chojkier, M. Inhibition of albumin synthesis in chronic diseases: Molecular mechanisms. J. Clin. Gastroenterol. 2005, 39, S143–S146. [Google Scholar] [CrossRef] [PubMed]
- Azab, B.; Kedia, S.; Shah, N.; Vonfrolio, S.; Lu, W.; Naboush, A.; Mohammed, F.; Bloom, S.W. The value of the pretreatment albumin/globulin ratio in predicting the long-term survival in colorectal cancer. Int. J. Color. Dis. 2013, 28, 1629–1636. [Google Scholar] [CrossRef] [PubMed]
- Guo, H.W.; Yuan, T.Z.; Chen, J.X.; Zheng, Y. Prognostic value of pretreatment albumin/globulin ratio in digestive system cancers: A meta-analysis. PLoS ONE 2018, 13, e0189839. [Google Scholar] [CrossRef] [PubMed]
- Li, H.; Dai, J.; Lan, T.; Liu, H.; Wang, J.; Cai, B.; Xu, L.; Yuan, K.; Wang, G.; Wu, H. Combination of albumin-globulin score and skeletal muscle index predicts long-term outcomes of intrahepatic cholangiocarcinoma patients after curative resection. Clin. Nutr. 2021, 40, 3891–3900. [Google Scholar] [CrossRef] [PubMed]
- Li, X.; Qin, S.; Sun, X.; Liu, D.; Zhang, B.; Xiao, G.; Ren, H. Prognostic Significance of Albumin-Globulin Score in Patients with Operable Non-Small-Cell Lung Cancer. Ann. Surg. Oncol. 2018, 25, 3647–3659. [Google Scholar] [CrossRef] [PubMed]
- Zhang, F.; Sun, P.; Wang, Z.Q.; Wang de, S.; Wang, Y.; Zhang, D.S.; Wang, F.H.; Fu, J.H.; Xu, R.H.; Li, Y.H. Low preoperative albumin-globulin score predicts favorable survival in esophageal squamous cell carcinoma. Oncotarget 2016, 7, 30550–30560. [Google Scholar] [CrossRef] [PubMed]
- Freeman, R.B., Jr.; Wiesner, R.H.; Harper, A.; McDiarmid, S.V.; Lake, J.; Edwards, E.; Merion, R.; Wolfe, R.; Turcotte, J.; Teperman, L. The new liver allocation system: Moving toward evidence-based transplantation policy. Liver Transpl. 2002, 8, 851–858. [Google Scholar] [CrossRef] [PubMed]
- Kamath, P.S.; Kim, W.R. The model for end-stage liver disease (MELD). Hepatology 2007, 45, 797–805. [Google Scholar] [CrossRef] [PubMed]
- van Vugt, J.L.A.; Alferink, L.J.M.; Buettner, S.; Gaspersz, M.P.; Bot, D.; Darwish Murad, S.; Feshtali, S.; van Ooijen, P.M.A.; Polak, W.G.; Porte, R.J.; et al. A model including sarcopenia surpasses the MELD score in predicting waiting list mortality in cirrhotic liver transplant candidates: A competing risk analysis in a national cohort. J. Hepatol. 2018, 68, 707–714. [Google Scholar] [CrossRef]
- Kim, W.R.; Biggins, S.W.; Kremers, W.K.; Wiesner, R.H.; Kamath, P.S.; Benson, J.T.; Edwards, E.; Therneau, T.M. Hyponatremia and mortality among patients on the liver-transplant waiting list. N. Engl. J. Med. 2008, 359, 1018–1026. [Google Scholar] [CrossRef]
- Myers, R.P.; Tandon, P.; Ney, M.; Meeberg, G.; Faris, P.; Shaheen, A.A.; Aspinall, A.I.; Burak, K.W. Validation of the five-variable Model for End-stage Liver Disease (5vMELD) for prediction of mortality on the liver transplant waiting list. Liver Int. 2014, 34, 1176–1183. [Google Scholar] [CrossRef]
- Cruz-Jentoft, A.J.; Baeyens, J.P.; Bauer, J.M.; Boirie, Y.; Cederholm, T.; Landi, F.; Martin, F.C.; Michel, J.P.; Rolland, Y.; Schneider, S.M.; et al. Sarcopenia: European consensus on definition and diagnosis: Report of the European Working Group on Sarcopenia in Older People. Age Ageing 2010, 39, 412–423. [Google Scholar] [CrossRef] [PubMed]
- Meza-Junco, J.; Montano-Loza, A.J.; Baracos, V.E.; Prado, C.M.; Bain, V.G.; Beaumont, C.; Esfandiari, N.; Lieffers, J.R.; Sawyer, M.B. Sarcopenia as a prognostic index of nutritional status in concurrent cirrhosis and hepatocellular carcinoma. J. Clin. Gastroenterol. 2013, 47, 861–870. [Google Scholar] [CrossRef]
- Englesbe, M.J.; Patel, S.P.; He, K.; Lynch, R.J.; Schaubel, D.E.; Harbaugh, C.; Holcombe, S.A.; Wang, S.C.; Segev, D.L.; Sonnenday, C.J. Sarcopenia and mortality after liver transplantation. J. Am. Coll. Surg. 2010, 211, 271–278. [Google Scholar] [CrossRef]
- DiMartini, A.; Cruz, R.J., Jr.; Dew, M.A.; Myaskovsky, L.; Goodpaster, B.; Fox, K.; Kim, K.H.; Fontes, P. Muscle mass predicts outcomes following liver transplantation. Liver Transpl. 2013, 19, 1172–1180. [Google Scholar] [CrossRef]
- Hamaguchi, Y.; Kaido, T.; Okumura, S.; Fujimoto, Y.; Ogawa, K.; Mori, A.; Hammad, A.; Tamai, Y.; Inagaki, N.; Uemoto, S. Impact of quality as well as quantity of skeletal muscle on outcomes after liver transplantation. Liver Transpl. 2014, 20, 1413–1419. [Google Scholar] [CrossRef] [PubMed]
- Krell, R.W.; Kaul, D.R.; Martin, A.R.; Englesbe, M.J.; Sonnenday, C.J.; Cai, S.; Malani, P.N. Association between sarcopenia and the risk of serious infection among adults undergoing liver transplantation. Liver Transpl. 2013, 19, 1396–1402. [Google Scholar] [CrossRef] [PubMed]
- Montano-Loza, A.J.; Meza-Junco, J.; Baracos, V.E.; Prado, C.M.; Ma, M.; Meeberg, G.; Beaumont, C.; Tandon, P.; Esfandiari, N.; Sawyer, M.B.; et al. Severe muscle depletion predicts postoperative length of stay but is not associated with survival after liver transplantation. Liver Transpl. 2014, 20, 1424. [Google Scholar] [CrossRef] [PubMed]
- Orman, E.S.; Ghabril, M.; Chalasani, N. Poor Performance Status Is Associated with Increased Mortality in Patients with Cirrhosis. Clin. Gastroenterol. Hepatol. 2016, 14, 1189–1195.e1181. [Google Scholar] [CrossRef] [PubMed]
- Feng, S.; Goodrich, N.P.; Bragg-Gresham, J.L.; Dykstra, D.M.; Punch, J.D.; DebRoy, M.A.; Greenstein, S.M.; Merion, R.M. Characteristics associated with liver graft failure: The concept of a donor risk index. Am. J. Transplant. 2006, 6, 783–790. [Google Scholar] [CrossRef] [PubMed]
- Clavien, P.A.; Barkun, J.; de Oliveira, M.L.; Vauthey, J.N.; Dindo, D.; Schulick, R.D.; de Santibañes, E.; Pekolj, J.; Slankamenac, K.; Bassi, C.; et al. The Clavien-Dindo classification of surgical complications: Five-year experience. Ann. Surg. 2009, 250, 187–196. [Google Scholar] [CrossRef] [PubMed]
- Slankamenac, K.; Graf, R.; Barkun, J.; Puhan, M.A.; Clavien, P.A. The comprehensive complication index: A novel continuous scale to measure surgical morbidity. Ann. Surg. 2013, 258, 1–7. [Google Scholar] [CrossRef]
- McMillan, D.C.; Watson, W.S.; O’Gorman, P.; Preston, T.; Scott, H.R.; McArdle, C.S. Albumin concentrations are primarily determined by the body cell mass and the systemic inflammatory response in cancer patients with weight loss. Nutr. Cancer 2001, 39, 210–213. [Google Scholar] [CrossRef]
- Toiyama, Y.; Yasuda, H.; Ohi, M.; Yoshiyama, S.; Araki, T.; Tanaka, K.; Inoue, Y.; Mohri, Y.; Kusunoki, M. Clinical impact of preoperative albumin to globulin ratio in gastric cancer patients with curative intent. Am. J. Surg. 2017, 213, 120–126. [Google Scholar] [CrossRef]
- Zhang, W.; Zhangyuan, G.; Wang, F.; Zhang, H.; Yu, D.; Wang, J.; Jin, K.; Yu, W.; Liu, Y.; Sun, B. High preoperative serum globulin in hepatocellular carcinoma is a risk factor for poor survival. J. Cancer 2019, 10, 3494–3500. [Google Scholar] [CrossRef]
- Wang, K.; Gu, Y.; Ni, J.; Zhang, H.; Xie, J.; Xu, T.; Geng, J.; Mao, W.; Peng, B. Combination of Total Psoas Index and Albumin-Globulin Score for the Prognosis Prediction of Bladder Cancer Patients After Radical Cystectomy: A Population-Based Study. Front. Oncol. 2021, 11, 724536. [Google Scholar] [CrossRef]
- Zeng, X.; Shi, Z.W.; Yu, J.J.; Wang, L.F.; Luo, Y.Y.; Jin, S.M.; Zhang, L.Y.; Tan, W.; Shi, P.M.; Yu, H.; et al. Sarcopenia as a prognostic predictor of liver cirrhosis: A multicentre study in China. J. Cachexia Sarcopenia Muscle 2021, 12, 1948–1958. [Google Scholar] [CrossRef]
- Carey, E.J.; Lai, J.C.; Sonnenday, C.; Tapper, E.B.; Tandon, P.; Duarte-Rojo, A.; Dunn, M.A.; Tsien, C.; Kallwitz, E.R.; Ng, V.; et al. A North American Expert Opinion Statement on Sarcopenia in Liver Transplantation. Hepatology 2019, 70, 1816–1829. [Google Scholar] [CrossRef]
- Nachit, M.; Leclercq, I.A. Emerging awareness on the importance of skeletal muscle in liver diseases: Time to dig deeper into mechanisms! Clin. Sci. 2019, 133, 465–481. [Google Scholar] [CrossRef]
- Kumar, A.; Davuluri, G.; Silva, R.N.E.; Engelen, M.; Ten Have, G.A.M.; Prayson, R.; Deutz, N.E.P.; Dasarathy, S. Ammonia lowering reverses sarcopenia of cirrhosis by restoring skeletal muscle proteostasis. Hepatology 2017, 65, 2045–2058. [Google Scholar] [CrossRef]
- Ebadi, M.; Tandon, P.; Moctezuma-Velazquez, C.; Ghosh, S.; Baracos, V.E.; Mazurak, V.C.; Montano-Loza, A.J. Low subcutaneous adiposity associates with higher mortality in female patients with cirrhosis. J. Hepatol. 2018, 69, 608–616. [Google Scholar] [CrossRef] [PubMed]
- Thuluvath, P.J.; Thuluvath, A.J.; Savva, Y. Karnofsky performance status before and after liver transplantation predicts graft and patient survival. J. Hepatol. 2018, 69, 818–825. [Google Scholar] [CrossRef] [PubMed]
- Tandon, P.; Ney, M.; Irwin, I.; Ma, M.M.; Gramlich, L.; Bain, V.G.; Esfandiari, N.; Baracos, V.; Montano-Loza, A.J.; Myers, R.P. Severe muscle depletion in patients on the liver transplant wait list: Its prevalence and independent prognostic value. Liver Transpl. 2012, 18, 1209–1216. [Google Scholar] [CrossRef]
- Hamaguchi, Y.; Kaido, T.; Okumura, S.; Kobayashi, A.; Shirai, H.; Yagi, S.; Hammad, A.; Okajima, H.; Uemoto, S. Proposal of Muscle-MELD Score, Including Muscularity, for Prediction of Mortality After Living Donor Liver Transplantation. Transplantation 2016, 100, 2416–2423. [Google Scholar] [CrossRef] [PubMed]


| Variables | Male (n = 187) | Female (n = 34) |
|---|---|---|
| Demographic and anthropometric characteristics in recipients | ||
| Age, years, median (range) | 50 (18–69) | 50 (21–69) |
| BMI, kg/m2, median (range) | 22.7 (13.9–33.6) | 22.4 (15.2–30.9) |
| SMI, cm2/m2, median (range) | 43.7 (32–49.3) | 35.6 (28.6–41.3) |
| KPS, %, median (range) | 80 (10–100) | 70 (10–90) |
| HBV, n (%) | 162 (86.6) | 26 (76.5) |
| HCV, n (%) | 9 (4.8) | 4 (11.8) |
| Alcohol, n (%) | 11 (5.9) | 1 (2.9) |
| Nonalcoholic steatohepatitis, n (%) | 2 (1.1) | 2 (5.9) |
| Diabetes mellitus, n (%) | 34 (18.2) | 4 (11.8) |
| Encephalopathy, n (%) | 30 (16.0) | 5 (14.7) |
| Ascites, n (%) | 51 (27.3) | 7 (20.6) |
| Demographic and anthropometric characteristics in donors | ||
| Age, years, median (range) | 43 (23–64) | 40 (24–60) |
| Male, n (%) | 114 (61.0) | 9 (26.5) |
| BMI, kg/m2, median (range) | 23.0 (16.6–31.5) | 21.9 (16.4–25.9) |
| DRI, median (range) | 1.3 (0.8–1.9) | 1.4 (0.7–1.9) |
| Laboratory parameters | ||
| ALT, IU/L, median (range) | 38 (6–298) | 31 (7–180) |
| AST, IU/L, median (range) | 41 (11–327) | 42.5 (13–524) |
| Platelet count, ×109/L, median (range) | 74 (23–418) | 71 (14–501) |
| Ammonia, μmol/L, median (range) | 58 (16–327) | 53.5 (24–169) |
| Total bilirubin, μmol/L, median (range) | 20.5 (8.4–731.7) | 24.9 (10.9–468.9) |
| INR, median (range) | 1.16 (0.83–2.07) | 1.19 (0.93–3.45) |
| Creatinine, μmol/L, median (range) | 71 (30–294) | 53 (36–216) |
| ALB, g/L, median (range) | 42.2 (28.6–53.2) | 42.0 (27.9–50) |
| GLB, g/L, median (range) | 29.8 (19.6–50.4) | 29.3 (20.5–42.3) |
| AGR, median (range) | 1.41 (0.73–2.37) | 1.43 (0.76–2.16) |
| AGS, n (%) | ||
| Low (0) | 49 (26.2) | 11 (32.4) |
| High (1/2) | 138 (73.8) | 23 (67.6) |
| NLR, median (range) | 3.06 (0.37–24.81) | 2.90 (0.71–9.99) |
| Child–Pugh score, median (range) | 6 (5–12) | 6 (5–12) |
| Child–Pugh A/B/C, n (%) | 119 (63.6)/52 (27.8)/16 (8.6) | 22 (64.7)/8 (23.5)/4 (11.8) |
| MELD score, median (range) | 7 (2–33) | 6 (2–27) |
| Serum AFP ≥ 400 ng/mL, n (%) | 34 (18.2) | 9 (26.5) |
| Intraoperative parameters | ||
| Cold ischaemic time, min, median (range) | 500 (405–755) | 505 (410–720) |
| Warm ischaemic time, min, median (range) | 50 (42–60) | 47 (40–57) |
| Red blood cell transfusions, unit, median (range) | 9 (0–23) | 7 (0–17) |
| Fresh frozen plasma transfusions, mL, median (range) | 1000 (0–2850) | 875 (0–3100) |
| Histological and gross features of tumors | ||
| Solitary tumor, n (%) | 116 (62.2) | 25 (73.5) |
| Largest tumor size, cm, median (range) | 3.2 (0.5–6.5) | 4 (1–6.5) |
| Total tumor size, cm, median (range) | 4 (0.5–8) | 4.75 (1–8) |
| Fibrosis, n (%) | ||
| Early (Ishak 1–2) | 6 (3.2) | 3 (8.8) |
| Intermediate (Ishak 3–4) | 27 (14.4) | 6 (17.6) |
| Advanced; cirrhosis (Ishak 5–6) | 154 (82.4) | 25 (73.5) |
| Differentiation of HCC, n (%) | ||
| Well | 10 (5.3) | 3 (8.8) |
| Moderate | 119 (63.6) | 21 (61.8) |
| Poor | 58 (31.0) | 10 (29.4) |
| Microvascular invasion, n (%) | 61 (32.6) | 9 (26.5) |
| Prognostic outcome | ||
| Postoperative infection, n (%) | 56 (29.9) | 9 (26.5) |
| 90 day CD ≥ 3 complications, n (%) | 82 (44) | 14 (41) |
| 90 day CCI, median (range) | 46.2 (8.7–100) | 44.3 (8.7–88.6) |
| 90 day mortality, n (%) | 2 (1.1) | 0 (0) |
| ICU stay, d, median (range) | 5 (1–65) | 4 (2–21) |
| Postoperative hospital stay, days, median (range) | 16 (8–98) | 16.5 (9–39) |
| Variables | AGS | SMI | ||||
|---|---|---|---|---|---|---|
| Low (0) | High (1/2) | p-Value | Low | High | p-Value | |
| Total patients | 60 | 161 | -- | 93 | 128 | -- |
| Recipient age, years, median (range) | 50.5 (18–69) | 50 (21–69) | 0.368 | 50 (21–68) | 49 (18–69) | 0.737 |
| Recipient gender, male, n (%) | 49 (81.7) | 138 (85.7) | 0.458 | 84 (90.3) | 103 (80.5) | 0.045 |
| Recipient BMI, kg/m2, median (range) | 22.6 (16.5–29.8) | 22.7 (13.9–33.6) | 0.921 | 21.8 (13.9–27.7) | 23.1 (15.2–33.6) | 0.071 |
| KPS, %, median (range) | 80 (10–100) | 70 (10–100) | 0.039 | 70 (10–100) | 80 (20–100) | <0.001 |
| Diabetes mellitus, n (%) | 8 (13.3) | 30 (18.6) | 0.353 | 16 (17.2) | 22 (17.2) | 0.997 |
| Encephalopathy, n (%) | 4 (6.7) | 31 (19.3) | 0.023 | 25 (26.9) | 10 (7.8) | <0.001 |
| Ascites, n (%) | 10 (16.7) | 48 (29.8) | 0.048 | 38 (40.9) | 20 (15.6) | <0.001 |
| Ammonia, μmol/L, median (range) | 51 (19–218) | 62 (16–327) | 0.112 | 69 (18–327) | 53 (16–218) | 0.044 |
| ALB, g/L, median (range) | 44.3 (36–53.2) | 40.6 (27.9–52) | <0.001 | 39.6 (27.9–52) | 43.2 (30.9–53.2) | <0.001 |
| GLB, g/L, median (range) | 25.9 (19.7–37.5) | 31.7 (19.6–50.4) | <0.001 | 30.9 (19.6–50.4) | 29.4 (19.7–48.5) | 0.087 |
| NLR, median (range) | 2.88 (0.53–24.81) | 3.23 (0.37–17.38) | 0.354 | 3.28 (0.65–24.81) | 2.95 (0.37–16.65) | 0.053 |
| Child–Pugh score, median (range) | 5 (5–11) | 6 (5–12) | 0.002 | 7 (5–12) | 5 (5–12) | <0.001 |
| MELD score, median (range) | 7 (2–27) | 8 (2–33) | 0.037 | 8 (2–33) | 6 (2–25) | 0.015 |
| Serum AFP ≥ 400 ng/mL, n (%) | 5 (8.3) | 38 (23.6) | 0.011 | 19 (20.4) | 24 (18.8) | 0.755 |
| Multiple tumor, n (%) | 17 (28.3) | 63 (39.1) | 0.137 | 31 (33.3) | 49 (38.3) | 0.450 |
| Total tumor size, cm, median (range) | 4 (0.5–8) | 4.3 (1–8) | 0.152 | 4.7 (0.5–8) | 4 (1–8) | 0.062 |
| Liver cirrhosis, n (%) | 49 (81.7) | 130 (80.7) | 0.525 | 78 (83.9) | 101 (78.9) | 0.353 |
| Differentiation of HCC, n (%) | ||||||
| Well | 5 (8.3) | 8 (5.0) | 0.344 | 6 (6.5) | 7 (5.5) | 0.759 |
| Moderate | 42 (70) | 98 (60.9) | 0.210 | 53 (57.0) | 87 (68.0) | 0.094 |
| Poor | 13 (21.7) | 55 (34.2) | 0.073 | 34 (36.6) | 34 (26.6) | 0.112 |
| Microvascular invasion, n (%) | 16 (26.7) | 54 (33.5) | 0.329 | 32 (34.4) | 38 (29.7) | 0.456 |
| Postoperative infection, n (%) | 10 (16.7) | 55 (34.2) | 0.011 | 38 (40.9) | 27 (21.1) | 0.001 |
| 90 day CCI, median (range) | 33.7 (8.7–88.6) | 56.1 (8.7–100) | <0.001 | 59.9 (26.2–100) | 42.4 (8.7–100) | <0.001 |
| ICU stay, days, median (range) | 4 (1–43) | 6 (1–65) | 0.039 | 7 (1–65) | 4 (1–24) | 0.003 |
| Variables | CAS | |||
|---|---|---|---|---|
| Grade 1 | Grade 2 | Grade 3 | p-Value | |
| Total patients | 46 | 96 | 79 | -- |
| Recipient age, years, median (range) | 52.5 (28–63) | 50 (21–69) | 49 (18–69) | 0.368 |
| Recipient gender, male, n (%) | 35 (76.1) | 79 (82.3) | 73 (92.4) | 0.036 |
| Recipient BMI, kg/m2, | 23.6 (19.8–29.8) | 22.7 (16.9–33.6) | 21.3 (13.9–29.4) | 0.521 |
| KPS, %, median (range) | 80 (50–100) | 80 (10–100) | 70 (10–100) | 0.039 |
| Diabetes mellitus, n (%) | 6 (13.0) | 17 (17.7) | 15 (19.0) | 0.686 |
| Encephalopathy, n (%) | 3 (6.5) | 11 (11.5) | 21 (26.6) | 0.004 |
| Ascites, n (%) | 4 (8.7) | 22 (22.9) | 32 (40.5) | <0.001 |
| Ammonia, μmol/L, median (range) | 45 (19–218) | 58 (16–171) | 67.5 (18–327) | 0.092 |
| ALB, g/L, median (range) | 46.4 (40.7–53.2) | 42.1 (30.9–51.2) | 38.3 (27.9–52) | <0.001 |
| GLB, g/L, median (range) | 26.2 (19.7–31.3) | 30.7 (20.5–48.5) | 32.7 (19.6–50.4) | <0.001 |
| NLR, median (range) | 2.62 (0.53–15.65) | 3.21 (0.37–24.81) | 3.24 (0.65–17.38) | 0.097 |
| Child-Pugh score, median (range) | 5 (5–10) | 6 (5–12) | 7 (5–12) | 0.002 |
| MELD score, median (range) | 7 (2–25) | 8 (2–24) | 8 (2–33) | 0.037 |
| Serum AFP ≥ 400 ng/mL, n (%) | 5 (10.9) | 19 (19.8) | 19 (24.1) | 0.198 |
| Multiple tumor, n (%) | 14 (30.4) | 39 (40.6) | 27 (34.2) | 0.446 |
| Total tumor size, cm, median (range) | 4 (1–8) | 4 (0.5–8) | 4.8 (1–8) | 0.152 |
| Liver cirrhosis, n (%) | 38 (82.6) | 73 (76.0) | 68 (86.1) | 0.231 |
| Differentiation of HCC, n (%) | ||||
| Well | 4 (8.7) | 4 (4.2) | 5 (6.3) | 0.550 |
| Moderate | 32 (69.6) | 64 (66.7) | 44 (55.7) | 0.201 |
| Poor | 10 (21.7) | 28 (29.2) | 30 (38.0) | 0.149 |
| Microvascular invasion, n (%) | 11 (23.9) | 27 (28.1) | 32 (40.5) | 0.096 |
| Postoperative infection, n (%) | 6 (13.0) | 27 (28.1) | 32 (40.5) | 0.005 |
| 90-day CCI, median (range) | 33.7 (8.7–68.6) | 46.2 (26.2–100) | 59.9 (26.2–100) | <0.001 |
| ICU stay, d, median (range) | 4 (1–21) | 4.5 (1–43) | 8 (1–65) | 0.039 |
| Variables | Univariate Analysis | ||
|---|---|---|---|
| HR | 95% CI | p-Value | |
| Recipient Age (>60 years) | 1.229 | 0.883–1.886 | 0.335 |
| Recipient gender (male) | 2.196 | 1.173–4.394 | 0.015 |
| KPS (C) | 1.214 | 0.864–2.045 | 0.371 |
| Encephalopathy | 1.230 | 0.865–1.990 | 0.407 |
| Ascites | 1.340 | 0.505–2.142 | 0.173 |
| NLR (>2.6) | 1.873 | 1.384–3.014 | 0.037 |
| Child–Pugh C | 2.017 | 1.538–3.873 | 0.016 |
| MELD score (>20) | 1.776 | 0.984–2.659 | 0.086 |
| Serum AFP (>400 ng/mL) | 1.234 | 0.488–2.790 | 0.336 |
| Multiple tumors | 1.432 | 0.871–2.232 | 0.116 |
| Meeting Milan criteria | 0.730 | 0.559–1.866 | 0.245 |
| Liver cirrhosis | 1.098 | 0.700–1.959 | 0.572 |
| Differentiation of HCC (poor) | 1.398 | 0.514–2.359 | 0.135 |
| Microvascular invasion | 1.710 | 0.877–2.346 | 0.095 |
| CAS grade (2) | 3.391 | 2.028–7.135 | <0.001 |
| CAS grade (3) | 4.031 | 2.123–7.574 | <0.001 |
| Multivariate analysis | |||
| HR | 95% CI | p-value | |
| Recipient gender (male) | 1.824 | 1.349–2.502 | 0.017 |
| NLR (>2.6) | 1.485 | 0.892–2.449 | 0.087 |
| Child–Pugh C | 2.045 | 1.028–4.426 | 0.011 |
| MELD score (>20) | 1.984 | 1.113–3.026 | 0.025 |
| Microvascular invasion | 1.290 | 0.884–1.857 | 0.120 |
| CAS grade (2) | 3.045 | 1.382–6.896 | 0.001 |
| CAS grade (3) | 4.412 | 2.117–9.480 | <0.001 |
Disclaimer/Publisher’s Note: The statements, opinions and data contained in all publications are solely those of the individual author(s) and contributor(s) and not of MDPI and/or the editor(s). MDPI and/or the editor(s) disclaim responsibility for any injury to people or property resulting from any ideas, methods, instructions or products referred to in the content. |
© 2023 by the authors. Licensee MDPI, Basel, Switzerland. This article is an open access article distributed under the terms and conditions of the Creative Commons Attribution (CC BY) license (https://creativecommons.org/licenses/by/4.0/).
Share and Cite
Huang, Y.; Wang, N.; Xu, L.; Wu, Y.; Li, H.; Jiang, L.; Xu, M. Albumin–Globulin Score Combined with Skeletal Muscle Index as a Novel Prognostic Marker for Hepatocellular Carcinoma Patients Undergoing Liver Transplantation. J. Clin. Med. 2023, 12, 2237. https://doi.org/10.3390/jcm12062237
Huang Y, Wang N, Xu L, Wu Y, Li H, Jiang L, Xu M. Albumin–Globulin Score Combined with Skeletal Muscle Index as a Novel Prognostic Marker for Hepatocellular Carcinoma Patients Undergoing Liver Transplantation. Journal of Clinical Medicine. 2023; 12(6):2237. https://doi.org/10.3390/jcm12062237
Chicago/Turabian StyleHuang, Yang, Ning Wang, Liangliang Xu, Youwei Wu, Hui Li, Li Jiang, and Mingqing Xu. 2023. "Albumin–Globulin Score Combined with Skeletal Muscle Index as a Novel Prognostic Marker for Hepatocellular Carcinoma Patients Undergoing Liver Transplantation" Journal of Clinical Medicine 12, no. 6: 2237. https://doi.org/10.3390/jcm12062237
APA StyleHuang, Y., Wang, N., Xu, L., Wu, Y., Li, H., Jiang, L., & Xu, M. (2023). Albumin–Globulin Score Combined with Skeletal Muscle Index as a Novel Prognostic Marker for Hepatocellular Carcinoma Patients Undergoing Liver Transplantation. Journal of Clinical Medicine, 12(6), 2237. https://doi.org/10.3390/jcm12062237