
Effect of Opioid Receptor Activation and Blockage on the Progression and Response to Treatment of Head and Neck Squamous Cell Carcinoma

 , ,
, ,  and
and 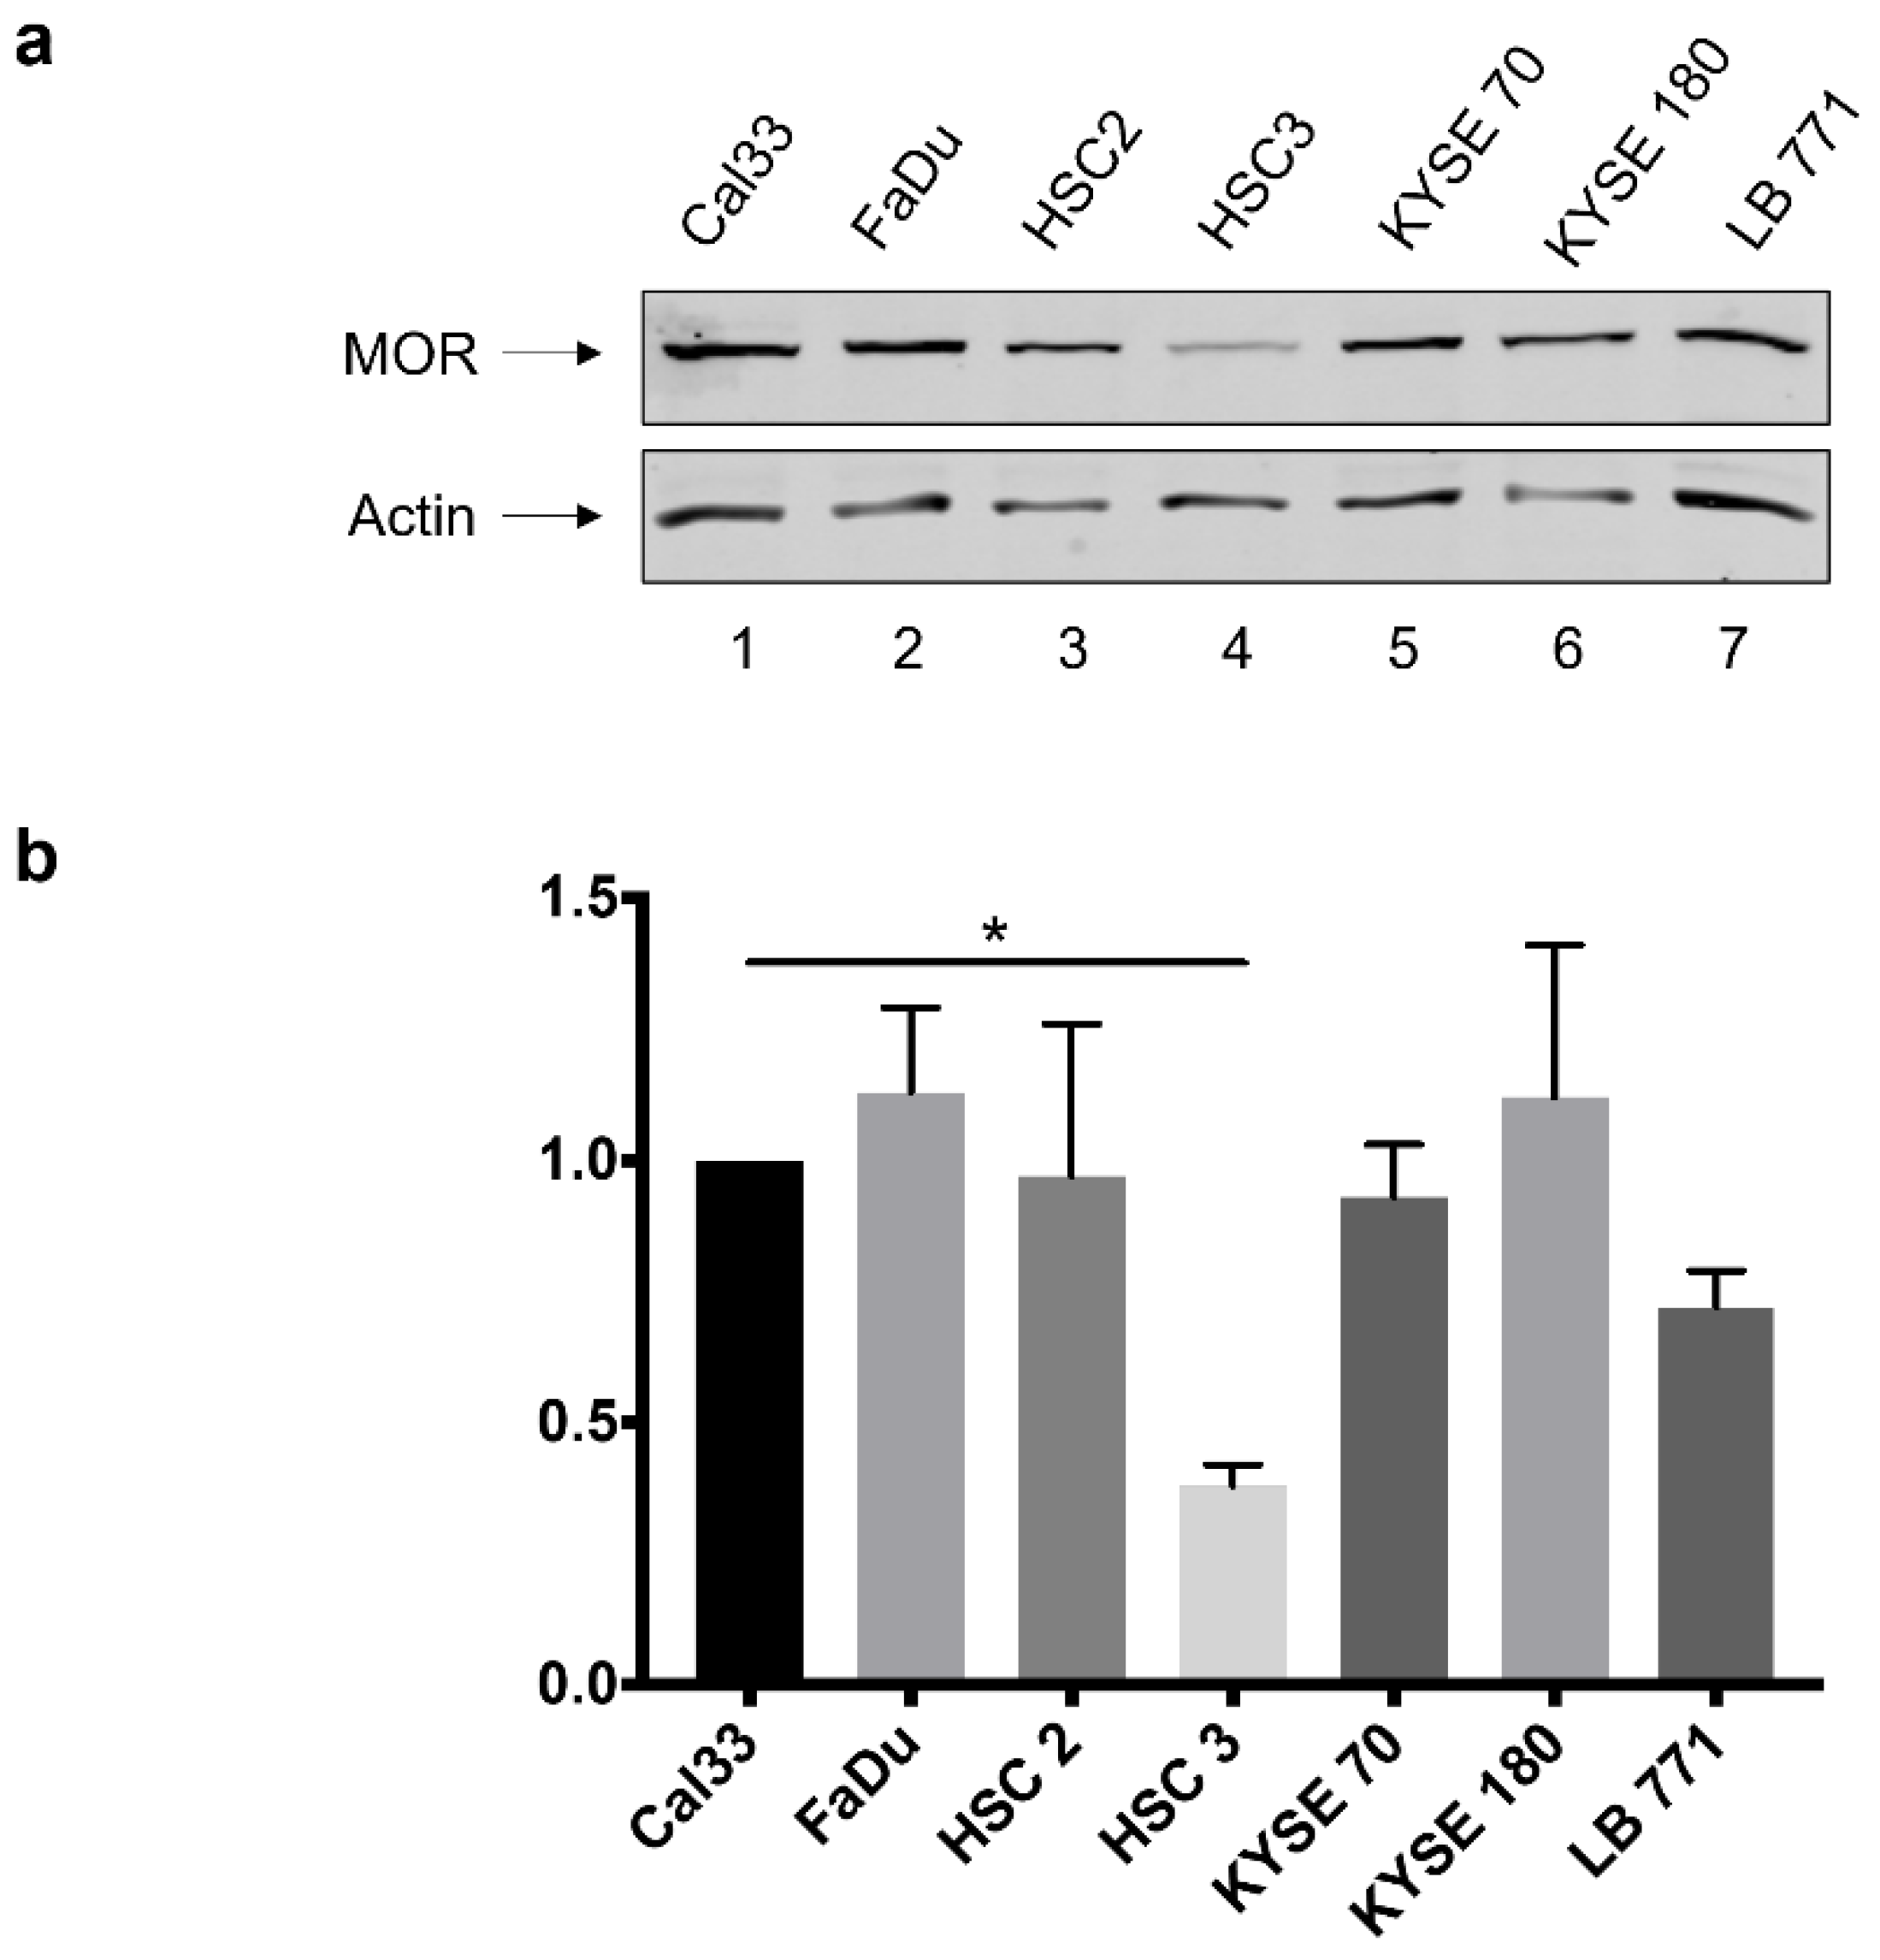
Abstract
1. Introduction
2. Methods
2.1. Experimental Design and Setting
2.2. Cell Cultures and Reagents
2.3. Interventions
2.4. Western Blotting
2.5. XTT Cell Proliferation Assay
2.6. Migration Assay
2.7. Animal Model Hosting Human HNSCC
2.8. Interventions and Medications
2.9. Statistical Analysis
3. Results
3.1. MOR-1 Expression in HNSCC Cell Lines
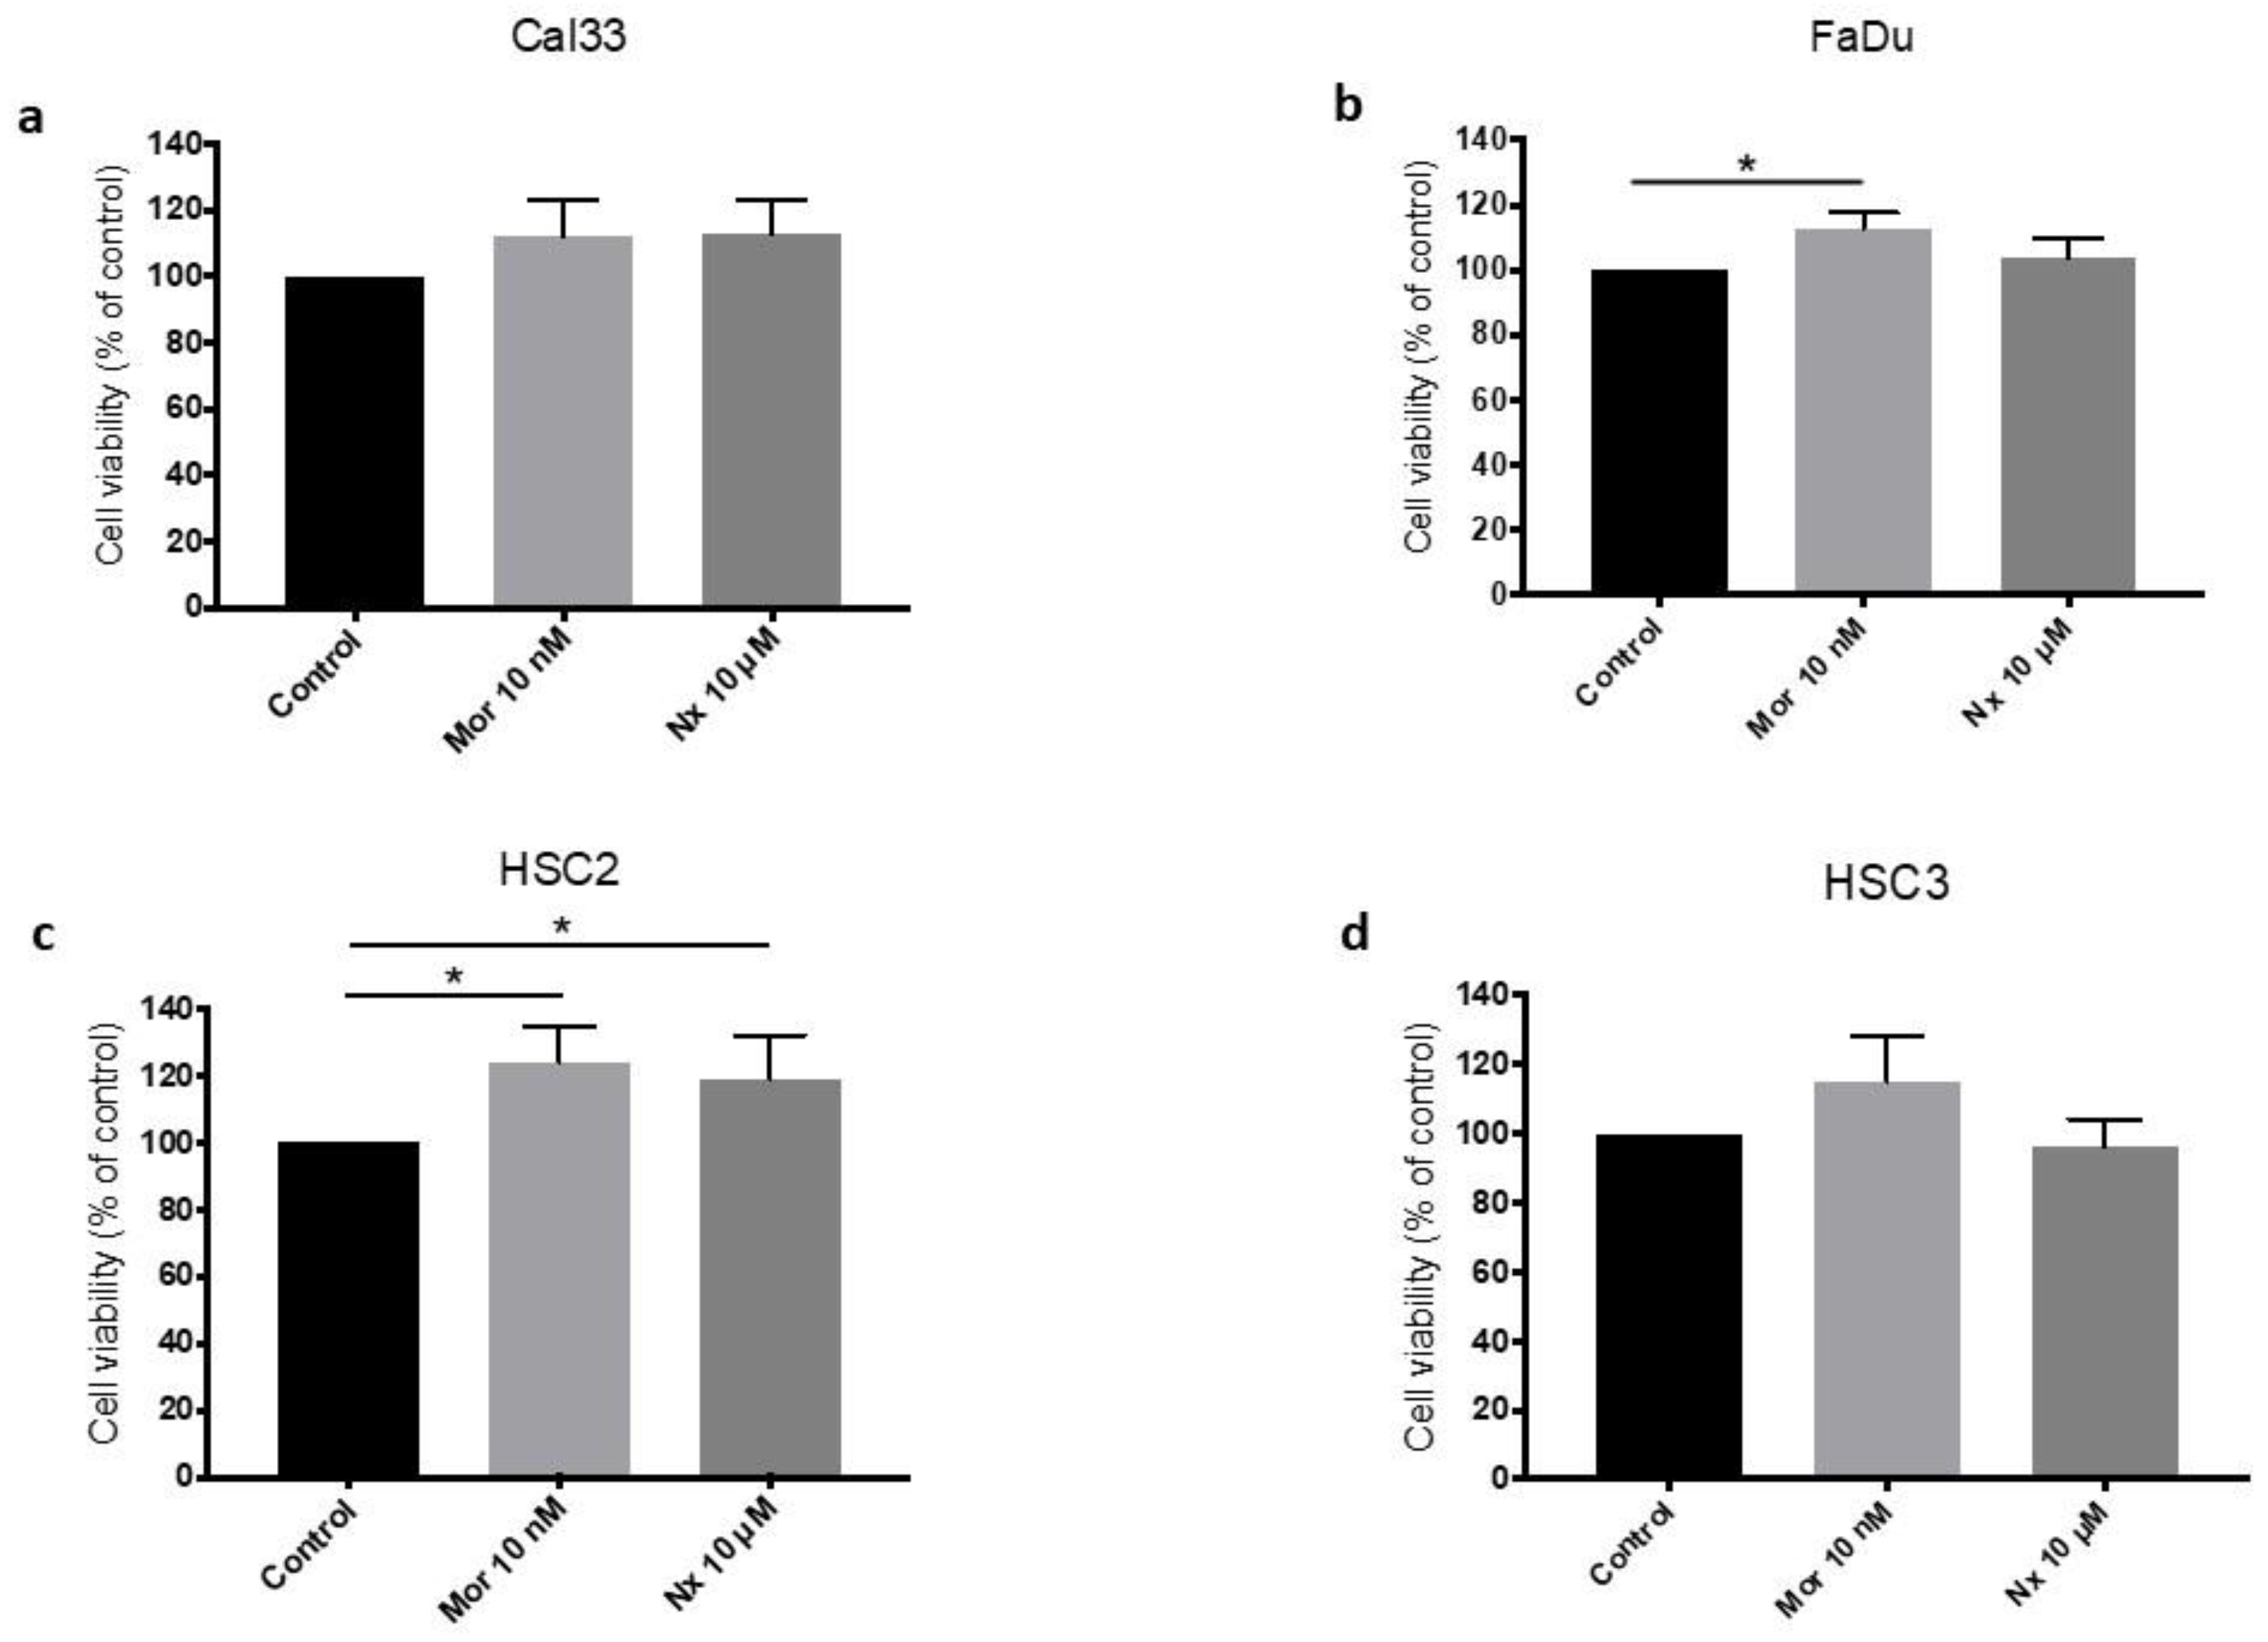
3.2. MOR Agonist and Antagonist Effects on Cell Proliferation
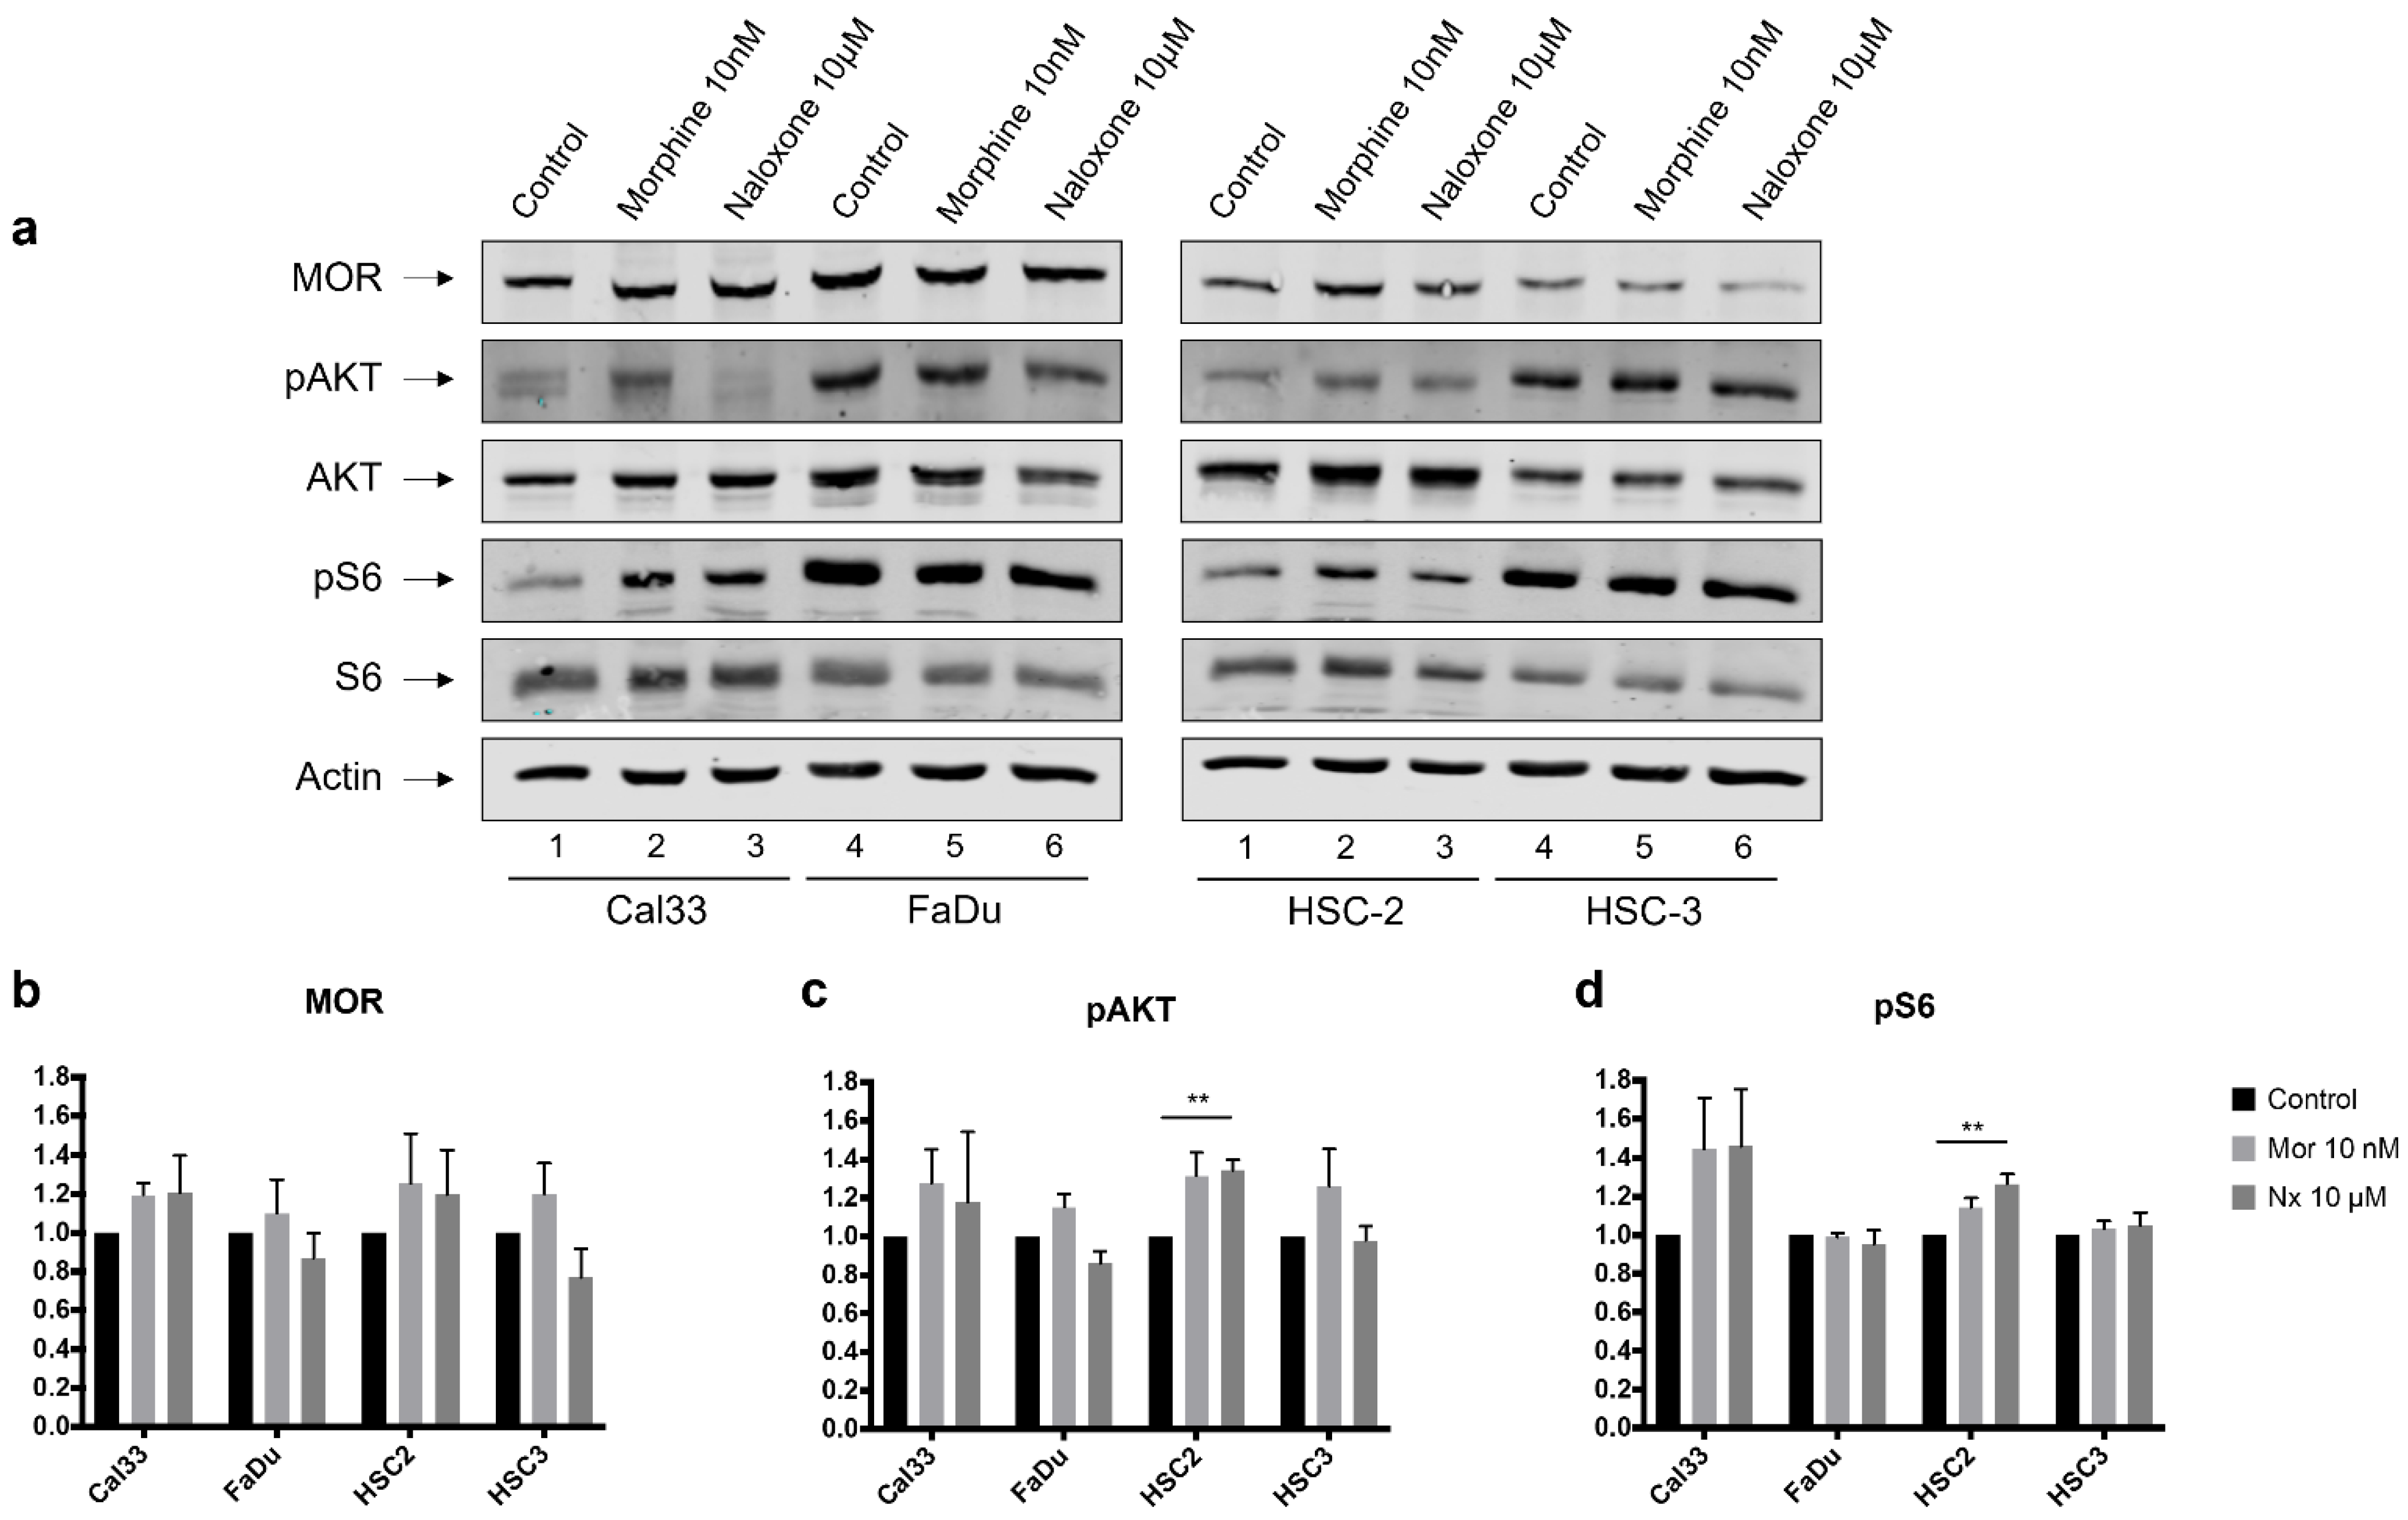
3.3. MOR Agonist and Antagonist Effects on MOR-1 Expression
3.4. MOR Agonist and Antagonist Effects on Downstream PI3K/AKT/mTOR Signaling Axis
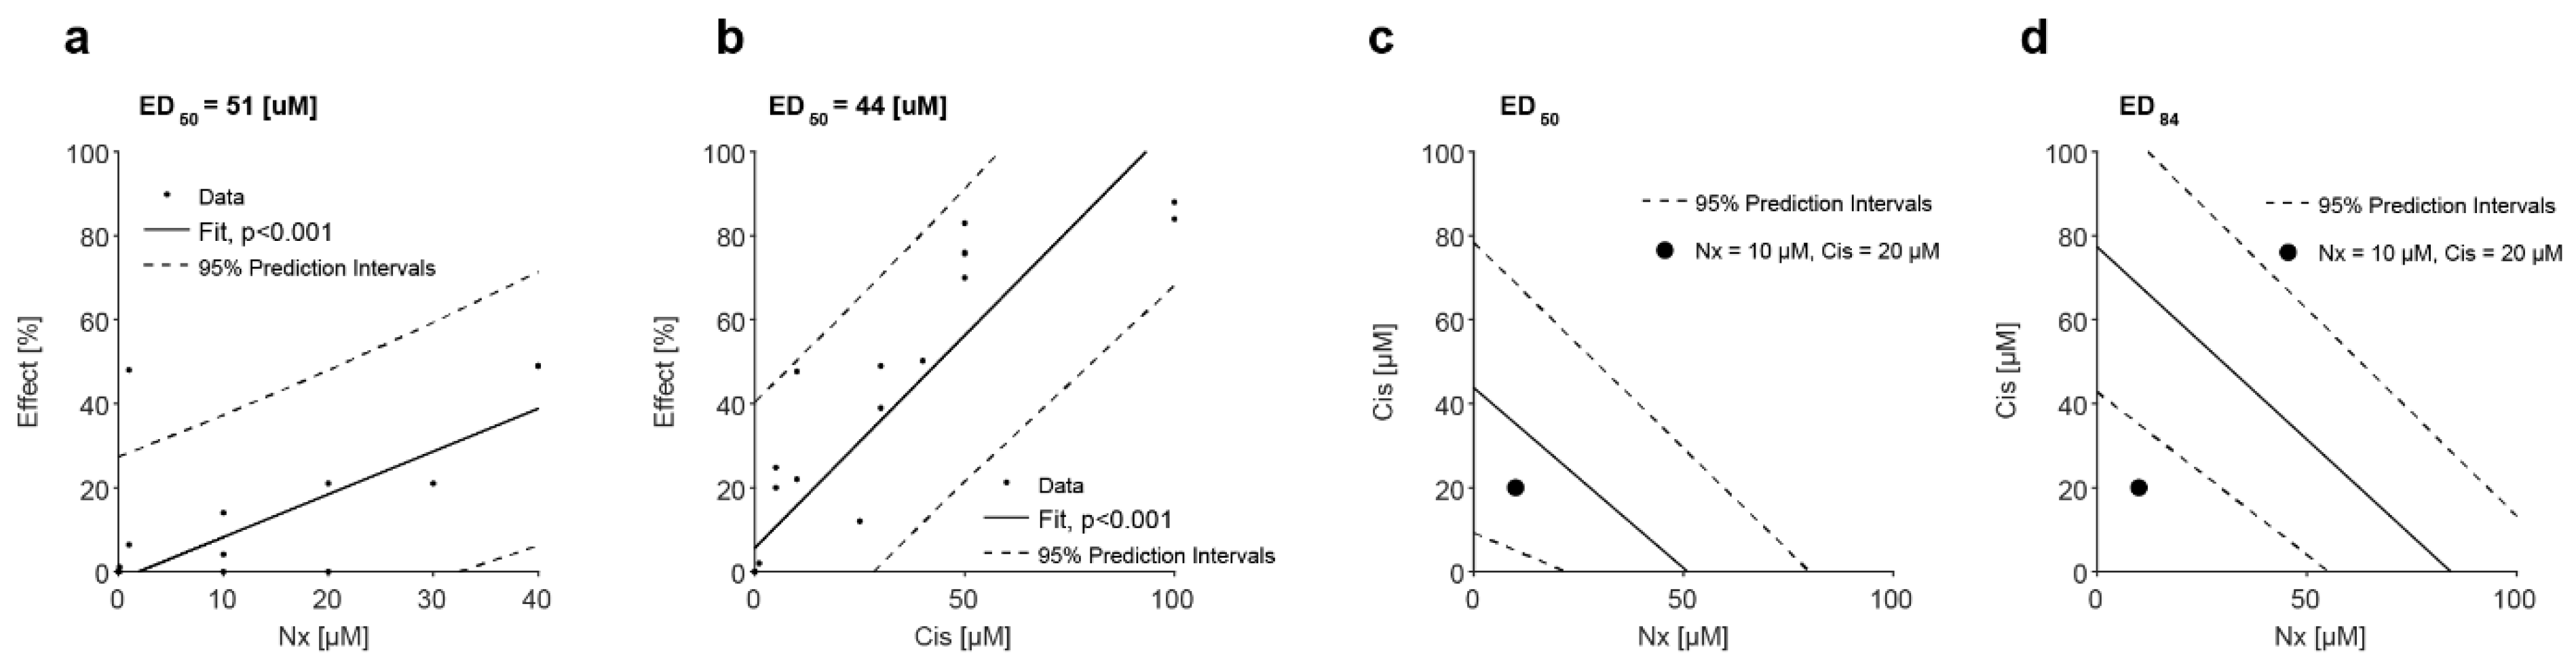
3.5. MOR Agonist and Antagonist Effects on Response to Cisplatin
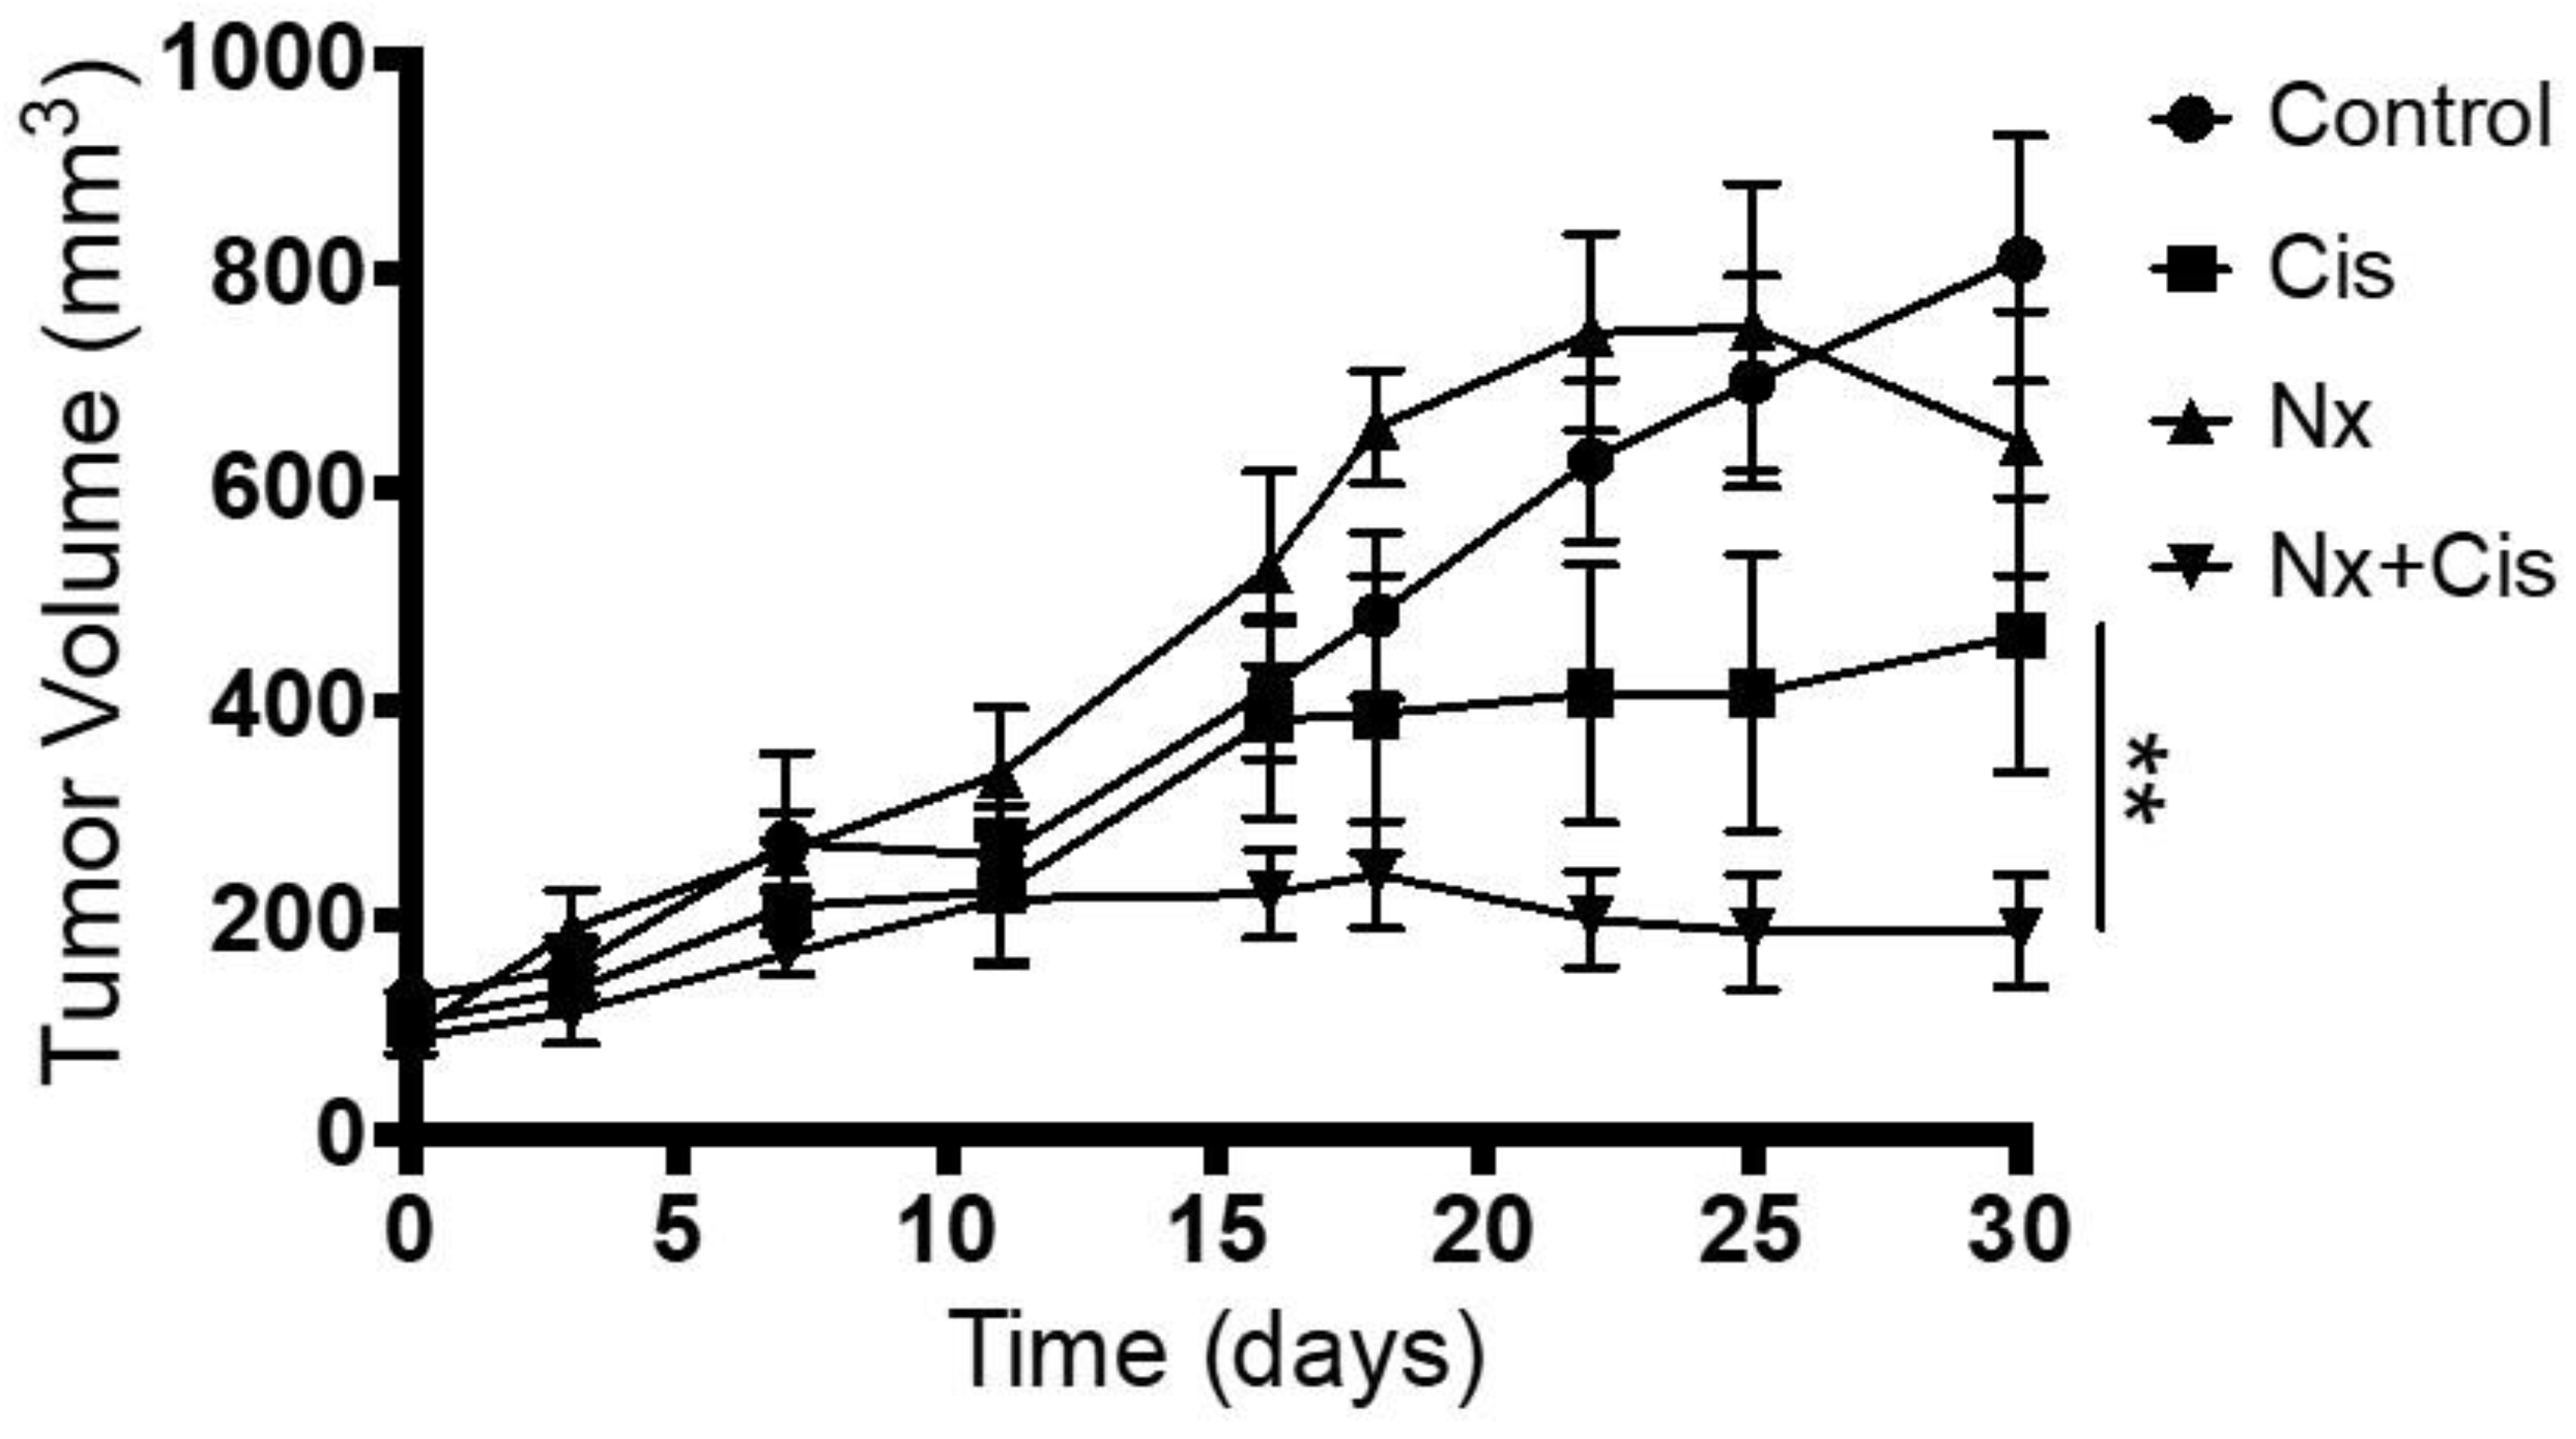
3.6. In Vivo Administration of MOR Agonist and Antagonist and Their Effect on Chemotherapy
4. Discussion
Supplementary Materials
Author Contributions
Funding
Institutional Review Board Statement
Informed Consent Statement
Data Availability Statement
Conflicts of Interest
References
- Silver, N.; Dourado, J.; Hitchcock, K.; Fullerton, A.; Fredenburg, K.; Dziegielewski, P.; Danan, D.; Tighe, P.; Morris, C.; Amdur, R.; et al. Chronic opioid use in patients undergoing treatment for oropharyngeal cancer. Laryngoscope 2019, 129, 2087–2093. [Google Scholar] [CrossRef] [PubMed]
- Pang, J.; Tringale, K.R.; Tapia, V.; Moss, W.J.; May, M.E.; Furnish, T.; Barnachea, L.; Brumund, K.T.; Sacco, A.G.; Weisman, R.A.; et al. Chronic Opioid Use Following Surgery for Oral Cavity Cancer. JAMA Otolaryngol. Neck Surg. 2017, 143, 1187–1194. [Google Scholar] [CrossRef]
- Razmpa, E.; Saedi, B.; Motiee-Langroudi, M.; Garajei, A.; Hoseinpor, S.; Motamedi, M.H.K. Opium Usage as an Etiologic Factor of Oral Cavity Cancer. J. Craniofacial Surg. 2014, 25, e505–e507. [Google Scholar] [CrossRef]
- Shoffel-Havakuk, H.; Cohen, O.; Slavin, M.; Haimovich, Y.; Halperin, D.; Lahav, Y. Intravenous opioid drug abuse as an independent risk factor for supraglottic squamous cell carcinoma-A case-control study. Clin. Otolaryngol. 2017, 43, 456–462. [Google Scholar] [CrossRef]
- Yaniv, D.; Reuven, Y.; Lahav, Y.; Cohen, O.; Hamzany, Y.; Moore, A.; Rapana, O.G.; Argaman, N.; Halperin, D.; Popovtzer, A.; et al. Supraglottic Carcinoma in Intravenous Opioid Drug Abusers: A Distinct Disease with Improved Survival. Laryngoscope 2020, 131, E1190–E1197. [Google Scholar] [CrossRef]
- Brinkman, D.; Wang, J.H.; Redmond, H.P. Morphine as a treatment of cancer-induced pain—Is it safe? A review of in vivo studies and mechanisms. Naunyn-Schmiedeberg’s Arch. Pharmacol. 2018, 391, 1169–1178. [Google Scholar] [CrossRef]
- Lennon, F.E.; Mirzapoiazova, T.; Mambetsariev, B.; Poroyko, V.A.; Salgia, R.; Moss, J.; Singleton, P.A. The Mu Opioid Receptor Promotes Opioid and Growth Factor-Induced Proliferation, Migration and Epithelial Mesenchymal Transition (EMT) in Human Lung Cancer. PLoS ONE 2014, 9, e91577. [Google Scholar] [CrossRef] [PubMed]
- Singleton, P.A.; Moss, J.; Karp, D.D.; Atkins, J.T.; Janku, F. The mu opioid receptor: A new target for cancer therapy? Cancer 2015, 121, 2681–2688. [Google Scholar] [CrossRef] [PubMed]
- Shoffel-Havakuk, H.; Huszar, M.; Levy, I.; Cohen, O.; Halperin, D.L.Y. Staining for Mu opioid receptors in supraglottic and glottic carcinoma specimens and the relations with intravenous opioid drug abuse. In Proceedings of the 12th Congress Eur Laryngol Soc (ELS), London, UK, 16–19 May 2018. [Google Scholar]
- Pedrero, J.M.G.; Carracedo, D.G.; Pinto, C.M.; Zapatero, A.H.; Rodrigo, J.P.; Nieto, C.S.; Gonzalez, M.V. Retracted: Frequent genetic and biochemical alterations of the PI 3-K/AKT/PTEN pathway in head and neck squamous cell carcinoma. Int. J. Cancer 2004, 114, 242–248. [Google Scholar] [CrossRef]
- Cai, Y.; Dodhia, S.; Su, G.H. Dysregulations in the PI3K pathway and targeted therapies for head and neck squamous cell carcinoma. Oncotarget 2017, 8, 22203–22217. [Google Scholar] [CrossRef] [PubMed]
- Lui, V.W.; Hedberg, M.L.; Li, H.; Vangara, B.S.; Pendleton, K.; Zeng, Y.; Lu, Y.; Zhang, Q.; Du, Y.; Gilbert, B.R.; et al. Frequent Mutation of the PI3K Pathway in Head and Neck Cancer Defines Predictive Biomarkers. Cancer Discov. 2013, 3, 761–769. [Google Scholar] [CrossRef]
- Burris, H.A., 3rd. Overcoming acquired resistance to anticancer therapy: Focus on the PI3K/AKT/mTOR pathway. Cancer Chemother. Pharmacol. 2013, 71, 829–842. [Google Scholar] [CrossRef] [PubMed]
- Fujioka, N.; Nguyen, J.; Chen, C.; Li, Y.; Pasrija, T.; Niehans, G.; Johnson, K.N.; Gupta, V.; Kratzke, R.A.; Gupta, K. Morphine-Induced Epidermal Growth Factor Pathway Activation in Non–Small Cell Lung Cancer. Obstet. Anesth. Dig. 2011, 113, 1353–1364. [Google Scholar] [CrossRef] [PubMed]
- Cao, L.-H.; Li, H.-T.; Lin, W.-Q.; Tan, H.-Y.; Xie, L.; Zhong, Z.-J.; Zhou, J.-H. Morphine, a potential antagonist of cisplatin cytotoxicity, inhibits cisplatin-induced apoptosis and suppression of tumor growth in nasopharyngeal carcinoma xenografts. Sci. Rep. 2016, 6, srep18706. [Google Scholar] [CrossRef] [PubMed]
- Chen, D.; Pan, J.; Chen, Y.; Xing, W.; Yan, Y.; Yuan, Y.; Zeng, W. The mu-opioid receptor is a molecular marker for poor prognosis in hepatocellular carcinoma and represents a potential therapeutic target. Br. J. Anaesth. 2019, 122, e157–e167. [Google Scholar] [CrossRef] [PubMed]
- Bimonte, S.; Barbieri, A.; Cascella, M.; Rea, D.; Palma, G.; Del Vecchio, V.; Forte, C.A.; Del Prato, F.; Arra, C.; Cuomo, A. The effects of naloxone on human breast cancer progression: In vitro and in vivo studies on MDA.MB231 cells. OncoTargets Ther. 2018, 11, 185–191. [Google Scholar] [CrossRef] [PubMed]
- Gupta, K.; Kshirsagar, S.; Chang, L.; Schwartz, R.; Law, P.-Y.; Yee, D.; Hebbel, R.P. Morphine stimulates angiogenesis by activating proangiogenic and survival-promoting signaling and promotes breast tumor growth. Cancer Res. 2002, 62, 4491–4498. [Google Scholar]
- Tallarida, R.J. Quantitative Methods for Assessing Drug Synergism. Genes Cancer 2011, 2, 1003–1008. [Google Scholar] [CrossRef]
- Mathew, B.; Lennon, F.E.; Siegler, J.; Mirzapoiazova, T.; Mambetsariev, N.; Sammani, S.; Gerhold, L.M.; LaRiviere, P.J.; Chen, C.-T.; Garcia, J.G.N.; et al. The Novel Role of the Mu Opioid Receptor in Lung Cancer Progression. Obstet. Anesth. Dig. 2011, 112, 558–567. [Google Scholar] [CrossRef] [PubMed]
- Ma, Y.; Ren, Z.; Ma, S.; Yan, W.; He, M.; Wang, D.; Ding, P. Morphine enhances renal cell carcinoma aggressiveness through promotes survivin level. Ren. Fail. 2016, 39, 258–264. [Google Scholar] [CrossRef]
- Farooqui, M.; Geng, Z.H.; Stephenson, E.J.; Zaveri, N.; Yee, D.; Gupta, K. Naloxone acts as an antagonist of estrogen receptor activity in MCF-7 cells. Mol. Cancer Ther. 2006, 5, 611–620. [Google Scholar] [CrossRef]
- Li, Y.; Li, G.; Tao, T.; Kang, X.; Liu, C.; Zhang, X.; Wang, C.; Li, C.; Guo, X. The μ-opioid receptor (MOR) promotes tumor initiation in hepatocellular carcinoma. Cancer Lett. 2019, 453, 1–9. [Google Scholar] [CrossRef] [PubMed]
- Singleton, P.; Lingen, M.; Fekete, M.; Garcia, J.; Moss, J. Methylnaltrexone inhibits opiate and VEGF-induced angiogenesis: Role of receptor transactivation. Microvasc. Res. 2006, 72, 3–11. [Google Scholar] [CrossRef] [PubMed]
- Biki, B.; Mascha, E.; Moriarty, D.C.; Fitzpatrick, J.M.; Sessler, D.I.; Buggy, D. Anesthetic Technique for Radical Prostatectomy Surgery Affects Cancer Recurrence. Anesthesiology 2008, 109, 180–187. [Google Scholar] [CrossRef]
- Christopherson, R.; James, K.E.; Tableman, M.; Marshall, P.; Johnson, F.E. Long-Term Survival After Colon Cancer Surgery: A Variation Associated with Choice of Anesthesia. Obstet. Anesth. Dig. 2008, 107, 325–332. [Google Scholar] [CrossRef] [PubMed]
- Exadaktylos, A.K.; Buggy, D.J.; Moriarty, D.C.; Mascha, E.; Sessler, D.I. Can Anesthetic Technique for Primary Breast Cancer Surgery Affect Recurrence or Metastasis? Anesthesiology 2006, 105, 660–664. [Google Scholar] [CrossRef] [PubMed]
- Cata, J.P.; Keerty, V.; Keerty, D.; Feng, L.; Norman, P.H.; Gottumukkala, V.; Mehran, J.R.; Engle, M. A retrospective analysis of the effect of intraoperative opioid dose on cancer recurrence after non-small cell lung cancer resection. Cancer Med. 2014, 3, 900–908. [Google Scholar] [CrossRef]
- Chen, W.-K.; Miao, C.-H. The Effect of Anesthetic Technique on Survival in Human Cancers: A Meta-Analysis of Retrospective and Prospective Studies. PLoS ONE 2013, 8, e56540. [Google Scholar] [CrossRef]
- Gorur, A.; Patiño, M.; Takahashi, H.; Corrales, G.; Pickering, C.R.; Gleber-Netto, F.O.; Myers, J.N.; Cata, J.P. Mu-opioid receptor activation promotes in vitro and in vivo tumor growth in head and neck squamous cell carcinoma. Life Sci. 2021, 278, 119541. [Google Scholar] [CrossRef]
- Lennon, F.E.; Mirzapoiazova, T.; Mambetsariev, B.; Salgia, R.; Moss, J.; Singleton, P.A. Overexpression of the μ-Opioid Receptor in Human Non-Small Cell Lung Cancer Promotes Akt and mTOR Activation, Tumor Growth, and Metastasis. Anesthesiology 2012, 116, 857–867. [Google Scholar] [CrossRef]
- James, A.; Williams, J. Basic Opioid Pharmacology—An Update. Br. J. Pain 2020, 14, 115–121. [Google Scholar] [CrossRef] [PubMed]
- Zagon, I.S.; McLaughlin, P.J. Opioid growth factor and the treatment of human pancreatic cancer: A review. World J. Gastroenterol. 2014, 20, 2218–2223. [Google Scholar] [CrossRef] [PubMed]
- McLaughlin, P.J.; Stucki, J.K.; Zagon, I.S. Modulation of the opioid growth factor ([Met5]-enkephalin)-opioid growth factor receptor axis: Novel therapies for squamous cell carcinoma of the head and neck. Head Neck 2011, 34, 513–519. [Google Scholar] [CrossRef] [PubMed]
- Zagon, I.S.; McLaughlin, P.J. Opioids and differentiation in human cancer cells. Neuropeptides 2005, 39, 495–505. [Google Scholar] [CrossRef]
- McLaughlin, P.J.; Verderame, M.F.; Hankins, J.L.; Zagon, I.S. Overexpression of the opioid growth factor receptor downregulates cell proliferation of human squamous carcinoma cells of the head and neck. Int. J. Mol. Med. 2007, 19, 421–428. [Google Scholar] [CrossRef] [PubMed]
- Ang, K.K.; Berkey, B.A.; Tu, X.; Zhang, H.-Z.; Katz, R.; Hammond, E.H.; Fu, K.K.; Milas, L. Impact of epidermal growth factor receptor expression on survival and pattern of relapse in patients with advanced head and neck carcinoma. Cancer Res. 2002, 62, 7350–7356. [Google Scholar] [PubMed]
- Temam, S.; Kawaguchi, H.; El-Naggar, A.K.; Jelinek, J.; Tang, H.; Liu, D.D.; Lang, W.; Issa, J.-P.; Lee, J.J.; Mao, L. Epidermal Growth Factor Receptor Copy Number Alterations Correlate With Poor Clinical Outcome in Patients With Head and Neck Squamous Cancer. J. Clin. Oncol. 2007, 25, 2164–2170. [Google Scholar] [CrossRef]
- Vermorken, J.B.; Trigo, J.; Hitt, R.; Koralewski, P.; Diaz-Rubio, E.; Rolland, F.; Knecht, R.; Amellal, N.; Schueler, A.; Baselga, J. Open-Label, Uncontrolled, Multicenter Phase II Study to Evaluate the Efficacy and Toxicity of Cetuximab As a Single Agent in Patients With Recurrent and/or Metastatic Squamous Cell Carcinoma of the Head and Neck Who Failed to Respond to Platinum-Based Therapy. J. Clin. Oncol. 2007, 25, 2171–2177. [Google Scholar] [CrossRef]
- Bonner, J.A.; Harari, P.M.; Giralt, J.; Cohen, R.B.; Jones, C.U.; Sur, R.K.; Raben, D.; Baselga, J.; Spencer, S.A.; Zhu, J.; et al. Radiotherapy plus cetuximab for locoregionally advanced head and neck cancer: 5-year survival data from a phase 3 randomised trial, and relation between cetuximab-induced rash and survival. Lancet Oncol. 2010, 11, 21–28. [Google Scholar] [CrossRef]
- Bonner, J.A.; Harari, P.M.; Giralt, J.; Azarnia, N.; Shin, D.M.; Cohen, R.B.; Jones, C.U.; Sur, R.; Raben, D.; Jassem, J.; et al. Radiotherapy plus Cetuximab for Squamous-Cell Carcinoma of the Head and Neck. N. Engl. J. Med. 2006, 354, 567–578. [Google Scholar] [CrossRef]
- García-Carracedo, D.; Villaronga, M.Á.; Álvarez-Teijeiro, S.; Hermida-Prado, F.; Santamaria, I.; Allonca, E.; Suárez-Fernández, L.; Gonzalez, M.V.; Balbin, M.; Astudillo, A.; et al. Impact of PI3K/AKT/mTOR pathway activation on the prognosis of patients with head and neck squamous cell carcinomas. Oncotarget 2016, 7, 29780–29793. [Google Scholar] [CrossRef]
- Annovazzi, L.; Mellai, M.; Caldera, V.; Valente, G.; Tessitore, L.; Schiffer, D. mTOR, S6 and AKT expression in relation to proliferation and apoptosis/autophagy in glioma. Anticancer Res. 2009, 29, 3087–3094. [Google Scholar]
- Wheeler, S.E.; Suzuki, S.; Thomas, S.M.; Sen, M.; Leeman-Neill, R.J.; Chiosea, S.I.; Kuan, C.-T.; Bigner, D.D.; Gooding, W.E.; Lai, S.Y.; et al. Epidermal growth factor receptor variant III mediates head and neck cancer cell invasion via STAT3 activation. Oncogene 2010, 29, 5135–5145. [Google Scholar] [CrossRef]
- Singleton, P.A.; Garcia, J.G.; Moss, J. Synergistic effects of methylnaltrexone with 5-fluorouracil and bevacizumab on inhibition of vascular endothelial growth factor–induced angiogenesis. Mol. Cancer Ther. 2008, 7, 1669–1679. [Google Scholar] [CrossRef]
- Eckstein, N.; Servan, K.; Hildebrandt, B.; Pölitz, A.; von Jonquières, G.; Wolf-Kümmeth, S.; Napierski, I.; Hamacher, A.; Kassack, M.U.; Budczies, J.; et al. Hyperactivation of the Insulin-like Growth Factor Receptor I Signaling Pathway Is an Essential Event for Cisplatin Resistance of Ovarian Cancer Cells. Cancer Res. 2009, 69, 2996–3003. [Google Scholar] [CrossRef] [PubMed]
- Gohr, K.; Hamacher, A.; Engelke, L.H.; Kassack, M.U. Inhibition of PI3K/Akt/mTOR overcomes cisplatin resistance in the triple negative breast cancer cell line HCC38. BMC Cancer 2017, 17, 711. [Google Scholar] [CrossRef] [PubMed]
- Amornphimoltham, P.; Patel, V.; Sodhi, A.; Nikitakis, N.G.; Sauk, J.J.; Sausville, E.A.; Molinolo, A.A.; Gutkind, J.S. Mammalian Target of Rapamycin, a Molecular Target in Squamous Cell Carcinomas of the Head and Neck. Cancer Res. 2005, 65, 9953–9961. [Google Scholar] [CrossRef] [PubMed]
- Bae-Jump, V.L.; Zhou, C.; Boggess, J.F.; Gehrig, P.A. Synergistic effect of rapamycin and cisplatin in endometrial cancer cells. Cancer 2009, 115, 3887–3896. [Google Scholar] [CrossRef] [PubMed]
- Fang, L.; Wang, H.; Zhou, L.; Yu, D. FOXO3a reactivation mediates the synergistic cytotoxic effects of rapamycin and cisplatin in oral squamous cell carcinoma cells. Toxicol. Appl. Pharmacol. 2011, 251, 8–15. [Google Scholar] [CrossRef]
- Wong, S.W.; Tiong, K.H.; Kong, W.Y.; Yue, Y.C.; Chua, C.H.; Lim, J.Y.; Lee, C.Y.; Quah, S.I.; Fow, C.; Chung, C.; et al. Rapamycin synergizes cisplatin sensitivity in basal-like breast cancer cells through up-regulation of p73. Breast Cancer Res. Treat. 2010, 128, 301–313. [Google Scholar] [CrossRef]
- Hou, G.; Zhang, Q.; Wang, L.; Liu, M.; Wang, J.; Xue, L. mTOR inhibitor rapamycin alone or combined with cisplatin inhibits growth of esophageal squamous cell carcinoma in nude mice. Cancer Lett. 2010, 290, 248–254. [Google Scholar] [CrossRef] [PubMed]
- Beuvink, I.; Boulay, A.; Fumagalli, S.; Zilbermann, F.; Ruetz, S.; O’Reilly, T.; Natt, F.; Hall, J.; Lane, H.A.; Thomas, G. The mTOR Inhibitor RAD001 Sensitizes Tumor Cells to DNA-Damaged Induced Apoptosis through Inhibition of p21 Translation. Cell 2005, 120, 747–759. [Google Scholar] [CrossRef]
- Janku, F.; Johnson, L.K.; Karp, D.D.; Atkins, J.T.; Singleton, P.A.; Moss, J. Treatment with methylnaltrexone is associated with increased survival in patients with advanced cancer. Ann. Oncol. 2016, 27, 2032–2038. [Google Scholar] [CrossRef] [PubMed]
- Smith, W.H.; Luskin, I.; Salgado, L.R.; Scarborough, B.M.; Lin, J.-Y.; Özbek, U.; Miles, B.A.; Gupta, V.; Bakst, R.L. Risk of prolonged opioid use among cancer patients undergoing curative intent radiation therapy for head and neck malignancies. Oral Oncol. 2019, 92, 1–5. [Google Scholar] [CrossRef]
- Kwon, J.H.; Hui, D.; Chisholm, G.; Bruera, E. Predictors of Long-Term Opioid Treatment Among Patients Who Receive Chemoradiation for Head and Neck Cancer. Oncologist 2013, 18, 768–774. [Google Scholar] [CrossRef] [PubMed]


Disclaimer/Publisher’s Note: The statements, opinions and data contained in all publications are solely those of the individual author(s) and contributor(s) and not of MDPI and/or the editor(s). MDPI and/or the editor(s) disclaim responsibility for any injury to people or property resulting from any ideas, methods, instructions or products referred to in the content. |
© 2023 by the authors. Licensee MDPI, Basel, Switzerland. This article is an open access article distributed under the terms and conditions of the Creative Commons Attribution (CC BY) license (https://creativecommons.org/licenses/by/4.0/).
Share and Cite
Levi, L.; Hikri, E.; Popovtzer, A.; Dayan, A.; Levi, A.; Bachar, G.; Mizrachi, A.; Shoffel-Havakuk, H. Effect of Opioid Receptor Activation and Blockage on the Progression and Response to Treatment of Head and Neck Squamous Cell Carcinoma. J. Clin. Med. 2023, 12, 1277. https://doi.org/10.3390/jcm12041277
Levi L, Hikri E, Popovtzer A, Dayan A, Levi A, Bachar G, Mizrachi A, Shoffel-Havakuk H. Effect of Opioid Receptor Activation and Blockage on the Progression and Response to Treatment of Head and Neck Squamous Cell Carcinoma. Journal of Clinical Medicine. 2023; 12(4):1277. https://doi.org/10.3390/jcm12041277
Chicago/Turabian StyleLevi, Lirit, Elad Hikri, Aron Popovtzer, Avraham Dayan, Amir Levi, Gideon Bachar, Aviram Mizrachi, and Hagit Shoffel-Havakuk. 2023. "Effect of Opioid Receptor Activation and Blockage on the Progression and Response to Treatment of Head and Neck Squamous Cell Carcinoma" Journal of Clinical Medicine 12, no. 4: 1277. https://doi.org/10.3390/jcm12041277
APA StyleLevi, L., Hikri, E., Popovtzer, A., Dayan, A., Levi, A., Bachar, G., Mizrachi, A., & Shoffel-Havakuk, H. (2023). Effect of Opioid Receptor Activation and Blockage on the Progression and Response to Treatment of Head and Neck Squamous Cell Carcinoma. Journal of Clinical Medicine, 12(4), 1277. https://doi.org/10.3390/jcm12041277