1. Introduction
The COVID-19 pandemic has exposed the world to unusual symptoms, namely olfactory and gustatory disorders. The prevalence of non-COVID-19 related smell disorders is reported to be between 1% and 3% [
1,
2,
3]. These causes are mainly sinonasal disorders, post-infectious or post-traumatic disorders, aging and neurodegenerative diseases [
1,
3,
4,
5,
6,
7,
8,
9]. A recent study revealed that one-third of a general 65-year-old population suffered from impaired smell function and more than one-quarter from impaired taste function [
4]. The loss of smell or taste can greatly influence health and overall well-being [
5,
6]. In COVID-19 cases, smell and taste disorders are among the most common symptoms experienced, which sheds light on the importance of these senses [
7,
8]. Changes or (partial) loss of the sense of smell or taste have been added to the clinical screening profile for COVID-19 and to the official list of symptoms that persist after COVID-19 by the Centers for Disease Control and Prevention and the World Health Organization [
9]. In the majority of individuals with COVID-19, related smell or taste loss recover to normal levels after a few days or weeks [
10]. However, it has been established that, 90–150 days after infection, 7.6% of patients still experienced at least a moderate severity of these symptoms (scored on a Likert scale of 1–5) [
11].
While COVID-19 induced smell and taste disorders are regularly studied, there is a large heterogeneity in these studies, resulting a large variety in their outcomes. This is mainly due to differences in the studied population, reporting systems, healthcare systems, the method of diagnosing COVID-19 and measurement of smell and taste function. Most follow-up data are based on hospitalized COVID-19 patients, which gives a different perspective than information from the general population. Regrettably, data from non-hospitalized patients are not often reported [
12]. Moreover, prior to the pandemic, there was limited attention paid to olfactory and gustatory disorders in clinical practice and research [
13]. The presence of all of these factors poses challenges when conducting research to compare the course of smell loss between COVID-19 and non-COVID-19 cases.
Therefore, we aim to determine the incidence, severity and duration of COVID-19 induced smell and taste loss, and compare this with non-COVID-19 related smell and taste loss in a general population.
2. Methods
2.1. Study Design and Participants
We conducted a longitudinal cohort study. The data used for this study were collected from a Dutch biobank called Lifelines. Lifelines is a multi-disciplinary prospective population-based cohort study examining in a unique three-generation design the health and health-related behaviors of 167,729 persons living in the north of the Netherlands. It employs a broad range of investigative procedures in assessing the biomedical, socio-demographic, behavioral, physical and psychological factors that contribute to the health and disease of the general population, with a special focus on multi-morbidity and complex genetics. [
14,
15]. Participants were recruited by general practitioners or online self-registration. Data from participants was assessed by using digital questionnaires. Lifelines uses rigorous protocols for comprehensive data collection to ensure reliability and accuracy of the data [
15,
16]. The Medical Ethical Committee of University Medical Center Groningen (2007/152) approved the Lifelines cohort study [
14,
15,
16,
17]. All Lifelines participants signed informed consent forms [
16]. The Lifelines study does not use inclusion criteria; however, severe mental illness, short life expectancy (<5 years), the inability to visit a general practitioner and insufficient understanding of the Dutch language are exclusion criteria [
14]. Since April 2020 additional COVID-19 questionnaires have been sent out to Lifelines participants. These participants were at least 18 years old and able to complete digital questionnaires via a valid email address [
14,
15,
17]. Follow-up questionnaires were sent out once a week (questionnaire 1–6) and later on a bi-weekly or monthly basis (questionnaire 7–26) [
17].
More than 305,500 Lifelines participants were invited to fill in the COVID-19 questionnaires used for this study. Over time, these questionnaires were adjusted; new, relevant topics on COVID-19 were added and some questions were omitted [
17].
2.2. Procedures
Participants were asked to indicate the extent to which they experienced various symptoms over the past seven days, from March 2020 to May 2020. From May 2020, in order to align with the regular questionnaire distribution schedule (bi-weekly or monthly), the timeframe was adjusted to the past 14 days. Loss of sense of smell or taste was assessed with a 5-point Likert scale (1 = not at all, 5 = extremely). Data were collected from a total of 27 different questionnaires administered between 30 March 2020 and 4 May 2022 (
Appendix A). The questionnaires were conducted digitally, and all data, except for age and gender, were self-reported. The definition of a COVID-19 diagnosis has evolved over time. Initially, until 15 May 2020 (questionnaire 7), it was based on a doctor’s diagnosis, due to limited testing options in the Netherlands until August 2020 [
18]. From 13 October 2020 to 13 October 2022 (questionnaires 6–14), a diagnosis was established through a doctor’s diagnosis or through a positive PCR test conducted in a healthcare facility. During the period of questionnaire 14 to questionnaire 20 (13 October 2022 to 26 April 2021), only a PCR test conducted in a healthcare facility was considered as a COVID-19 diagnosis, therefore the question about a doctor’s diagnosis was omitted. From 26 April 2021 (questionnaire 20) until 4 May 2022 (questionnaire 26), a positive self-administered home test or a positive PCR test conducted at any organization, such as official testing for events, at work, or at school was considered as a COVID-19 diagnosis. Therefore, individuals who did not receive a doctor’s diagnosis during the specific timeframes when this was required to determine their COVID-19 status, or those who did not undergo testing from questionnaire 14 onwards, were unable to ascertain whether they were positive or negative. Consequently, this led to missing data for these patients, as their COVID-19 status remained unknown.
2.3. Statistical Analysis
All analysis were conducted using SPSS 26.01 and R 4.2.2 statistics software. Data from all 27 different questionnaires were combined and transformed into one dataset. Descriptive statistics were calculated, comparing participants who reported ever experiencing smell loss with participants who never reported experiencing smell loss. The incidence of COVID-19 positive and COVID-19 negative individuals was calculated for every separate questionnaire, each representing a time moment. The incidence is counted as the number or percentage of new cases per moment, and can differ at each time point.
To visualize the proportion of the severity rates, a heatmap was created using R 4.2.2 statistics software [
19,
20]. The time for the heatmap is recoded as the moment when the participants first experience smell or taste loss and not based on the moment of completing the questionnaire. Moments 1 to 10 represent the 10 subsequent questionnaires following onset of these symptoms. The reason for including only the 10 subsequent questionnaires after onset of symptoms is due to a high number of participants who had reported no longer experiencing smell loss or due to missing data. To investigate the duration of smell loss in both COVID-19 positive and COVID-19 negative participants, a survival analysis was conducted and visualized by the reversed Kaplan–Meier method using R 4.2.2 statistics software. As well as in the heatmap, only participants who ever reported experiencing smell or taste loss were included in the survival analysis. Having smell or taste loss was defined by a score of 2 or higher on the Likert Scale (1 = not at all, 2 = a little bit, 3 = moderately, 4 = quite a lot, 5 = severely bothered by the symptom). To account for the missing data, participants were combined into two groups (those who ever reported being COVID-19 positive and those who always reported being COVID-19 negative). This grouping was based on all collected data of the 27 questionnaires used for this study, regardless the timing of the participants’ diagnosis (
Appendix A). This amalgamation was necessary to compare these two groups in both the heatmap and in the survival analysis. In these analyses, we matched these two groups (COVID-19 positive or negative) to their reported smell loss.
3. Results
The overall average response rate for all questionnaires was 36.3%. The average number of responding participants per questionnaire was ~35,000 responders, with the initial questionnaire consisting of ~53,000 responders, who gradually reduced to ~20,000 responders in the final questionnaire [
17]. The total number of patients who responded to the COVID-19 questionnaire at least once was 235,722. The median age was 56 years (IQR 49–65). Of the participants, 13,058 (5.5%) reported having smell loss at least once, and 96,300 (40.9%) participants reported never having smell loss. In 126,364 participants (53.6%), this information was missing. Of the patients who ever had smell or taste loss, 6480 participants (49.6%) were female and 3809 (29.2%) were male. There were 4668 (35.8%) participants who were ever diagnosed with COVID-19 and 7110 (54.4%) participants who were never diagnosed with COVID-19; for 1280 patients (9.8%), this information was missing (
Table 1).
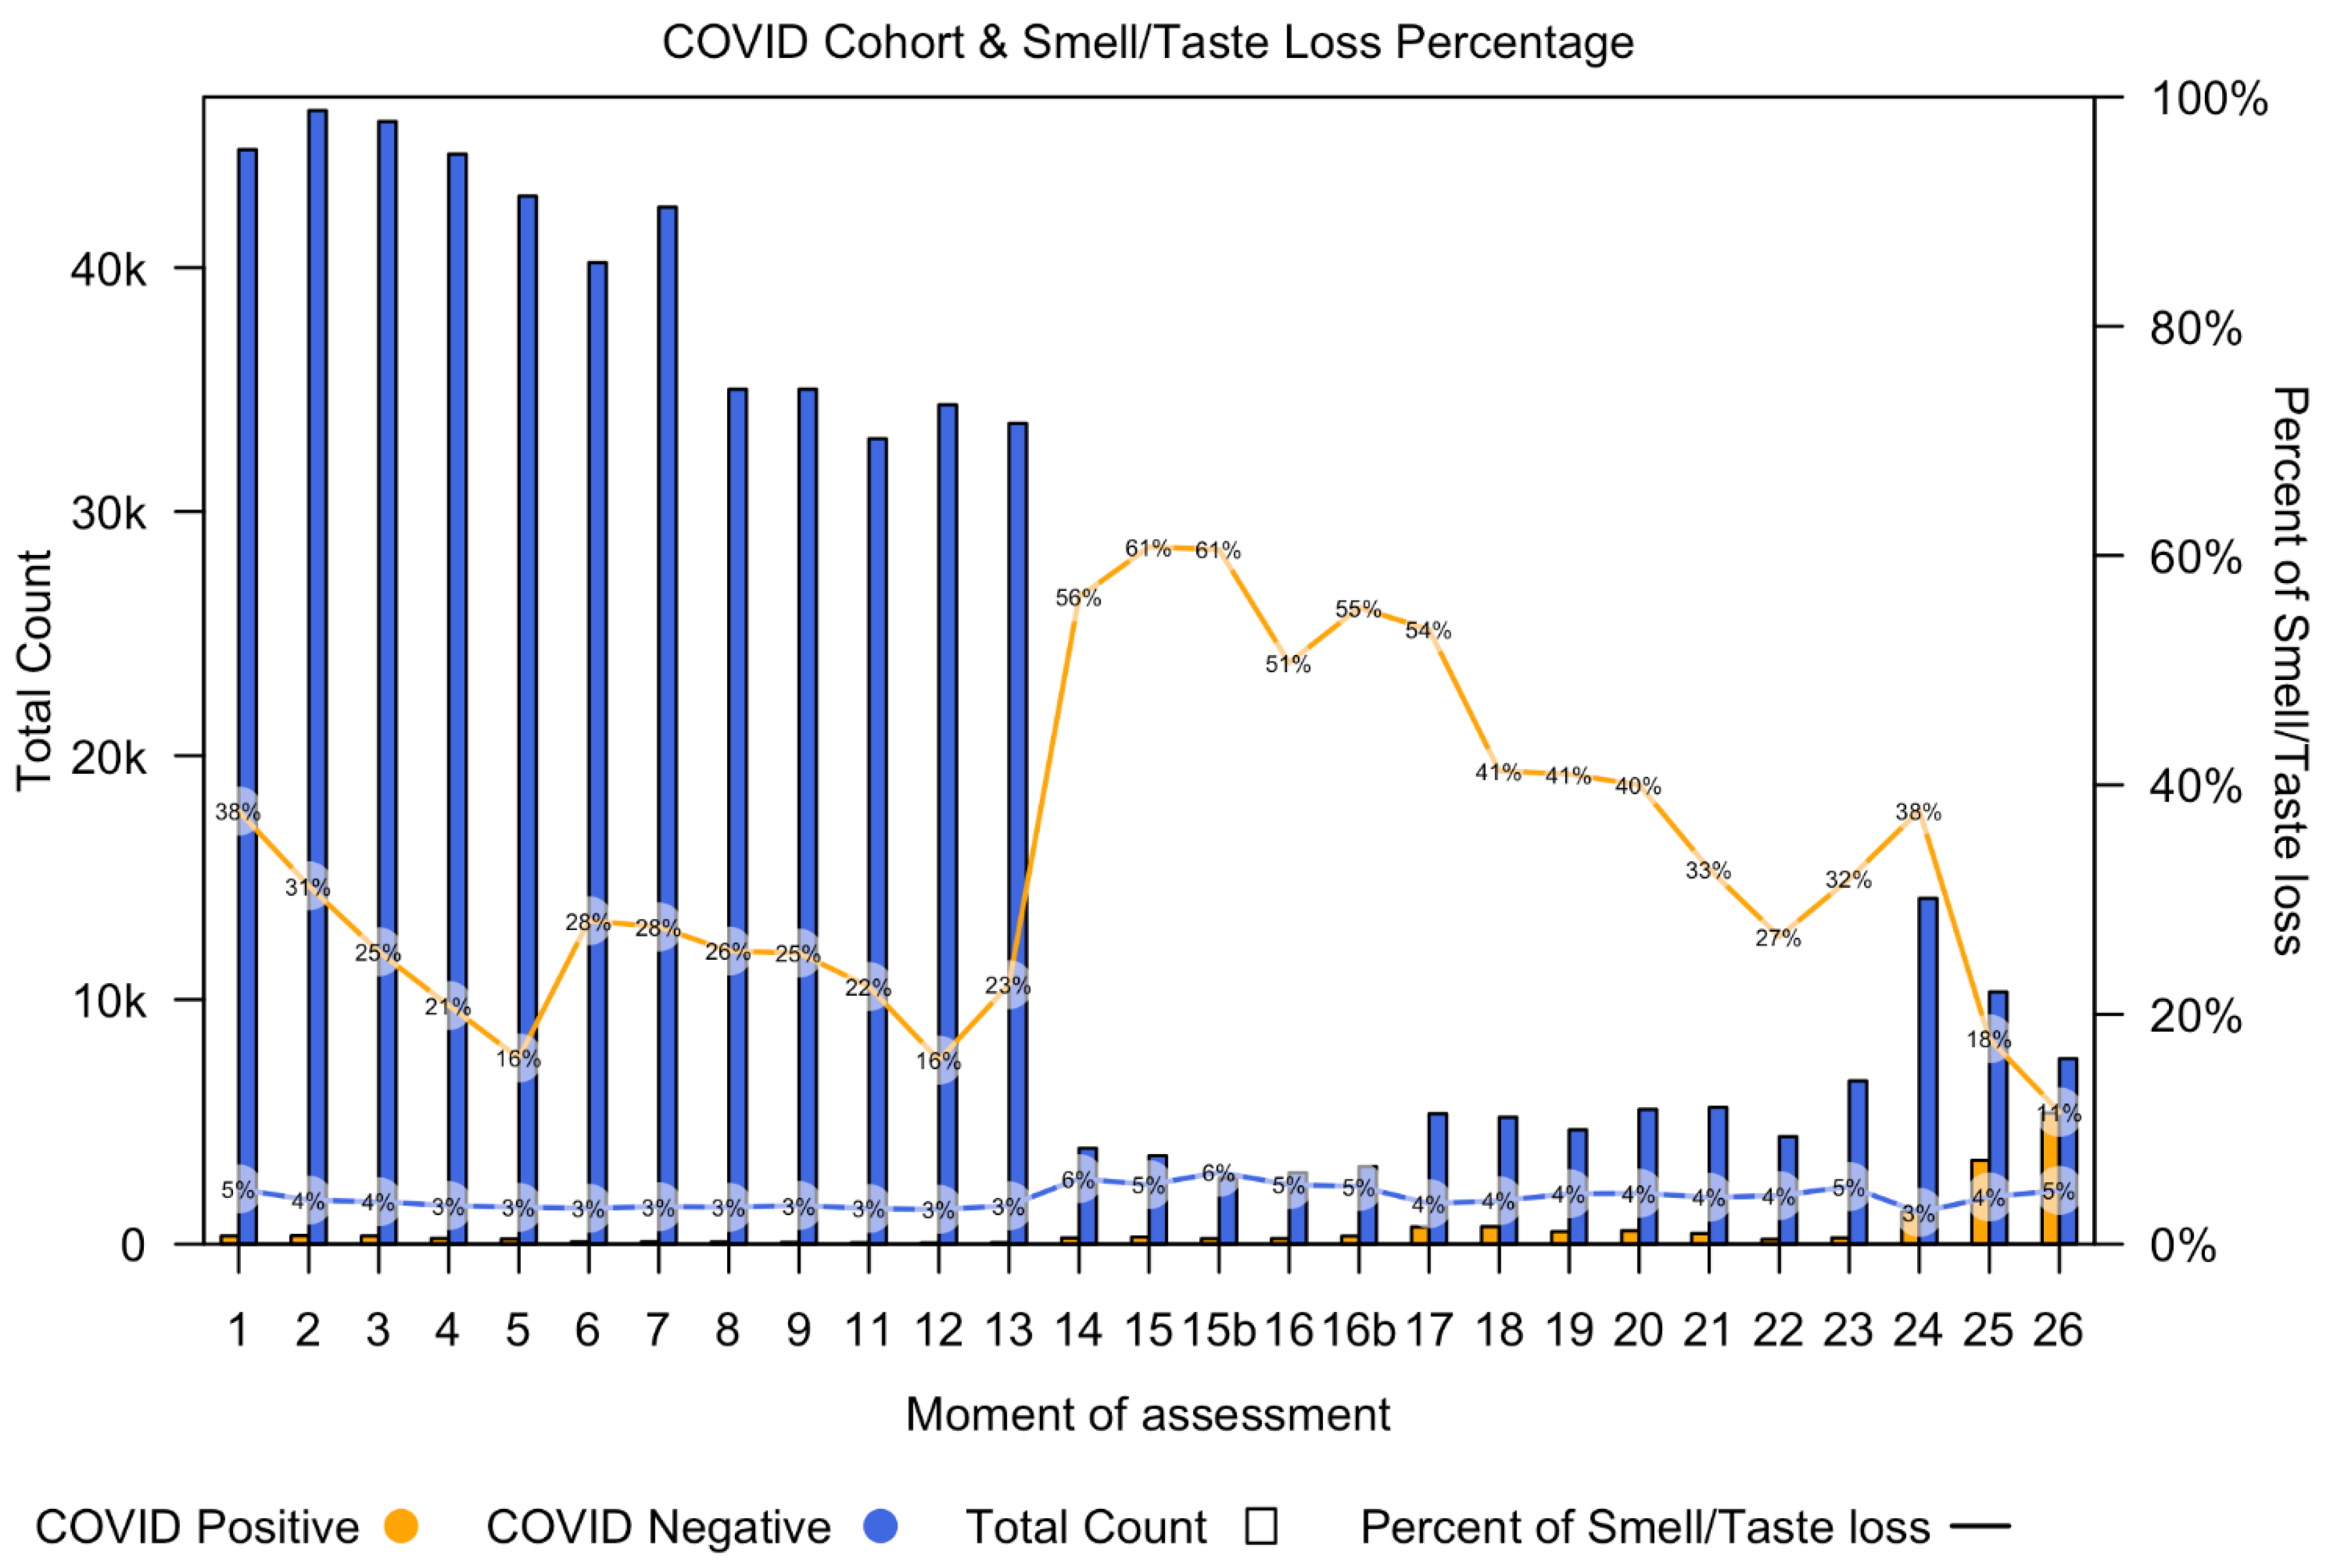
Figure 1 shows the number of COVID-19 positive participants (orange bars) and the number of COVID-19 negative participants (blue bars) per time point, starting at questionnaire 1 (30 March 2020) and going up to questionnaire 26 (4 May 2022).
Figure 1 also demonstrates the percentage of participants with smell or taste loss in both the COVID-19 positive group (orange line) and COVID-19 negative group (blue line) for each questionnaire.
From timepoint 14, the number of participants decreased, which is attributed to changes in the criteria for considering a COVID-19 positive or negative status. A doctor’s diagnosis was omitted from the questionnaire and only patients with a positive PCR test were included. As a result, patients without a positive PCR test were considered as missing data, leading to a reduced number of participants classified as either having or not having COVID-19. From questionnaire 20 onwards, self-administered home tests were added into the questionnaires. All participants, regardless of being tested for COVID-19, filled in the questions about smell or taste loss. This could be the reason for the increased incidence of smell loss in COVID-19 cases at timepoint 14.
As shown in the figure, the total number of COVID-19 negative participants is higher than the number of COVID-19 positive participants at every time point. The incidence of smell loss was higher in the COVID-19 positive group, as a consistently higher percentage of COVID-19 diagnosed participants were experiencing smell loss at all time points.
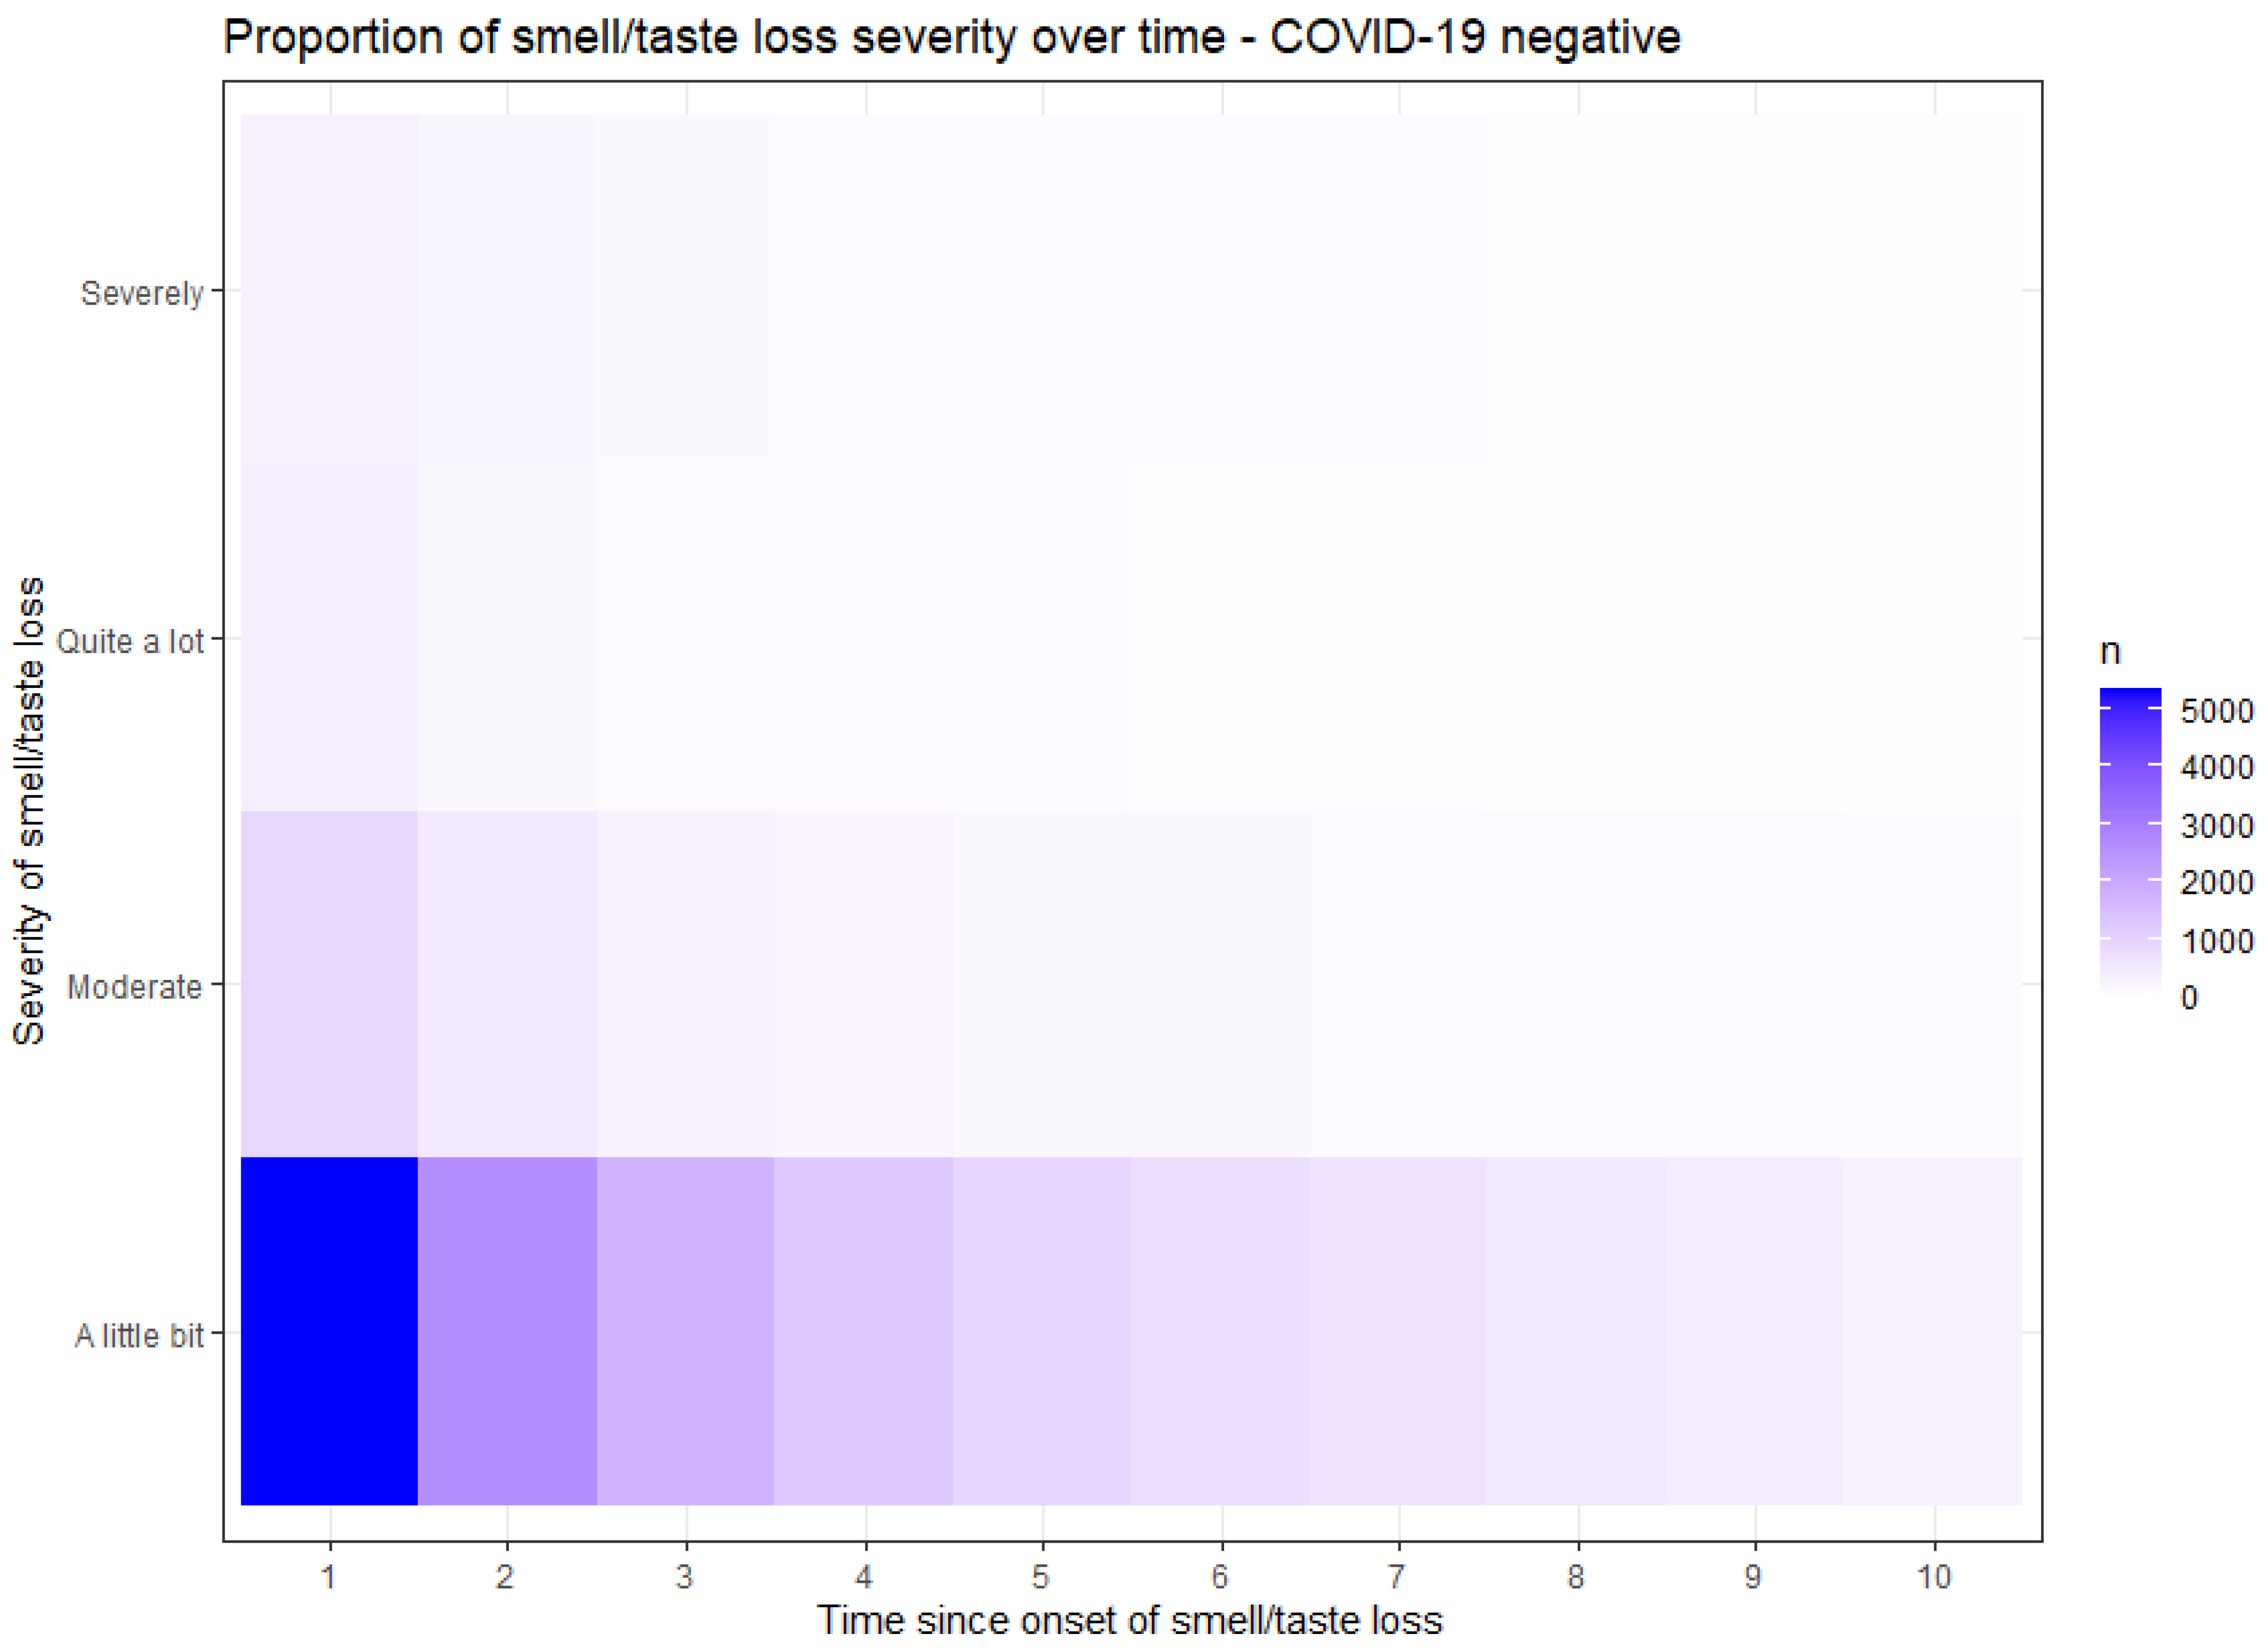
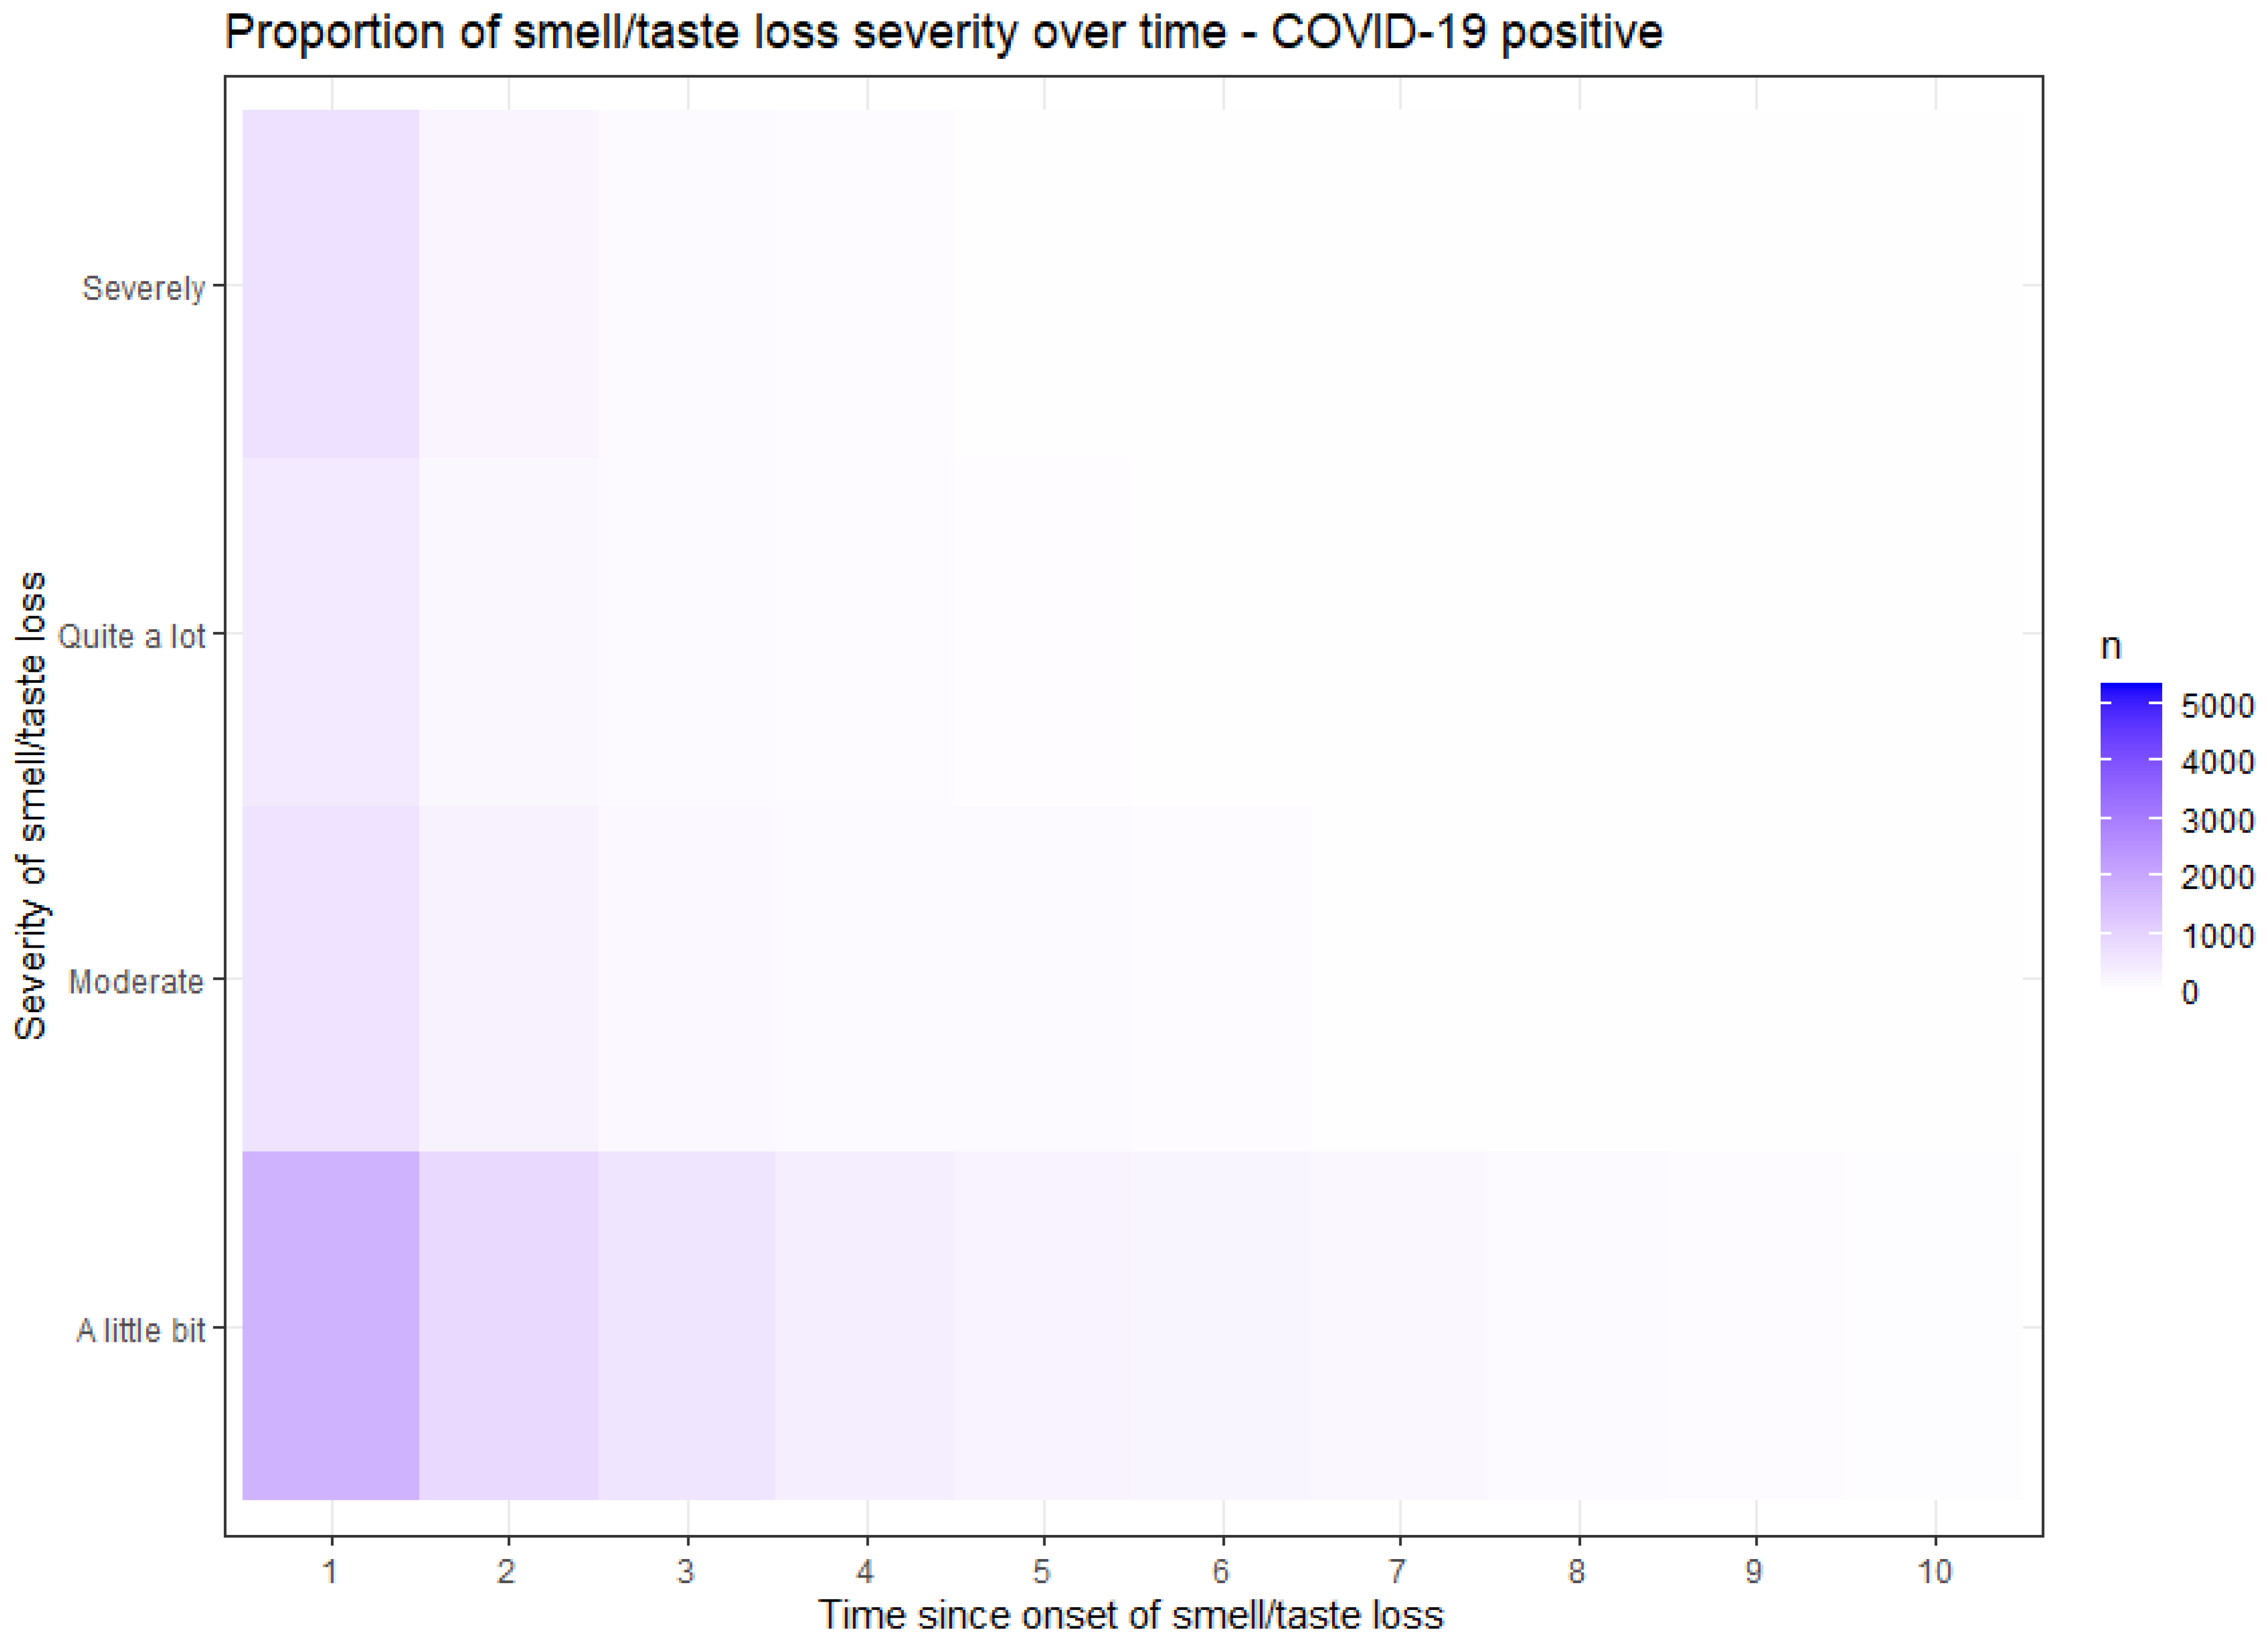
Figure 2 and
Figure 3 demonstrate the proportion of the severity of smell or taste loss within the COVID-19 positive (
Figure 2) and the COVID-19 negative (
Figure 3) group. The y-axis presents the rate of the severity. The x-axis time values are recoded; moment 1 represents the point when participants initially experienced a loss of smell or taste, irrespective of the questionnaire completion moment. The subsequent time points correspond to subsequent questionnaires in which the participants reported their ongoing loss of smell. In COVID-19 related smell or taste loss, the severity was widely distributed from ‘a little bit’ to ‘severely’ (
Figure 2). In non-COVID-19 related smell or taste loss, the severity was primarily reported as ‘a little bit’ (
Figure 3). These findings show that participants with COVID-19 related smell or taste loss experienced a higher severity than participants with other causes of these symptoms.
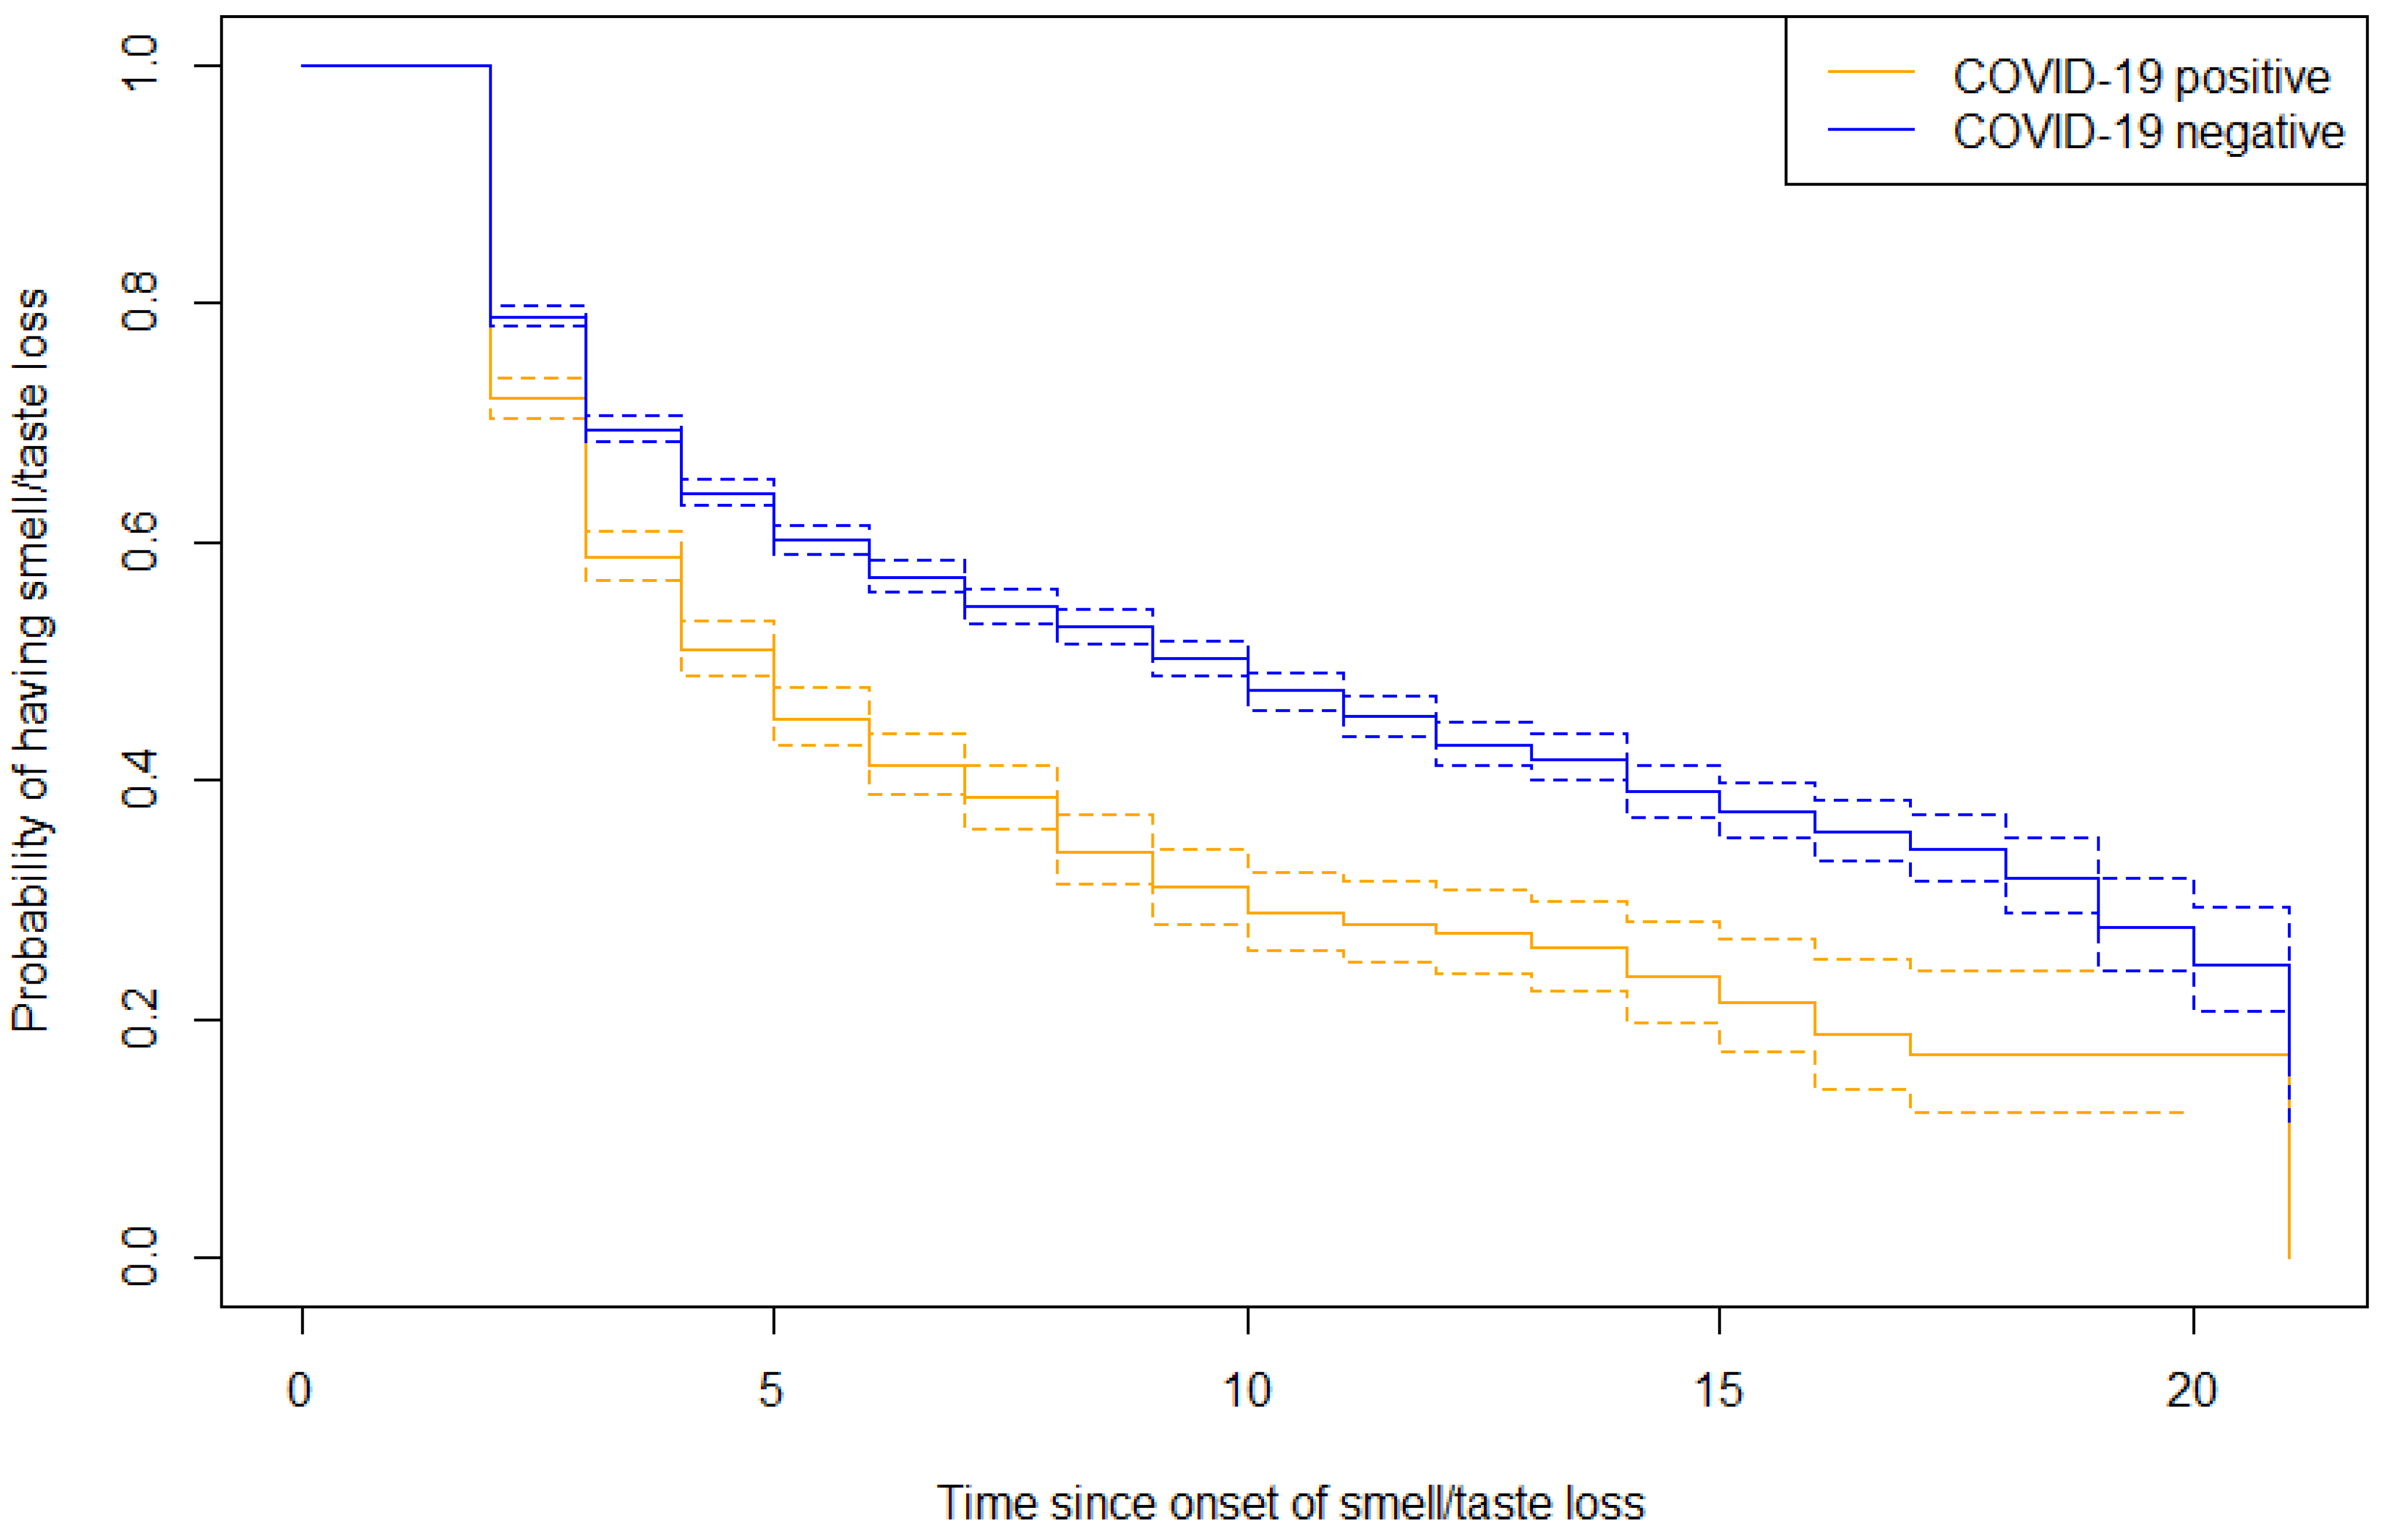
The duration of smell or taste loss in both groups was analyzed in a survival analyses and presented in a reversed Kaplan–Meier curve (
Figure 4). At the latest measured time point with ongoing symptoms, the survival outcome for COVID-19 related smell or taste loss was 0.12 (SE 0.03, 95% CI 0.07–0.21). The survival outcome for non-COVID-19 related smell or taste loss was 0.17 (SE 0.03, 95% CI 0.12–0.24). These findings suggest that non-COVID-19 related cases exhibit a more prolonged duration, compared to those associated with COVID-19.
4. Discussion
There are three main findings of this study. Firstly, we found a higher incidence of smell or taste loss among participants diagnosed with COVID-19, compared to those without COVID-19. It is noteworthy that the majority of participants, whether COVID-19 positive or negative, did not experience these symptoms. Secondly, we observed that participants with COVID-19 related smell or taste loss experienced more severe symptoms, when compared to non-COVID-19 related cases. This could be attributed to the fast and complete onset of olfactory loss in COVID-19, resulting in significant challenges in daily life [
21,
22]. Thirdly, the duration of smell or taste loss demonstrated a more favorable outcome in COVID-19 participants, as non-COVID-19 related cases were estimated to have a higher likelihood of prolonged symptoms. Consequently, individuals with smell or taste loss originating from other causes than COVID-19 may be prone to extended symptoms or potentially no complete recovery. This is not surprising, since common causes of non-COVID-19 related smell loss are mostly chronic conditions such as sinonasal disorders, post-infectious or post-traumatic disorders, aging or neurodegenerative diseases [
1,
3,
4,
13,
23,
24,
25].
The nature of this study, that relied on questionnaire data collected at various time points, comes with certain methodological limitations. The first is missing data, which resulted in temporal gaps between the presented time points. In the heatmap and survival analysis, we therefore modified the time variable to subsequent completed data since onset of symptoms.
Furthermore, it is important to acknowledge the possibility that participants may be COVID-19 positive but experience non-COVID-19 related conditions such as rhinosinusitis or allergies. In such situations, participants were allocated to the COVID-19 positive group. Alongside the fact that there were variations in criteria used for determining COVID-19 positivity or negativity throughout the study period, these factors may have led to either an underestimation or overestimation of the true underlying cause of smell and taste loss.
Despite the inherent challenges associated with data collection through questionnaires, the Lifelines cohort consists of a large and diverse sample from a general population, including multiple repeated measurements, making it highly representative of the general population in the Netherlands. Especially in comparison to other studies where only the relevant concerned participants were included [
26,
27,
28,
29], this analysis incorporated a broad group of individuals, making it possible to compare COVID-19 positive cases with COVID-19 negative cases.
Remarkably, a large group of people with non-COVID-19 related smell or taste loss was discovered in this study. These patients have been under the radar for a long time. Before the pandemic, no questions regarding smell or taste were included in any Dutch cohort [
14,
15,
16,
17,
30,
31,
32,
33,
34,
35]. Thanks to the impact of COVID-19, the senses of smell and taste have now gained attention, as well as the unfortunate consequences associated with their loss. It is important to use this momentum to focus on patients suffering from this invalidating loss, no matter the cause.
5. Conclusions
The incidence of smell or taste loss is higher and more severe when induced by COVID-19 in comparison to non-COVID-19 related smell or taste loss, but the duration is longer in non-COVID-19 related causes.
Author Contributions
Conceptualization: I.S., D.M.A.K. and E.J.A.S.; I.S. and E.J.A.S. were responsible for the methodology, the integrity and accuracy of the data and data analysis, the statistical analysis and accuracy of the data interpretation. Lifelines Corona Research Initiative provided the data. E.J.A.S., I.S. and D.M.A.K. wrote, read and approved the manuscript. All authors have read and agreed to the published version of the manuscript.
Funding
The Lifelines initiative has been made possible by subsidy from the Dutch Ministry of Health, Welfare and Sport, the Dutch Ministry of Economic Affairs, the University Medical Center Groningen (UMCG), Groningen University and the Provinces in the north of the Netherlands (Drenthe, Friesland, Groningen).
Institutional Review Board Statement
The Medical Ethical Committee of University Medical Center Groningen (2007/152) approved the Lifelines Cohort Study.
Informed Consent Statement
All Lifelines participants signed informed consent forms.
Data Availability Statement
Data may be obtained from a third party and are not publicly available.
Acknowledgments
We thank and acknowledge M. Derksen and Y. Mao in their help with conducting the analysis in R 4.2.2. statistical software. The authors wish to acknowledge the services of the Lifelines Cohort Study, the contributing research centers delivering data to Lifelines, and all the study participants.
Conflicts of Interest
The authors declare no conflict of interest.
Appendix A
Table A1 shows the 27 COVID-19 questionnaires (COVQ) used for this study, with the time period of assessment and their response rates [
17]. Questionnaire 10 did not contain questions about smell/taste or COVID-19 and is therefore not included.
Table A1.
The 27 COVID-19 questionnaires (COVQ) used for this study.
Table A1.
The 27 COVID-19 questionnaires (COVQ) used for this study.
| COVQ | Date | Response | Response Rate |
|---|
| 1 | 30 March to 23 April 2020 | ~53,000 | 41% |
| 2 | 2 April to 6 May 2020 | ~51,000 | 39% |
| 3 | 12 April to 6 May 2020 | ~50,000 | 38% |
| 4 | 16 April to 13 May 2020 | ~47,000 | 36% |
| 5 | 19 April to 20 May 2020 | ~45,000 | 35% |
| 6 | 28 April to 27 May 2020 | ~43,000 | 33% |
| 7 | 15 May to 29 May 2020 | ~45,000 | 34% |
| 8 | 23 May to 24 June 2020 | ~38,000 | 34% |
| 9 | 11 June to 29 June 2020 | ~37,000 | 33% |
| 10 | 7 July to 29 July 2020 | ~33,000 | 30% |
| 11 | 10 July to 5 August 2020 | ~35,000 | 32% |
| 12 | 24 July to 2 September 2020 | ~36,000 | 32% |
| 13 | 8 September to 30 September 2020 | ~35,000 | 32% |
| 14 | 13 October to 4 November 2020 | ~34,000 | 31% |
| 15 | 2 November to 26 November 2020 | ~34,000 | 31% |
| 15 b | 15 November to 10 December 2020 | ~33,000 | 30% |
| 16 | 2 December to 21 December 2020 | ~31,000 | 28% |
| 16 b | 8 December to 5 January 2021 | ~32,000 | 29% |
| 17 | 5 January to 8 February2021 | ~34,000 | 31% |
| 18 | 25 February to 25 March 2021 | ~32,000 | 49% |
| 19 | 29 March to 22 April 2021 | ~29,000 | 45% |
| 20 | 26 April to 20 May 2021 | ~29,000 | 44% |
| 21 | 25 May to 18 June 2021 | ~29,000 | 45% |
| 22 | 4 July to 30 July 2021 | ~24,000 | 36% |
| 23 | 11 October to 4 November2021 | ~23,000 | 37% |
| 24 | 20 December 2021 to 12 January 2022 | ~25,000 | 48% |
| 25 | 28 February to 24 March 2022 | ~20,000 | 38% |
| 26 | 11 April to 4 May 2022 | ~20,000 | 40% |
References
- Murphy, C. Prevalence of Olfactory Impairment in Older Adults. JAMA 2002, 288, 2307. [Google Scholar] [CrossRef] [PubMed]
- Frye, R.E.; Schwartz, B.S.; Doty, R.L. Dose-Related Effects of Cigarette Smoking on Olfactory Function. JAMA 1990, 263, 1233–1236. [Google Scholar] [CrossRef] [PubMed]
- Doty, R.L.; Shaman, P.; Applebaum, S.L.; Giberson, R.; Siksorski, L.; Rosenberg, L. Smell Identification Ability: Changes with Age. Science 1984, 226, 1441–1443. [Google Scholar] [CrossRef] [PubMed]
- Merkonidis, C.; Grosse, F.; Ninh, T.; Hummel, C.; Haehner, A.; Hummel, T. Characteristics of Chemosensory Disorders—Results from a Survey. Eur. Arch. Oto-Rhino-Laryngol. 2015, 272, 1403–1416. [Google Scholar] [CrossRef] [PubMed]
- Parma, V.; Ohla, K.; Veldhuizen, M.G.; Niv, M.Y.; Kelly, C.E.; Bakke, A.J.; Cooper, K.W.; Bouysset, C.; Pirastu, N.; Dibattista, M.; et al. More Than Smell—COVID-19 Is Associated With Severe Impairment of Smell, Taste, and Chemesthesis. Chem. Senses 2020, 45, 609–622. [Google Scholar] [CrossRef] [PubMed]
- Frasnelli, J.; Hummel, T. Interactions between the Chemical Senses: Trigeminal Function in Patients with Olfactory Loss. Int. J. Psychophysiol. 2007, 65, 177–181. [Google Scholar] [CrossRef]
- Elvan-Tuz, A.; Karadag-Oncel, E.; Kiran, S.; Kanik-Yuksek, S.; Gulhan, B.; Hacimustafaoglu, M.; Ozdem-Alatas, S.; Kuyucu, N.; Ozdemir, H.; Egil, O.; et al. Prevalence of Anosmia in 10.157 Pediatric COVID-19 Cases. Pediatr. Infect. Dis. J. 2022, 41, 473–477. [Google Scholar] [CrossRef]
- Tong, J.Y.; Wong, A.; Zhu, D.; Fastenberg, J.H.; Tham, T. The Prevalence of Olfactory and Gustatory Dysfunction in COVID-19 Patients: A Systematic Review and Meta-analysis. Otolaryngol. Head. Neck Surg. 2020, 163, 3–11. [Google Scholar] [CrossRef]
- Centers for Disease Control & Prevention. How to Protect Yourself and Others Know How It Spreads; Centers for Disease Control & Prevention: Atlanta, GA, USA, 2021. [Google Scholar]
- Boscolo-Rizzo, P.; Polesel, J.; Spinato, G.; Menegaldo, A.; Fabbris, C.; Calvanese, L.; Borsetto, D.; Hopkins, C. Predominance of an Altered Sense of Smell or Taste among Long-Lasting Symptoms in Patients with Mildly Symptomatic COVID-19. Rhinol. J. 2020, 58, 524–525. [Google Scholar] [CrossRef]
- Ballering, A.V.; van Zon, S.K.R.; olde Hartman, T.C.; Rosmalen, J.G.M. Persistence of Somatic Symptoms after COVID-19 in the Netherlands: An Observational Cohort Study. Lancet 2022, 400, 452–461. [Google Scholar] [CrossRef]
- Nasserie, T.; Hittle, M.; Goodman, S.N. Assessment of the Frequency and Variety of Persistent Symptoms among Patients with COVID-19: A Systematic Review. JAMA Netw. Open 2021, 4, e2111417. [Google Scholar] [CrossRef] [PubMed]
- Nordin, S.; Brämerson, A. Complaints of Olfactory Disorders: Epidemiology, Assessment and Clinical Implications. Curr. Opin. Allergy Clin. Immunol. 2008, 8, 10–15. [Google Scholar] [CrossRef]
- Scholtens, S.; Smidt, N.; Swertz, M.A.; Bakker, S.J.L.; Dotinga, A.; Vonk, J.M.; Van Dijk, F.; Van Zon, S.K.R.; Wijmenga, C.; Wolffenbuttel, B.H.R.; et al. Cohort Profile: LifeLines, a Three-Generation Cohort Study and Biobank. Int. J. Epidemiol. 2015, 44, 1172–1180. [Google Scholar] [CrossRef] [PubMed]
- Klijs, B.; Scholtens, S.; Mandemakers, J.J.; Snieder, H.; Stolk, R.P.; Smidt, N. Representativeness of the LifeLines Cohort Study. PLoS ONE 2015, 10, e0137203. [Google Scholar] [CrossRef]
- Sijtsma, A.; Rienks, J.; van der Harst, P.; Navis, G.; Rosmalen, J.G.M.; Dotinga, A. Cohort Profile Update: Lifelines, a Three-Generation Cohort Study and Biobank. Int. J. Epidemiol. 2022, 51, e295–e302. [Google Scholar] [CrossRef] [PubMed]
- McIntyre, K.; Lanting, P.; Deelen, P.; Wiersma, H.H.; Vonk, J.M.; Ori, A.P.S.; Jankipersadsing, S.A.; Warmerdam, R.; Van Blokland, I.; Boulogne, F.; et al. Lifelines COVID-19 Cohort: Investigating COVID-19 Infection and Its Health and Societal Impacts in a Dutch Population-Based Cohort. BMJ Open 2021, 11, e044474. [Google Scholar] [CrossRef]
- Rossato, M.; Di Vincenzo, A.; Andrisani, A.; Marin, L.; Capone, F.; Vettor, R. Re: “Sex and Gender-Related Differences in COVID-19 Diagnoses and SARS-CoV-2 Testing Practices During the First Wave of the Pandemic: The Dutch Lifelines COVID-19 Cohort Study” by Ballering et al. J. Womens Health 2022, 31, 895–896. [Google Scholar] [CrossRef]
- Wickham, H.; François, R.; Henry, L.; Müller, K.; Vaughan, D. Dplyr: A Grammar of Data Manipulation. 2023. Available online: https://dplyr.tidyverse.org (accessed on 14 September 2023).
- Therneau, T.M.; Grambsch, P.M. Modeling Survival Data: Extending the Cox Model; Springer: New York, NY, USA, 2000. [Google Scholar]
- Saniasiaya, J.; Prepageran, N. Impact of Olfactory Dysfunction on Quality of Life in Coronavirus Disease 2019 Patients: A Systematic Review. J. Laryngol. Otol. 2021, 135, 947–952. [Google Scholar] [CrossRef]
- Wei, G.; Gu, J.; Gu, Z.; Du, C.; Huang, X.; Xing, H.; Li, L.; Zhang, A.; Hu, X.; Huo, J. Olfactory Dysfunction in Patients With Coronavirus Disease 2019: A Review. Front. Neurol. 2022, 12, 783249. [Google Scholar] [CrossRef]
- Hoffman, H.J.; Ishii, E.K.; Macturk, R.H. Age-Related Changes in the Prevalence of Smell/Taste Problems among the United States Adult Population: Results of the 1994 Disability Supplement to the National Health Interview Survey (NHIS). Ann. N. Y. Acad. Sci. 1998, 855, 716–722. [Google Scholar] [CrossRef]
- Wysocki, C.J.; Gilbert, A.N. National Geographic Smell Survey: Effects of Age Are Heterogenous. Ann. N. Y. Acad. Sci. 1989, 561, 12–28. [Google Scholar] [CrossRef]
- Temmel, A.F.P.; Quint, C.; Schickinger-Fischer, B.; Klimek, L.; Stoller, E.; Hummel, T. Characteristics of Olfactory Disorders in Relation to Major Causes of Olfactory Loss. Arch. Otolaryngol. Head. Neck Surg. 2002, 128, 635. [Google Scholar] [CrossRef]
- Tran, V.-T.; Porcher, R.; Pane, I.; Ravaud, P. Course of Post COVID-19 Disease Symptoms over Time in the ComPaRe Long COVID Prospective e-Cohort. Nat. Commun. 2022, 13, 1812. [Google Scholar] [CrossRef]
- Ohla, K.; Veldhuizen, M.G.; Green, T.; Hannum, M.E.; Bakke, A.J.; Moein, S.T.; Tognetti, A.; Postma, E.M.; Pellegrino, R.; Hwang, D.L.D.; et al. A Follow-up on Quantitative and Qualitative Olfactory Dysfunction and Other Symptoms in Patients Recovering from COVID-19 Smell Loss. Rhinol. J. 2022, 6, 207–217. [Google Scholar] [CrossRef]
- Makaronidis, J.; Firman, C.; Magee, C.G.; Mok, J.; Balogun, N.; Lechner, M.; Carnemolla, A.; Batterham, R.L. Distorted Chemosensory Perception and Female Sex Associate with Persistent Smell and/or Taste Loss in People with SARS-CoV-2 Antibodies: A Community Based Cohort Study Investigating Clinical Course and Resolution of Acute Smell and/or Taste Loss in People with and without SARS-CoV-2 Antibodies in London, UK. BMC Infect. Dis. 2021, 21, 221. [Google Scholar] [CrossRef]
- Borch, L.; Holm, M.; Knudsen, M.; Ellermann-Eriksen, S.; Hagstroem, S. Long COVID Symptoms and Duration in SARS-CoV-2 Positive Children—A Nationwide Cohort Study. Eur. J. Pediatr. 2022, 181, 1597–1607. [Google Scholar] [CrossRef]
- Huisman, M.; Poppelaars, J.; van der Horst, M.; Beekman, A.T.; Brug, J.; van Tilburg, T.G.; Deeg, D.J. Cohort Profile: The Longitudinal Aging Study Amsterdam. Int. J. Epidemiol. 2011, 40, 868–876. [Google Scholar] [CrossRef]
- van den Brandt, P.A.; Goldbohm, R.A.; Van ’T Veer, P.; Volovics, A.; Hermus, R.J.J.; Sturmans, F. A Large-Scale Prospective Cohort Study on Diet and Cancer in the Netherlands. J. Clin. Epidemiol. 1990, 43, 285–295. [Google Scholar] [CrossRef]
- Van Den Brandt, P.A.; Schouten, L.J.; Goldbohm, R.A.; Dorant, E.; Hunen, P.M.H. Development of a Record Linkage Protocol for Use in the Dutch Cancer Registry for Epidemiological Research. Int. J. Epidemiol. 1990, 19, 553–558. [Google Scholar] [CrossRef]
- Schulpen, M.; van den Brandt, P.A. Mediterranean Diet Adherence and Risk of Colorectal Cancer: The Prospective Netherlands Cohort Study. Eur. J. Epidemiol. 2020, 35, 25–35. [Google Scholar] [CrossRef]
- Volovics, A.; Van Brandt, P.A. Den Methods for the Analyses of Case-Cohort Studies. Biom. J. 1997, 39, 195–214. [Google Scholar] [CrossRef]
- Kooijman, M.N.; Kruithof, C.J.; van Duijn, C.M.; Duijts, L.; Franco, O.H.; van IJzendoorn, M.H.; de Jongste, J.C.; Klaver, C.C.W.; van der Lugt, A.; Mackenbach, J.P.; et al. The Generation R Study: Design and Cohort Update 2017. Eur. J. Epidemiol. 2016, 31, 1243–1264. [Google Scholar] [CrossRef] [PubMed]
| Disclaimer/Publisher’s Note: The statements, opinions and data contained in all publications are solely those of the individual author(s) and contributor(s) and not of MDPI and/or the editor(s). MDPI and/or the editor(s) disclaim responsibility for any injury to people or property resulting from any ideas, methods, instructions or products referred to in the content. |
© 2023 by the authors. Licensee MDPI, Basel, Switzerland. This article is an open access article distributed under the terms and conditions of the Creative Commons Attribution (CC BY) license (https://creativecommons.org/licenses/by/4.0/).


 ,
, 