
Analysis of P(v-a)CO2/C(a-v)O2 Ratio and Other Perfusion Markers in a Population of 98 Pediatric Patients Undergoing Cardiac Surgery
 ,
,  ,
, 
Abstract
:1. Introduction
2. Materials and Methods
- Age and anthropometric measurements (weight and length);
- Type of congenital heart disease (both cyanotic and acyanotic) and type of surgery;
- Pre- and post-surgery laboratory tests (serum creatinine and hemoglobin);
- Intraoperative data (length of CPB, need for transfusions, renal and cerebral near-infrared spectroscopy [NIRS], and body temperature);
- Post-operative data (hemodynamic instability, renal and cerebral near-infrared spectroscopy [NIRS] and body temperature, vasopressor/inotrope infusion, need for mechanical circulation support).
- At anesthesia induction (pre-CPB).
- At CPB discontinuation.
- Upon ICU admission.
- Before extubation.
- After extubation.
- Before ICU discharge.
- At any significant hemodynamic change (patient needing fluid and/or pharmacologic therapy).
3. Results
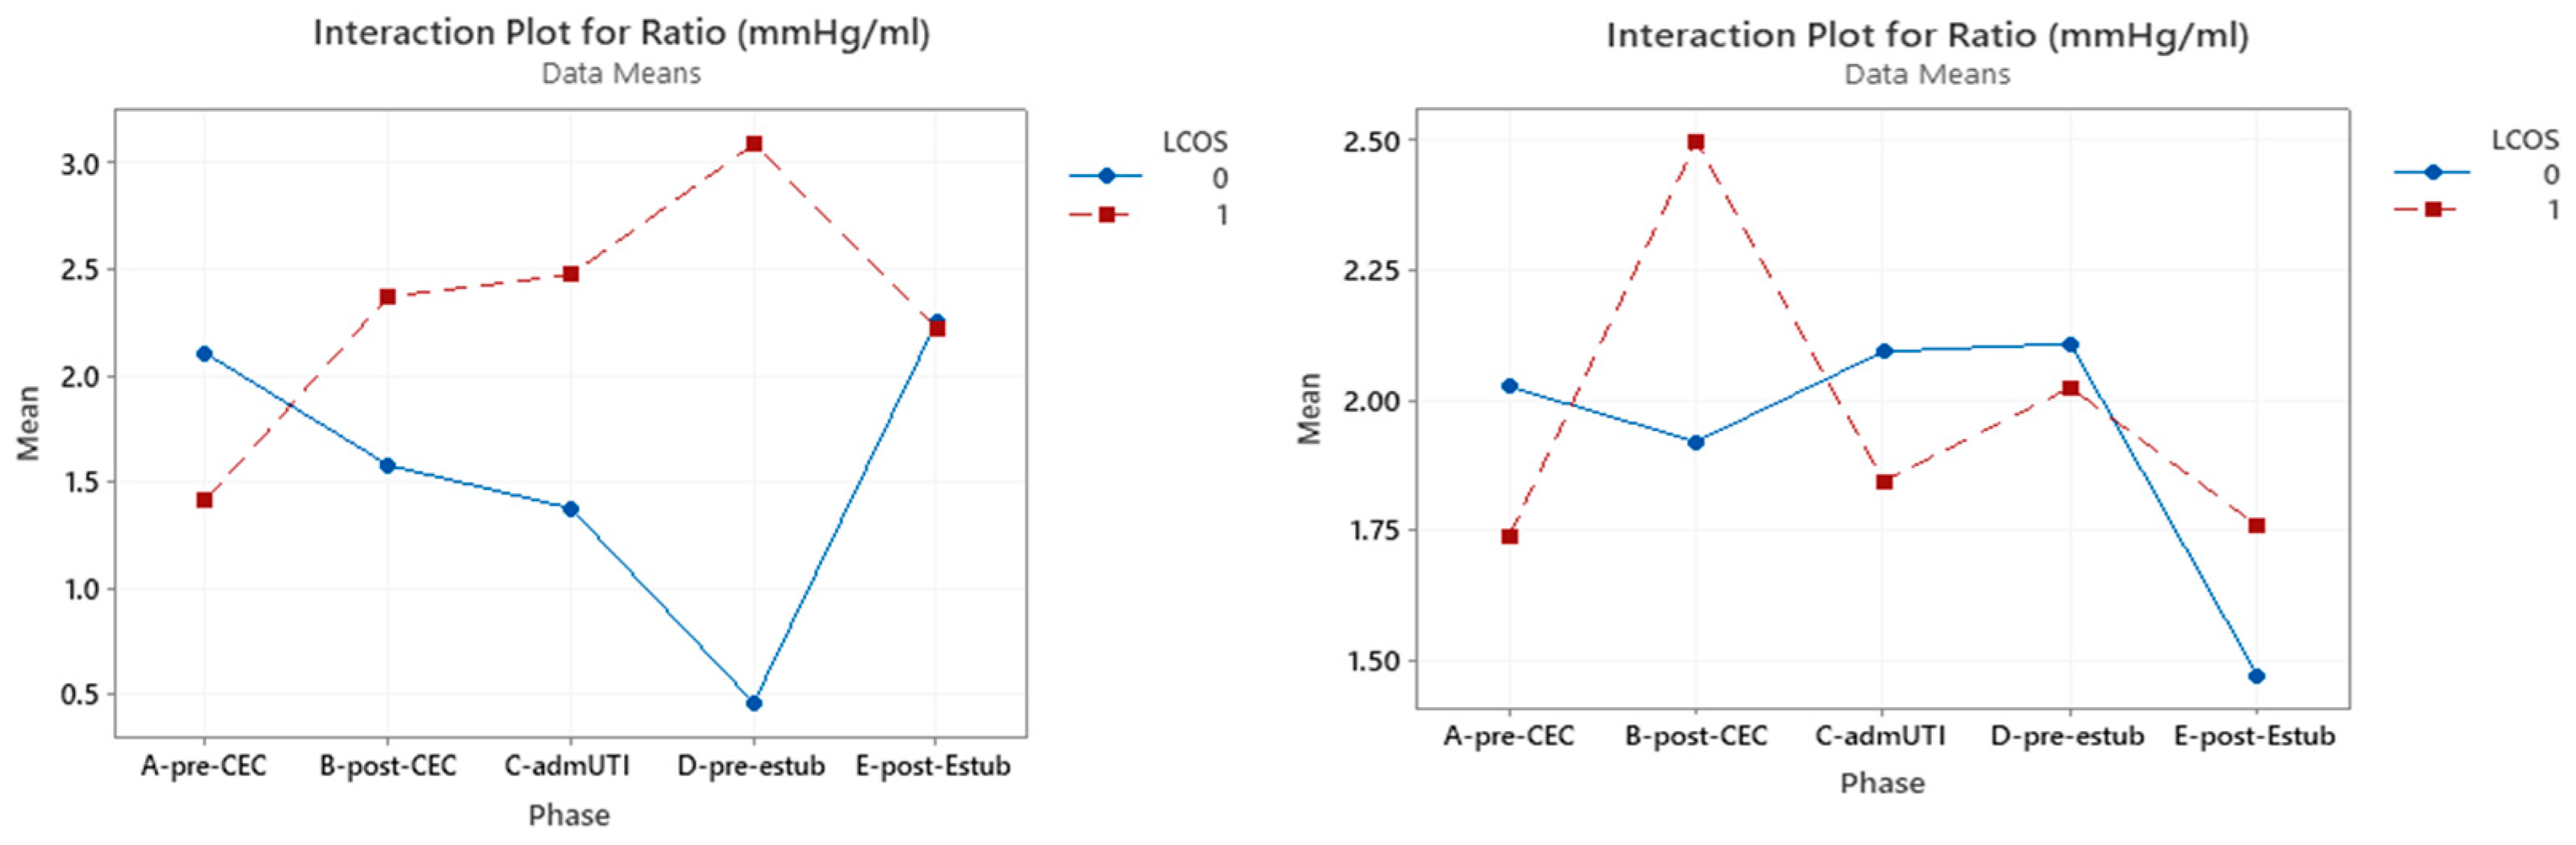
3.1. P(v-a)CO2/C(a-v)O2 Ratio
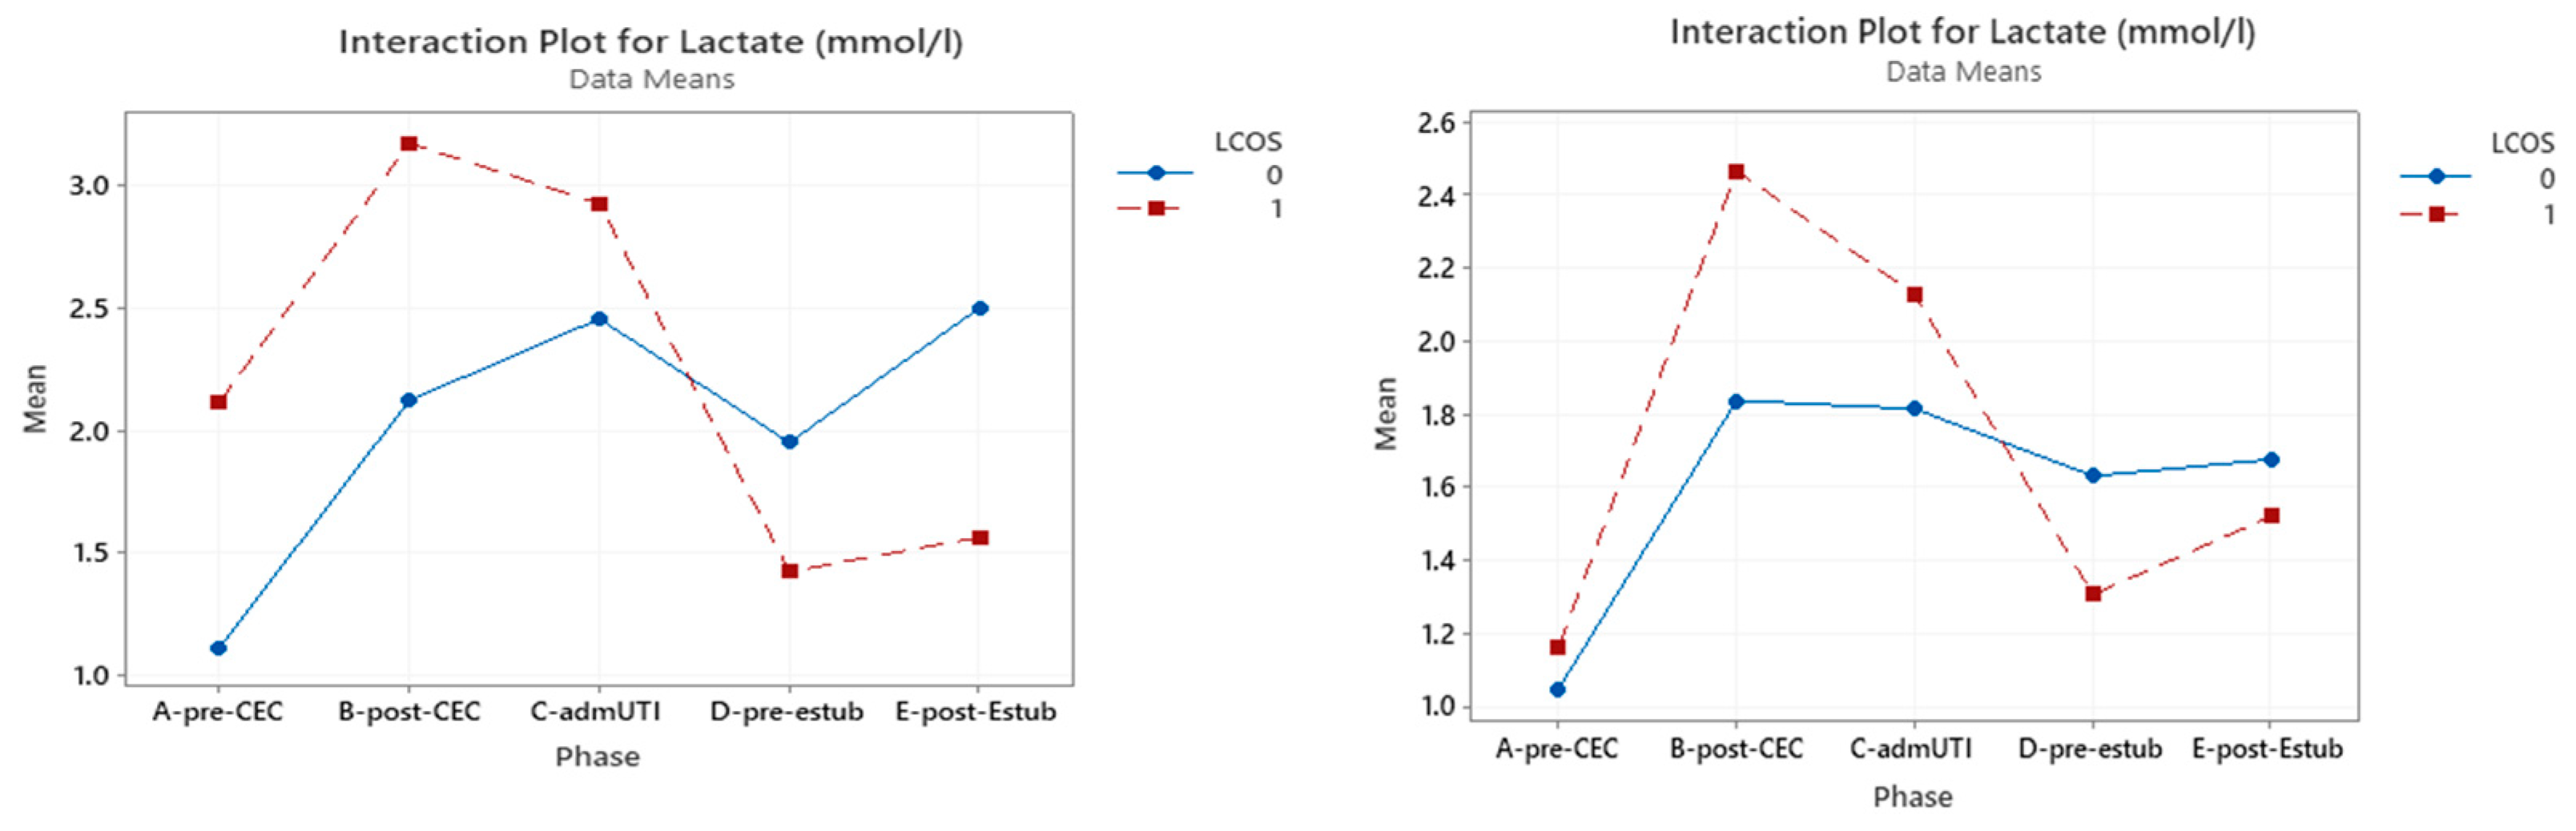
3.2. Serum Lactates
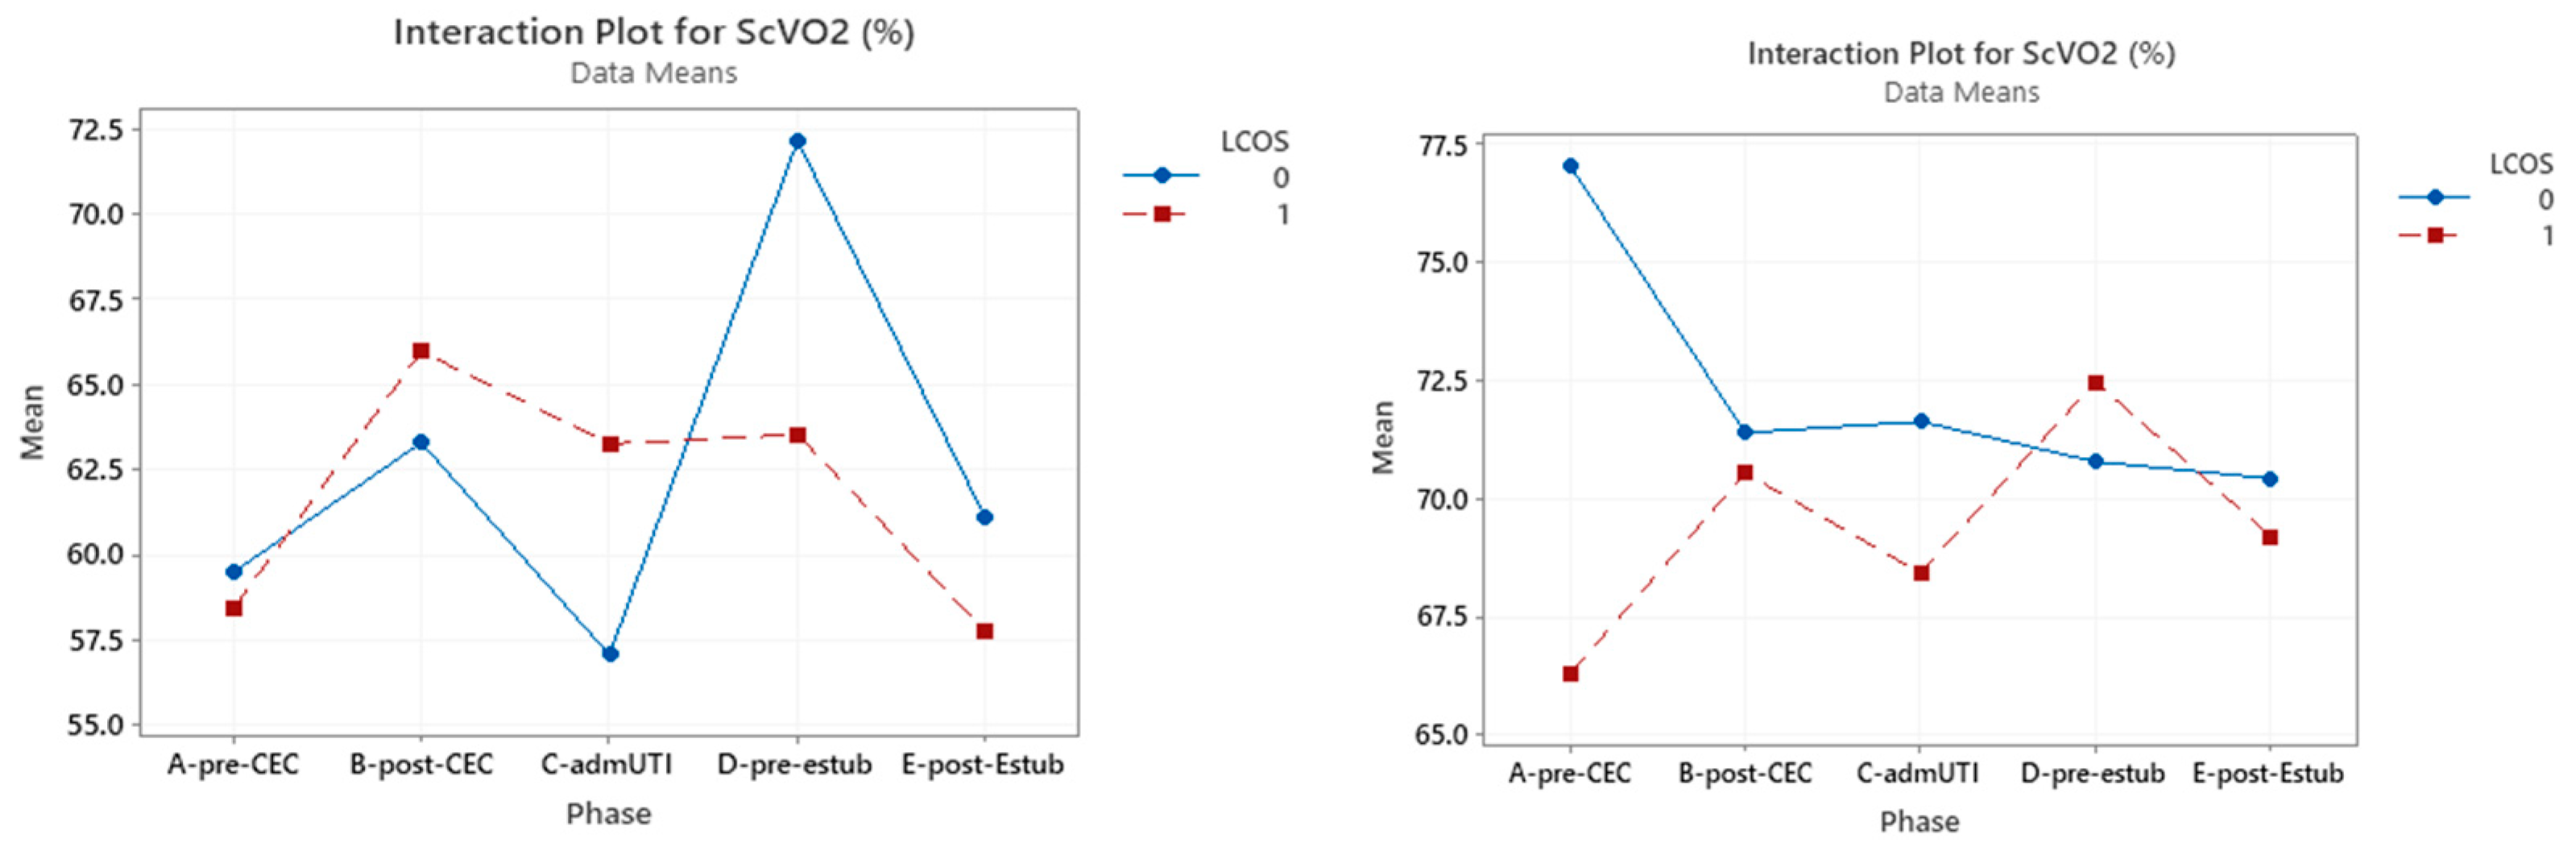
3.3. ScVO2
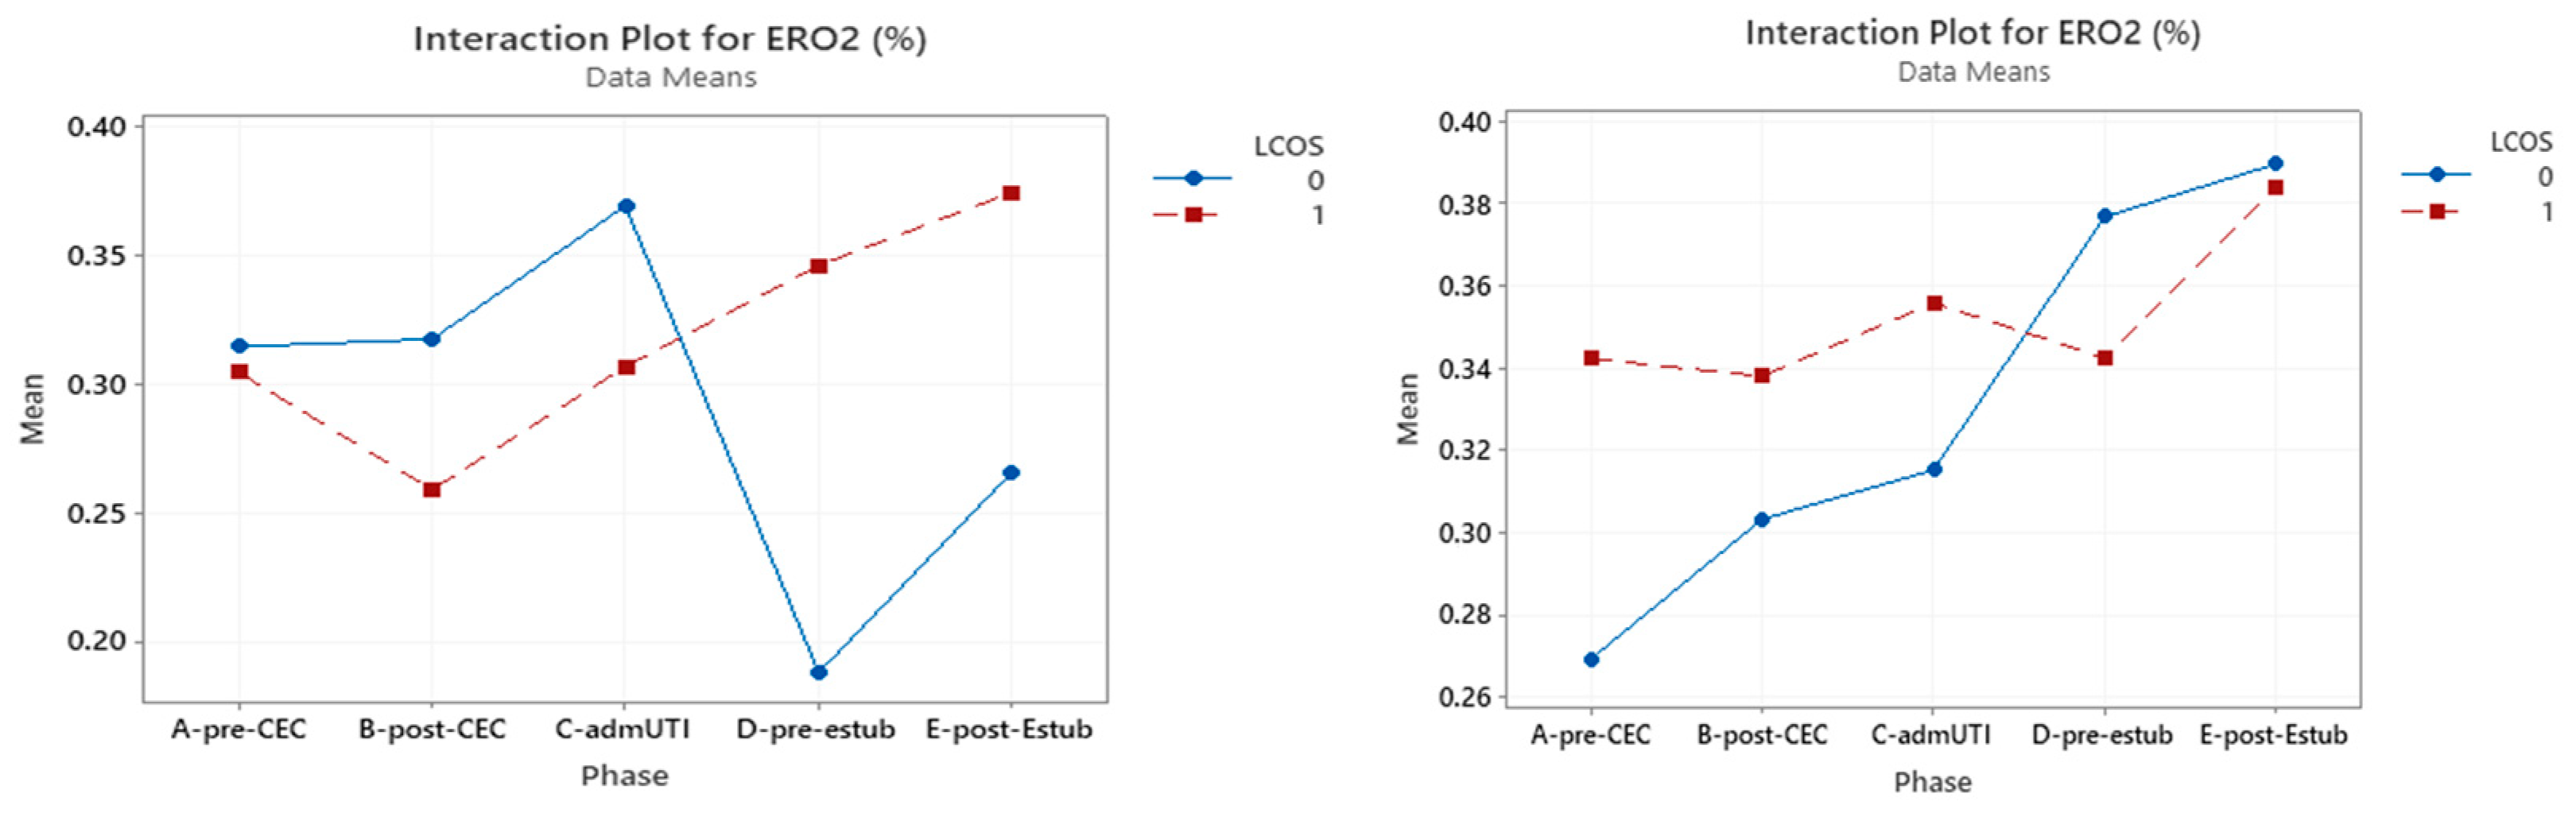
3.4. ERO2
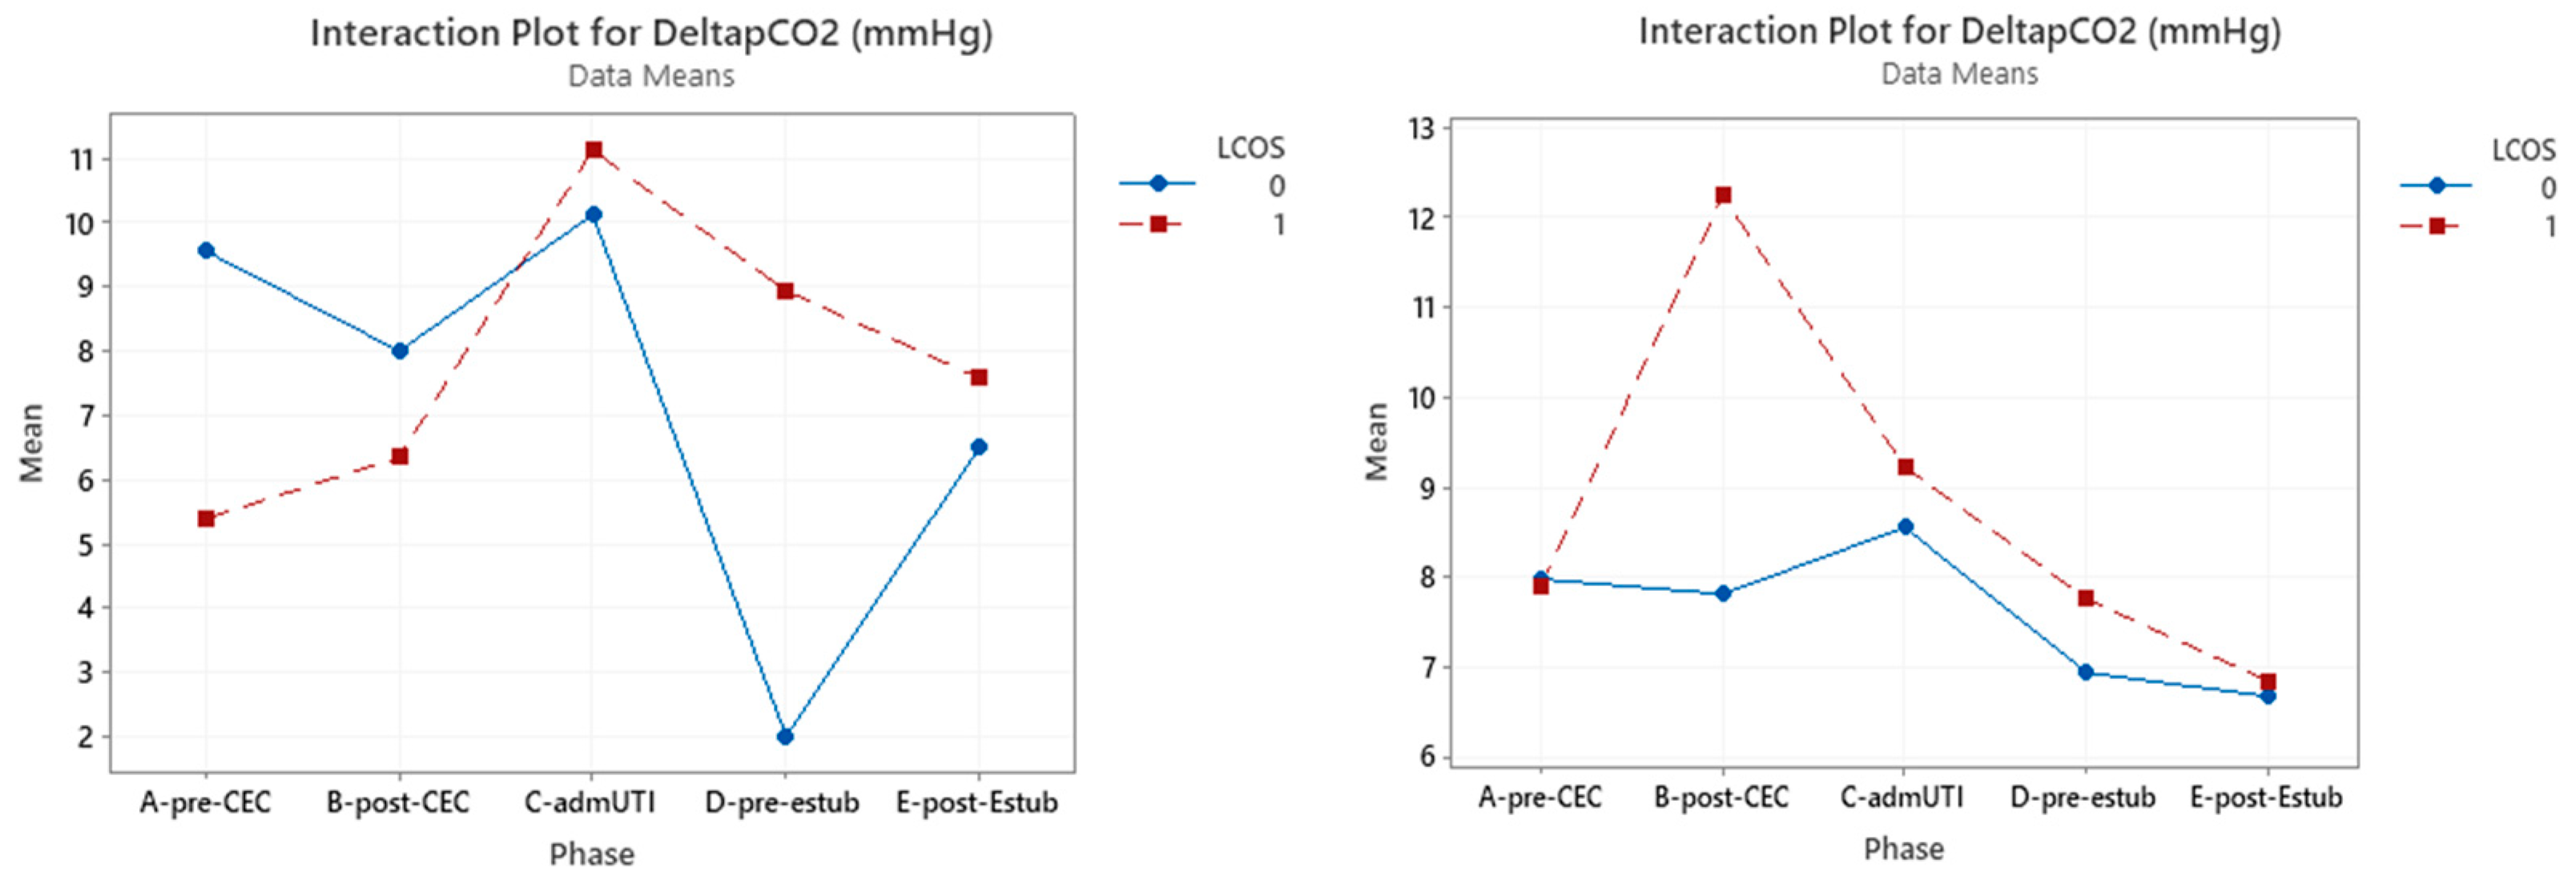
3.5. ΔP(v-a)CO2
4. Discussion
5. Conclusions
Supplementary Materials
Author Contributions
Funding
Institutional Review Board Statement
Informed Consent Statement
Data Availability Statement
Conflicts of Interest
References
- Whitson, B.A. Commentary: Low cardiac output syndrome: A definition or a diagnosis code? J. Thorac. Cardiovasc. Surg. 2022, 163, 1902–1903. [Google Scholar] [CrossRef] [PubMed]
- Algarni, K.D.; Maganti, M.; Yau, T.M. Predictors of low cardiac output syndrome after isolated coronary artery bypass surgery: Trends over 20 years. Ann. Thorac. Surg. 2011, 92, 1678–1684. [Google Scholar] [CrossRef] [PubMed]
- Rihal, C.S.; Naidu, S.S.; Givertz, M.M.; Szeto, W.Y.; Burke, J.A.; Kapur, N.K.; Kern, M.; Garratt, K.N.; Goldstein, J.A.; Dimas, V.; et al. 2015 SCAI/ACC/HFSA/STS Clinical Expert Consensus Statement on the Use of Percutaneous Mechanical Circulatory Support Devices in Cardiovascular Care: Endorsed by the American Heart Assocation, the Cardiological Society of India, and Sociedad Latino Americana de Cardiologia Intervencion; Affirmation of Value by the Canadian Association of Interventional Cardiology-Association Canadienne de Cardiologie d’intervention. J. Am. Coll. Cardiol. 2015, 65, e7–e26. [Google Scholar] [CrossRef] [PubMed]
- Parr, G.V.; Blackstone, E.H.; Kirklin, J.W. Cardiac performance and mortality early after intracardiac surgery in infants and young children. Circulation 1975, 51, 867–874. [Google Scholar] [CrossRef]
- Johnson, W.H. Pediatric Cardiology: The Essential Pocket Guide, 3rd ed.; John Wiley and Sons: Hoboken, NJ, USA, 2014. [Google Scholar]
- Bailey, J.M.; Hoffman, T.M.; Wessel, D.L.; Nelson, D.P.; Atz, A.M.; Chang, A.C.; Kulik, T.J.; Spray, T.L.; Akbary, A.; Miller, R.P.; et al. A population pharmacokinetic analysis of milrinone in pediatric patients after cardiac surgery. J. Pharmacokinet. Pharmacodyn. 2004, 31, 43–59. [Google Scholar] [CrossRef]
- Monnet, X.; Julien, F.; Ait-Hamou, N.; Lequoy, M.; Gosset, C.; Jozwiak, M.; Persichini, R.; Anguel, N.; Richard, C.; Teboul, J.L. Lactate and venoarterial carbon dioxide difference/arterial-venous oxygen difference ratio, but not central venous oxygen saturation, predict increase in oxygen consumption in fluid responders. Crit. Care Med. 2013, 41, 1412–1420. [Google Scholar] [CrossRef]
- Du, W.; Long, Y.; Wang, X.T.; Liu, D.W. The Use of the Ratio between the Veno-arterial Carbon Dioxide Difference and the Arterial-venous Oxygen Difference to Guide Resuscitation in Cardiac Surgery Patients with Hyperlactatemia and Normal Central Venous Oxygen Saturation. Chin. Med. J. 2015, 128, 1306–1313. [Google Scholar] [CrossRef]
- Levy, B.; Gibot, S.; Franck, P.; Cravoisy, A.; Bollaert, P.E. Relation between muscle Na+K+ ATPase activity and raised lactate concentrations in septic shock: A prospective study. Lancet 2005, 365, 871–875, Erratum in Lancet 2005, 366, 122. [Google Scholar] [CrossRef]
- Fink, M.P. Cytopathic hypoxia. Mitochondrial dysfunction as mechanism contributing to organ dysfunction in sepsis. Crit. Care Clin. 2001, 17, 219–237. [Google Scholar] [CrossRef]
- Svensson, S.; Svedjeholm, R.; Ekroth, R.; Milocco, I.; Nilsson, F.; Sabel, K.G.; William-Olsson, G. Trauma metabolism and the heart. Uptake of substrates and effects of insulin early after cardiac operations. J. Thorac. Cardiovasc. Surg. 1990, 99, 1063–1073. [Google Scholar] [CrossRef]
- Rivers, E.P.; Rady, M.Y.; Martin, G.B.; Fenn, N.M.; Smithline, H.A.; Alexander, M.E.; Nowak, R.M. Venous hyperoxia after cardiac arrest. Characterization of a defect in systemic oxygen utilization. Chest 1992, 102, 1787–1793. [Google Scholar] [CrossRef] [PubMed]
- Leavy, J.A.; Weil, M.H.; Rackow, E.C. ‘Lactate washout’ following circulatory arrest. JAMA 1988, 260, 662–664. [Google Scholar] [CrossRef]
- van Beest, P.A.; Lont, M.C.; Holman, N.D.; Loef, B.; Kuiper, M.A.; Boerma, E.C. Central venous-arterial pCO2 difference as a tool in resuscitation of septic patients. Intensive Care Med. 2013, 39, 1034–1039. [Google Scholar] [CrossRef]
- Ospina-Tascón, G.A.; Umaña, M.; Bermúdez, W.; Bautista-Rincón, D.F.; Hernandez, G.; Bruhn, A.; Granados, M.; Salazar, B.; Arango-Dávila, C.; De Backer, D. Combination of arterial lactatelevels and venous-arterial CO2 to arterial-venous O2 content difference ratio as markers of resuscitation in patients with septic shock. Intensive Care Med. 2015, 41, 796–805. [Google Scholar] [CrossRef] [PubMed]
- Furqan, M.; Hashmat, F.; Amanullah, M.; Khan, M.; Durani, H.K.; Haque, A. Venoarterial PCO2 difference: A marker of postoperative cardiac output in children with congenital heart disease. J. Coll. Physicians Surg. Pak. 2009, 19, 640–643. [Google Scholar] [CrossRef] [PubMed]
- Rhodes, L.A.; Erwin, W.C.; Borasino, S.; Cleveland, D.C.; Alten, J.A. Central Venous to Arterial CO2 Difference after Cardiac Surgery in Infants and Neonates. Pediatr. Crit Care Med. 2017, 18, 228–233. [Google Scholar] [CrossRef]
- Patel, R.; Solanki, A.; Patel, H.; Patel, J.; Pandya, H.; Sharma, J. Monitoring Microcirculatory Blood Flow during Cardiopulmonary Bypass in Paediatric Cardiac Surgery Patients as a Predictor for Anaerobic Metabolism. J. Clin. Diagn. Res. 2017, 11, UC22–UC25. [Google Scholar] [CrossRef]
- Mekontso-Dessap, A.; Castelain, V.; Anguel, N.; Bahloul, M.; Schauvliege, F.; Richard, C.; Teboul, J.L. Combination of venoarterial PCO2 difference with arteriovenous O2 content difference to detect anaerobic metabolism in patients. Intensive Care Med. 2002, 28, 272–277. [Google Scholar] [CrossRef]
- Dubin, A.; Ferrara, G.; Kanoore Edul, V.S.; Martins, E.; Canales, H.S.; Canullán, C.; Murias, G.; Pozo, M.O.; Estenssoro, E. Venoarterial PCO2-to-arteriovenous oxygen content difference ratio is a poor surrogate for anaerobic metabolism in hemodilution: An experimental study. Ann. Intensive Care 2017, 7, 65. [Google Scholar] [CrossRef]
- Hong, L.; Xu, H.; Ge, C.; Tao, H.; Shen, X.; Song, X.; Guan, D.; Zhang, C. Prediction of low cardiac output syndrome in patients following cardiac surgery using machine learning. Front. Med. 2022, 9, 973147. [Google Scholar] [CrossRef]
- Aslan, N.; Yıldızdaş, D.; Göçen, U.; Erdem, S.; Demir, F.; Yontem, A.; Horoz, Ö.Ö.; Sertdemir, Y. Çocuk yoğun bakım ünitesinde kardiyak cerrahi sonrası hastaların değerlendirilmesinde kullanılan düşük kardiyak debi sendromu skorlaması [Low cardiac output syndrome score to evaluate postoperative cardiac surgery patients in a pediatric intensive care unit]. Turk. Kardiyol. Dern. Ars. 2020, 48, 504–513. (In Turkish) [Google Scholar] [CrossRef]
- Li, D.H.; Sun, M.W.; Zhang, J.C.; Zhang, C.; Deng, L.; Jiang, H. Is bivalirudin an alternative anticoagulant for extracorporeal membrane oxygenation (ECMO) patients? A systematic review and meta-analysis. Thromb. Res. 2022, 210, 53–62. [Google Scholar] [CrossRef] [PubMed]
- Sanfilippo, F.; Currò, J.M.; La Via, L.; Dezio, V.; Martucci, G.; Brancati, S.; Murabito, P.; Pappalardo, F.; Astuto, M. Use of nafamostatmesilate for anticoagulation during extracorporeal membrane oxygenation: A systematic review. Artif. Organs 2022, 46, 2371–2381. [Google Scholar] [CrossRef] [PubMed]
- La Via, L.; Sanfilippo, F.; Continella, C.; Triolo, T.; Messina, A.; Robba, C.; Astuto, M.; Hernandez, G.; Noto, A. Agreement between capillary refill time measured at finger and earlobe sites in different positions: A pilot prospective study on healthyvolunteers. BMC Anesthesiol. 2023, 23, 30. [Google Scholar] [CrossRef] [PubMed]
- Merdji, H.; Curtiaud, A.; Aheto, A.; Studer, A.; Harjola, V.P.; Monnier, A.; Duarte, K.; Girerd, N.; Kibler, M.; Ait-Oufella, H.; et al. Performance of Early Capillary Refill Time Measurement on Outcomes in Cardiogenic Shock: An Observational, Prospective Multicentric Study. Am. J. Respir. Crit. Care Med. 2022, 206, 1230–1238. [Google Scholar] [CrossRef]

| Pulmonary Flow | Acyanotic | Cyanotic |
|---|---|---|
| Augmented | Left to right shunt: VSD, PDA, ASD, AVSD | Commistion lesions: d-TGA, TAPVR |
| Normal | Obstructive lesions AS, PS, COA, Cardiomyopathies | - |
| Reduced | - | Pulmonary flow obstruction with septal defect: TOF, tricuspidal atresia, Ebstein malformation |
| Sex | Male | 56.1% (n = 55) | |
|---|---|---|---|
| Female | 43.9% (n = 43) | ||
| Age (med ± SD) | 32.0 ± 48.0 months | Male | 35.9 ± 51.1 months |
| Female | 27.0 ± 34.7 months | ||
| Height (med ± SD) | 82.9 ± 35.4 cm | Male | 85.0 ± 37.7 cm |
| Female | 78.0 ± 32.1 cm | ||
| Weight (med ± SD) | 12.7 ± 13.8 kg | Male | 13.9 ± 14.9 kg |
| Female | 11.0 ± 12.1 kg |
| Population (n = 98) | LCOS |
|---|---|
| Acyanotic, n (%): 63 (62%) | 20 (31.7%) |
| Cyanotic, n (%): 35 (38%) | 26 (74.2%) |
| Whole Population | Cyanotic CHD | Acyanotic CHD | |||||
|---|---|---|---|---|---|---|---|
| Sampling Times | LCOS | Mean Value (SD) mmHg/mL | p-Value | Mean Value (SD) mmHg/mL | p-Value | Mean Value (SD) mmHg/mL | p-Value |
| Pre-CPB | Yes | 1.55 (1.00) | 0.023 | 1.41 (0.85) | 0.131 | 1.74 (1.18) | 0.286 |
| No | 2.05 (1.05) | 2.10 (1.22) | 2.06 (1.02) | ||||
| Post-CPB | Yes | 2.44 (2.94) | 0.5 | 2.40 (3.79) | 0.377 | 2.49 (1.33) | 0.167 |
| No | 1.87 (1.26) | 1.58 (0.91) | 1.92 (1.30) | ||||
| ICU-adm. | Yes | 2.21 (1.67) | 0.256 | 2.47 (2.06) | 0.160 | 1.84 (0.82) | 0.990 |
| No | 1.95 (1.64) | 1.37 (0.94) | 2.09 (1.75) | ||||
| Pre-ext. | Yes | 2.61 (4.41) | 0.770 | 3.09 (5.86) | - | 2.02 (1.24) | 0.958 |
| No | 2.04 (1.53) | 0.45 (-) | 2.11 (1.53) | ||||
| Post-ext. | Yes | 2.04 (1.74) | 0.239 | 2.22 (1.99) | 0.99 | 1.76 (1.32) | 0.586 |
| No | 1.52 (1.41) | 2.25 (2.22) | 1.47 (1.39) |
| Whole Population | Cyanotic CHD | Acyanotic CHD | |||||
|---|---|---|---|---|---|---|---|
| Sampling Times | LCOS | Mean Value (SD) mmol/L | p-Value | Mean Value (SD) mmol/L | p-Value | Mean Value (SD) mmol/L | p-Value |
| Pre-CPB | Yes | 61.83 (14.73) | 0.000061 | 58.41 (14.63) | 0.792 | 66.28 (13.98) | 0.002 |
| No | 74.06 (14.73) | 59.48 (13.99) | 77.03(9.82) | ||||
| Post-CPB | Yes | 67.89 (12.44) | 0.197 | 65.86 (12.95) | 0.919 | 70.53 (11.55) | 0.652 |
| No | 70.59 (14.39) | 63.29 (22.26) | 71.38 (12.57) | ||||
| ICU-adm. | Yes | 65.36 (15.78) | 0.224 | 63.25 (17.63) | 0.345 | 68.41 (12.52) | 0.309 |
| No | 69.01 (13.79) | 57.04 (15.49) | 71.62 (11.82) | ||||
| Pre-ext. | Yes | 67.04 (15.36) | 0.301 | 63.52 (17.62) | 0.689 | 72.45 (9.25) | 0.940 |
| No | 70.86 (14.00) | 72.20 (23.50) | 70.77 (13.77) | ||||
| Post-ext. | Yes | 62.17 (15.85) | 0.05 | 57.74 (16.78) | 0.848 | 69.18 (11.73) | 0.654 |
| No | 69.61 (12.54) | 61.07 (16.67) | 70.41 (12.12) |
| Whole Population | Cyanotic CHD | Acyanotic CHD | |||||
|---|---|---|---|---|---|---|---|
| Sampling Times | LCOS | Mean Value (SD)% | p-Value | Mean Value (SD)% | p-Value | Mean Value (SD)% | p-Value |
| Pre-CPB | Yes | 32.1 (14.4) | 0.027 | 30.4 (15.4) | 0.938 | 43.2 (12.5) | 0.013 |
| No | 27.6 (12.1) | 31.4 (13.1) | 26.9 (11.8) | ||||
| Post-CPB | Yes | 29.3 (15.1) | 0.874 | 25.6 (13.2) | 0.542 | 33.8 (16.4) | 0.403 |
| No | 30.1 (14.7) | 31.7 (21.2) | 30.3 (13.6) | ||||
| ICU-adm. | Yes | 32.6 (17.2) | 0.580 | 30.6 (17.4) | 0.375 | 35.6 (17.0) | 0.223 |
| No | 32.3 (18.4) | 36.9 (15.9) | 31.5 (18.8) | ||||
| Pre-ext. | Yes | 34.4 (22.7) | 0.921 | 34.6 (23.5) | 0.309 | 34.2 (22.5) | 0.769 |
| No | 34.2 (22.2) | 18.8 (16.8) | 37.7 (25.1) | ||||
| Post-ext. | Yes | 37.8 (23.6) | 0.549 | 37.4 (23.3) | 0.340 | 38.4 (24.9) | 0.902 |
| No | 36.2 (23.0) | 26.6 (9.1) | 38.9 (25.7) |
| Whole Population | Cyanotic CHD | Acyanotic CHD | |||||
|---|---|---|---|---|---|---|---|
| Sampling Times | LCOS | Mean Value (SD) mmHg | p-Value | Mean Value (SD) mmHg | p-Value | Mean Value (SD) mmHg | p-Value |
| Pre-CPB | Yes | 6.49(4.71) | 0.034 | 5.39 (3.67) | 0.018 | 7.89 (5.57) | 0.734 |
| No | 8.27 (3.92) | 9.56 (4.50) | 7.97 (3.71) | ||||
| Post-CPB | Yes | 8.25 (5.11) | 0.837 | 6.24 (3.94) | 0.512 | 12.24 (6.93) | 0.013 |
| No | 8.26 (5.21) | 8.00 (5.22) | 7.80 (3.83) | ||||
| ICU-adm. | Yes | 10.29 (5.85) | 0.303 | 11.13 (6.46) | 0.650 | 9.22 (4.95) | 0.990 |
| No | 8.92 (5.66) | 10.13 (7.81) | 8.55 (4.99) | ||||
| Pre-ext. | Yes | 8.43 (6.98) | 0.512 | 8.94 (8.02) | - | 7.75 (5.58) | 0.646 |
| No | 7.00 (5.05) | 2.00 (-) | 6.93 (5.13) | ||||
| Post-ext. | Yes | 6.85 (5.86) | 0.734 | 7.58 (6.79) | 0.99 | 7.89 (5.57) | 0.734 |
| No | 6.96 (5.71) | 6.50 (4.95) | 7.97 (3.71) |
Disclaimer/Publisher’s Note: The statements, opinions and data contained in all publications are solely those of the individual author(s) and contributor(s) and not of MDPI and/or the editor(s). MDPI and/or the editor(s) disclaim responsibility for any injury to people or property resulting from any ideas, methods, instructions or products referred to in the content. |
© 2023 by the authors. Licensee MDPI, Basel, Switzerland. This article is an open access article distributed under the terms and conditions of the Creative Commons Attribution (CC BY) license (https://creativecommons.org/licenses/by/4.0/).
Share and Cite
Taiana, M.; Tomasella, I.; Russo, A.; Lerose, A.; Ceola Graziadei, M.; Corubolo, L.; Rama, J.; Schweiger, V.; Vignola, A.; Polati, E.; et al. Analysis of P(v-a)CO2/C(a-v)O2 Ratio and Other Perfusion Markers in a Population of 98 Pediatric Patients Undergoing Cardiac Surgery. J. Clin. Med. 2023, 12, 5700. https://doi.org/10.3390/jcm12175700
Taiana M, Tomasella I, Russo A, Lerose A, Ceola Graziadei M, Corubolo L, Rama J, Schweiger V, Vignola A, Polati E, et al. Analysis of P(v-a)CO2/C(a-v)O2 Ratio and Other Perfusion Markers in a Population of 98 Pediatric Patients Undergoing Cardiac Surgery. Journal of Clinical Medicine. 2023; 12(17):5700. https://doi.org/10.3390/jcm12175700
Chicago/Turabian StyleTaiana, Matteo, Irene Tomasella, Alessandro Russo, Annalisa Lerose, Marcello Ceola Graziadei, Luisa Corubolo, Jacopo Rama, Vittorio Schweiger, Alessandro Vignola, Enrico Polati, and et al. 2023. "Analysis of P(v-a)CO2/C(a-v)O2 Ratio and Other Perfusion Markers in a Population of 98 Pediatric Patients Undergoing Cardiac Surgery" Journal of Clinical Medicine 12, no. 17: 5700. https://doi.org/10.3390/jcm12175700
APA StyleTaiana, M., Tomasella, I., Russo, A., Lerose, A., Ceola Graziadei, M., Corubolo, L., Rama, J., Schweiger, V., Vignola, A., Polati, E., Luciani, G. B., Onorati, F., Donadello, K., & Gottin, L. (2023). Analysis of P(v-a)CO2/C(a-v)O2 Ratio and Other Perfusion Markers in a Population of 98 Pediatric Patients Undergoing Cardiac Surgery. Journal of Clinical Medicine, 12(17), 5700. https://doi.org/10.3390/jcm12175700