Article

Length of Stay in Emergency Department by ICD-10 Specific and Non-Specific Diagnoses: A Single-Centre Retrospective Study

by
Bartosz Miazgowski
1,
Cezary Pakulski
2 and
Tomasz Miazgowski
3,*
1
Doctoral School, Pomeranian Medical University in Szczecin, 71-252 Szczecin, Poland
2
Department of Anesthesiology, Intensive Therapy and Emergency Medicine, Pomeranian Medical University in Szczecin, 71-252 Szczecin, Poland
3
Department of Propaedeutic of Internal Diseases and Arterial Hypertension, Pomeranian Medical University in Szczecin, 71-252 Szczecin, Poland
*
Author to whom correspondence should be addressed.
J. Clin. Med. 2023, 12(14), 4679; https://doi.org/10.3390/jcm12144679
Submission received: 4 June 2023 / Revised: 5 July 2023 / Accepted: 12 July 2023 / Published: 14 July 2023
(This article belongs to the Section Emergency Medicine)

Abstract

:
The definition of non-specific presentation at a hospital emergency department (ED) has not yet been formally established. The purpose of this study was to assess the relationships between primary ED diagnoses identified by ICD-10 codes and ED length of stay (LOS). Over the course of three years, we examined 134,675 visits at a tertiary hospital. LOS was examined in groups with specific (internal, surgical, neurological, and traumatic diseases) and non-specific diagnoses. Our secondary objective was to measure LOS by age, day of the week, time of day, and season. The median LOS was 182 min (interquartile range: 99−264 min). LOS was 99 min in the traumatic group, while it was 132 min in the surgical group, 141 min in the non-specific group, 228 min in the internal medicine group, and 237 min in the neurological group. Other determinants of LOS were age, revisits, day of the week, and time of arrival—but not a season of the year. In the non-specific group (21% of all diagnoses), the percentage of hospitalizations was higher than in the specific groups. Our results suggest that in clinical practice, the non-specific group should be redefined to also encompass diagnoses from ICD-10 Chapter XXI (block Z00–Z99).

1. Introduction

Longer lengths of stay (LOS) and overcrowding in hospital emergency rooms (ED) have become serious issues for public healthcare systems around the world. The ED-LOS has been developed into a popular key performance indicator (KPI) that decision makers can use to systematically monitor and control ED performance in order to address this problem [1]. Long LOS have been found to pose a threat to patient safety [2], as they can lead to delayed care, unsatisfied patients, patients who leave before their treatment is finished, an increase in the likelihood of medical errors [3], and exhaustion in ED healthcare staff [4].
There are numerous causes of long-term ED-LOS that have been found; for instance, the majority of patients who attend emergency departments are treated and released without being admitted to the hospital, and a sizable portion of these instances involve non-urgent conditions—which may suggest problems with community access to primary, specialist, and preventive care [2]. Other factors—such as a lack of available hospital beds after leaving the ED [5], unintentional duplicate orders by physicians [6], and unnecessary blood chemistry testing and radiological imaging [7], as well as the patient’s age [8]—have also been associated with long LOS. Some reports suggest that LOS may be associated with admissions to ED during weekend days [9] and during late afternoon or night hours [8]. While several studies have evaluated LOS in relation to the initial ED diagnosis, only a few of these studies have assigned diagnoses to ICD-10 classification codes [10,11,12]—yielding ambiguous conclusions. Specifically, the LOS of patients with nonspecific diagnoses classified according to the ICD-10 remains unexplored.
Our study had two main objectives: Firstly, we aimed to evaluate the association between LOS and the most common primary ICD-10 diagnoses. To achieve this, we examined LOS in groups with specific and non-specific diagnoses. Our secondary objective was to measure LOS by age, day of the week, time of day, and season.

2. Materials and Methods

2.1. Study Design and Setting

This study is a retrospective, population-based cohort analysis of patients who were admitted to the ED at the Independent Public Teaching Hospital No. 1 (IPTH-1) of the Pomeranian Medical University in Szczecin, Poland, during January 2017–December 2019. IPTH-1 is a tertiary referral hospital consisting of 32 specialized clinical wards and about 800 beds that provides medical care across most medical specialties. At IPTH-1, all patient diagnoses are classified according to the International Classification of Diseases, Tenth Revision system. This study conforms to the Strengthening the Reporting of Observational Studies in Epidemiology (STROBE) guidelines [13].

2.2. Study Population

All adult arrivals to the ED at IPTH-1 (over the age of 18) were subjected to analysis. We used the resources of the hospital’s IT division to gather patient data. We did not use any exclusion criteria when analyzing the data. However, we removed any record elements that could be used to identify patients, such as names, social security numbers, addresses, and ID numbers, before exporting the data from the IT Department.

2.3. Methods

Our analysis focused on several key factors, such as age, time of admission and discharge, number of ED visits by day of the week, time of day, season, number of repeated visits, and hospital admission rates. The length of stay in the ED was calculated using the exact dates and times of admission and discharge as recorded in the hospital’s IT system. In total, there were 3859 primary diagnoses recorded between 2017 and 2019, classified according to the ICD-10 three- and four-character codes.
We then compiled a list of the most frequent diagnoses, which allowed us to distinguish four groups of patients with specific (disease) diagnoses typical for a given medical specialty—including those with internal, surgical, neurological, and traumatic diseases or injuries, as well as one group with non-specific (symptomatic) diagnoses. Patients in the non-specific group exhibited nonspecific signs, symptoms, and abnormal clinical and laboratory findings not elsewhere classified (Chapter XVIII, block R00-R99). We also included patients with selected diagnoses from ICD-10 Chapter XXI (block Z00-Z99; Factors influencing health status and contact with health services) in this group. For hospitalized patients, we verified the wards that had admitted the patients in the list of the most frequent diagnoses, and the degree of agreement between assignment to a specific disease group and admission to a dedicated target ward was 87.4%. In addition to these analyses, we also assessed LOS in relation to the day of the week, time of day, and season. The ED at IPTH-1 operates 24 h a day, with a full staff on weekdays from 8:00 a.m. to 3:45 p.m. and on-duty staff on weekdays from 3:45 p.m. to 8:00 a.m., as well as on weekends and holidays.
As the study did not involve the use of sensitive data from participating patients, the local Bioethics Committee approved the implementation without requiring formal opinions or written consent from the patients to participate.

2.4. Statistical Analysis

Descriptive statistics were presented as medians and interquartile ranges (IQR) or means and standard deviations for continuous variables and frequency distributions for categorical variables. The data were checked for normality using the Shapiro–Wilk test. Between groups, comparisons were made using a chi-square test or Fisher’s exact test for categorical variables and a Mann–Whitney U test for continuous variables. ED LOS between the years 2017, 2018, and 2019 was compared using the Kruskal–Wallis test.
Correlations between pairs of quantitative variables were analyzed using Spearman’s rho correlation. Multiple linear regressions were performed to model the relationship between the explanatory variables and the outcome variables. Statistical analyses were performed using IBM SPSS Statistics version 27 (SPSS Inc.; Chicago, IL, USA). Statistical significance was defined as p-value < 0.05.

3. Results

3.1. Baseline Characteristics

As shown in Figure 1, ED visits were more common among men up to the age of 55, while they were more common among women over 70. From the beginning of 2017 to the end of 2019, there were 134,675 ED visits (122.9 ± 19 visits per day) including 67,573 women and 67,102 men. The number of visits in each year was 44,749 (33.33% of all visits in 3 years) in 2017, 45,697 (33.93%) in 2018, and 44,229 (32.84%) in 2019. There were no significant differences between the number of admitted women and men during the analyzed period. The total rate of repeated visits was 32%, with similar frequency in both sexes.
The frequency of ED visits varied depending on the day of the week, with most admissions occurring on Mondays and the least on Saturdays and Sundays. The mean number of ED visits on working days was over 28% higher than on non-working days (p < 0.001). Patients were most frequently admitted between 08:00 and 16:00, during the hours when the medical team was fully staffed. About 40% of patient arrivals were out of duty hours (16:00–08:00), of which 8% were at night (24:00–08:00). The number of ED visits in the winter (December to February) and autumn (September to November) months was significantly lower (p < 0.001) compared to the spring (March to May) and summer (June to August) months. The differences between arrival rates in autumn and winter as well as spring and summer were not significant.

3.2. Analysis of LOS

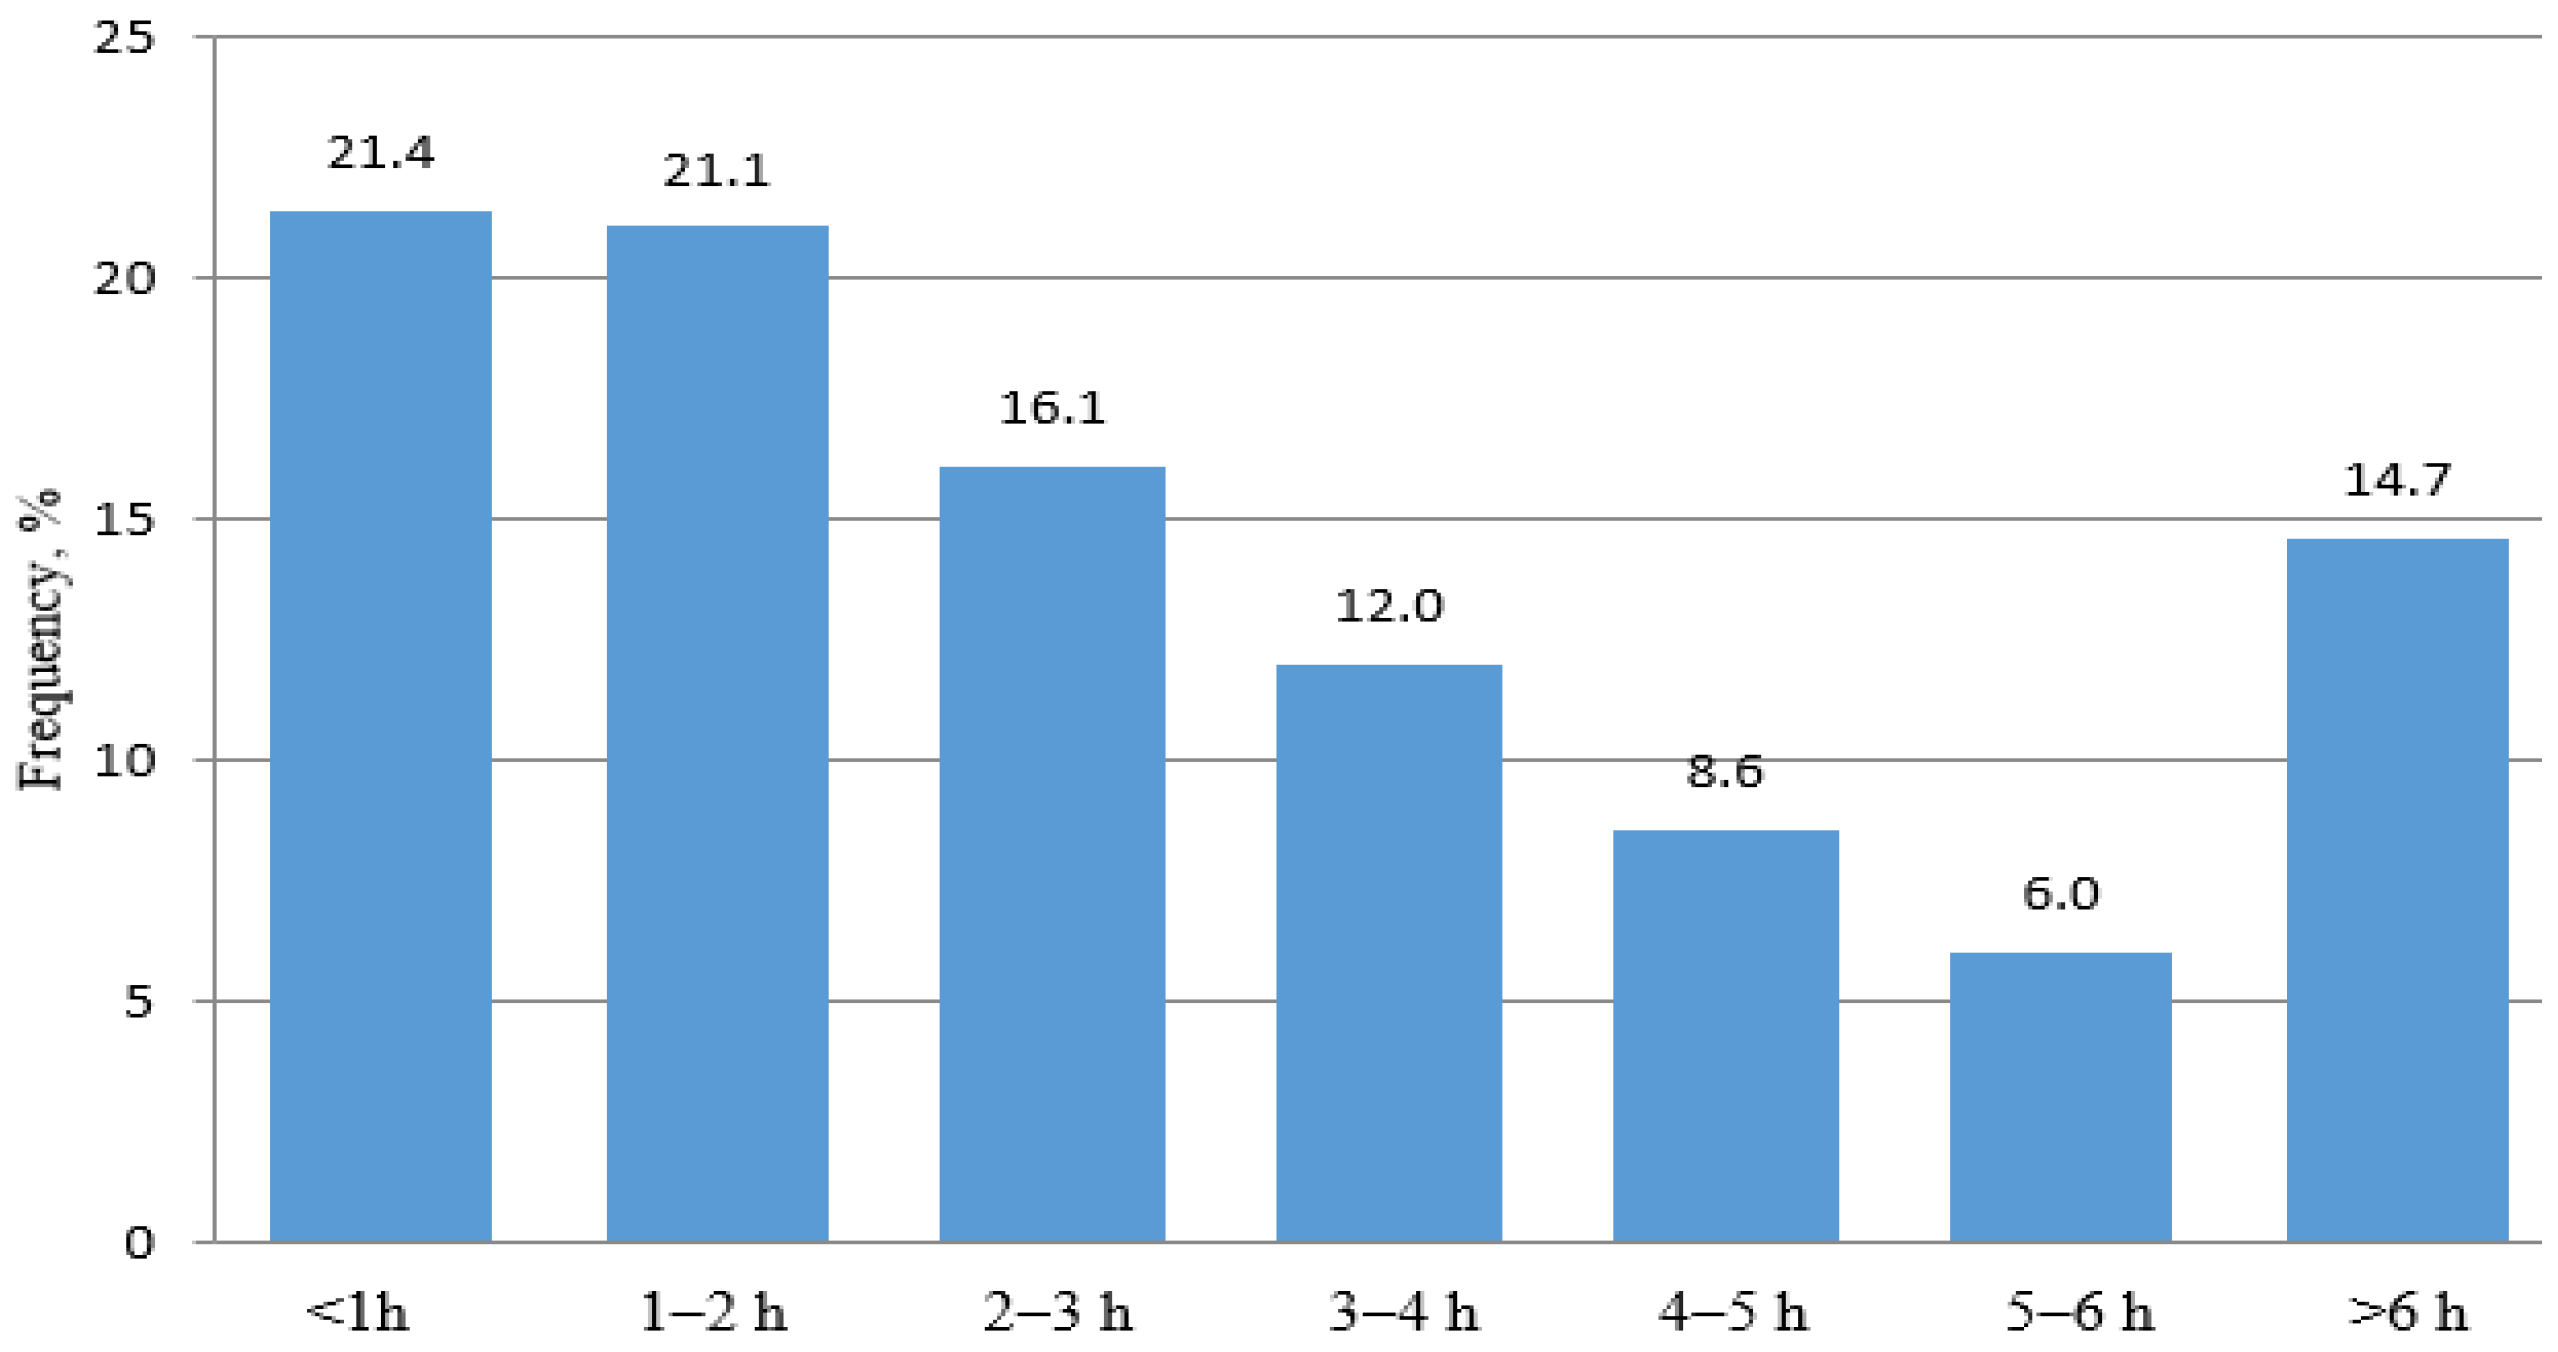
Throughout the study period, the median ED LOS was 182 min (IQR: from 99 to 264 min). Figure 2 shows the frequency distribution of LOS in one-hour time intervals from 2017 to 2019. The largest group of patients (42.5%) had LOS of less than 2 h. As the length of stay increased from 2 to 6 h, the number of patients decreased. Overall, 71% of patients had LOS under 4 h and 85% under 6 h.
Correlation analyses revealed that LOS was weakly but significantly associated with age (r = 0.201; p < 0.001). Multiple regression analyses showed that LOS > 4 h was associated with age (β = 2.04; p < 0.0001), ED visits during working days (β = 33.6; p < 0.0001), arrival during working hours (β = 12.1; p < 0.01), and revisits (β = 14.6; p < 0.005). However, this model, although significant (p < 0.001), only explained 9% of the variation in LOS.

3.3. LOS in the Specific and Non-Specific Groups

The causes for ED visits were next analysed in both the specific disease groups and the non-specific group, which together accounted for over 56% of all ED primary diagnoses (n = 3,859) from 2017 to 2019, as shown in Table 1. The largest number of cases were in the surgical and traumatic groups (24% each), followed by the non-specific (21%) and neurological and internal medicine groups (15% each). The most frequent diagnosis in the internal medicine group was I10 (Essential hypertension), in the surgical group—R10 (Acute abdomen), in the traumatic group—T92 (Sequelae of open wound of upper limb), in the neurological group—R42 (Dizziness and giddiness), and in the non-specific group—Z03.8 (Observation for other suspected diseases and conditions).
As shown in Table 2, ED LOS in the traumatic group was the shortest (160 min), while LOS in other groups was significantly longer: in the neurological group by 185 min (95% CI: 178–191; p < 0.001), in internal medicine by 158 min (95% CI: 151–164; p < 0.001), in the surgical group by 36 min (95% CI: 31–40; p < 0.001), and in the non-specific group by 24 min (95% CI: 19–28; p < 0.001). In 2019, compared to 2017, the mean LOS increased in most groups—particularly in the non-specific (by 28%) and surgical groups (by 16%). The percentage of hospitalizations was the highest in the non-specific group and lowest in the traumatic group.
Furthermore, we calculated LOS in each diagnostic subgroup for hospitalized and non-hospitalized patients (Table 3). Generally, in patients admitted to the hospital with specific diagnoses, LOS were shorter in comparison to patients leaving the ED without hospitalization. However, these differences were significant only in the surgical group (by 12.4 min; 95% CI: 2.96 to 21.8). A similar pattern was also observed in the non-specific group (LOS shorter in hospitalized patients by 9 min; 95% CI: 2.62 to 14.9; p = 0.02).

4. Discussion

To the best of our knowledge, this is the first study providing a comprehensive analysis of EDLOS in relation to ICD-10 primary diagnoses. In this report, we assessed LOS in five main clinical groups composed of the most frequent diagnoses—highly specific for each group. As the frequency of individual primary diagnoses may vary across EDs [14,15], the approach used here seems more appropriate for application in studies assessing LOS at the level of individual EDs with specific profiles (in terms of specific populations, availability of specialized hospital beds, number of medical staff, etc.)—especially when LOS is used as a KPI. In our study, the mean LOS was 3 h 2 min. Several countries, but so far not Poland, have implemented a 4 h [16,17,18] or a 6 h [19] rule as the target for 80–95% of patients. Applying these cutoffs to our cohort, LOS were suboptimal (71%) in the 4 h rule [17,18] and optimal (85%) in the 6 h rule [19].
The results of the current study clearly indicate that LOS largely depended on the cause of the ED visits. The longest LOS were observed in groups with neurological and internal diseases, and were the shortest in the traumatic group. Among the five groups of analysed diagnoses, the non-specific group seems to be of particular interest. It included patients who arrived to the ED due to nonspecific signs, symptoms, and abnormal clinical and laboratory findings (ICD-10, Chapter XVIII), as well as factors influencing health status and contact with health services (Chapter XXI). Overall, non-specific initial diagnoses were established in 21% of patients, with as many as 29% of these patients admitted to the hospital ward—while for comparison, the percentage of hospitalizations in the traumatic and surgical groups together was only 16%. Moreover, in the non-specific group, LOS were relatively shorter in comparison to other groups (except for traumatic cases)—especially in patients admitted to the hospital. These findings may suggest that in this group, ED physicians tend to make an earlier decision concerning hospitalization instead of performing further diagnostic procedures. It can therefore be assumed that at least some of these hospitalizations could have been caused by the need for longer observation and in-depth diagnostics in order to establish a more precise diagnosis, rather than the urgency of admission to the ward. In the study data, the percentage of hospitalizations was 22%—higher than the 10–14% reported in the United States [20], Portugal and Slovenia [21], or some Polish centres [22]. On the other hand, in Australia, 28% of all presentations to the ED in 2021–2022 ended in hospital admission, and this proportion varied across states and territories from 23% to 34% [23]. Even higher rates were reported in some European countries, including Denmark (46%) and Norway (69%) [21].
Generally, the problem of non-specific presentation in the ED still remains important and topical, and its definition has not yet been formally established [15]. Nonetheless, research into factors associated with non-specific ED diagnoses is scarce, even though they may encompass from 15% [24] to 37% [25] of all ED visits. These discrepancies may be due to differences in the methods used to identify such a group. For example, some studies use the clinical classification software (CCS) for ICD-10—a tool that groups diagnosis and ICD-9 procedure categorization schemes, in which all diagnoses that are classified as residual codes or symptoms, signs, ill-defined conditions, and factors influencing health status by the CCS are summarized as non-specific diagnoses, using such labels as “generally degraded health status” or “fever of unknown origin” [12,24].
We found that LOS were also related to the day of the week and the time of arrival to the ED. Most visits were registered on Mondays and other working days, and the least on Saturdays and Sundays. Overall, the average number of visits on working days was almost 30% higher than on non-working days. Most often, patients reported to the ED from 08:00 to 16:00, and least often at night. The LOS was significantly longer when visits took place on working days and during daylight hours, i.e., under conditions with full medical staff. There are divergent opinions in the literature on the impact of the day and time of visit on the length of stay in the emergency department; some authors report longer LOS at night compared to daytime visits [8,26]. In the study of Otto et al. [14], LOS were the longest on Mondays and the shortest on weekends, with the time of day being irrelevant. On the other hand, other reports have not shown any significant association between LOS and these factors [27,28].
We found no correlation between ED LOS and the season of the year, despite the fact that there were significantly more visits to the emergency department in the spring and summer months compared to other months. Similar results were also presented by Lee et al. [28]. Rather surprisingly, and so far alone, Yang et al. [26] found the longest LOS during the winter months—but only patients with a very urgent or urgent reason for admission were included in this analysis.
The current study has several limitations that should be considered when interpreting its results: Firstly, the findings are based on data from a single ED, and therefore may not be generalizable to other centres. Secondly, due to the lack of data in IT, the study did not analyse the time taken for laboratory and imaging tests, as well as specialist consultations, which are known to be significant determinants of LOS [2,27,28,29,30]. Due to the same reason, we were unable to evaluate LOS in relation to bed blocks, which are a common cause of long LOS [1,5,14,31]—particularly the waiting time for an available inpatient bed and the time of the disposition decision. Thirdly, the study analysed only the primary diagnoses established in the emergency department, and not the final diagnoses determined at discharge from the hospital. It has been estimated that there is a discrepancy of 15–30% between the primary and final diagnoses [3,15,24,30]. Therefore, some cases may have been classified into the wrong group or not included in any of them at all. This is particularly relevant for the non-specific group, where hospital observation and in-depth diagnostics would probably have provided a more precise diagnosis. On the other hand, the study’s strengths include its large sample size (almost 135,000 ED visits) and long duration (3 years), which allowed for the analysis of a diverse range of diagnoses across large clinical groups.
In conclusion, the study found that ED LOS was positively correlated with age and was significantly affected by the day of the week and time of arrival, with longer LOS observed during working days and daylight hours. The shortest LOS was found in patients with injuries and non-specific diagnoses, while the longest was found in the neurological group. The non-specific group had the highest percentage of hospitalizations. However, caution should be exercised in comparing these results with other studies, as the definition of the nonspecific group may differ across studies.

Author Contributions

Conceptualization, B.M., C.P. and T.M.; methodology, B.M. and T.M.; formal analysis, C.P. and T.M.; investigation, B.M. and T.M.; writing—original draft preparation, B.M. and T.M.; writing—review and editing, T.M. and C.P.; supervision, C.P. and T.M. All authors have read and agreed to the published version of the manuscript.

Funding

This research did not receive any external funding other than the publication fee, which was covered by the Pomeranian Medical University in Szczecin.

Institutional Review Board Statement

Not applicable.

Informed Consent Statement

As the study did not involve the use of sensitive data from participating patients, the local Bioethics Committee approved the implementation without requiring formal opinions or written consent from the patients to participate.

Data Availability Statement

The data presented in this study are available on request from the corresponding author.

Conflicts of Interest

The authors declare no conflict of interest.

References

  1. Wiler, J.L.; Welch, S.; Pines, J.; Schuur, J.; Jouriles, N.; Stone-Grifth, S. Emergency department performance measures updates: Proceedings of the 2014 emergency department benchmarking alliance consensus summit. Acad. Emerg. Med. 2015, 22, 542–553. [Google Scholar] [CrossRef] [PubMed]
  2. Kelen, G.D.; Wolfe, R.; D’Onofrio, G.; Mills, A.M.; Diercks, D.; Stern, S.A.; Wadman, M.C.; Sokolove, P.E. Emergency department crowding: The canary in the health care system. NEJM Catal. 2021, 2, 1–26. [Google Scholar]
  3. Newman-Toker, D.E.; Peterson, S.M.; Badihian, S.; Hassoon, A.; Nassery, N.; Parizadeh, D.; Wilson, L.M.; Jia, Y.; Omron, R.; Tharmarajah, S.; et al. Diagnostic Errors in the Emergency Department: A Systematic Review. Comparative Effectiveness Review No. 258; Prepared by the Johns Hopkins University Evidence-based Practice Center under Contract No. 75Q80120D00003; AHRQ Publication No. 22(23)-EHC043; Agency for Healthcare Research and Quality: Rockville, MD, USA, 2022. [CrossRef]
  4. Howlett, M.; Doody, K.; Murray, J.; LeBlanc-Duchin, D.; Fraser, J.; Atkinson, P.R. Burnout in emergency department healthcare professionals is associated with coping style: A cross-sectional survey. Emerg. Med. J. 2015, 32, 722–727. [Google Scholar] [CrossRef]
  5. Perimal-Lewis, L.; Ben-Tovim, D.I.; Li, J.Y.; Hakendorf, P.; Thompson, C. Emergency department lengths of stay: Characteristics favouring a delay to the admission decision as distinct from a delay while awaiting an inpatient bed. Intern. Med. J. 2014, 44, 384–389. [Google Scholar] [CrossRef]
  6. Horng, S.; Joseph, J.W.; Calder, S.; Stevens, J.P.; O’Donoghue, A.L.; Safran, C.; Nathanson, L.A.; Leventhal, E.L. Assessment of unintentional duplicate orders by emergency department clinicians before and after implementation of a visual aid in the electronic health record ordering system. JAMA Netw. Open 2019, 2, e1916499. [Google Scholar] [CrossRef] [PubMed] [Green Version]
  7. Venkatesh, A.K.; Hajdasz, D.; Rothenberg, C.; Dashevsky, M.; Parwani, V.; Sevilla, M.; Shapiro, M.; Schwartz, I. Reducing unnecessary blood chemistry testing in the emergency department: Implementation of choosing wisely. Am. J. Med. Qual. 2018, 33, 81–85. [Google Scholar] [CrossRef] [Green Version]
  8. Ahmed, A.A.; Ibro, S.A.; Melkamu, G.; Seid, S.S.; Tesfaye, T. Length of stay in the emergency department and its associated factors at Jimma Medical Center, Southwest Ethiopia. Open Access Emerg. Med. 2020, 12, 227–235. [Google Scholar] [CrossRef]
  9. Wong, H.J.; Morra, D. Excellent hospital care for all: Open and operating 24/7. J. Gen. Intern. Med. 2011, 26, 1050–1052. [Google Scholar] [CrossRef] [Green Version]
  10. Mchomvu, E.; Mbunda, G.; Simon, N.; Kitila, F.; Temba, Y.; Msumba, I.; Namamba, J.; Kilindimo, S.; Mgubike, H.; Gingo, W.; et al. Diagnoses made in an emergency department in rural sub-Saharan Africa. Swiss Med. Wkly. 2019, 149, w20018. [Google Scholar] [CrossRef] [Green Version]
  11. Al-Mashat, H.; Lindskou, T.A.; Møller, J.M.; Ludwig, M.; Christensen, E.F.; Søvsø, M.B. Assessed and discharged—Diagnosis, mortality and revisits in short-term emergency department contacts. BMC Health Serv. Res. 2022, 22, 816. [Google Scholar] [CrossRef]
  12. Hooker, E.A.; Mallow, P.; Oglesby, M. Characteristics and trends of emergency department visits in the United States (2010–2014). J. Emerg. Med. 2019, 56, 344–351. [Google Scholar] [CrossRef]
  13. von Elm, E.; Altman, D.G.; Egger, M.; Pocock, S.J.; Gøtzsche, P.C.; Vandenbroucke, J.P.; STROBE Initiative. The Strengthening the Reporting of Observational Studies in Epidemiology (STROBE) statement: Guidelines for reporting observational studies. J. Clin. Epidemiol. 2008, 61, 344–349. [Google Scholar] [CrossRef] [PubMed] [Green Version]
  14. Otto, R.; Blaschke, S.; Schirrmeister, W.; Drynda, S.; Walcher, F.; Greiner, F. Length of stay as quality indicator in emergency departments: Analysis of determinants in the German Emergency Department Data Registry (AKTIN registry). Intern. Emerg. Med. 2022, 17, 1199–1209. [Google Scholar] [CrossRef]
  15. Kemp, K.; Mertanen, R.; Lääperi, M.; Niemi-Murola, L.; Lehtonen, L.; Castren, M. Nonspecific complaints in the emergency department—A systematic review. Scand. J. Trauma Resusc. Emerg. Med. 2020, 28, 6. [Google Scholar] [CrossRef] [PubMed]
  16. Scott, I.; Sullivan, C.; Staib, A.; Bell, A. Deconstructing the 4-h rule for access to emergency care and putting patients first. Aust. Health Rev. 2018, 42, 698–702. [Google Scholar] [CrossRef] [PubMed] [Green Version]
  17. Mason, S.; Weber, E.J.; Coster, J.; Freeman, J.; Locker, T. Time patients spend in the emergency department: England’s 4-h rule-a case of hitting the target but missing the point? Ann. Emerg. Med. 2012, 59, 341–349. [Google Scholar] [CrossRef]
  18. Mortimore, A.; Cooper, S. The “4-h target”: Emergency nurses’ views. Emerg. Med. J. 2007, 6, 402–404. [Google Scholar] [CrossRef] [Green Version]
  19. Tenbensel, T.; Chalmers, L.; Jones, P.; Appleton-Dyer, S.; Walton, L.I.; Ameratunga, S. New Zealand’s emergency department target—Did it reduce ED length of stay, and if so, how and when? BMC Health Serv. Res. 2017, 17, 678. [Google Scholar] [CrossRef]
  20. Centers for Disease Control and Prevention. National Hospital Ambulatory Medical Care Survey: 2019 Emergency Department Summary Tables. Available online: https://www.cdc.gov/nchs/data/nhamcs/web_tables/2019-nhamcs-ed-web-tables-508.pdf (accessed on 26 March 2023).
  21. European Society for Emergency Medicine. European Medicine in Numbers. Epidemiology Series 1.0. LGCAST (2020 July). Available online: https://eusem.org/images/1_epidemiology_series.pdf (accessed on 30 March 2023).
  22. Szwamel, K.; Kurpas, D. Analysis of the structure of medical services branch of the hospital emergency ward with special reference to the benefits provided to patient with minor injuries. Fam. Med. Primary Care Rev. 2015, 17, 124–130. [Google Scholar]
  23. Australian Institute of Health and Welfare, Emergency Department Care Activity. Available online: https://www.aihw.gov.au/reports-data/myhospitals/intersection/activity/ed (accessed on 30 June 2023).
  24. Birrenbach, T.; Hoffmann, M.; Hautz, S.C.; Kämmer, J.E.; Exadaktylos, A.K.; Sauter, T.C.; Müller, M.; Hautz, W. Frequency and predictors of unspecific medical diagnoses in the emergency department: A prospective observational study. BMC Emerg. Med. 2022, 22, 109. [Google Scholar] [CrossRef]
  25. Wogan, J.M. ED follow-up: A comparison of admission and discharge diagnoses. Am. J. Emerg. Med. 2001, 19, 249–251. [Google Scholar] [CrossRef]
  26. Yang, Z.; Song, K.; Lin, H.; Li, C.; Ding, N. Factors associated with emergency department length of stay in critically ill patients: A single-center retrospective study. Med. Sci. Monit. 2021, 27, e931286. [Google Scholar] [CrossRef]
  27. van der Veen, D.; Remeijer, C.; Fogteloo, A.J.; Heringhaus, C.; de Groot, B. Independent determinants of prolonged emergency department length of stay in a tertiary care centre: A prospective cohort study. Scand. J. Trauma Resusc. Emerg. Med. 2018, 26, 81. [Google Scholar] [CrossRef]
  28. Lee, K.S.; Min, H.S.; Moon, J.Y.; Lim, D.; Kim, Y.; Ko, E.; Kim, Y.S.; Kim, J.; Lee, J.; Sung, H.K. Patient and hospital characteristics predict prolonged emergency department length of stay and in-hospital mortality: A nationwide analysis in Korea. BMC Emerg. Med. 2022, 22, 183. [Google Scholar] [CrossRef]
  29. Kaushik, N.; Khangulov, V.S.; O’Hara, M.; Arnaout, R. Reduction in laboratory turnaround time decreases emergency room length of stay. Open Access Emerg. Med. 2018, 20, 37–45. [Google Scholar] [CrossRef] [Green Version]
  30. Tudela, P.; Carreres, A.; Ballester, M. Diagnostic errors in emergency departments. Med. Clin. 2017, 149, 170–175. [Google Scholar] [CrossRef]
  31. Paling, S.; Lambert, J.; Clouting, J.; González-Esquerré, J.; Auterson, T. Waiting times in emergency departments: Exploring the factors associated with longer patient waits for emergency care in England using routinely collected daily data. Emerg. Med. J. 2020, 37, 781–786. [Google Scholar] [CrossRef]
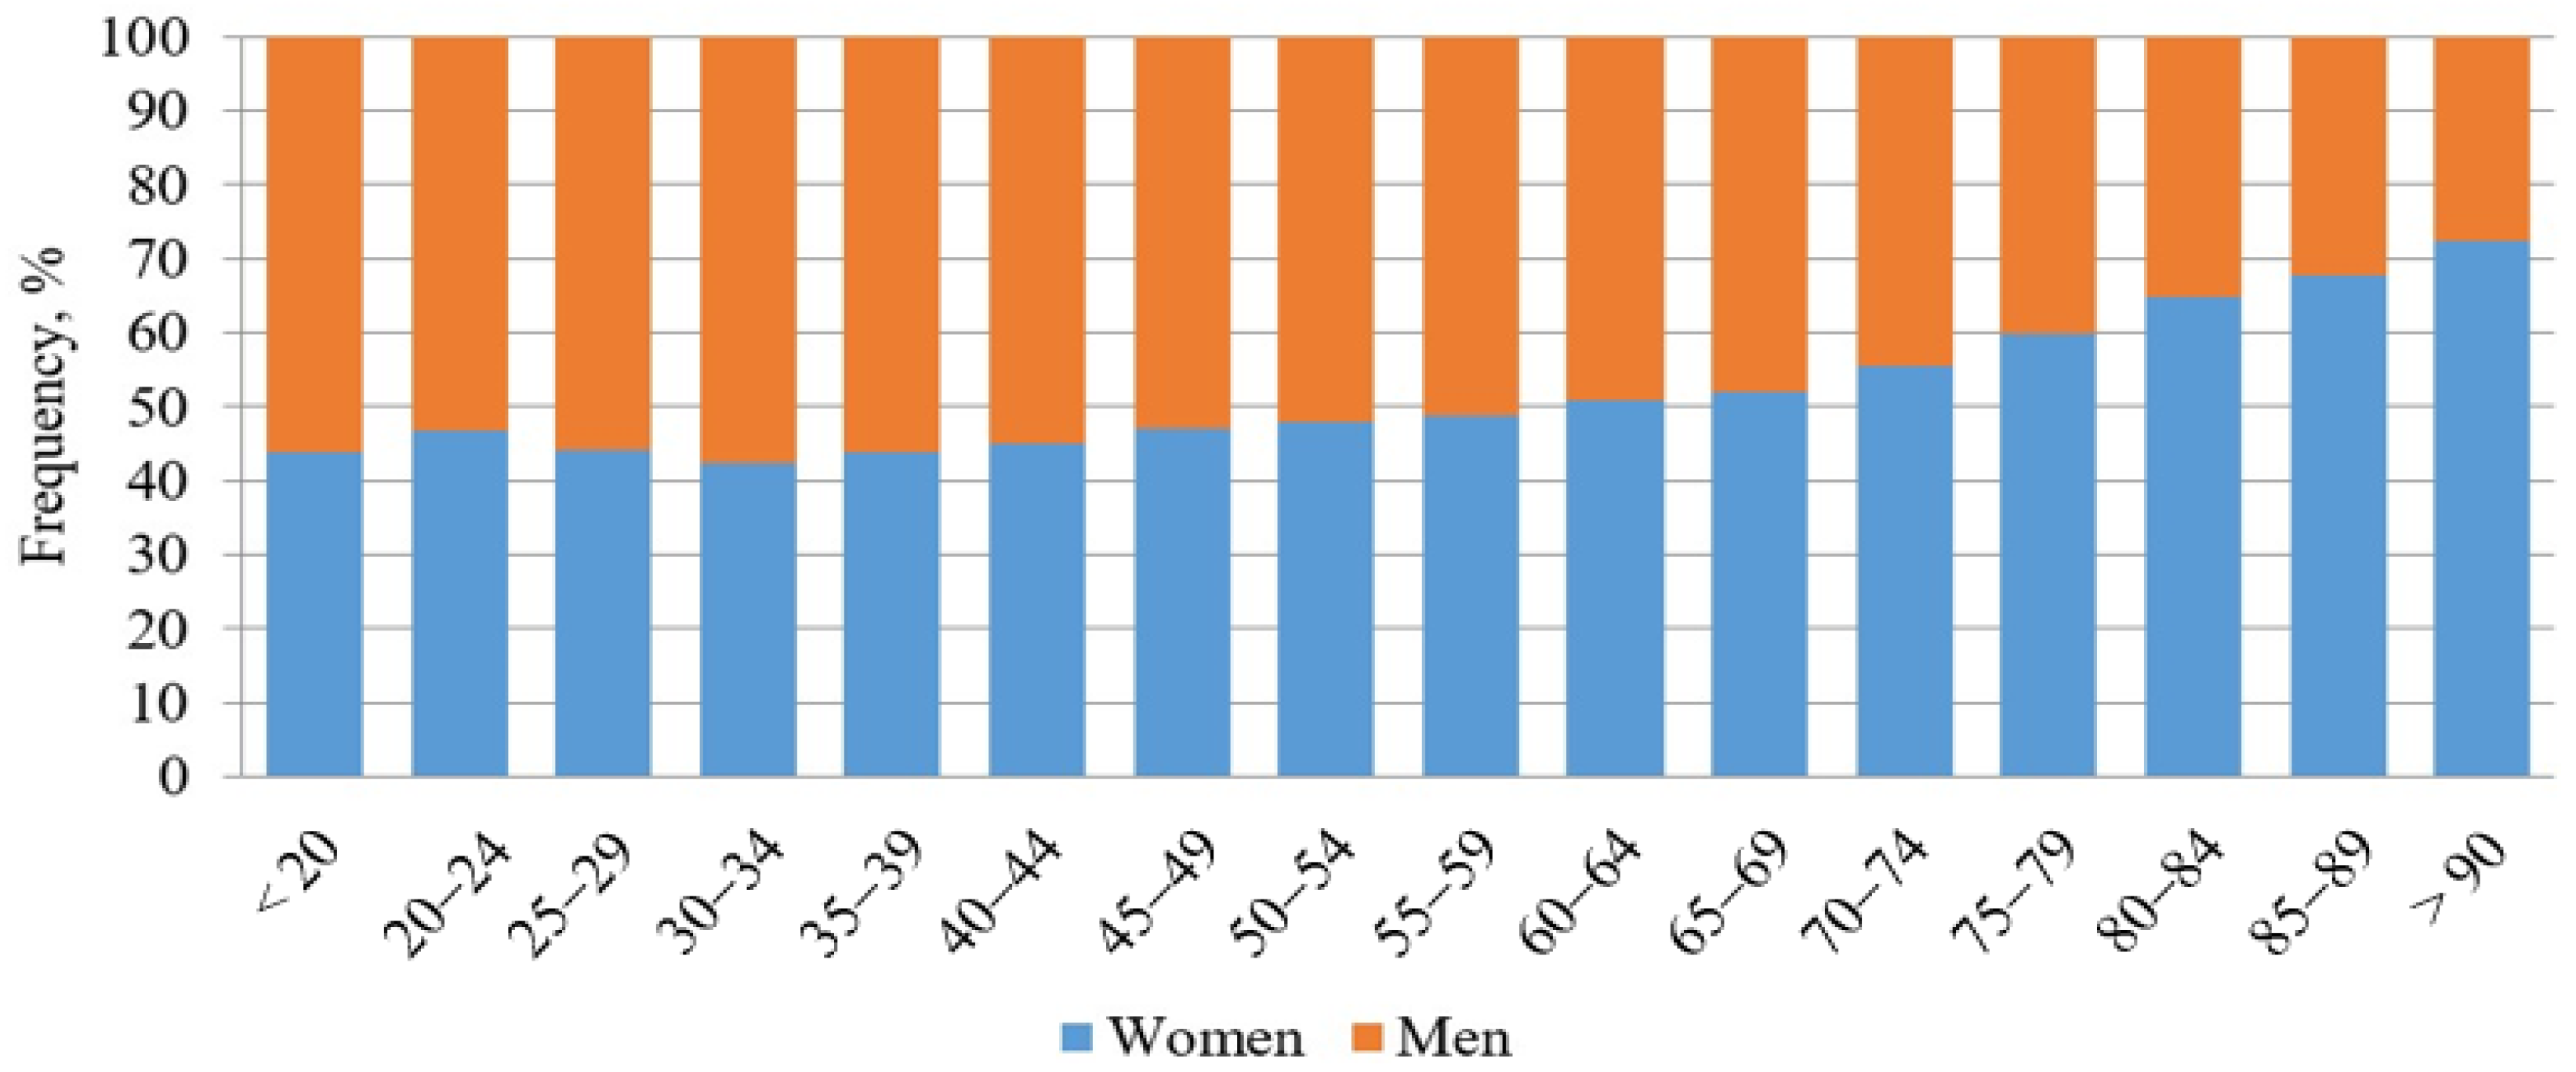
Figure 1. ED visits by age and sex.
Jcm 12 04679 g001
Figure 2. Frequency distribution of EDLOS in one-hour time intervals.
Jcm 12 04679 g002
Table 1. Most common ICD-10 diagnoses in specific and non-specific groups.
Internal MedicineSurgicalTraumaticNeurologicalNon-Specific
ICD-10nICD-10nICD-10nICD-10nICD-10n
I102061R103040T922548R511764Z03.81395
R10.41287S612330T931955R421074Z76.91392
R19.8979S521760S021747R55952R421074
R07866S631533S901546G40.0764R511001
D38575S931292S001523I63716R10946
J18538M541280S601444I64608R11942
I48486M23935M701312R29528R55938
I50268S83930S011103M47512R07865
E05189M17740S40420G54506R53820
J15122S80669S43340G44486R06.4610
J45.9108S92598T00308G98310R04.0509
I25102S66521S09201R26309Z76.8235
I10, Essential (primary) hypertension; R10.4, Other and unspecified abdominal pain; R19.8, Other specified symptoms and signs involving the digestive system and abdomen; R07, Pain in throat and chest; D38, Neoplasm of uncertain or unknown behaviour of middle ear and respiratory and intrathoracic organs; J18, Pneumonia, organism unspecified; I48, Atrial fibrillation and flutter; I50, Heart failure; Thyrotoxicosis; J15, Bacterial pneumonia, not elsewhere classified; J45.9, Asthma, unspecified; I25, Atherosclerotic cardiovascular disease; R10, Abdominal and pelvic pain; S61, Open wound of finger(s) without damage to nail; S52, Fracture of forearm; S63, Dislocation, sprain and strain of joints and ligaments at wrist and hand level; S93, Dislocation, sprain and strain of joints and ligaments at ankle and foot level; M54, Dorsalgia; M23, Internal derangement of knee; S83, Dislocation, sprain and strain of joints and ligaments of knee; M17, Gonarthrosis; S80, Superficial injury of lower leg; S92, Fracture of foot, except ankle; S66, Injury of muscle and tendon at wrist and hand level; T92, Sequelae of injuries of upper limb; T93, Sequelae of injures of lower limb; S02, Fracture of skull and facial bones; S90, Superficial injury of ankle and foot; S00, Superficial injury of head; S60, Superficial injury of wrist and hand; M70, Soft tissue disorders related to use, overuse and pressure; S01, Open wound of head; S40, Superficial injury of shoulder and upper arm; S43, Dislocation, sprain and strain of joints and ligaments of shoulder girdle; T00, Superficial injuries involving multiple body regions; S09, Other and unspecified injuries of head; R51, Headache; R42, Dizziness and giddiness; R55, Syncope and collapse; G40.0, Localization-related (focal)(partial) idiopathic epilepsy and epileptic syndromes with seizures of localized onset; I63, Cerebral infarction; I64, Stroke, not specified as haemorrhage or infarction; R29, Other symptoms and signs involving the nervous and musculoskeletal systems; M47, Spondylosis; G54, Nerve root and plexus disorders; G44, Other headache syndromes; G98, Other disorders of nervous system, not elsewhere classified; R26, Abnormalities of gait and mobility; Z03.8, Observation for other suspected diseases and conditions; Z76.9, Person encountering health services in unspecified circumstances; R42, Vertigo; R51, Facial pain NOS; R10, Abdominal and pelvic pain; R11, Nausea and vomiting; R55, Fainting; R07, Pain in throat and chest; R53, Malaise and fatigue; R06.4, Hyperventilation; R04.0, Epistaxis; Z76.8; Persons encountering health services in other specified circumstances.
Table 2. LOS and hospitalizations in groups with specific and non-specific diagnoses.
GroupnAge (Years)F/M (%)LOS, Mean ± SD (min)LOS, Median (IQR) (min)Hospitalizations (%)
Internal medicine11,47663.6 ± 2558/42318.5 ± 255228 (103–309)17.7
Surgical18,51058.8 ± 2351/49196.3 ± 187132 (45–171)8.8
Traumatic18,31041.7 ± 2239/61160.1 ± 16499 (23–169)7.1
Neurological11,53462.6 ± 2648/52345.0 ± 253237 (65–336)21.5
Non-specific15,82656.9 ± 2652/48185.4 ± 191141 (70–217)29.3
All 134,67552.4 ± 2350/50254.0 ± 205212 (93–251)22.0
For all comparisons between groups p < 0.001.
Table 3. LOS for each diagnostic subgroup for hospitalized and non-hospitalized patients.
GroupHospitalizationNo Hospitalizationp
nLOS (min)nLOS (min)
Internal medicine2031311.5 ± 2299445321.4 ± 2620.111
Surgical1629189.2 ± 16916,881201.6 ± 1870.010
Traumatic1300158.2 ± 14017,010166.1 ± 1590.082
Neurological2480343.3 ± 2439054349.0 ± 2570.321
Non-specific4637180.4 ± 17911,189189.2 ± 1810.024
Disclaimer/Publisher’s Note: The statements, opinions and data contained in all publications are solely those of the individual author(s) and contributor(s) and not of MDPI and/or the editor(s). MDPI and/or the editor(s) disclaim responsibility for any injury to people or property resulting from any ideas, methods, instructions or products referred to in the content.