
3D Atrial Strain for Predicting Recurrence of Atrial Fibrillation after Pulmonary Vein Isolation

 , , , ,
Abstract
1. Introduction
2. Methods
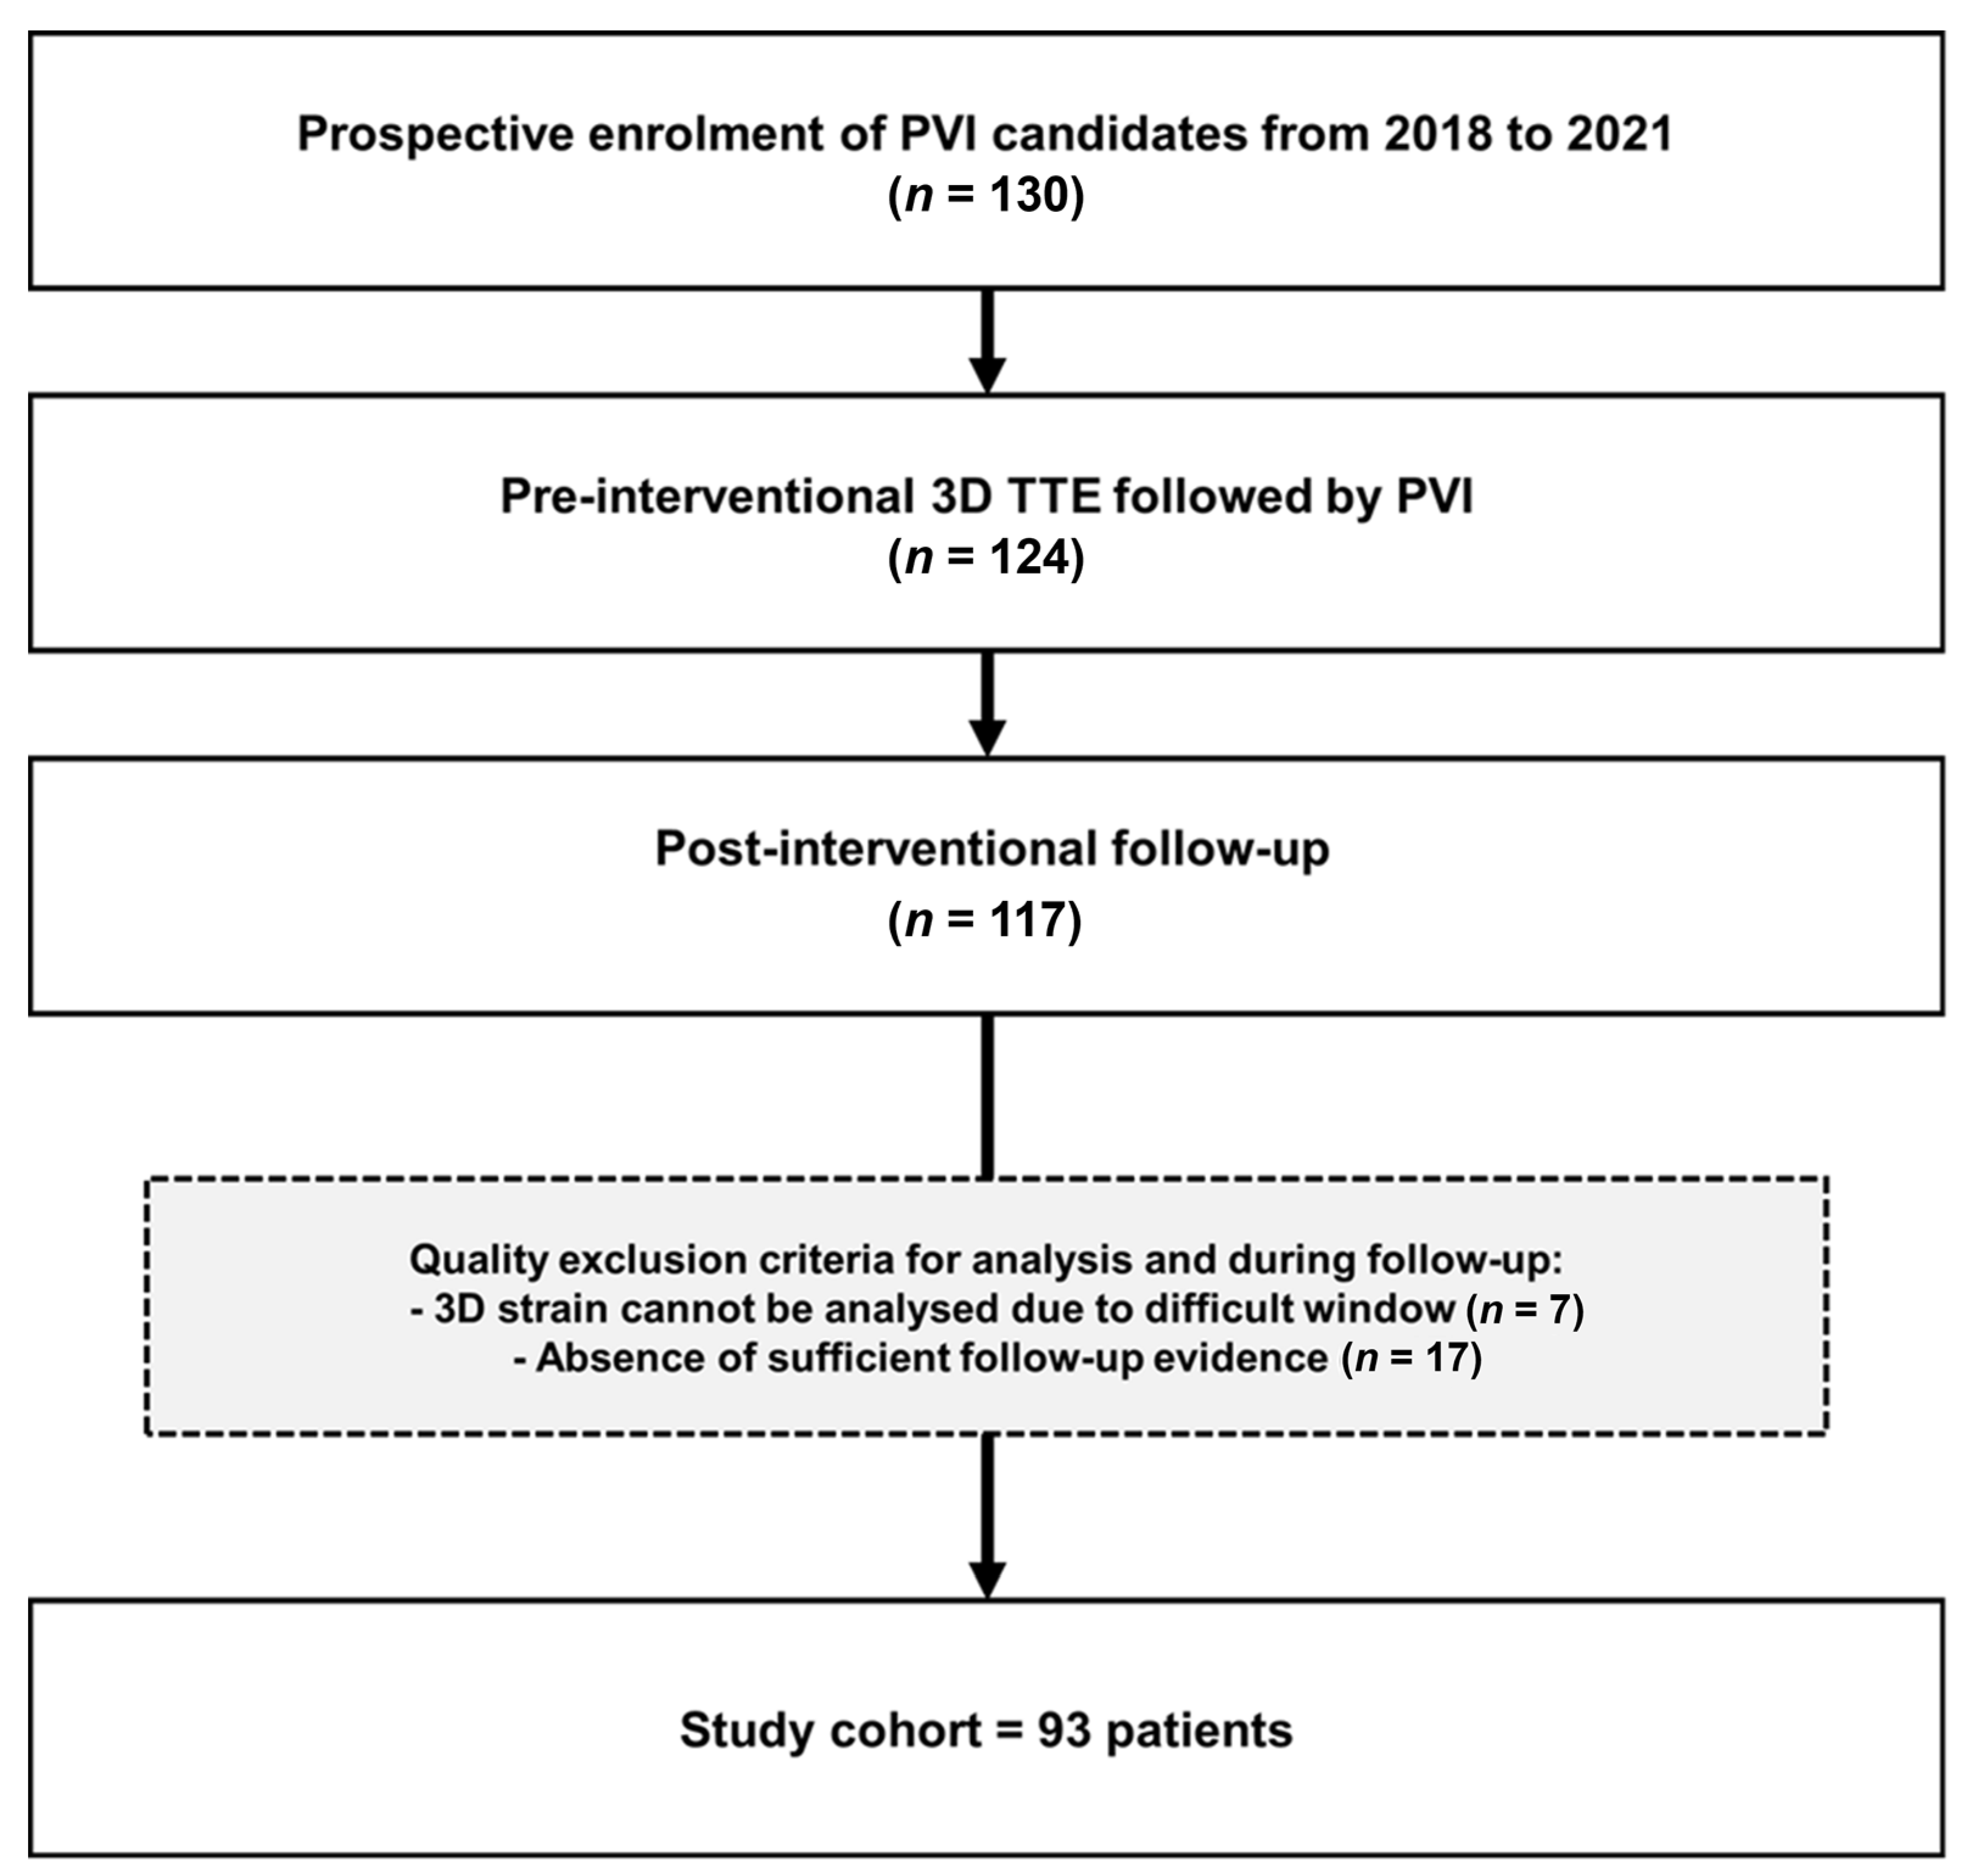
Study Population
3. Echocardiography
4. Pulmonary Vein Ablation and Voltage Mapping
5. Follow-Up and Endpoints
6. Statistical Analysis
7. Results
7.1. Baseline Characteristics
7.2. Echocardiographic Analysis
7.3. LA Voltage Mapping
7.4. Association with AF Recurrence
7.5. Incremental Value of 3D LAS Parameters
7.6. Prediction of the AF Recurrence Probability
8. Discussion
9. Limitations
10. Conclusions
Supplementary Materials
Author Contributions
Funding
Institutional Review Board Statement
Informed Consent Statement
Data Availability Statement
Acknowledgments
Conflicts of Interest
References
- Hindricks, G.; Potpara, T.; Dagres, N.; Arbelo, E.; Bax, J.J.; Blomström-Lundqvist, C.; Boriani, G.; Castella, M.; Dan, G.-A.; Dilaveris, P.E.; et al. 2020 ESC Guidelines for the diagnosis and management of atrial fibrillation developed in collaboration with the European Association for Cardio-Thoracic Surgery (EACTS): The Task Force for the diagnosis and management of atrial fibrillation of the European Society of Cardiology (ESC) Developed with the special contribution of the European Heart Rhythm Association (EHRA) of the ESC. Eur. Heart J. 2021, 42, 373–498. [Google Scholar]
- Iwasaki, Y.K.; Nishida, K.; Kato, T.; Nattel, S. Atrial fibrillation pathophysiology: Implications for management. Circulation 2011, 124, 2264–2274. [Google Scholar] [CrossRef] [PubMed]
- Bosch, N.A.; Cimini, J.; Walkey, A.J. Atrial Fibrillation in the ICU. Chest 2018, 154, 1424–1434. [Google Scholar] [CrossRef] [PubMed]
- Masuda, M.; Asai, M.; Iida, O.; Okamoto, S.; Ishihara, T.; Nanto, K.; Kanda, T.; Tsujimura, T.; Matsuda, Y.; Okuno, S.; et al. Additional Low-Voltage-Area Ablation in Patients with Paroxysmal Atrial Fibrillation: Results of the Randomized Controlled VOLCANO Trial. J. Am. Heart Assoc. 2020, 9, e015927. [Google Scholar] [CrossRef] [PubMed]
- Masuda, M.; Fujita, M.; Iida, O.; Okamoto, S.; Ishihara, T.; Nanto, K.; Kanda, T.; Tsujimura, T.; Matsuda, Y.; Okuno, S.; et al. Left atrial low-voltage areas predict atrial fibrillation recurrence after catheter ablation in patients with paroxysmal atrial fibrillation. Int. J. Cardiol. 2018, 257, 97–101. [Google Scholar] [CrossRef]
- Hwang, H.J.; Choi, E.Y.; Rhee, S.J.; Joung, B.; Lee, B.H.; Lee, S.H.; Kim, J.; Lee, M.-H.; Jang, Y.; Chung, N.; et al. Left atrial strain as predictor of successful outcomes in catheter ablation for atrial fibrillation: A two-dimensional myocardial imaging study. J. Interv. Card. Electrophysiol. 2009, 26, 127–132. [Google Scholar] [CrossRef]
- Kuppahally, S.S.; Akoum, N.; Badger, T.J.; Burgon, N.S.; Haslam, T.; Kholmovski, E.; Macleod, R.; McGann, C.; Marrouche, N.F. Echocardiographic left atrial reverse remodeling after catheter ablation of atrial fibrillation is predicted by preablation delayed enhancement of left atrium by magnetic resonance imaging. Am. Heart J. 2010, 160, 877–884. [Google Scholar] [CrossRef]
- Mirza, M.; Caracciolo, G.; Khan, U.; Mori, N.; Saha, S.K.; Srivathsan, K.; Altemose, G.; Scott, L.; Sengupta, P.; Jahangir, A. Left atrial reservoir function predicts atrial fibrillation recurrence after catheter ablation: A two-dimensional speckle strain study. J. Interv. Card. Electrophysiol. 2011, 31, 197–206. [Google Scholar] [CrossRef]
- Montserrat, S.; Gabrielli, L.; Bijnens, B.; Borràs, R.; Berruezo, A.; Poyatos, S.; Brugada, J.; Mont, L.; Sitges, M. Left atrial deformation predicts success of first and second percutaneous atrial fibrillation ablation. Heart Rhythm. 2015, 12, 11–18. [Google Scholar] [CrossRef]
- Morris, D.A.; Parwani, A.; Huemer, M.; Wutzler, A.; Bekfani, T.; Attanasio, P.; Friedrich, K.; Kühnle, Y.; Haverkamp, W.; Boldt, L.-H. Clinical significance of the assessment of the systolic and diastolic myocardial function of the left atrium in patients with paroxysmal atrial fibrillation and low CHADS(2) index treated with catheter ablation therapy. Am. J. Cardiol. 2013, 111, 1002–1011. [Google Scholar] [CrossRef]
- Motoki, H.; Negishi, K.; Kusunose, K.; Popovic, Z.; Bhargava, M.; Wazni, O.M.; Saliba, W.I.; Chung, M.K.; Marwick, T.H.; Klein, A.L. Global left atrial strain in the prediction of sinus rhythm maintenance after catheter ablation for atrial fibrillation. J. Am. Soc. Echocardiogr. 2014, 27, 1184–1192. [Google Scholar] [CrossRef] [PubMed]
- Spethmann, S.; Stüer, K.; Diaz, I.; Althoff, T.; Hewing, B.; Baumann, G.; Dreger, H.; Knebel, F. Left atrial mechanics predict the success of pulmonary vein isolation in patients with atrial fibrillation. J. Interv. Card Electrophysiol. 2014, 40, 53–62. [Google Scholar] [CrossRef]
- Yasuda, R.; Murata, M.; Roberts, R.; Tokuda, H.; Minakata, Y.; Suzuki, K.; Tsuruta, H.; Kimura, T.; Nishiyama, N.; Fukumoto, K.; et al. Left atrial strain is a powerful predictor of atrial fibrillation recurrence after catheter ablation: Study of a heterogeneous population with sinus rhythm or atrial fibrillation. Eur. Heart J. Cardiovasc. Imaging 2015, 16, 1008–1014. [Google Scholar] [CrossRef] [PubMed]
- Esposito, G.; Piras, P.; Evangelista, A.; Nuzzi, V.; Nardinocchi, P.; Pannarale, G.; Torromeo, C.; Puddu, P.E. Improving performance of 3D speckle tracking in arterial hypertension and paroxysmal atrial fibrillation by using novel strain parameters. Sci. Rep. 2019, 9, 7382. [Google Scholar] [CrossRef] [PubMed]
- Lang, R.M.; Badano, L.P.; Mor-Avi, V.; Afilalo, J.; Armstrong, A.; Ernande, L.; Flachskampf, F.A.; Foster, E.; Goldstein, S.A.; Kuznetsova, T.; et al. Recommendations for cardiac chamber quantification by echocardiography in adults: An update from the American Society of Echocardiography and the European Association of Cardiovascular Imaging. J. Am. Soc. Echocardiogr. 2015, 16, 233–271. [Google Scholar]
- Mochizuki, A.; Yuda, S.; Fujito, T.; Kawamukai, M.; Muranaka, A.; Nagahara, D.; Shimoshige, S.; Hashimoto, A.; Miura, T. Left atrial strain assessed by three-dimensional speckle tracking echocardiography predicts atrial fibrillation recurrence after catheter ablation in patients with paroxysmal atrial fibrillation. J. Echocardiogr. 2017, 15, 79–87. [Google Scholar] [CrossRef]
- Badano, L.P.; Kolias, T.J.; Muraru, D.; Abraham, T.P.; Aurigemma, G.; Edvardsen, T.; D’Hooge, J.; Donal, E.; Fraser, A.G.; Marwick, T.; et al. Standardization of left atrial, right ventricular, and right atrial deformation imaging using two-dimensional speckle tracking echocardiography: A consensus document of the EACVI/ASE/Industry Task Force to standardize deformation imaging. Eur. Heart J. Cardiovasc. Imaging 2018, 19, 591–600. [Google Scholar] [CrossRef] [PubMed]
- Oakes, R.S.; Badger, T.J.; Kholmovski, E.G.; Akoum, N.; Burgon, N.S.; Fish, E.N.; Blauer, J.J.; Rao, S.N.; DiBella, E.V.; Segerson, N.M.; et al. Detection and quantification of left atrial structural remodeling with delayed-enhancement magnetic resonance imaging in patients with atrial fibrillation. Circulation 2009, 119, 1758–1767. [Google Scholar] [CrossRef] [PubMed]
- Verma, A.; Wazni, O.M.; Marrouche, N.F.; Martin, D.O.; Kilicaslan, F.; Minor, S.; Schweikert, R.A.; Saliba, W.; Cummings, J.; Burkhardt, J.D.; et al. Pre-existent left atrial scarring in patients undergoing pulmonary vein antrum isolation: An independent predictor of procedural failure. J. Am. Coll. Cardiol. 2005, 45, 285–292. [Google Scholar] [CrossRef]
- Daccarett, M.; Badger, T.J.; Akoum, N.; Burgon, N.S.; Mahnkopf, C.; Vergara, G.; Kholmovski, E.; McGann, C.J.; Parker, D.; Brachmann, J.; et al. Association of left atrial fibrosis detected by delayed-enhancement magnetic resonance imaging and the risk of stroke in patients with atrial fibrillation. J. Am. Coll. Cardiol. 2011, 57, 831–838. [Google Scholar] [CrossRef]
- Popa, M.A.; Kottmaier, M.; Risse, E.; Telishevska, M.; Lengauer, S.; Wimbauer, K.; Brkic, A.; Kantenwein, V.; Ulrich, S.; Kornmayer, M.; et al. Early arrhythmia recurrence after catheter ablation for persistent atrial fibrillation: Is it predictive for late recurrence? Clin. Res. Cardiol. 2022, 111, 85–95. [Google Scholar] [CrossRef] [PubMed]
- Takayama, K.; Hachiya, H.; Iesaka, Y.; Hirao, K.; Isobe, M. Early Recurrence after Longstanding Persistent Atrial Fibrillation Ablation. Int. Heart J. 2018, 59, 321–327. [Google Scholar] [CrossRef] [PubMed]
- Jackson, J.; Liang, S.D. Early Recurrences during the Blanking Period after Atrial Fibrillation Ablation. J. Atr. Fibrillation 2018, 10, 1726. [Google Scholar]
- Andrade, J.G.; Khairy, P.; Verma, A.; Guerra, P.G.; Dubuc, M.; Rivard, L.; Deyell, M.W.; Mondesert, B.; Thibault, B.; Talajic, M.; et al. Early recurrence of atrial tachyarrhythmias following radiofrequency catheter ablation of atrial fibrillation. Pacing Clin. Electrophysiol. 2012, 35, 106–116. [Google Scholar] [CrossRef]
- Smiseth, O.A.; Baron, T.; Marino, P.N.; Marwick, T.H.; Flachskampf, F.A. Imaging of the left atrium: Pathophysiology insights and clinical utility. Eur. Heart J. Cardiovasc. Imaging 2022, 23, 2–13. [Google Scholar] [CrossRef]
- Voigt, J.U.; Malaescu, G.G.; Haugaa, K.; Badano, L. How to do LA strain. Eur. Heart J. Cardiovasc. Imaging 2020, 21, 715–717. [Google Scholar] [CrossRef]
- Voigt, J.U.; Cvijic, M. 2- and 3-Dimensional Myocardial Strain in Cardiac Health and Disease. JACC Cardiovasc. Imaging 2019, 12, 1849–1863. [Google Scholar] [CrossRef]
- Hopman, L.H.; Mulder, M.J.; van der Laan, A.M.; Bhagirath, P.; Demirkiran, A.; von Bartheld, M.B.; Kemme, M.J.; van Rossum, A.C.; Allaart, C.P.; Götte, M.J. Left atrial strain is associated with arrhythmia recurrence after atrial fibrillation ablation: Cardiac magnetic resonance rapid strain vs. feature tracking strain. Int. J. Cardiol. 2023, 378, 23–31. [Google Scholar] [CrossRef]
- Ma, X.X.; Boldt, L.H.; Zhang, Y.L.; Zhu, M.R.; Hu, B.; Parwani, A.; Belyavskiy, E.; Radha Krishnan, A.K.; Krisper, M.; Köhncke, C.; et al. Clinical Relevance of Left Atrial Strain to Predict Recurrence of Atrial Fibrillation after Catheter Ablation: A Meta-Analysis. Echocardiography 2016, 33, 724–733. [Google Scholar] [CrossRef]
- Hohendanner, F.; Romero, I.; Blaschke, F.; Heinzel, F.R.; Pieske, B.; Boldt, L.H.; Parwani, A.S. Extent and magnitude of low-voltage areas assessed by ultra-high-density electroanatomical mapping correlate with left atrial function. Int. J. Cardiol. 2018, 272, 108–112. [Google Scholar] [CrossRef]
- Laish-Farkash, A.; Perelshtein Brezinov, O.; Valdman, A.; Tam, D.; Rahkovich, M.; Kogan, Y.; Marincheva, G. Evaluation of left atrial remodeling by 2D-speckle-tracking echocardiography versus by high-density voltage mapping in patients with atrial fibrillation. J. Cardiovasc. Electrophysiol. 2020, 32, 305–315. [Google Scholar] [CrossRef] [PubMed]
- Sohns, C.; Marrouche, N.F. Atrial fibrillation and cardiac fibrosis. Eur. Heart J. 2020, 41, 1123–1131. [Google Scholar] [CrossRef] [PubMed]
- Marrouche, N.F.; Wilber, D.; Hindricks, G.; Jais, P.; Akoum, N.; Marchlinski, F.; Kholmovski, E.; Burgon, N.; Hu, N.; Mont, L.; et al. Association of atrial tissue fibrosis identified by delayed enhancement MRI and atrial fibrillation catheter ablation: The DECAAF study. JAMA 2014, 311, 498–506. [Google Scholar] [CrossRef]
- Jadidi, A.S.; Lehrmann, H.; Keyl, C.; Sorrel, J.; Markstein, V.; Minners, J.; Park, C.I.; Denis, A.; Jaïs, P.; Hocini, M.; et al. Ablation of Persistent Atrial Fibrillation Targeting Low-Voltage Areas with Selective Activation Characteristics. Circ. Arrhythm. Electrophysiol. 2016, 9, e002962. [Google Scholar] [CrossRef]
- Vlachos, K.; Efremidis, M.; Letsas, K.P.; Bazoukis, G.; Martin, R.; Kalafateli, M.; Lioni, L.; Georgopoulos, S.; Saplaouras, A.; Efremidis, T.; et al. Low-voltage areas detected by high-density electroanatomical mapping predict recurrence after ablation for paroxysmal atrial fibrillation. J. Cardiovasc. Electrophysiol. 2017, 28, 1393–1402. [Google Scholar] [CrossRef] [PubMed]
- Wong, G.R.; Nalliah, C.J.; Lee, G.; Voskoboinik, A.; Prabhu, S.; Parameswaran, R.; Sugumar, H.; Anderson, R.D.; McLellan, A.; Ling, L.H.; et al. Dynamic Atrial Substrate During High-Density Mapping of Paroxysmal and Persistent AF: Implications for Substrate Ablation. JACC Clin. Electrophysiol. 2019, 5, 1265–1277. [Google Scholar] [CrossRef]
- Ramos, S.K.; Pool, L.; van Schie, M.S.; Wijdeveld, L.F.; van der Does, W.F.; Baks, L.; Sultan, H.D.; van Wijk, S.W.; Bogers, A.J.; Verheule, S.; et al. Degree of Fibrosis in Human Atrial Tissue Is Not the Hallmark Driving AF. Cells 2022, 11, 427. [Google Scholar] [CrossRef]
- Kawasaki, S.; Tanno, K.; Ochi, A.; Inokuchi, K.; Chiba, Y.; Onishi, Y.; Onuma, Y.; Munetsugu, Y.; Kikuchi, M.; Ito, H.; et al. Recurrence of atrial fibrillation within three months after pulmonary vein isolation for patients with paroxysmal atrial fibrillation: Analysis using external loop recorder with auto-trigger function. J. Arrhythm. 2015, 31, 88–93. [Google Scholar] [CrossRef]


| Parameters | All (n = 93) | Non-AF (n = 81) | AF (n = 12) | p-Value |
|---|---|---|---|---|
| Age, years, median (IQR) | 63.9 (58.9–70.3) | 63.9 (57.8–69.4) | 65.2 (60.0–72.1) | 0.536 |
| Men (n, %) | 75 (81) | 66 (81) | 9 (75) | 0.599 |
| BMI, kg/m2, median (IQR) | 26.0 (24.1–29.4) | 26.0 (24.2–29.3) | 24.9 (23.2–30.3) | 0.571 |
| BSA, m2, median (IQR) | 2.0 (1.9–2.2) | 2.0 (1.9–2.2) | 2.0 (1.8–2.1) | 0.205 |
| Diabetes (n, %) | 12 (13) | 9 (11) | 3 (25) | 0.183 |
| Hypertension (n, %) | 49 (53) | 42 (52) | 7 (58) | 0.676 |
| SBP, mmHg, median (IQR) | 129.5 (119.0–144.0) | 129.0 (119.0–143.5) | 132.0 (123.3–144.5) | 0.605 |
| DBP, mmHg, median (IQR) | 77.0 (70.0–84.0) | 77.0 (70.0–84.0) | 76.0 (61.3–83.8) | 0.412 |
| Hypertensive heart disease (n, %) | 6 (7) | 5 (6) | 1 (8) | 1.000 |
| Dilated cardiomyopathy (n, %) | 5 (5) | 5 (6) | 0 (0) | - |
| Hypertrophic cardiomyopathy (n, %) | 3 (3) | 3 (3) | 0 (0) | - |
| Coronary artery disease (n, %) | 15 (16) | 13 (16) | 2 (17) | 1.000 |
| Ischemic heart disease (n, %) | 1 (1) | 1 (1) | 0 (0) | - |
| Valvular heart disease (n, %) | 23 (25) | 20 (25) | 3 (25) | 0.981 |
| -Moderate VHD (n, %) | 14 (15) | 12 (15) | 2 (17) | 1.000 |
| -Severe VHD (n, %) | 2 (2) | 1 (1.0) | 1 (8) | - |
| Renal insufficiency (n, %) | 19 (20) | 15 (18) | 4 (33) | 0.237 |
| Sleep apnea (n, %) | 8 (9) | 7 (9) | 1 (8) | 0.972 |
| Paroxysmal AF (n, %) | 61 (66) | 52 (64) | 9 (75) | 1.000 |
| Persistent AF (n, %) | 30 (32) | 27 (33) | 3 (25) | 1.000 |
| Long-standing AF (n, %) | 2 (2) | 2 (3) | 0 (0) | - |
| NT-proBNP, ng/L, median (IQR) | 269.5 (134.0–873.0) | 247.5 (124.5–825.5) | 491.5 (214.5–1077.5) | 0.285 |
| Anti-arrhythmic drugs (n, %) | 16 (17) | 14 (17) | 2 (17) | 1.000 |
| Beta-blockers (n, %) | 71 (76) | 63 (78) | 8 (67) | 0.401 |
| Calcium channel blockers (n, %) | 17 (18) | 15 (19) | 2 (17) | 0.863 |
| Digoxin (n, %) | 0 (0) | 0 (0) | 0 (0) | 1.000 |
| Oral anticoagulants (n, %) | 88 (95) | 76 (94) | 12 (100) | 0.379 |
| Parameters, Median (IQR) | All (n = 93) | Non-AF (n = 81) | AF (n = 12) | p-Value |
|---|---|---|---|---|
| LVA, (cm2) | 5.8 (2.0–23.8) | 6.0 (2.0–21.0) | 5.0 (2.3–47.5) | 0.705 |
| LVA, (%) | 4.4 (1.5–16.4) | 4.4 (1.5–15.9) | 5.0 (1.5–21.5) | 0.710 |
| LAVI, (mL/m2) | 42.0 (35.0–52.0) | 41.0 (35.0–51.3) | 52.5 (33.5–65.5) | 0.176 |
| 3D LAVIR, (mL/m2) | 45.0 (37.5–54.5) | 43.5 (37.0–54.3) | 54.2 (35.5–68.5) | 0.199 |
| 3D LAVIP, (mL/m2) | 16.9 (11.5–25.5) | 16.0 (11.6–22.8) | 22.4 (11.6–27.3) | 0.294 |
| 2D LARS, (%) | 42.1 (34.9–49.8) | 43.6 (35.7–50.7) | 39.6 (32.9–42.0) | 0.083 |
| 2D LAPS, (%) | −17.9 (−20.4 to −13.5) | −18.0 (−21.0 to −14.0) | −16.6 (−18.8 to −11.6) | 0.178 |
| 3D LARS, (%) | 32.3 (26.6–38.1) | 33.6 (27.0–38.6) | 24.5 (23.8–33.0) | 0.008 * |
| 3D LAPS, (%) | −5.9 (−8.1 to −4.4) | −6.2 (−8.3 to −4.5) | −4.6 (−5.6 to −3.6) | 0.009 * |
| LVEDVI, (mL/m2) | 57.0 (45.5–68.5) | 57.0 (47.3–69.0) | 50.0 (43.5–57.0) | 0.147 |
| LVEF, (%) | 55.0 (51.0–59.0) | 55.0 (50.0–60.0) | 56.0 (54.0–58.0) | 0.517 |
| LVGLS, (%) | −11.6 (−14.5 to −9.5) | −11.9 (−14.6 to −9.5) | −11.3 (−12.7 to −9.6) | 0.421 |
| LV Diastolic dysfunction (n, %) | 7.0 (7.5) | 6.0 (7.4) | 1.0 (8.3) | 0.920 |
| RAESA, (cm2) | 22.5 (19.0–25.0) | 21.5 (18.3–25.0) | 24.0 (19.0–27.5) | 0.518 |
| RVEDAI (cm2/m2) | 10.6 (9.1–11.8) | 10.6 (9.1–11.9) | 10.2 (8.6–11.3) | 0.500 |
| FAC (%) | 38.0 (35.0–41.0) | 38.0 (35.0–41.0) | 39.0 (37.5–41.5) | 0.527 |
| TAPSE (mm) | 19.0 (15.0–23.0) | 19.0 (15.0–23.0) | 19.0 (15.5–23.5) | 0.941 |
| Variables | Cox Regression | Model Fitness | |||
|---|---|---|---|---|---|
| HR | 95%CI | p-Value | X2 | X2 p-Value | |
| Diabetes | 1.87 | 0.48–7.35 | 0.368 | 0.73 | 0.393 |
| Hypertension | 1.43 | 045–4.53 | 0.541 | 0.38 | 0.378 |
| Renal insufficiency | 1.99 | 0.58–6.82 | 0.274 | 1.10 | 0.295 |
| Sleep apnea | 0.37 | 0.05–3.06 | 0.358 | 1.08 | 0.300 |
| NT-proBNP (ng/L) | 1.00 | 1.00–1.00 | 0.860 | 0.03 | 0.862 |
| LVEDVI (mL/m2) | 0.95 | 0.90–1.00 | 0.041 * | 4.85 | 0.028 * |
| LVEF (%) | 1.00 | 0.94–1.07 | 0.996 | 0.00 | 0.994 |
| LVGLS (%) | 1.08 | 0.90–1.30 | 0.395 | 0.74 | 0.391 |
| LAVI (mL/m2) | 1.02 | 0.99–1.05 | 0.233 | 1.27 | 0.260 |
| 3D LAVIR (mL/m2) | 1.01 | 0.98–1.05 | 0.287 | 1.16 | 0.297 |
| 3D LAVIP (mL/m2) | 1.05 | 0.98–1.13 | 0.203 | 1.59 | 0.207 |
| 2D LARS (%) | 0.95 | 0.90–1.00 | 0.556 | 3.90 | 0.049 * |
| 2D LAPS (%) | 1.10 | 1.00–1.20 | 0.195 | 1.70 | 0.187 |
| 3D LARS (%) | 0.89 | 0.81–0.99 | 0.025 * | 6.48 | 0.011 * |
| 3D LAPS (%) | 1.40 | 1.02–1.92 | 0.040 * | 7.04 | 0.008 * |
| LVA (cm2) | 1.00 | 0.98–1.02 | 0.947 | 0.01 | 0.946 |
| LVA (%) | 0.51 | 0.00–64.62 | 0.787 | 0.08 | 0.784 |
| Variables | Multivariable Logistic Regression | Model Fitness | |||
|---|---|---|---|---|---|
| OR | 95%CI | p-Value | X2 | X2 p-Value | |
| Age (years) | 1.03 | 0.95–1.11 | 0.514 | 2.81 | 0.590 |
| BMI, (kg/m2) | 0.94 | 0.83–1.06 | 0.323 | ||
| Hypertension | 1.14 | 0.29–4.43 | 0.850 | ||
| Diabetes | 3.42 | 0.62–18.89 | 0.159 | ||
| +3D LAVIR (mL/m2) | 1.04 | 0.98–1.08 | 0.127 | 5.05 | 0.442 |
| +3D LAVIP (mL/m2) | 1.05 | 0.99–1.07 | 0.106 | 5.86 | 0.398 |
| +2D LARS (%) | 0.90 | 0.86–1.01 | 0.076 | 6.10 | 0.299 |
| +2D LAPS (%) | 1.10 | 0.96–1.26 | 0.157 | 4.60 | 0.461 |
| +3D LARS (%) | 0.88 | 0.79–0.98 | 0.025 * | 9.23 | 0.100 |
| +3D LAPS (%) | 1.55 | 1.08–2.22 | 0.019 * | 10.43 | 0.064 |
| +LVA (%) | 1.00 | 0.95–1.06 | 0.907 | 2.82 | 0.728 |
| Variables | Multivariable Logistic Regression | Model Fitness | |||
|---|---|---|---|---|---|
| OR | 95%CI | p-Value | X2 | X2 p-Value | |
| LVEF (%) | 1.01 | 0.93–1.10 | 0.892 | 6.97 | 0.073 |
| LVEDVI (mL/m2) | 0.96 | 0.91–1.01 | 0.082 | ||
| LAVI (mL/m2) | 1.04 | 1.01–1.09 | 0.028 * | ||
| +3D LAVIR (mL/m2) | 1.04 | 0.99–1.11 | 0.095 | 7.21 | 0.241 |
| +3D LAVIP (mL/m2) | 1.01 | 0.98–1.10 | 0.094 | 8.03 | 0.156 |
| +2D LARS (%) | 0.90 | 0.88–1.03 | 0.200 | 8.77 | 0.057 |
| +2D LAPS (%) | 1.10 | 0.95–1.26 | 0.216 | 8.94 | 0.062 |
| +3D LARS (%) | 0.88 | 0.79–0.99 | 0.040 * | 11.98 | 0.018 * |
| +3D LAPS (%) | 1.45 | 1.00–2.09 | 0.048 * | 12.41 | 0.015 * |
| +LVA (%) | 0.99 | 0.94–1.05 | 0.762 | 7.12 | 0.130 |
Disclaimer/Publisher’s Note: The statements, opinions and data contained in all publications are solely those of the individual author(s) and contributor(s) and not of MDPI and/or the editor(s). MDPI and/or the editor(s) disclaim responsibility for any injury to people or property resulting from any ideas, methods, instructions or products referred to in the content. |
© 2023 by the authors. Licensee MDPI, Basel, Switzerland. This article is an open access article distributed under the terms and conditions of the Creative Commons Attribution (CC BY) license (https://creativecommons.org/licenses/by/4.0/).
Share and Cite
Krizanovic-Grgic, I.; Anwer, S.; Steffel, J.; Hofer, D.; Saguner, A.M.; Spengler, C.M.; Breitenstein, A.; Tanner, F.C. 3D Atrial Strain for Predicting Recurrence of Atrial Fibrillation after Pulmonary Vein Isolation. J. Clin. Med. 2023, 12, 3696. https://doi.org/10.3390/jcm12113696
Krizanovic-Grgic I, Anwer S, Steffel J, Hofer D, Saguner AM, Spengler CM, Breitenstein A, Tanner FC. 3D Atrial Strain for Predicting Recurrence of Atrial Fibrillation after Pulmonary Vein Isolation. Journal of Clinical Medicine. 2023; 12(11):3696. https://doi.org/10.3390/jcm12113696
Chicago/Turabian StyleKrizanovic-Grgic, Iva, Shehab Anwer, Jan Steffel, Daniel Hofer, Ardan M. Saguner, Christina M. Spengler, Alexander Breitenstein, and Felix C. Tanner. 2023. "3D Atrial Strain for Predicting Recurrence of Atrial Fibrillation after Pulmonary Vein Isolation" Journal of Clinical Medicine 12, no. 11: 3696. https://doi.org/10.3390/jcm12113696
APA StyleKrizanovic-Grgic, I., Anwer, S., Steffel, J., Hofer, D., Saguner, A. M., Spengler, C. M., Breitenstein, A., & Tanner, F. C. (2023). 3D Atrial Strain for Predicting Recurrence of Atrial Fibrillation after Pulmonary Vein Isolation. Journal of Clinical Medicine, 12(11), 3696. https://doi.org/10.3390/jcm12113696