1. Introduction
Hyperreflective foci (HRF) are small, well-circumscribed, dot-shaped lesions with equal or greater reflectivity than the retinal pigment epithelium (RPE) band on retinal optical coherence tomography (OCT) scans [
1,
2,
3,
4]. HRF have been linked with numerous retinal diseases, including diabetic retinopathy (DR) and age-related macular degeneration (AMD) [
5], often targeting the elderly population [
6] and leading to visual impairment. Past studies demonstrate the use of HRF as a biomarker to track the progressive state of retinal tissue inflammation caused by retinal diseases, such as AMD [
7,
8,
9]. HRF has also been demonstrated to have a negative correlation with visual function [
9]. The segmentation of HRF in retinal OCT scans for the purpose of identifying the formation and movement of the biomarker along the course of retinal diseases can serve as the first step in understanding the nature and severity of the disease for a particular patient. However, manual segmentation of HRF in retinal OCT volumes, which consists of hundreds of B-Scan sections, is a very tedious and error-prone process. On the other hand, automated segmentation provides a fast and accurate analysis of HRF.
There have been studies that have attempted to segment HRF manually, semi-manually or automatically using image processing and machine learning (ML)/deep learning (DL) methodologies [
10,
11,
12,
13,
14,
15]. In a manual analysis of HRF in OCT scans, a correlation between HRF and AMD was found in [
10]. Another study focused on the semi-manual analysis of HRF in OCT scans, where a semi-automated algorithm was created to quantify HRF in OCT scans and evaluated based on the results of successive OCT scans from the same patient [
10]. Neither of these methods of analysis involved the use of machine learning methods, or the use of pixel-level ground truth data for the evaluation of the algorithm. Additionally, other studies have proposed algorithms to conduct automatic segmentation of HRF in OCT scans [
11,
12,
13,
14,
15]. However, the algorithms described in these studies require a large processing time, lack a generalized approach for thresholding, and can be prone to noise from the OCT images. Furthermore, for DL based segmentation, using the whole OCT image for segmentation can lead to lower accuracy since the model is trained only on a small ratio of HRF pixels (in patches near the outer retinal layers), and DL segmentation models need to be trained on a high ratio of such pixels so they can learn their characteristics and perform well. In this paper, we propose a deep neural network to automatically segment HRF in retinal OCT scans using a patch-based approach. The image patches were extracted from OCT B-Scans and consisted of >90% retinal pixels (background was removed). We compared the patch-based approach with baseline segmentation networks trained in whole OCT B-Scans and cropped OCT B-Scans (showing only retinal pixels). We performed an evaluation of different training backbones, training loss, augmentations, and pre-processing techniques for the retinal OCT scans (full image, cropped image, and patches) to improve the segmentation training. The model was trained, validated, and tested on real-life clinical data. Our segmentation analysis on th HRFs showed that the patch-based approach, which increased the compute on more HRF pixels, provided the best segmentation accuracy, even on data that the model had not seen before.
2. Materials and Methods
2.1. Data Collection
The dataset consists of 3557 B-Scans and their corresponding ground truth (GT) masks collected from 600 DR and 2957 AMD subjects at a tertiary center at the University Eye Hospital Bonn, University of Bonn, Germany. Spectral-domain OCT imaging was performed using a Spectralis HRA+OCT (digital image resolution, 496 × 768 pixels; Heidelberg Engineering, Heidelberg, Germany) device, through the fovea. A minimum signal strength of 7 out of 10 was considered for the inclusion of data. Data was de-identified and exported in an anonymized manner. This study adhered to the tenets of the Declaration of Helsinki and was approved by the local institutional review boards at the University of Bonn (Bonn) and the University of Illinois at Chicago (UIC). The GT was generated by one grader at Bonn (MP) and two graders at UIC (MM and AS—supervised by MM). ImageJ was used to manually annotate the boundaries of HRFs found in the outer nuclear and/or outer plexiform layers for each OCT image. We measured the variability of the manual segmentation of HRFs between two sets of graders and evaluated the accuracy of the DL model compared to manual segmentation by both teams. Each of the B-Scans contained at least one HRF. The size of the B-Scans and masks are 496 × 768 pixels. The original dataset was sorted and shuffled with a random state and split 80/20 into a train and test dataset. Furthermore, the train dataset was split 80/20 to create a validation dataset. The final train, validation, and test datasets consisted of 2276, 569, and 217 B-Scans and their corresponding GT masks, respectively. We trained and evaluated the segmentation model using three schemes: with full B-Scan images, cropped B-Scan images, and patches of B-Scan images, as shown in
Figure 1.
2.2. Preprocessing of OCT Images for HRF Segmentation
A pretrained layer segmentation model was applied on each B-Scan in the train and validation datasets [
16]. The segmentation model was a convolutional neural network (CNN; DeeplabV3 with ResNet-50 backbone [
17]) previously trained on 9680 B-Scans from 80 patients with late AMD (40 patients with macular neovascularization (MNV) and 40 patients with geographic atrophy (GA)). The final model was selected on the basis of an optimal validation loss (to avoid overfitting) and then an inference model was used on our current HRF OCT data. From the qualitative observations, the majority of the hyper-reflective foci were located in the outer retina around the photoreceptor layers and outer nuclear layer (ONL).
The model identifies six different layers present in each B-Scan. Using the output layers, sixty-three 128 × 128 pixel patches were extracted for every B-Scan using the following procedure:
1. The first patch was placed at the left edge of the B-Scan (x-coordinates of 0–127) and was vertically aligned on the 3rd layer (IS) found in the patch area.
2. The next patch was horizontally straddled by 25% of the patch size (32 pixels) to the right and was vertically centered on the same layer found in the patch area.
3. Patches continued to be straddled until the last patch reached the right edge of the B-Scan. This resulted in 21 patches across the width of the B-Scan.
4. Next, each of the 21 patches was straddled vertically up and vertically down by 25% of the patch size (32 pixels). This resulted in 21 × 3 = 63 patches per B-Scan.
5. Corresponding patches were taken from the GT mask to produce 63 patches per GT mask as well.
Through this procedure, the total number of patches generated from the train and validation datasets amounted to 63 × 2845 = 179,235 B-Scan and GT mask patches. Finally, the GT mask patches and corresponding B-Scan patches were separated into HRF and Normal folders, depending on the max pixel value of each GT mask patch (where greater than 0 signifies HRF, while equal to 0 signifies Normal). The total number of B-Scan and GT mask patches labeled as HRF and Normal were 45,080 and 126,162, respectively.
2.3. Classification Model for Patches
When the model is trained on patches, an initial step of classifying whether the patch has HRF in it or not is required prior to training. This is accomplished by using a custom classification model, which was evaluated for different models (VGG-16, ResNet50, InceptionV3, and EfficientNetB0 [
18,
19,
20]). The purpose of the first classification model was to identify whether a patch had HRF or not. Therefore, we had two prediction classes: HRF and Normal. The B-Scan patches from the train and validation dataset were used to train and validate our model. Our classification model was trained using a batch size of 256 and a learning rate of 10
−4 and was trained for 50 epochs. Additionally, the patches were augmented to ensure a robust model. These augmentations included a rotation of 0–10 degrees, a brightness range of 0.8 to 1.2, and a horizontal flip. The classification model used transfer learning with ImageNet weights to reach rapid progress in training and achieve a high performance.
Figure 2 illustrates our final classification model architecture.
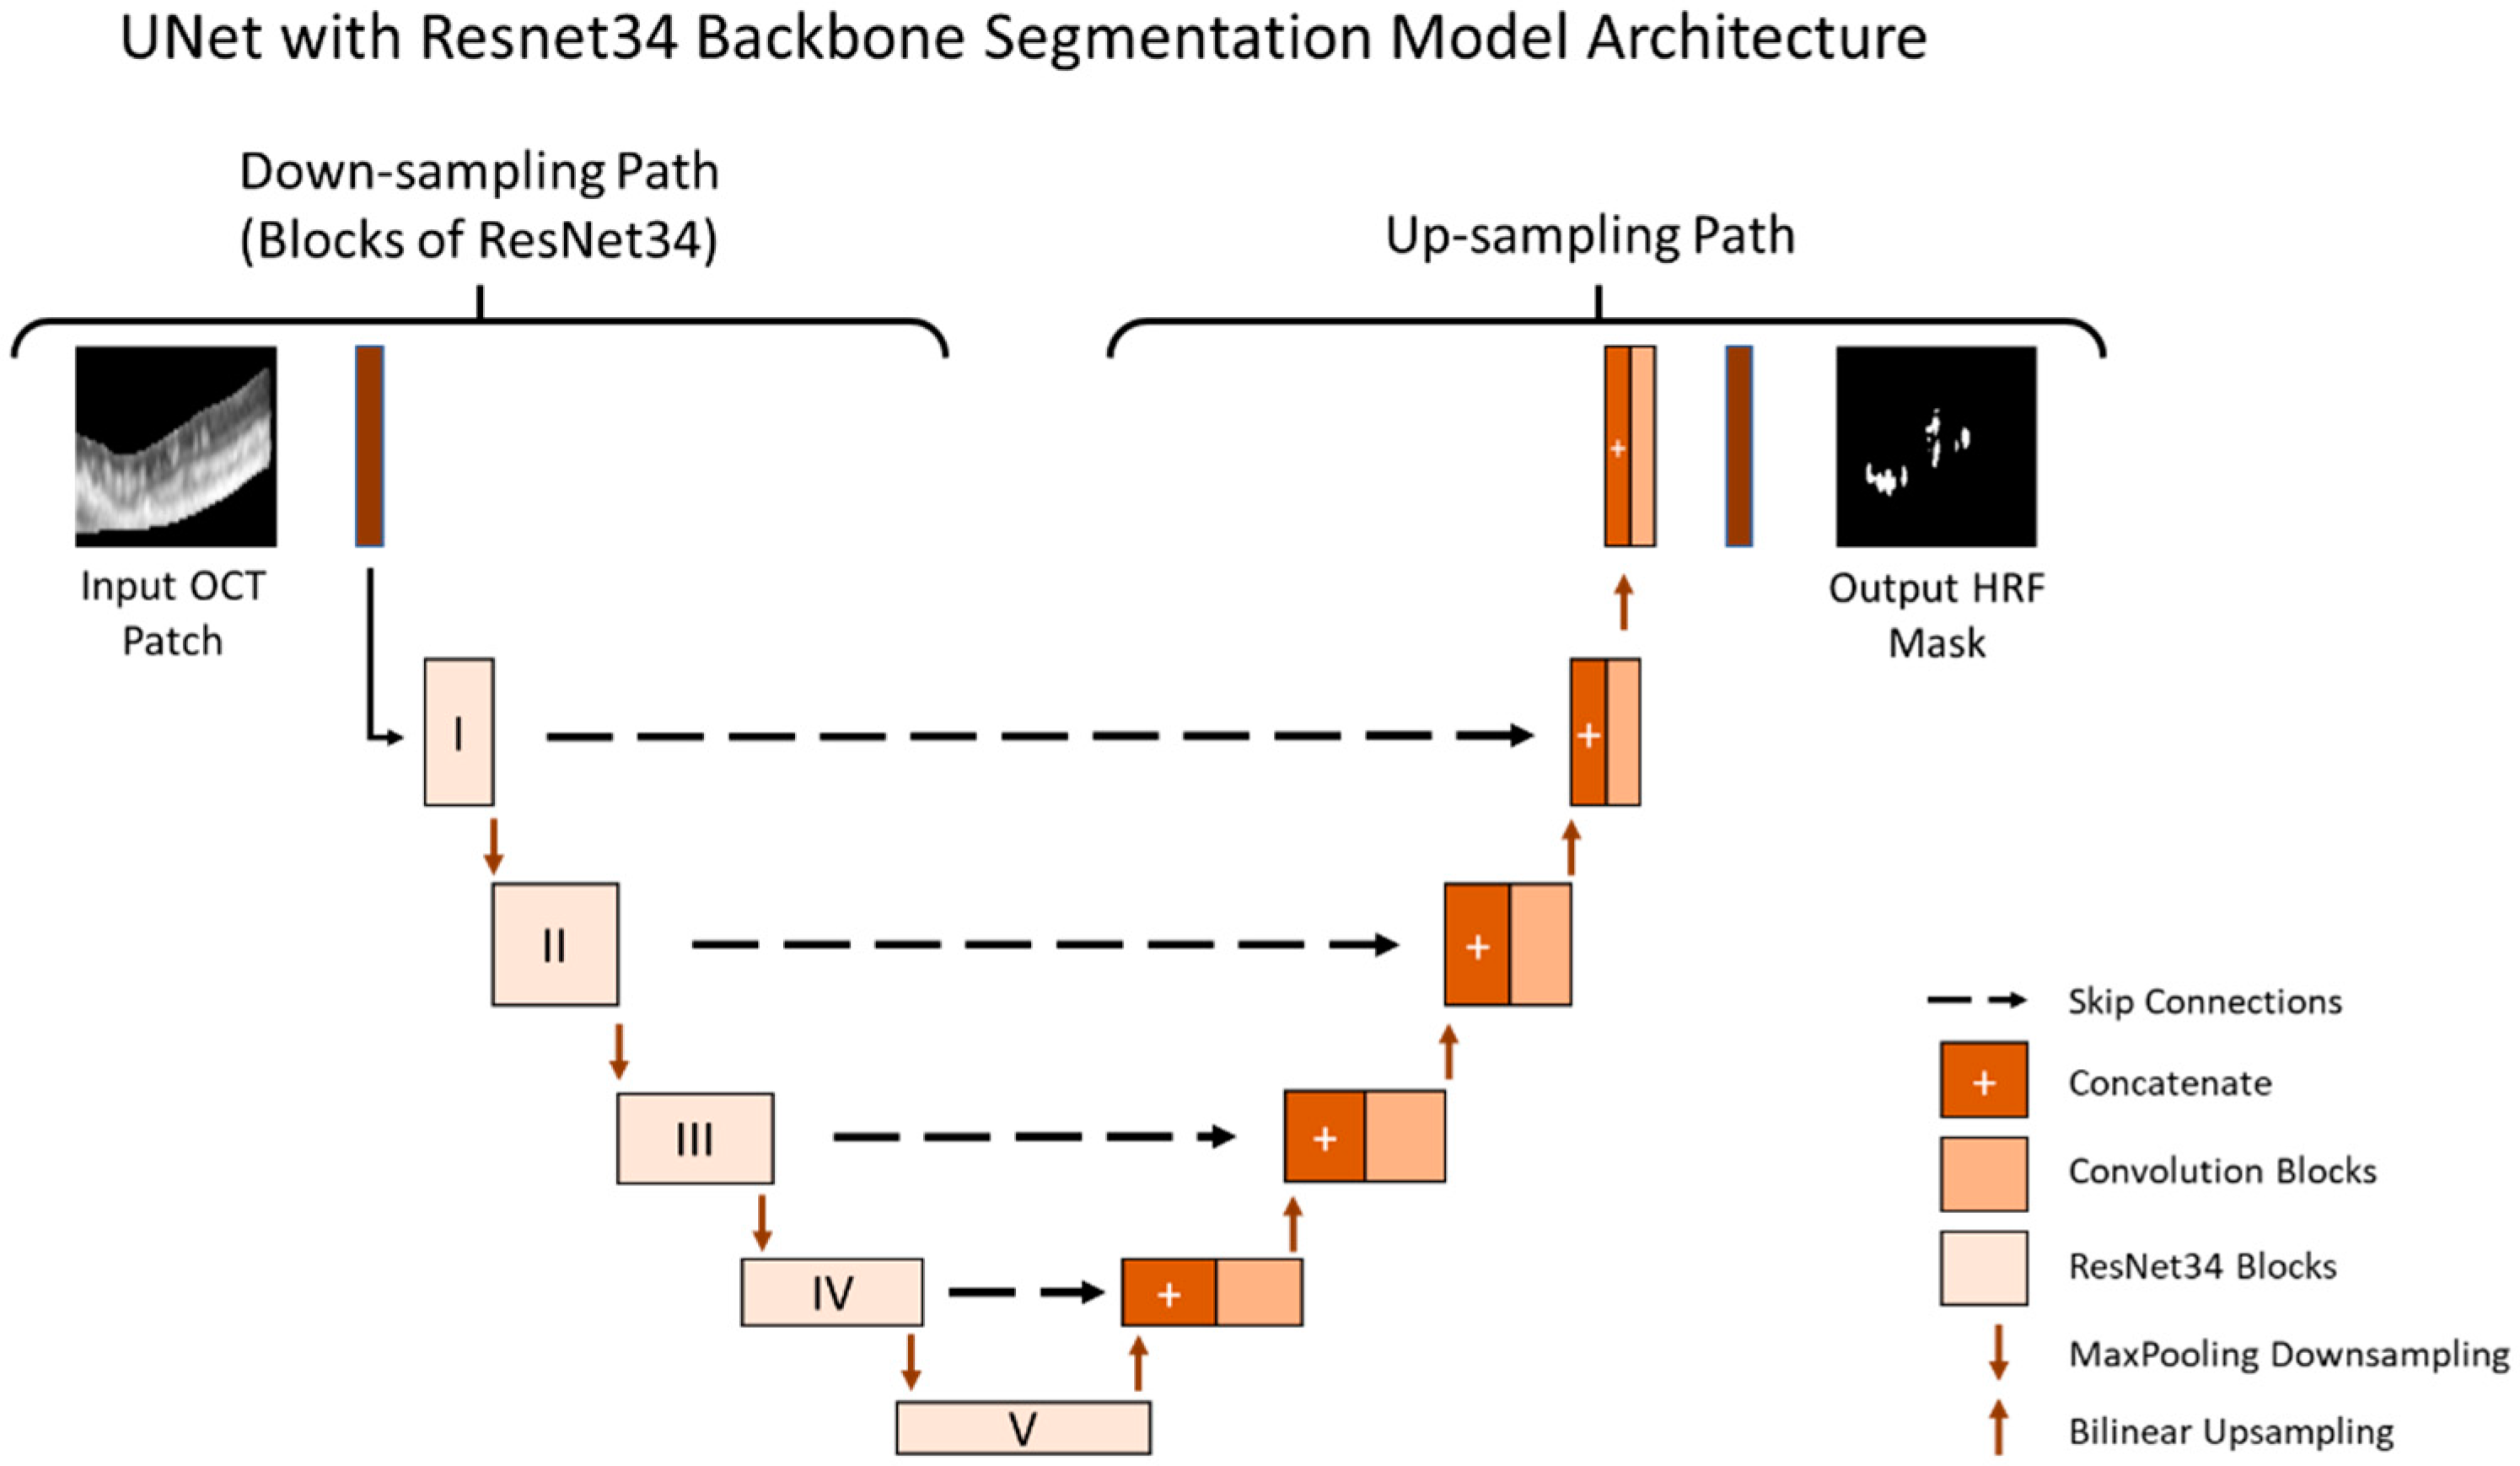
2.4. Segmentation Model for Patches
The purpose of the segmentation model was to segment the location of the HRF in the B-Scan. The B-Scan patches from the train and validation dataset that were labeled as HRF were used to train and validate our model. Our segmentation model was trained using a batch size of 10 (small due to memory limitations) and a learning rate of 10
−4 (small as it allows the model to learn more optimally) and was trained for 1500 epochs. The segmentation model used the U-Net architecture and was tested on multiple image types as shown in
Figure 1. Additionally, we conducted rigorous hypertuning, including testing different loss functions and backbones in order to achieve the highest performance. The multiple loss functions we evaluated included dice loss, Jaccard loss, and Binary Cross Entropy. Additionally, the multiple backbones we evaluated included ResNet34, InceptionV3, DenseNet169, and EfficientNetB4 with augmentations such as dilation, rotation, brightness, and horizontal flip.
All models were trained and stored at the epoch with the best performance on the validation set. The final performance for all models were evaluated on the test set. The final segmentation model is illustrated in
Figure 3.
2.5. Applying the Classification and Segmentation Model on the Test Dataset and Outcome Evaluation Criteria
For the final performance of the model using patches, a pretrained layer segmentation model was applied on each B-Scan in the test dataset. The model identified six different layers present in each B-Scan. Using the output layers, six 128 × 128 pixel patches were extracted in real-time for each B-Scan using the following procedure:
1. The first patch was placed at the left edge of the B-Scan (x-coordinates of 0–127) and was vertically aligned on the 3rd layer (IS) found in the patch area.
2. The next patch was horizontally straddled by 100% of the patch size (128 pixels) to the right and was vertically centered on the same layer found in the patch area.
3. Patches continued to be straddled until the last patch reached the right edge of the B-Scan. This resulted in 6 patches across the width of the B-Scan (6 × 128 = 768 W pixel).
Each patch was then classified as HRF or Normal using the finalized classification model. The segmentation model was then used for segmenting the location of the HRF in the patches classified as HRF. The 6 patches were stitched back into a blank image of the same size of the original B-Scan to create the predicted mask, and thus obtain the intersection over union (IOU) and Precision per B-Scan. The analysis was completed for the entire test dataset to determine the average performance metrics of the IOU, Dice, and Precision scores. Moreover, we came up with three new metrics referred to as modified_IOU, modified_Dice, and modified_Precision. We identified nxn (n = 0, 2, 4, 8) pixel window centered around the predicted pixel to see if a ground truth pixel was present.
Figure 4 shows an example of the predicted pixels (in white) and the surrounding boundary (in orange) indicating the extended HRF region in the vicinity of the prediction.
3. Results
We evaluated multiple common pre-trained models, including VGG-16, ResNet50, InceptionV3, and EfficientNetB0, and found that ResNet50 provided the best accuracy to identify HRFs in a patch.
Table 1 shows the classification results for the various models we tested.
We also evaluated multiple backbones for the U-Net HRF-segmentation models, including ResNet34, InceptionV3, DenseNet169, and EfficientNetB4, and found that ResNet34 provided the best performance.
Table 2 shows the segmentation results for the various backbones we tested on cropped images, which had only retinal pixels. The cropped images were the input to the patch-based approach; therefore, the initial screening of the backbones was performed on them.
Table 3 shows the segmentation results for the three image types and loss functions we tested using the U-Net model with the backbone of ResNet34. The best performance for IOU and Precision were obtained with Patches image type and Binary Cross Entropy loss function. Some examples of the segmentation prediction are shown in
Figure 5.
Table 4 shows the segmentation results with various window sizes, including 0 × 0 (no window), 2 × 2, 4 × 4, and 8 × 8 during the patch extraction.
4. Discussion
In this study, we implemented a deep neural network to automatically segment HRF in retinal OCT scans. We utilized a U-Net for accurate HRF segmentation. We performed an evaluation of the different training backbones (ResNet34, Inceptionv3, Densenet169, and Efficientnetb4) and observed that the ResNet34 backbone demonstrated the best results. Next, we evaluated multiple training loss functions and observed that the best choice of loss function varied with the pre-processing technique (full image, cropped image, and patches) employed to improve segmentation training. When using the full image, all three loss functions gave similar results. When using cropped images, both Dice loss and Jaccard loss gave better results. When using patches, Binary Cross Entropy gave the best results with an IOU of 0.392, Dice score of 0.502, and Precision of 0.70.
To generate the patches, we also utilized a pretrained layer segmentation model (centered patches around retinal layers with high HRF concentration). When the model is trained on patches, an initial step of classifying whether the patch has HRF in it or not is required prior to training. This is done to help increase the ratio of HRF pixels in the patches during the training and validation. Without this step, it would result in a low average precision score for the model as deep learning segmentation models need to be trained on a high ratio of pixels of interests (i.e., HRF pixels) so they can learn their characteristics and perform well. This is accomplished by using a custom classification model, which was evaluated for different models (VGG-16, ResNet50, InceptionV3, and EfficientNetB0) and Categorical Cross Entropy loss function. ResNet50 gave the best results with an Accuracy of 0.905, AUC score of 0.849, HRF Patch Precision/Recall of 0.873/0.736, and Normal Patch Precision/Recall of 0.911/0.962.
Finally, we observed that while the IOU scores were not very high, the HRF predicted pixel locations were still in the same areas of the B-Scan ground truth pixels. We believe that this would still be very helpful for the physicians who are interested in locating HRFs in the retina. We came up with a method to quantify this benefit using new metrics referred to as modified_IOU, modified_Dice, and modified_Precision. We identified a nxn pixel window centered around the predicted pixel to see if a ground truth pixel was present. Using a U-Net model with ResNet34 backbone and Binary Cross Entropy loss function, we observed that as we increased the window sizes from 0 × 0 (no window) to 2 × 2, 4 × 4, and 8 × 8, the Modified_IOU improved from 0.38 to 0.429, 0.489, and 0.526 respectively; Modified_Dice improved from 0.495 to 0.53, 0.561, and 0.579, respectively; and Modified_Precision improved from 0.681 to 0.728, 0.769, and 0.793, respectively. One thing to note is that, in this study, we employed three different graders to generate the ground truth labels for the segmentation of HRF in retinal OCT scans. The IOU score of the ground truth labels from the three graders was low, suggesting inconsistency and/or inaccuracy in the way the labeling was done. It further highlights the variability and/or difficulty in the task of manually identifying HRF in retinal OCT scans. It is known that HRFs can be characterized with variable traits and are often mis-classified by different observers. Therefore, we believe the model performed decently based on the precision score (0.75—higher than current state of the art), and the modified metrics. One limitation of the study is that the dataset is obtained from only one source that may cause the model to overfit to any peculiarities of the dataset and may not scale well to other sources of dataset. Future studies will be needed to better understand these limitations and improve prediction models.
5. Conclusions
In this research, we created a DL model to automatically segment HRF in retinal OCT scans using a patch-based approach. Compared to the state of the art, the DL model introduced in this research achieved a higher average precision. We demonstrated that by providing a higher DL compute to HRF pixels during training (patches with HRFs), we can improve the model’s performance significantly. This automated HRF segmentation pipeline can be used for analyzing HRF biomarkers for different retinopathies.
Author Contributions
S.G. conducted the experiments and analysis for the HRF segmentation; A.S., M.P. and M.M. were graders for the HRF annotations, and helped with the manuscript review; M.P. developed the OCT segmentation software; R.V.P.C., J.I.L., M.M. and J.H. helped with interpreting the results, and writing and reviewing the study; M.A. helped with conceptualizing, interpreting the data and results, and supervised the project. All authors have read and agreed to the published version of the manuscript.
Funding
This research received no external funding.
Institutional Review Board Statement
The study was conducted in accordance with the Declaration of Helsinki and approved by the Institutional Review Board of Uni-Bonn and UIC (45 CFR 46.110).
Informed Consent Statement
Informed consent was obtained from all subjects involved in the study.
Data Availability Statement
Bonn data may be made available upon reasonable request.
Conflicts of Interest
The authors declare no conflict of interest.
References
- Liu, S.; Wang, D.; Chen, F.; Zhang, X. Hyperreflective foci in OCT image as a biomarker of poor prognosis in diabetic macular edema patients treating with Conbercept in China. BMC Ophthalmol. 2019, 19, 157. [Google Scholar] [CrossRef]
- Christenbury, J.G.; Folgar, F.A.; O’Connell, R.V.; Chiu, S.J.; Farsiu, S.; Toth, C.A.; Age-Related Eye Disease Study 2 Ancillary Spectral Domain Optical Coherence Tomography Study Group. Progression of intermediate age-related macular degeneration with proliferation and inner retinal migration of hyperreflective foci. Ophthalmology 2013, 120, 1038–1045. [Google Scholar] [CrossRef]
- De Benedetto, U.; Sacconi, R.; Pierro, L.; Lattanzio, R.; Bandello, F. Optical coherence tomographic hyperreflective foci in early stages of diabetic retinopathy. Retina 2015, 35, 449–453. [Google Scholar] [CrossRef] [PubMed]
- Chatziralli, I.P.; Sergentanis, T.N.; Sivaprasad, S. Hyperreflective foci as an independent visual outcome predictor in macular edema due to retinal vascular diseases treated with intravitreal dexamethasone or ranibizumab. Retina 2016, 36, 2319–2328. [Google Scholar] [CrossRef] [PubMed]
- Schuman, S.G.; Koreishi, A.F.; Farsiu, S.; Jung, S.H.; Izatt, J.A.; Toth, C.A. Photoreceptor layer thinning over drusen in eyes with age-related macular degeneration imaged in vivo with spectral-domain optical coherence tomography. Ophthalmology 2009, 116, 488–496.e2. [Google Scholar] [CrossRef] [PubMed]
- Flaxman, S.R.; Bourne, R.R.; Resnikoff, S.; Ackland, P.; Braithwaite, T.; Cicinelli, M.V.; Das, A.; Jonas, J.B.; Keeffe, J.; Kempen, J.H.; et al. Global causes of blindness and distance vision impairment 1990–2020: A systematic review and meta-analysis. Lancet Glob. Health 2017, 5, e1221–e1234. [Google Scholar] [CrossRef] [PubMed]
- Wu, J.; Zhang, C.; Yang, Q.; Xie, H.; Zhang, J.; Qiu, Q.; Liu, K.; Luo, D.; Liu, F.; Zhang, J. Imaging hyperreflective foci as an inflammatory biomarker after anti-VEGF treatment in neovascular age-related macular degeneration patients with optical coherence tomography angiography. BioMed Res. Int. 2021, 2021, 6648191. [Google Scholar] [CrossRef] [PubMed]
- Sleiman, K.; Veerappan, M.; Winter, K.P.; McCall, M.N.; Yiu, G.; Farsiu, S.; Chew, E.Y.; Clemons, T.; Toth, C.A. Optical coherence tomography predictors of risk for progression to non-neovascular atrophic age-related macular degeneration. Ophthalmology 2017, 124, 1764–1777. [Google Scholar] [CrossRef] [PubMed]
- Segal, O.; Barayev, E.; Nemet, A.Y.; Geffen, N.; Vainer, I.; Mimouni, M. Prognostic value of hyperreflective foci in neovascular age-related macular degeneration treated with bevacizumab. Retina 2016, 36, 2175–2182. [Google Scholar] [CrossRef] [PubMed]
- Korot, E.; Comer, G.; Steffens, T.; Antonetti, D.A. Algorithm for the measure of vitreous hyperreflective foci in optical coherence tomographic scans of patients with diabetic macular edema. JAMA Ophthalmol. 2016, 134, 15–20. [Google Scholar] [CrossRef] [PubMed]
- Midena, E.; Torresin, T.; Velotta, E.; Pilotto, E.; Parrozzani, R.; Frizziero, L. OCT hyperreflective retinal foci in diabetic retinopathy: A semi-automatic detection comparative study. Front. Immunol. 2021, 12, 613051. [Google Scholar] [CrossRef] [PubMed]
- Schlegl, T.; Bogunovic, H.; Klimscha, S.; Seeböck, P.; Sadeghipour, A.; Gerendas, B.; Waldstein, S.M.; Langs, G.; Schmidt-Erfurth, U. Fully automated segmentation of hyperreflective foci in optical coherence tomography images. arXiv 2018, arXiv:1805.03278. [Google Scholar]
- Schmidt, M.F.; Christensen, J.L.; Dahl, V.A.; Toosy, A.; Petzold, A.; Hanson, J.V.M.; Schippling, S.; Frederiksen, J.L.; Larsen, M. Automated detection of hyperreflective foci in the outer nuclear layer of the retina. Acta Ophthalmol. 2022. [Google Scholar] [CrossRef] [PubMed]
- Yu, C.; Xie, S.; Niu, S.; Ji, Z.; Fan, W.; Yuan, S.; Liu, Q.; Chen, Q. Hyper-reflective foci segmentation in SD-OCT retinal images with diabetic retinopathy using deep convolutional neural networks. Med. Phys. 2019, 46, 4502–4519. [Google Scholar] [CrossRef]
- Yao, C.; Wang, M.; Zhu, W.; Huang, H.; Shi, F.; Chen, Z.; Wang, L.; Wang, T.; Zhou, Y.; Peng, Y.; et al. Joint Segmentation of Multi-Class Hyper-Reflective Foci in Retinal Optical Coherence Tomography Images. IEEE Trans. Biomed. Eng. 2022, 69, 1349–1358. [Google Scholar] [CrossRef]
- Pfau, M.; von der Emde, L.; de Sisternes, L.; Hallak, J.A.; Leng, T.; Schmitz-Valckenberg, S.; Holz, F.G.; Fleckenstein, M.; Rubin, D.L. Progression of photoreceptor degeneration in geographic atrophy secondary to age-related macular degeneration. JAMA Ophthalmol. 2020, 138, 1026–1034. [Google Scholar] [CrossRef] [PubMed]
- Chen, L.-C.; Papandreou, G.; Schroff, F.; Adam, H. Rethinking atrous convolution for semantic image segmentation. arXiv 2017, arXiv:1706.05587. [Google Scholar]
- He, K.; Zhang, X.; Ren, S.; Sun, J. Deep residual learning for image recognition. In Proceedings of the IEEE Conference on Computer Vision and Pattern Recognition, Las Vegas, NV, USA, 27–30 June 2016. [Google Scholar]
- Szegedy, C.; Vanhoucke, V.; Ioffe, S.; Shlens, J.; Wojna, Z. Rethinking the inception architecture for computer vision. In Proceedings of the IEEE Conference on Computer Vision and Pattern Recognition, Las Vegas, NV, USA, 27–30 June 2016. [Google Scholar]
- Tan, M.; Le, Q. Efficientnet: Rethinking model scaling for convolutional neural networks. In Proceedings of the International Conference on Machine Learning, Long Beach, CA, USA, 10–15 June 2019. [Google Scholar]
| Publisher’s Note: MDPI stays neutral with regard to jurisdictional claims in published maps and institutional affiliations. |
© 2022 by the authors. Licensee MDPI, Basel, Switzerland. This article is an open access article distributed under the terms and conditions of the Creative Commons Attribution (CC BY) license (https://creativecommons.org/licenses/by/4.0/).


 ,
, 


