
Plasma Amino Acids May Improve Prediction Accuracy of Cerebral Vasospasm after Aneurysmal Subarachnoid Haemorrhage

 ,
,  , , , and
Abstract
:1. Introduction
2. Materials and Methods
2.1. Participants
2.2. Cerebral Vasospasm
2.3. Sample Collection
2.4. Chemicals and Reagents
2.5. Sample Preparation
2.6. HPLC-MS Analysis
2.7. Statistics
3. Results
4. Discussion
5. Conclusions
Author Contributions
Funding
Institutional Review Board Statement
Informed Consent Statement
Data Availability Statement
Conflicts of Interest
References
- Feigin, V.L.; Lawes, C.M.; Bennett, D.A.; Barker-Collo, S.L.; Parag, V. Worldwide stroke incidence and early case fatality reported in 56 population-based studies: A systematic review. Lancet Neurol. 2009, 8, 355–369. [Google Scholar] [CrossRef]
- Ingall, T.; Asplund, K.; Mähönen, M.; Bonita, R. A Multinational Comparison of Subarachnoid Hemorrhage Epidemiology in the WHO MONICA Stroke Study. Stroke 2000, 31, 1054–1061. [Google Scholar] [CrossRef] [PubMed]
- Etminan, N.; Chang, H.-S.; Hackenberg, K.; De Rooij, N.K.; Vergouwen, M.D.I.; Rinkel, G.J.E.; Algra, A. Worldwide Incidence of Aneurysmal Subarachnoid Hemorrhage According to Region, Time Period, Blood Pressure, and Smoking Prevalence in the Population. JAMA Neurol. 2019, 76, 588–597. [Google Scholar] [CrossRef]
- Jaskólski, D.; Zawirski, M. Pathophysiology of cerebral vasospasm after subarachnoid hemorrhage from ruptured intracranial aneurysm. Pol. Tyg. Lek. 1988, 43, 748–752. [Google Scholar] [PubMed]
- Hamby, W.B. Spontaneous Subarachnoid Hemorrhage of Aneurysmal Origin. J. Am. Med Assoc. 1948, 136, 522–528. [Google Scholar] [CrossRef]
- Hunt, W.E.; Hess, R.M. Surgical Risk as Related to Time of Intervention in the Repair of Intracranial Aneurysms. J. Neurosurg. 1968, 28, 14–20. [Google Scholar] [CrossRef] [PubMed] [Green Version]
- Rumalla, K.; Lin, M.; Ding, L.; Gaddis, M.; Giannotta, S.L.; Attenello, F.J.; Mack, W.J. Risk Factors for Cerebral Vasospasm in Aneurysmal Subarachnoid Hemorrhage: A Population-Based Study of 8346 Patients. World Neurosurg. 2021, 145, e233–e241. [Google Scholar] [CrossRef]
- Muirhead, W.R.; Grover, P.J.; Toma, A.K.; Stoyanov, D.; Marcus, H.J.; Murphy, M. Adverse intraoperative events during surgical repair of ruptured cerebral aneurysms: A systematic review. Neurosurg. Rev. 2021, 44, 1273–1285. [Google Scholar] [CrossRef] [PubMed]
- Connolly, E.S.; Rabinstein, A.A.; Carhuapoma, J.; Derdeyn, C.; Dion, J.; Higashida, R.T.; Hoh, B.L.; Kirkness, C.J.; Naidech, A.M.; Ogilvy, C.S.; et al. Guidelines for the Management of Aneurysmal Subarachnoid Hemorrhage. Stroke 2012, 43, 1711–1737. [Google Scholar] [CrossRef] [Green Version]
- Harris, L.; Hill, C.S.; Elliot, M.; Fitzpatrick, T.; Ghosh, A.; Vindlacheruvu, R. Comparison between outcomes of endovascular and surgical treatments of ruptured anterior communicating artery aneurysms. Br. J. Neurosurg. 2021, 35, 313–318. [Google Scholar] [CrossRef]
- Greenberg, E.; Gold, R.; Reichman, M.; John, M.; Ivanidze, J.; Edwards, A.; Johnson, C.; Comunale, J.; Sanelli, P. Diagnostic Accuracy of CT Angiography and CT Perfusion for Cerebral Vasospasm: A Meta-Analysis. Am. J. Neuroradiol. 2010, 31, 1853–1860. [Google Scholar] [CrossRef] [PubMed] [Green Version]
- Vajkoczy, P.; Horn, P.; Thome, C.; Munch, E.; Schmiedek, P. Regional cerebral blood flow monitoring in the diagnosis of delayed ischemia following aneurysmal subarachnoid hemorrhage. J. Neurosurg. 2003, 98, 1227–1234. [Google Scholar] [CrossRef] [Green Version]
- Przybycien-Szymanska, M.M.; Ashley, W.W. Biomarker Discovery in Cerebral Vasospasm after Aneurysmal Subarachnoid Hemorrhage. J. Stroke Cerebrovasc. Dis. 2015, 24, 1453–1464. [Google Scholar] [CrossRef] [PubMed]
- Wiśniewski, K.; Popęda, M.; Tomasik, B.; Bieńkowski, M.; Bobeff, E.J.; Stefańczyk, L.; Tybor, K.; Hupało, M.; Jaskólski, D.J. The Role of Urine F2-ISOPROSTANE Concentration in Delayed Cerebral Ischemia after Aneurysmal Subarachnoid Haemorrhage—A Poor Prognostic Factor. Diagnostics 2020, 11, 5. [Google Scholar] [CrossRef] [PubMed]
- Kole, M.J.; Wessell, A.P.; Ugiliweneza, B.; Cannarsa, G.J.; Fortuny, E.; Stokum, A.J.; Shea, P.; Chryssikos, T.; Khattar, N.K.; Crabill, A.G.; et al. Low-Dose Intravenous Heparin Infusion after Aneurysmal Subarachnoid Hemorrhage is Associated with Decreased Risk of Delayed Neurological Deficit and Cerebral Infarction. Neurosurgery 2021, 88, 523–530. [Google Scholar] [CrossRef]
- Touho, H.; Karasawa, J.; Shishido, H.; Morisako, T.; Yamada, K.; Shibamoto, K. Hypermetabolism in the acute stage of hemorrhagic cerebrovascular disease. J. Neurosurg. 1990, 72, 710–714. [Google Scholar] [CrossRef] [PubMed]
- Suojaranta-Ylinen, R. Hypermetabolism and Increased Peripheral Release of Amino Acids After Subarachnoidal Hemorrhage and Its Operative Treatment. Nutrition 1996, 12, 327–333. [Google Scholar] [CrossRef]
- Hersio, K.; Vapalahti, M.; Kari, A.; Takala, J.; Hernesniemi, J.; Tapaninaho, A.; Luukkonen, M. Impaired utilization of exogenous amino acids after surgery for subarachnoid haemorrhage. Acta Neurochir. 1990, 106, 13–17. [Google Scholar] [CrossRef]
- Jobard, E.; Trédan, O.; Postoly, D.; André, F.; Martin, A.-L.; Elena-Herrmann, B.; Boyault, S. A Systematic Evaluation of Blood Serum and Plasma Pre-Analytics for Metabolomics Cohort Studies. Int. J. Mol. Sci. 2016, 17, 2035. [Google Scholar] [CrossRef] [Green Version]
- R Core Team. R: A Language and Environment for Statistical Computing; R Foundation for Statistical Computing: Vienna, Austria, 2017; Available online: https://www.R-project.org/ (accessed on 20 July 2021).
- Dorsch, N.W. Cerebral arterial spasm-a clinical review. Br. J. Neurosurg. 1995, 9, 403–412. [Google Scholar] [CrossRef]
- Hayashi, T.; Suzuki, A.; Hatazawa, J.; Hadeishi, H.; Shirane, R.; Tominaga, T.; Yasui, N. Post-operative changes of cerebral circulation and metabolism in the acute stage of low-grade aneurysmal subarachnoid hemorrhage. Neurol. Res. 2008, 30, 678–683. [Google Scholar] [CrossRef]
- Hayashi, T.; Suzuki, A.; Hatazawa, J.; Kanno, I.; Shirane, R.; Yoshimoto, T.; Yasui, N. Cerebral circulation and metabolism in the acute stage of subarachnoid hemorrhage. J. Neurosurg. 2000, 93, 1014–1018. [Google Scholar] [CrossRef] [Green Version]
- Wagner, M.; Jurcoane, A.; Hildebrand, C.; Güresir, E.; Vatter, H.; Zanella, F.; Berkefeld, J.; Pilatus, U.; Hattingen, E. Metabolic Changes in Patients with Aneurysmal Subarachnoid Hemorrhage Apart from Perfusion Deficits: Neuronal Mitochondrial Injury? Am. J. Neuroradiol. 2013, 34, 1535–1541. [Google Scholar] [CrossRef] [Green Version]
- Bobeff, E.J.; Szczesna, D.; Bieńkowski, M.; Janczar, K.; Chmielewska-Kassassir, M.; Wiśniewski, K.; Papierz, W.; Wozniak, L.A.; Jaskólski, D.J. Plasma amino acids indicate glioblastoma with ATRX loss. Amino Acids 2021, 53, 119–132. [Google Scholar] [CrossRef]
- Guan, Z.; Lan, H.; Cai, X.; Zhang, Y.; Liang, A.; Li, J. Blood–Brain Barrier, Cell Junctions, and Tumor Microenvironment in Brain Metastases, the Biological Prospects and Dilemma in Therapies. Front. Cell Dev. Biol. 2021, 9. [Google Scholar] [CrossRef] [PubMed]
- Suzuki, H.; Kanamaru, H. Potential therapeutic molecular targets for blood-brain barrier disruption after subarachnoid hemorrhage. Neural Regen. Res. 2019, 14, 1138–1143. [Google Scholar] [CrossRef] [PubMed]
- Macdonald, R.L.; Weir, B.K.A.; Young, J.D.; Grace, M.G.A. Cytoskeletal and extracellular matrix proteins in cerebral arteries following subarachnoid hemorrhage in monkeys. J. Neurosurg. 1992, 76, 81–90. [Google Scholar] [CrossRef]
- Kruse, T.; Reiber, H.; Neuhoff, V. Amino acid transport across the human blood-CSF barrier: An evaluation graph for amino acid concentrations in cerebrospinal fluid. J. Neurol. Sci. 1985, 70, 129–138. [Google Scholar] [CrossRef]
- Wang, T.; Wang, Y.-X.; Dong, Y.-Q.; Yu, Y.-L.; Ma, K. Prolyl 4-hydroxylase subunit alpha 3 presents a cancer promotive function in head and neck squamous cell carcinoma via regulating epithelial-mesenchymal transition. Arch. Oral Biol. 2020, 113, 104711. [Google Scholar] [CrossRef]
- Majamaa, K.; Myllylä, V.V. A disorder of collagen biosynthesis in patients with cerebral artery aneurysm. Biochim. Biophys. Acta BBA-Mol. Basis Dis. 1993, 1225, 48–52. [Google Scholar] [CrossRef]
- Kotch, F.W.; Guzei, I.A.; Raines, R.T. Stabilization of the Collagen Triple Helix by O-Methylation of Hydroxyproline Residues. J. Am. Chem. Soc. 2008, 130, 2952–2953. [Google Scholar] [CrossRef] [Green Version]
- Sokół, B.; Urbaniak, B.; Wąsik, N.; Plewa, S.; Klupczynska, A.; Jankowski, R.; Więckowska, B.; Juszkat, R.; Kokot, Z. Amino Acids in Cerebrospinal Fluid of Patients with Aneurysmal Subarachnoid Haemorrhage: An Observational Study. Front. Neurol. 2017, 8, 438. [Google Scholar] [CrossRef] [PubMed] [Green Version]
- Siddiqi, N.J.; Alhomida, A.S. Distribution of Total, Free, Peptide-bound and Protein-bound Hydroxyproline in the Erythrocytes from Different Species. Comp. Haematol. Int. 2002, 11, 123–128. [Google Scholar] [CrossRef]
- Dhandapani, S.; Goudihalli, S.; Mukherjee, K.K.; Singh, H.; Srinivasan, A.; Danish, M.; Mahalingam, S.; Dhandapani, M.; Gupta, S.K.; Khandelwal, N.; et al. Prospective study of the correlation between admission plasma homocysteine levels and neurological outcome following subarachnoid hemorrhage: A case for the reverse epidemiology paradox? Acta Neurochir. 2014, 157, 399–407. [Google Scholar] [CrossRef] [PubMed]
- Kumar, M.; Goudihalli, S.; Mukherjee, K.; Dhandapani, S.; Sandhir, R. Methylenetetrahydrofolate reductase C677T variant and hyperhomocysteinemia in subarachnoid hemorrhage patients from India. Metab. Brain Dis. 2018, 33, 1617–1624. [Google Scholar] [CrossRef] [PubMed]
- Fernstrom, J.D.; Fernstrom, M.H. Tyrosine, Phenylalanine, and Catecholamine Synthesis and Function in the Brain. J. Nutr. 2007, 137, 1539S–1547S. [Google Scholar] [CrossRef] [PubMed]
- Lambert, G.; Naredi, S.; Edén, E.; Rydenhag, B.; Friberg, P. Monoamine metabolism and sympathetic nervous activation following subarachnoid haemorrhage: Influence of gender and hydrocephalus. Brain Res. Bull. 2002, 58, 77–82. [Google Scholar] [CrossRef]
- Minegishi, A.; Ishizaki, T.; Yoshida, Y.; Ahagon, A.; Shibata, N.; Kobayashi, H. Plasma Monoaminergic Metabolites and Catecholamines in Subarachnoid Hemorrhage. Arch. Neurol. 1987, 44, 423–428. [Google Scholar] [CrossRef]
- Hasegawa, Y.; Uchikawa, H.; Kajiwara, S.; Morioka, M. Central sympathetic nerve activation in subarachnoid hemorrhage. J. Neurochem. 2021, 160, 34–50. [Google Scholar] [CrossRef]
- Zetterling, M.; Hillered, L.; Samuelsson, C.; Karlsson, T.; Enblad, P.; Ronne-Engström, E. Temporal patterns of interstitial pyruvate and amino acids after subarachnoid haemorrhage are related to the level of consciousness—A clinical microdialysis study. Acta Neurochir. 2009, 151, 771–780. [Google Scholar] [CrossRef]
- Li, Y.-C.; Wang, R.; Xu, M.-M.; Jing, X.-R.; Ji-Ye, A.; Sun, R.-B.; Na, S.-J.; Liu, T.; Ding, X.-S.; Sun, C.-Y.; et al. Aneurysmal Subarachnoid Hemorrhage Onset Alters Pyruvate Metabolism in Poor-Grade Patients and Clinical Outcome Depends on More: A Cerebrospinal Fluid Metabolomic Study. ACS Chem. Neurosci. 2019, 10, 1660–1667. [Google Scholar] [CrossRef] [PubMed]
- Appel, D.; Seeberger, M.; Schwedhelm, E.; Czorlich, P.; Goetz, A.E.; Böger, R.H.; Hannemann, J. Asymmetric and Symmetric Dimethylarginines are Markers of Delayed Cerebral Ischemia and Neurological Outcome in Patients with Subarachnoid Hemorrhage. Neurocrit. Care 2018, 29, 84–93. [Google Scholar] [CrossRef]
- Staalsø, J.M.; Bergström, A.; Edsen, T.; Weikop, P.; Romner, B.; Olsen, N.V. Low Plasma Arginine: Asymmetric Dimethyl Arginine Ratios Predict Mortality after Intracranial Aneurysm Rupture. Stroke 2013, 44, 1273–1281. [Google Scholar] [CrossRef] [PubMed] [Green Version]
- Von Holst, H.; Hagenfeldt, L. Increased levels of amino acids in human lumbar and central cerebrospinal fluid after subarachnoid haemorrhage. Acta Neurochir. 1985, 78, 46–56. [Google Scholar] [CrossRef]
- Fawcett, J.W.; Asher, R. The glial scar and central nervous system repair. Brain Res. Bull. 1999, 49, 377–391. [Google Scholar] [CrossRef]
- Raivich, G.; Bohatschek, M.; Kloss, C.U.; Werner, A.; Jones, L.L.; Kreutzberg, G.W. Neuroglial activation repertoire in the injured brain: Graded response, molecular mechanisms and cues to physiological function. Brain Res. Rev. 1999, 30, 77–105. [Google Scholar] [CrossRef]
- Bellapart, J.; Jones, L.; Bandeshe, H.; Boots, R. Plasma Endothelin-1 as Screening Marker for Cerebral Vasospasm After Subarachnoid Hemorrhage. Neurocrit. Care 2013, 20, 77–83. [Google Scholar] [CrossRef] [PubMed]


| Time of Elution | Eluent A | Eluent B |
|---|---|---|
| (min) | (%) | (%) |
| 0 | 80 | 20 |
| 7 | 50 | 50 |
| 7.1 | 5 | 95 |
| 9 | 5 | 95 |
| 9.1 | 80 | 20 |
| 11 | 80 | 20 |
| Characteristic | n = 35 |
|---|---|
| Male | 15 (42.9%) |
| Age | 55 (39–62) |
| Length of stay at the dept. of neurosurgery | 15 (10–21) |
| Aneurysm location | |
| Anterior communicating artery | 19 (54.3%) |
| Middle cerebral artery | 9 (25.7%) |
| Internal carotid artery | 2 (5.7%) |
| Posterior communicating artery | 2 (5.7%) |
| Basilar artery | 1 (2.9%) |
| Posterior inferior cerebellar artery | 1 (2.9%) |
| Pericallosal artery | 1 (2.9%) |
| Clinical state on admission | |
| Hunt-Hess score | 3 (2–3) |
| 1 | 5 (14.3%) |
| 2 | 11 (31.4%) |
| 3 | 19 (54.3%) |
| Fisher score | 4 (2–4) |
| WFNS score | 2 (1–4) |
| GCS score | 14 (10–15) |
| Nuchal rigidity | 29 (82.9%) |
| Neurological deficit | 3 (8.6%) |
| Surgical clipping | 34 (97.1%) |
| Endovascular coiling | 1 (2.9%)—BAA |
| Cerebral vasospasm CVS | 18 (51.4%) |
| Disorientation | 17 (94.4%) |
| New or increasing headache | 11 (61.1%) |
| Focal neurological signs | 9 (50%) |
| Lethargy | 5 (27.8%) |
| Occurrence of CVS (postoperative day) | 5 (4–6) |
| Treatment outcome | |
| GOS at discharge | 4 (3–4) |
| GOS at discharge ≥4 (good outcome) | 18 (51.4%) |
| GOS at one year | 4 (2–4) |
| GOS at one year ≥4 (good outcome) | 23 (65.7%) |
| mRS | 2 (2–5) |
| Poor Outcome after 12 Months GOS 1–3, n = 12 | Good Outcome after 12 Months GOS 4–5, n = 23 | p Value | CVS n = 18 | No CVS n = 17 | p Value | Control Group | |
|---|---|---|---|---|---|---|---|
| Age | 60.5 (36.25–62.75) | 52 (39–61) | 0.424 | 56 (46–63.5) | 55 (33.5–61) | 0.215 | 50 (38–56) |
| Male | 7 (58.3%) | 8 (34.8%) | 0.282 | 10 (55.6%) | 5 (29.4%) | 0.176 | 18 (48.6%) |
| LOS | 18.5 (14.5–42.5) | 12 (9–19) | 0.033 * | 20.5 (15–30.25) | 10 (8.5–14) | <0.001 * | |
| Hunt-Hess score | 3 (2.25–3) | 2 (2–3) | 0.140 | 3 (2.75–3) | 2 (1–3) | 0.002 * | |
| Fisher score | 4 (4–4) | 3 (2–4) | 0.009 * | 4 (3–4) | 3 (1.5–4) | 0.004 * | |
| WFNS score | 4 (2–4) | 1 (1–4) | 0.051 | 4 (2–4) | 1 (1–2) | 0.003 * | |
| GCS score | 11 (9–13.8) | 15 (12–15) | 0.026 * | 11.5 (9–14) | 15 (14–15) | 0.004 * | |
| Nuchal rigidity | 11 (91.7%) | 18 (78.3%) | 0.640 | 17 (94.4%) | 12 (70.6%) | 0.088 | |
| Neurological deficit | 3 (25%) | 0 | 0.034 * | 2 (11.1%) | 1 (5.9%) | 1.000 | |
| POD-1 Alanine | 153.3 (103.7–186.4) | 156.8 (120–233.4) | 0.362 | 151 (105.3–192.3) | 162.2 (126.1–226.3) | 0.287 | 266.6 (206.3–311.8) |
| POD-7 Alanine | 186.3 (109.4–249.5) | 140.6 (109.7–163.5) | 0.132 | 120.9 (103.9–218.4) | 147.4 (113.7–175.5) | 0.636 | |
| POD-1 Arginine | 39.9 (35.1–45.3) | 37.1 (32–50.5) | 0.824 | 41.4 (34.6–50.1) | 36.8 (30.5–47.6) | 0.245 | 39.6 (32.8–57.3) |
| POD-7 Arginine | 48.1 (36.3–53.8) | 39.1 (30.8–48.6) | 0.151 | 47.8 (39–51.9) | 36.9 (28.2–46.4) | 0.038 * | |
| POD-1 Asparagine | 17.6 (15.7–22.6) | 19.2 (16.7–22) | 0.461 | 18.8 (16.5–24.3) | 18.5 (15.8–21.3) | 0.590 | 19.2 (13.6–26.4) |
| POD-7 Asparagine | 22.7 (17.1–25.9) | 19.8 (16.6–21.6) | 0.420 | 20.8 (16.8–25.6) | 19.6 (16.6–23.8) | 0.708 | |
| POD-1 Glutamine | 938.3 (823.9–1168.5) | 960.9 (867.1–1340.5) | 0.668 | 1053.7 (829.7–1345.3) | 924.5 (875.2–1107.9) | 0.318 | 915.8 (774.1–1071.1) |
| POD-7 Glutamine | 1163.9 (859.5–1301.4) | 1094 (963.2–1238.6) | 0.771 | 1048.8 (935.7–1301.4) | 1161.1 (952.9–1247.1) | 0.757 | |
| POD-1 Glutamic acid | 41.7 (38.8–56.6) | 50.7 (39.2–62.7) | 0.503 | 44 (38.3–60.9) | 42.1 (39.7–61.1) | 0.782 | 71.2 (61.2–92.5) |
| POD-7 Glutamic acid | 51.2 (38.7–61.9) | 47.8 (37.9–58.6) | 0.572 | 53 (41.9–65.9) | 46.5 (34.9–55.8) | 0.103 | |
| POD-1 Glycine | 102.1 (86.4–134.6) | 107.6 (91.6–131.4) | 0.932 | 114.9 (98.4–134.4) | 93.9 (83–125.5) | 0.126 | 178.8 (156.8–215.6) |
| POD-7 Glycine | 140.2 (90.7–196.3) | 111.9 (89.1–146.4) | 0.362 | 140.2 (99.9–171.8) | 100.1 (83.4–144.8) | 0.057 | |
| POD-1 Isoleucine | 28.6 (21–35.5) | 34.6 (22.8–44.5) | 0.461 | 33.9 (23.7–44.7) | 31 (21.5–39.5) | 0.424 | 36 (23.7–44.7) |
| POD-7 Isoleucine | 30.4 (23.9–47.6) | 38.2 (28.7–48.2) | 0.440 | 37.2 (26.3–52.9) | 35.2 (27.6–44.5) | 0.568 | |
| POD-1 Leucine | 96.4 (79.2–157.8) | 105.6 (78.3–124.2) | 0.905 | 101.5 (83.5–130.1) | 105.6 (71.3–132) | 0.935 | 138.1 (102.2–175.3) |
| POD-7 Leucine | 97.1 (88.8–126.9) | 94.6 (80.8–126.7) | 0.824 | 98.1 (88.6–135.7) | 94.6 (76.5–120.3) | 0.369 | |
| POD-1 Lysine | 69.7 (59–83.3) | 69.3 (61.6–78.2) | 0.905 | 74.6 (64.5–82.5) | 64.4 (55.4–74.1) | 0.110 | 75.4 (56.7–87) |
| POD-7 Lysine | 80.5 (53.6–90) | 72.8 (57.2–86.7) | 0.771 | 76.3 (61–87.8) | 78.6 (57.2–92.3) | 0.807 | |
| POD-1 Methionine | 12.5 (10.1–18.8) | 11.9 (9.1–18.2) | 0.851 | 12.5 (9.5–19.2) | 11.9 (9.7–18.1) | 0.961 | 17 (13.7–20.2) |
| POD-7 Methionine | 12.8 (11–17.6) | 11.2 (9.1–13.9) | 0.073 | 12.8 (10.6–17.3) | 11.2 (8.9–13) | 0.032 * | |
| POD-1 Phenylalanine | 37.6 (24.3–45.3) | 39.2 (31–42.6) | 0.824 | 42 (32.3–53.6) | 33.5 (28.5–40.1) | 0.049 * | 51.2 (8.4–65.3) |
| POD-7 Phenylalanine | 44.2 (22.7–63.4) | 40.9 (34–49.7) | 0.503 | 46.1 (32.7–55.9) | 39.7 (33.6–44.9) | 0.184 | |
| POD-1 Proline | 47.2 (39.6–76.3) | 62.2 (53.6–91) | 0.068 | 64.5 (45.4–91.5) | 58.5 (48.2–66.4) | 0.660 | 85.6 (63.6–101.6) |
| POD-7 Proline | 67.7 (50.3–125.1) | 71.6 (54.5–85.5) | 0.878 | 69.4 (51.2–81.3) | 71.6 (53–89.4) | 0.708 | |
| POD-1 Hydroxyproline | 2.7 (2–3.9) | 2.9 (2–4.3) | 0.440 | 2.1 (1.9–4.2) | 3.2 (2.4–5.1) | 0.038 * | 4.5 (2.4–7.3) |
| POD-7 Hydroxyproline | 2.6 (0.8–3.4) | 3.2 (0.2–4.3) | 0.440 | 2.2 (0.2–3.3) | 3.6 (2.3–4.5) | 0.053 | |
| POD-1 Serine | 39.3 (31.5–53.9) | 42.2 (34.5–51.4) | 0.878 | 42.3 (36.8–53.4) | 35.8 (30.4–51) | 0.184 | 46.2 (31.9–57.5) |
| POD-7 Serine | 47.8 (34.1–58.8) | 43.9 (39.5–52.2) | 0.986 | 48.3 (40.4–59.3) | 43.7 (36.6–52.1) | 0.335 | |
| POD-1 Threonine | 32 (22.8–39.6) | 34.7 (25.7–40.7) | 0.461 | 35.1 (29.4–41.2) | 27.8 (24.9–39.5) | 0.195 | 35.7 (25.8–48.6) |
| POD-7 Threonine | 33.8 (26.5–45.7) | 33.6 (28.2–43) | 0.878 | 36.7 (28.9–46.2) | 31.9 (26.7–42.7) | 0.386 | |
| POD-1 Tryptophan | 23.6 (21.6–26.1) | 26.5 (23.7–31.2) | 0.172 | 23.7 (21.2–31.4) | 26.5 (25.7–29.6) | 0.303 | 30.7 (19.9–37.8) |
| POD-7 Tryptophan | 22.9 (18.3–31.8) | 23.9 (18.2–33.1) | 0.986 | 24 (18.5–31.1) | 22.8 (18.2–36.1) | 0.757 | |
| POD-1 Tyrosine | 31.3 (25.3–40.6) | 29.5 (24.8–36.6) | 0.771 | 32.9 (26.1–41.5) | 27.3 (24.6–32.5) | 0.118 | 42 (35.8–52.4) |
| POD-7 Tyrosine | 33.9 (27.4–37.8) | 29.5 (24.2–37.8) | 0.420 | 33.6 (29.3–38.3) | 27.7 (20.7–37.8) | 0.118 | |
| POD-1 Valine | 108.4 (99.9–180.3) | 126.7 (93.7–151.3) | 0.797 | 114 (94.2–149.9) | 128 (93.8–153.7) | 0.287 | 167.6 (132.8–203.8) |
| POD-7 Valine | 122.7 (103.7–139.9) | 121.5 (105.4–146.9) | 0.932 | 129 (107.8–150.6) | 119.2 (95–138) | 0.173 | |
| POD-1 Histidine | 46.7 (37.4–56.1) | 47.1 (45–58.8) | 0.400 | 49.2 (42.9–58.1) | 46.6 (42.9–53.5) | 0.245 | 51.3 (44–67.3) |
| POD-7 Histidine | 49.4 (39–63.6) | 45.2 (40.7–60.3) | 0.745 | 46.2 (40.8–61.6) | 45.2 (39.2–61.2) | 0.782 | |
| RDW-CV [%CV] | 13.9 (13.3–14.75) | 12.8 (12.5–13.6) | 0.016 * | 13.4 (12.6–14.5) | 13 (12.5–14.3) | 0.716 | |
| RDW-CV >14.5 | 4 (33.3%) | 2 (8.7%) | 0.151 | 3 (16.7%) | 3 (17.6%) | 1 | |
| RDW-SD [fL] | 43.4 (40.6–48) | 41.6 (38.5–45) | 0.211 | 43.3 (40.3–45.6) | 41.6 (38. 5–44.9) | 0.373 | |
| Cerebral vasospasm | 10 (83.3%) | 8 (34.8%) | 0.011 * | 18 (100%) | NA | ||
| CVS (day) | 5 (4–6) | 5 (4.25–6) | 1 | 5 (4–6) | NA | ||
| 12-month GOS | 2 (1–2) | 4 (4–5) | <0.001 * | 2.5 (1.75–4) | 4 (4–5) | <0.001 * |
| Amino Acid | POD 1 vs. Controls | POD 1 vs. POD 7 | POD 1 CVS vs. No CVS | POD 1 GOS 4–5 vs. GOS 1–3 | POD 7 CVS vs. No CVS | POD 7 GOS 4–5 vs. GOS 1–3 | ||||||||||||
|---|---|---|---|---|---|---|---|---|---|---|---|---|---|---|---|---|---|---|
| FC | p-Value | Adjusted p-Value | Median Difference [nmol/mL] | p-Value | Adjusted p-Value | FC | p-Value | Adjusted p-Value | FC | p-Value | Adjusted p-Value | FC | p-Value | Adjusted p-Value | FC | p-Value | Adjusted p-Value | |
| Alanine | 0.7016 | <0.0001 | 0.0001 | −15.085 | 0.158359 | 0.77752 | 1.0049 | 0.2834 | 0.5563 | 1.2351 | 0.357 | 0.9446 | 1.086 | 0.6321 | 0.8044 | 0.732 | 0.1305 | 0.9445 |
| Arginine | 0.9326 | 0.7868 | 0.8489 | 2.06 | 0.827161 | 0.899814 | 1.2021 | 0.2413 | 0.5563 | 0.9723 | 0.8213 | 0.9446 | 1.259 | 0.0407 | 0.2739 | 0.8293 | 0.1491 | 0.9445 |
| Asparagine | 0.9613 | 0.7058 | 0.8382 | 1.955 | 0.403521 | 0.77752 | 1.0711 | 0.5974 | 0.8731 | 0.9545 | 0.4654 | 0.9446 | 1.0433 | 0.7042 | 0.8044 | 0.9333 | 0.414 | 0.9861 |
| Glutamine | 1.1165 | 0.0932 | 0.1667 | 142.95 | 0.394466 | 0.77752 | 1.0538 | 0.3221 | 0.5563 | 1.0508 | 0.664 | 0.9446 | 1.0099 | 0.7538 | 0.8044 | 0.9717 | 0.7809 | 0.9861 |
| Glutamic acid | 0.6656 | <0.0001 | 0.0001 | 5.41 | 0.576427 | 0.84247 | 1.2119 | 0.7917 | 0.9553 | 1.1815 | 0.4979 | 0.9446 | 1.2825 | 0.1057 | 0.37 | 0.8592 | 0.5663 | 0.9861 |
| Glycine | 0.6447 | <0.0001 | <0.0001 | 23.055 | 0.294711 | 0.77752 | 1.2596 | 0.1248 | 0.4741 | 0.871 | 0.9446 | 0.9446 | 1.2997 | 0.0577 | 0.2739 | 0.8403 | 0.3569 | 0.9861 |
| Isoleucine | 0.9199 | 0.558 | 0.7067 | 3.825 | 0.334075 | 0.77752 | 1.1715 | 0.4283 | 0.6781 | 1.1799 | 0.4549 | 0.9446 | 1.1392 | 0.5634 | 0.8044 | 1.0318 | 0.4444 | 0.9861 |
| Leucine | 0.8353 | 0.0154 | 0.0372 | −9.54 | 0.852456 | 0.899814 | 1.1543 | 0.9474 | 1 | 0.9827 | 0.917 | 0.9446 | 1.1902 | 0.3639 | 0.6748 | 0.9325 | 0.8348 | 0.9861 |
| Lysine | 1.0252 | 0.8969 | 0.8969 | 9.28 | 0.480881 | 0.77752 | 1.1243 | 0.1131 | 0.4741 | 0.9266 | 0.9032 | 0.9446 | 1.0851 | 0.8044 | 0.8044 | 0.9001 | 0.7676 | 0.9861 |
| Methionine | 0.8441 | 0.0157 | 0.0372 | −0.17333 | 0.279851 | 0.77752 | 1.2607 | 0.9605 | 1 | 0.8998 | 0.862 | 0.9446 | 1.4288 | 0.0346 | 0.2739 | 0.705 | 0.0734 | 0.9445 |
| Phenylalanine | 0.8684 | 0.0965 | 0.1667 | 2.195 | 0.265495 | 0.77752 | 1.2684 | 0.0515 | 0.4741 | 1.0539 | 0.8212 | 0.9446 | 1.2032 | 0.1812 | 0.4303 | 0.8549 | 0.4979 | 0.9861 |
| Proline | 0.7968 | 0.0073 | 0.0232 | 12.075 | 0.231797 | 0.77752 | 1.0548 | 0.6559 | 0.8901 | 1.1348 | 0.0681 | 0.9446 | 1.0574 | 0.7165 | 0.8044 | 0.8834 | 0.8894 | 0.9861 |
| Hydroxyproline | 0.614 | 0.0222 | 0.0468 | −0.2 | 0.491065 | 0.77752 | 0.6068 | 0.0407 | 0.4741 | 1.1181 | 0.4342 | 0.9446 | 0.5021 | 0.0513 | 0.2739 | 1.4491 | 0.4237 | 0.9861 |
| Serine | 0.9392 | 0.8042 | 0.8489 | 4.786667 | 0.045642 | 0.77752 | 1.1596 | 0.1813 | 0.5219 | 0.9604 | 0.8757 | 0.9446 | 1.1772 | 0.3301 | 0.6748 | 0.9703 | 0.9861 | 0.9861 |
| Threonine | 0.9521 | 0.4919 | 0.6676 | −0.36667 | 0.451178 | 0.77752 | 1.1531 | 0.1923 | 0.5219 | 0.9899 | 0.4549 | 0.9446 | 1.1285 | 0.3907 | 0.6748 | 0.9516 | 0.8894 | 0.9861 |
| Tryptophan | 0.8354 | 0.1951 | 0.2851 | −3.195 | 0.743223 | 0.882577 | 1.0028 | 0.2983 | 0.5563 | 1.0289 | 0.1697 | 0.9446 | 1.037 | 0.7664 | 0.8044 | 0.9835 | 0.9861 | 0.9861 |
| Tyrosine | 0.7386 | 0.0001 | 0.0003 | 2.625 | 0.668035 | 0.846178 | 1.2137 | 0.1208 | 0.4741 | 1.0028 | 0.781 | 0.9446 | 1.2141 | 0.1168 | 0.37 | 0.9171 | 0.424 | 0.9861 |
| Valine | 0.7515 | 0.0005 | 0.0019 | 4.07 | 0.656279 | 0.846178 | 1.1628 | 1 | 1 | 0.987 | 0.7944 | 0.9446 | 1.224 | 0.1707 | 0.4303 | 0.9169 | 0.9446 | 0.9861 |
| Histidine | 0.9195 | 0.134 | 0.2122 | −1.19 | 0.967753 | 0.967753 | 1.0721 | 0.8045 | 0.9553 | 1.0368 | 0.3945 | 0.9446 | 1.0926 | 0.7917 | 0.8044 | 0.8725 | 0.7412 | 0.9861 |
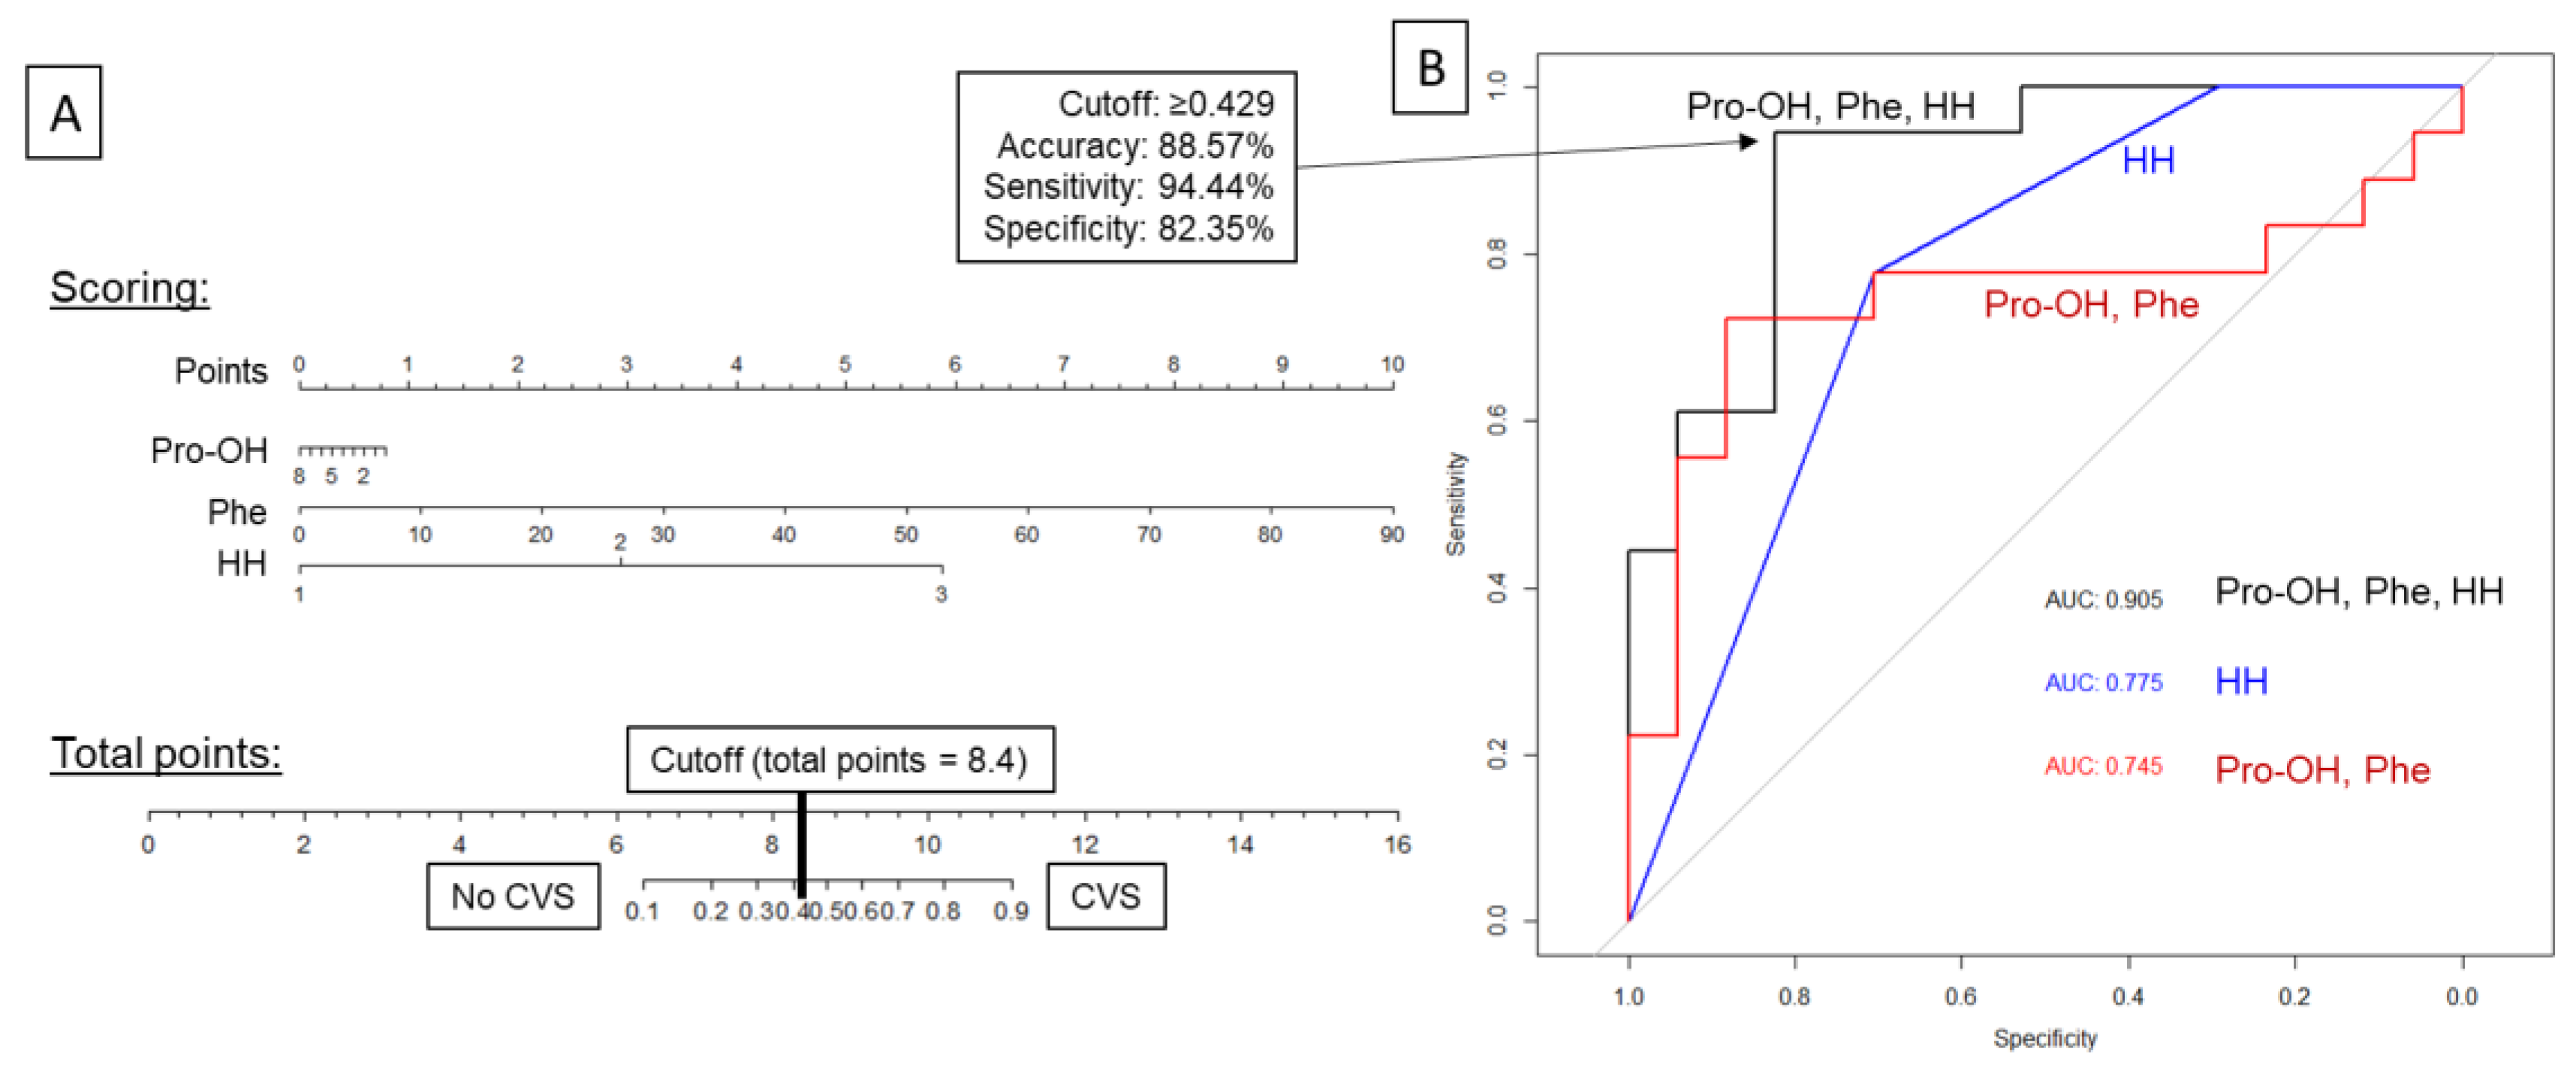
| Amino Acids Only (Pro-OH, Phe) | Hunt&Hess Scale Only (HH) | Combined Pro-OH, Phe, and HH | |||||||
|---|---|---|---|---|---|---|---|---|---|
| Predictions (Odds Ratios) | Pro-OH | OR 0.76 (95%CI: 0.49–1.18) | HH | OR 6.84 (95%CI: 1.78–26.37) | Pro-OH | OR 0.91 (95%CI: 0.55–1.51) | |||
| Phe | OR 1.05 (95%CI: 0.99–1.11) | Phe | OR 1.11 (95%CI: 1.00–1.23) | ||||||
| HH | OR 15.47 (95%CI: 2.30–103.95) | ||||||||
| Confusion matrix | Prediction | Reference: | Prediction | Reference: | Prediction | Reference: | |||
| No CVS | CVS | No CVS | CVS | No CVS | CVS | ||||
| No CVS | 15 | 6 | No CVS | 12 | 4 | No CVS | 14 | 1 | |
| CVS | 2 | 12 | CVS | 5 | 14 | CVS | 3 | 17 | |
| Accuracy | 77.14% (95%CI: 59.86–89.56%) | 74.29% (95%CI: 56.74–87.51%) | 88.57% (95%CI: 73.26–96.80%) | ||||||
| Cutoff | ≥0.5455 | ≥0.7529 | ≥0.4283 | ||||||
| Sensitivity | 66.67% | 77.78% | 94.44% | ||||||
| Specificity | 88.24% | 70.59% | 82.35% | ||||||
| PPV | 85.71% | 73.68% | 85.00% | ||||||
| NPV | 71.43% | 75.00% | 93.33% | ||||||
| AUC ROC | 0.7451 (95%CI: 0.5619–0.9283) | 0.7745 (95%CI: 0.6322–0.9168) | 0.9052 (95%CI: 0.8056–1.0000) | ||||||
| LOOCV estimate of prediction error | 0.2390 | 0.2015 | 0.1797 | ||||||
Publisher’s Note: MDPI stays neutral with regard to jurisdictional claims in published maps and institutional affiliations. |
© 2022 by the authors. Licensee MDPI, Basel, Switzerland. This article is an open access article distributed under the terms and conditions of the Creative Commons Attribution (CC BY) license (https://creativecommons.org/licenses/by/4.0/).
Share and Cite
Bobeff, E.J.; Bukowiecka-Matusiak, M.; Stawiski, K.; Wiśniewski, K.; Burzynska-Pedziwiatr, I.; Kordzińska, M.; Kowalski, K.; Sendys, P.; Piotrowski, M.; Szczesna, D.; et al. Plasma Amino Acids May Improve Prediction Accuracy of Cerebral Vasospasm after Aneurysmal Subarachnoid Haemorrhage. J. Clin. Med. 2022, 11, 380. https://doi.org/10.3390/jcm11020380
Bobeff EJ, Bukowiecka-Matusiak M, Stawiski K, Wiśniewski K, Burzynska-Pedziwiatr I, Kordzińska M, Kowalski K, Sendys P, Piotrowski M, Szczesna D, et al. Plasma Amino Acids May Improve Prediction Accuracy of Cerebral Vasospasm after Aneurysmal Subarachnoid Haemorrhage. Journal of Clinical Medicine. 2022; 11(2):380. https://doi.org/10.3390/jcm11020380
Chicago/Turabian StyleBobeff, Ernest Jan, Malgorzata Bukowiecka-Matusiak, Konrad Stawiski, Karol Wiśniewski, Izabela Burzynska-Pedziwiatr, Magdalena Kordzińska, Konrad Kowalski, Przemyslaw Sendys, Michał Piotrowski, Dorota Szczesna, and et al. 2022. "Plasma Amino Acids May Improve Prediction Accuracy of Cerebral Vasospasm after Aneurysmal Subarachnoid Haemorrhage" Journal of Clinical Medicine 11, no. 2: 380. https://doi.org/10.3390/jcm11020380
APA StyleBobeff, E. J., Bukowiecka-Matusiak, M., Stawiski, K., Wiśniewski, K., Burzynska-Pedziwiatr, I., Kordzińska, M., Kowalski, K., Sendys, P., Piotrowski, M., Szczesna, D., Stefańczyk, L., Wozniak, L. A., & Jaskólski, D. J. (2022). Plasma Amino Acids May Improve Prediction Accuracy of Cerebral Vasospasm after Aneurysmal Subarachnoid Haemorrhage. Journal of Clinical Medicine, 11(2), 380. https://doi.org/10.3390/jcm11020380