
Comparability of (Post-Concussion) Symptoms across Time in Individuals after Traumatic Brain Injury: Results from the CENTER-TBI Study

 ,
,  ,
, 
 and
and
Abstract
:1. Introduction
- Analyze the longitudinal measurement invariance of RPQ symptoms from three to twelve months after TBI to verify that the RPQ measures the same construct at different time points following TBI.
- Explore associations among sociodemographic, premorbid and injury-related factors and RPQ symptoms across time to model symptom trajectories for different subgroups of TBI patients.
2. Materials and Methods
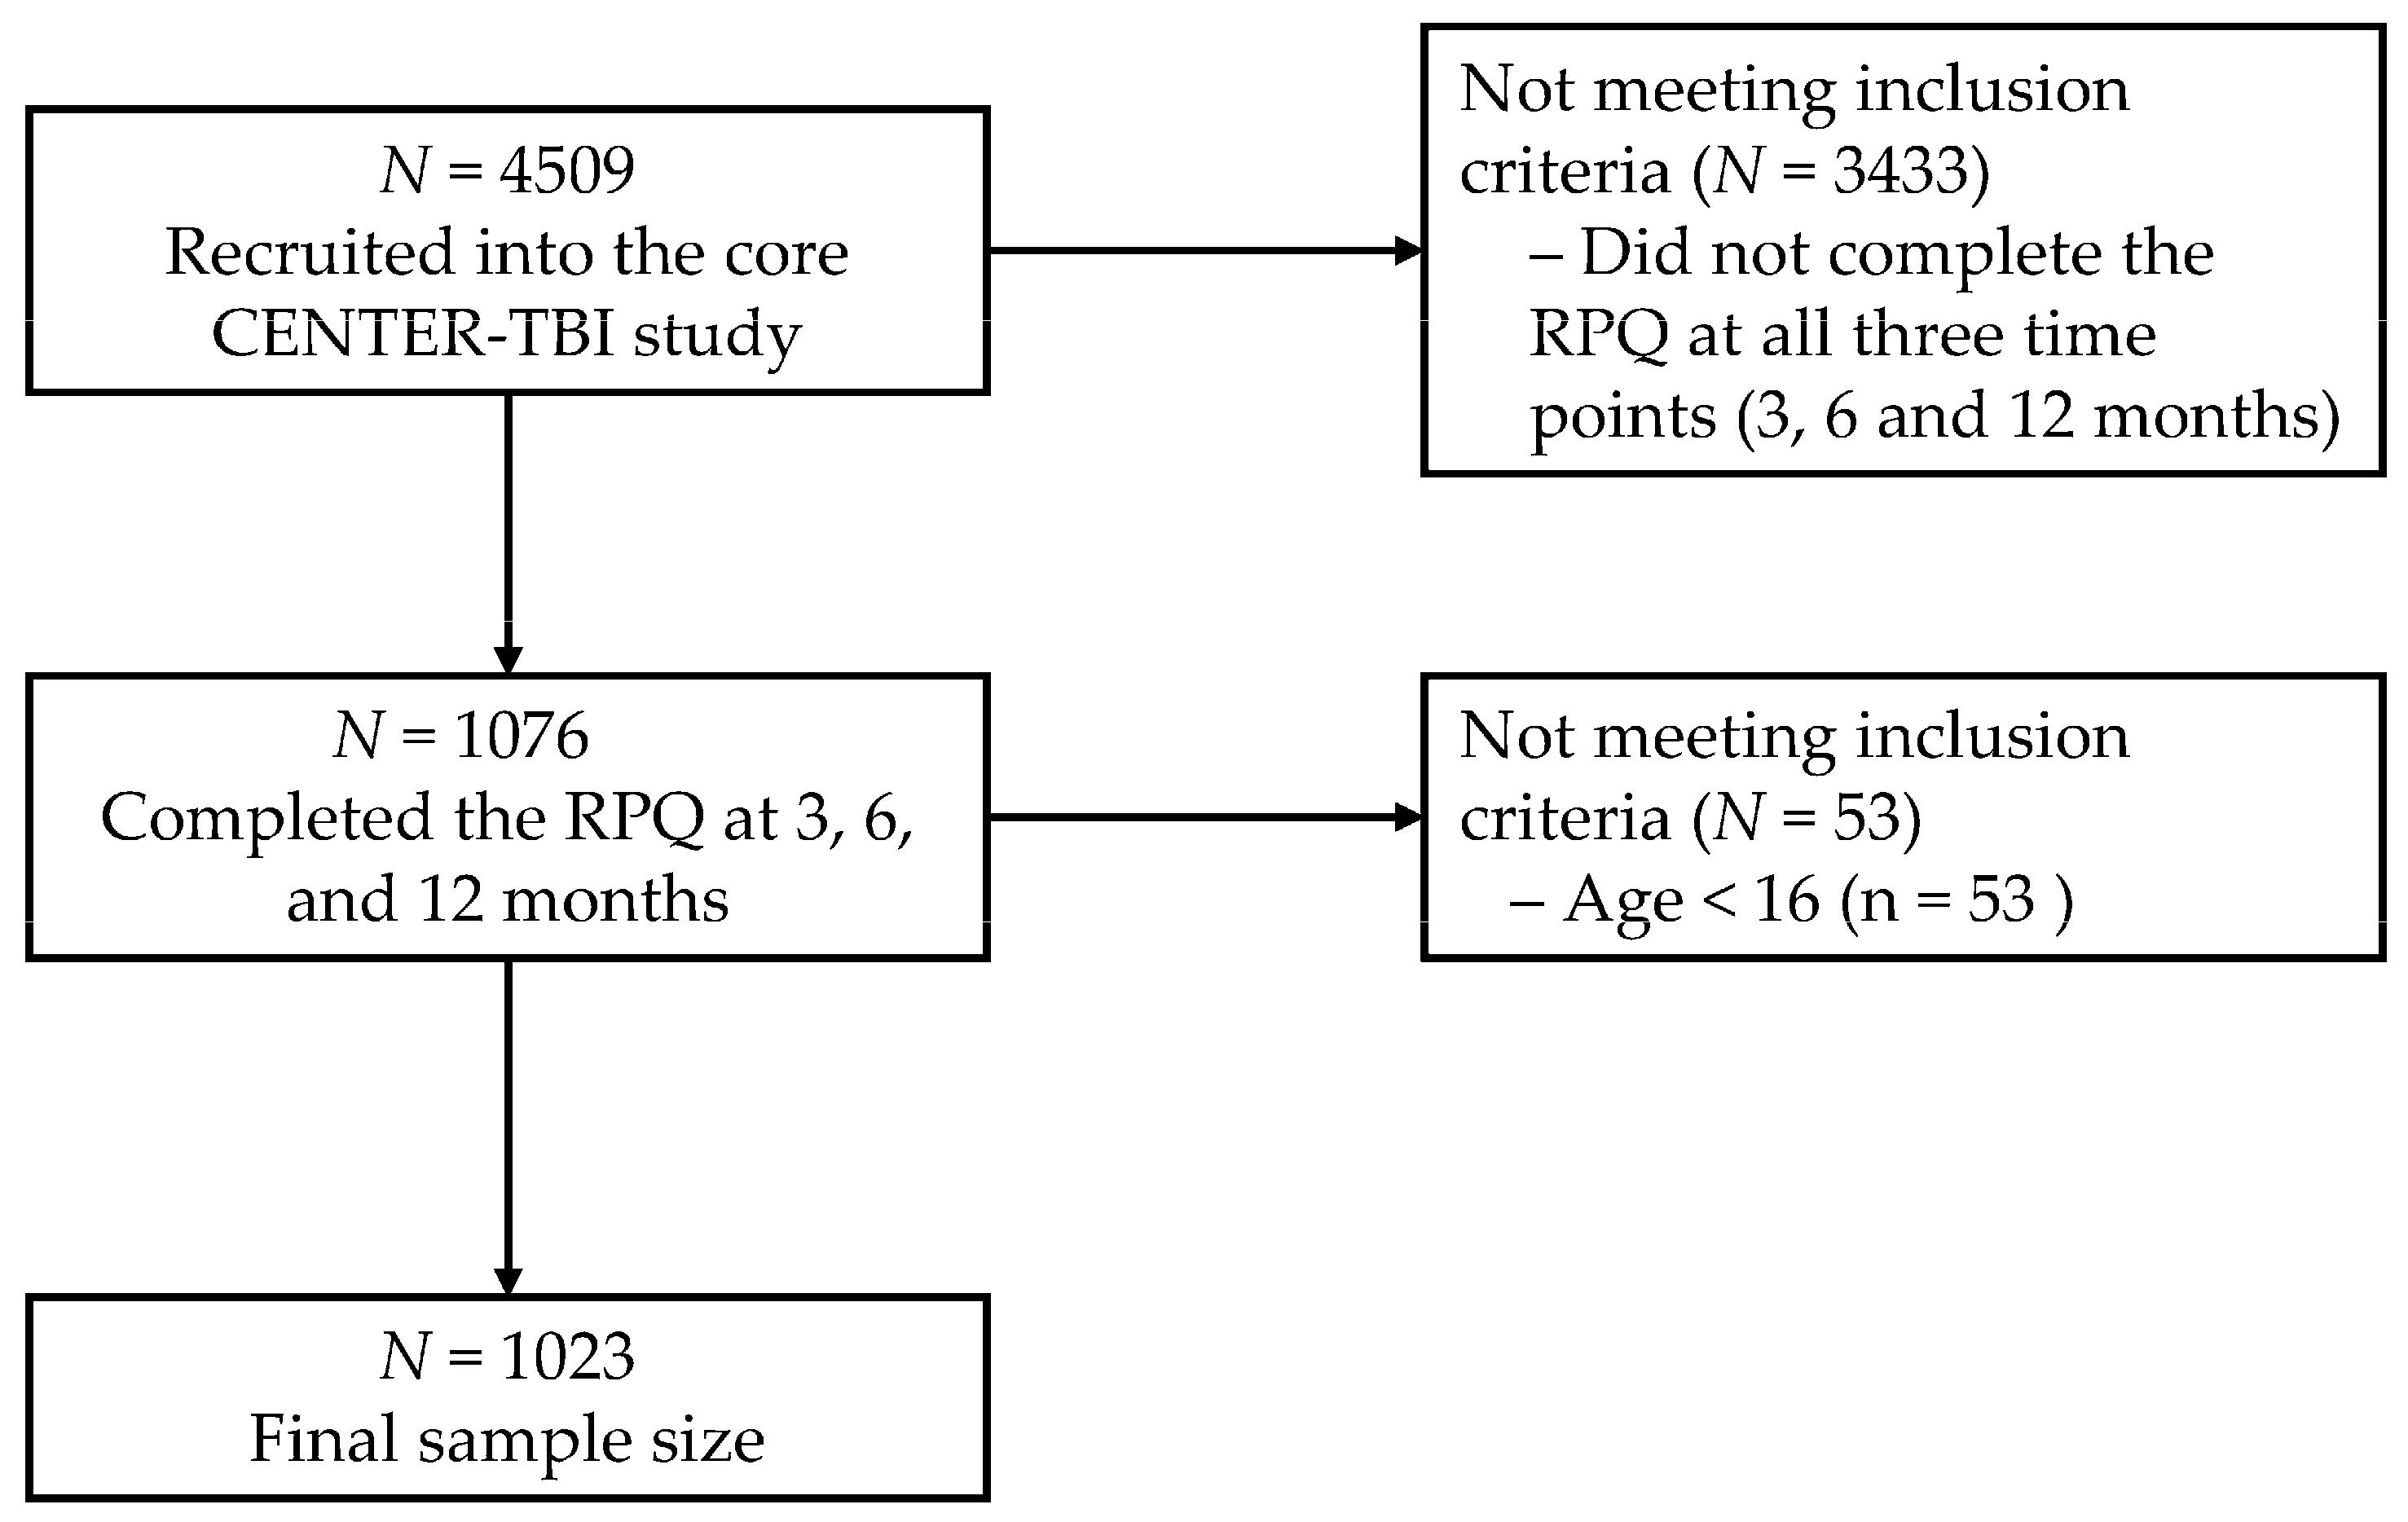
2.1. Participants and Recruiting Procedure
2.2. Measures
2.3. Statistical Analyses
2.3.1. Descriptive Analyses
2.3.2. RPQ Longitudinal Measurement Invariance
- Latent intercepts are fixed to zero.
- The common factor mean is constrained to zero, and the unique factor covariance matrix is constrained to be 1.00.
- The same observed measure is chosen as the marker variable, and the factor loading of the marker variable is constrained to be 1.00.
- A threshold for each indicator is constrained to be equal across time.
2.3.3. Demographic and Injury Characteristics Effects
- Time since TBI (three, six and twelve months);
- Sociodemographic factors: sex (female vs. male), age in years, education in years and interaction between sex and age;
- Injury-related factors: TBI severity (uncomplicated mild TBI vs. more severe TBIs), injury cause (road traffic accident vs. fall vs. violent/other), admission type (ADM vs. ICU) and ISS [converted into log ISS distribution];
- Premorbid factors: previous concussions (yes vs. no) and prior psychiatric problems (yes vs. no).
3. Results
3.1. Descriptive Analyses
3.2. Longitudinal RPQ Measurement Invariance
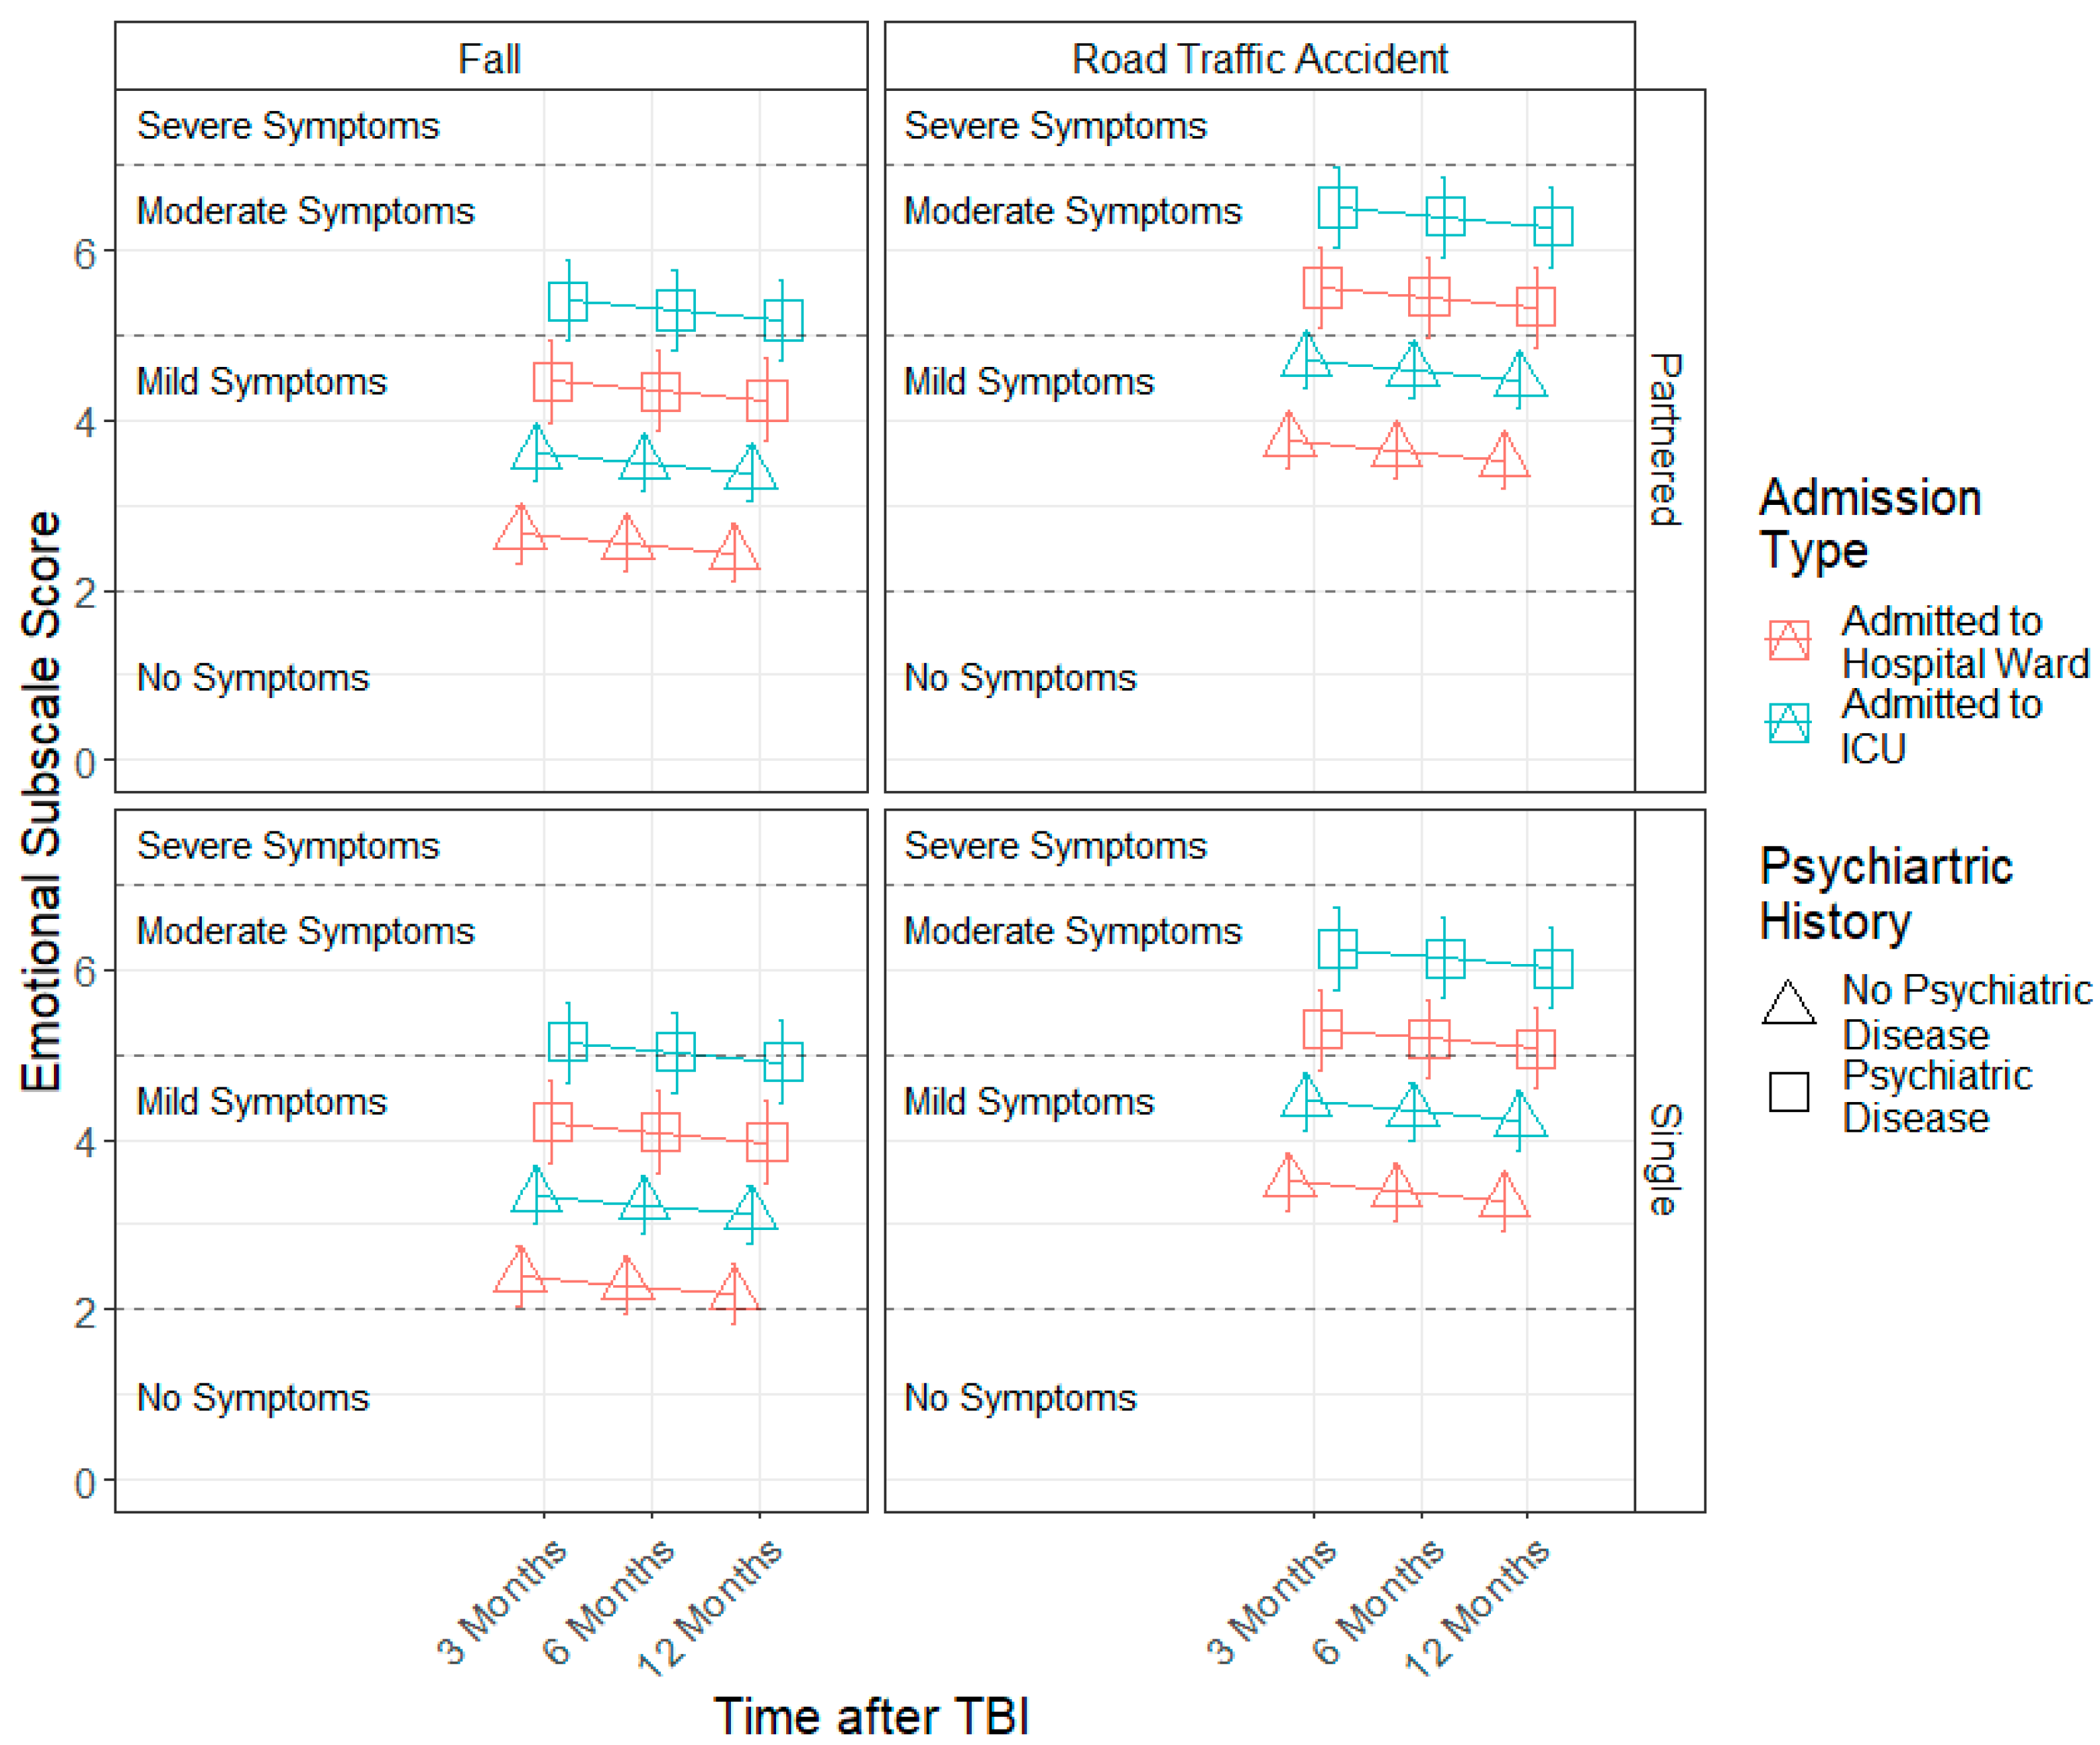
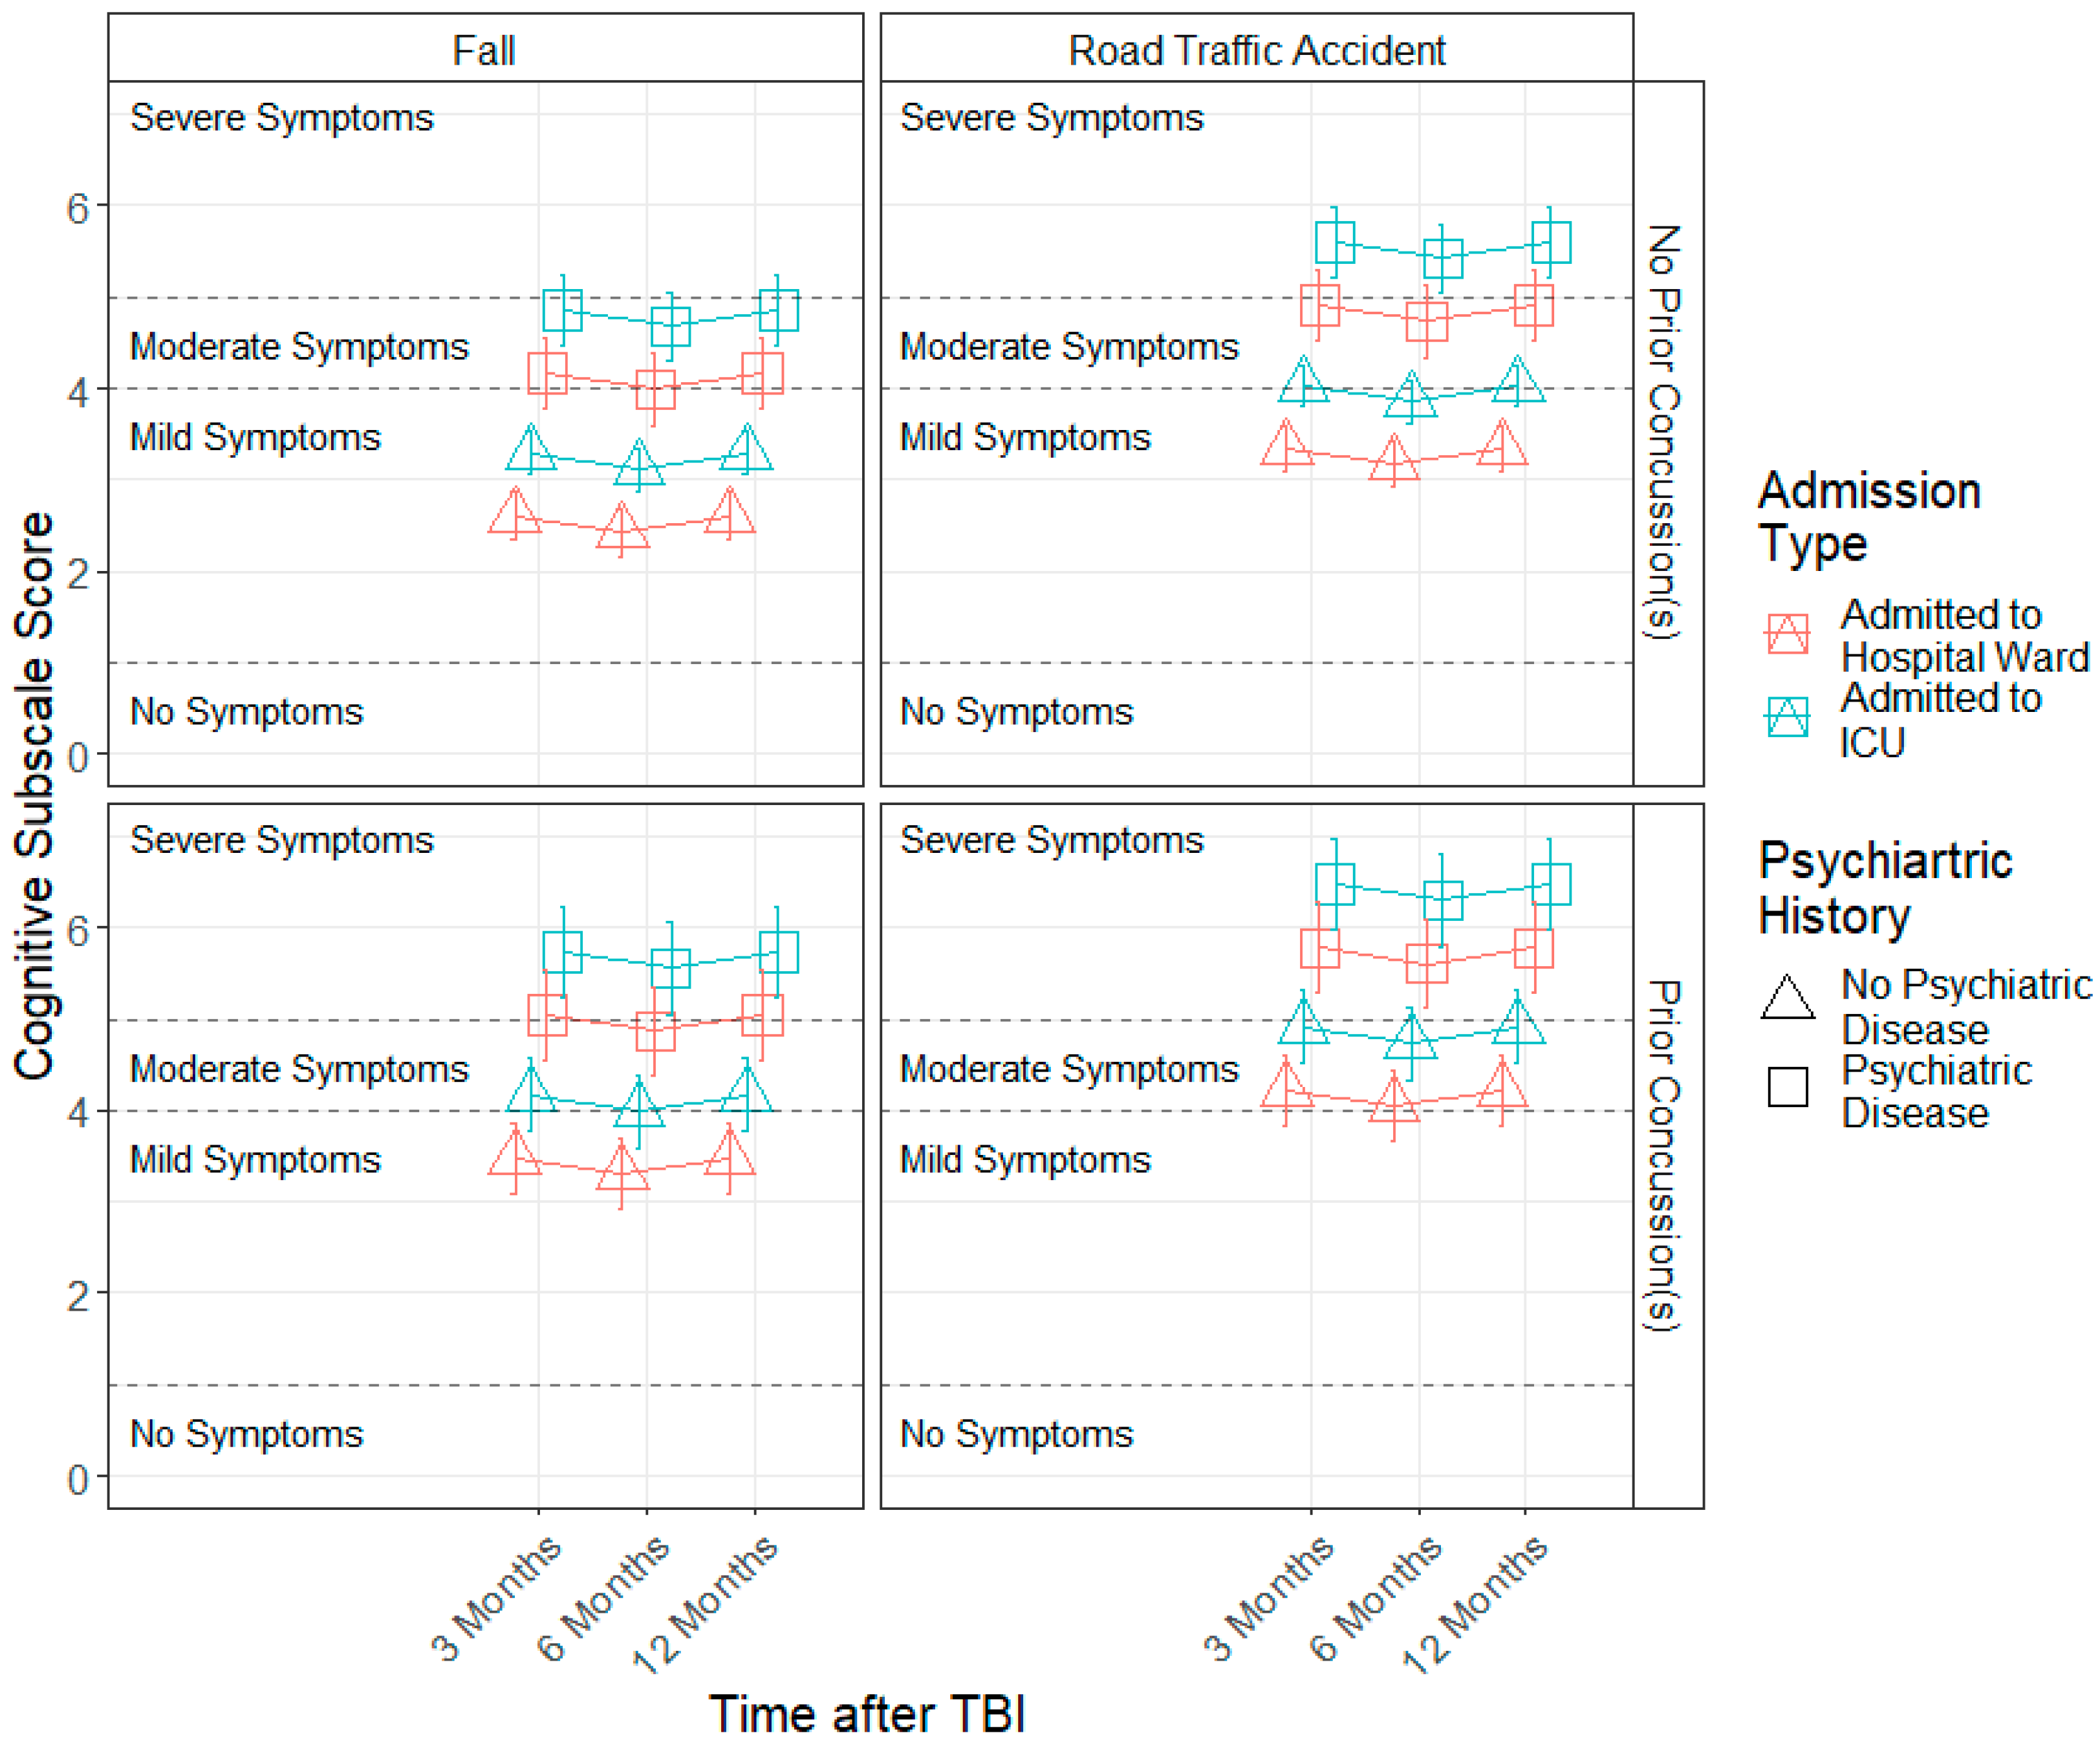
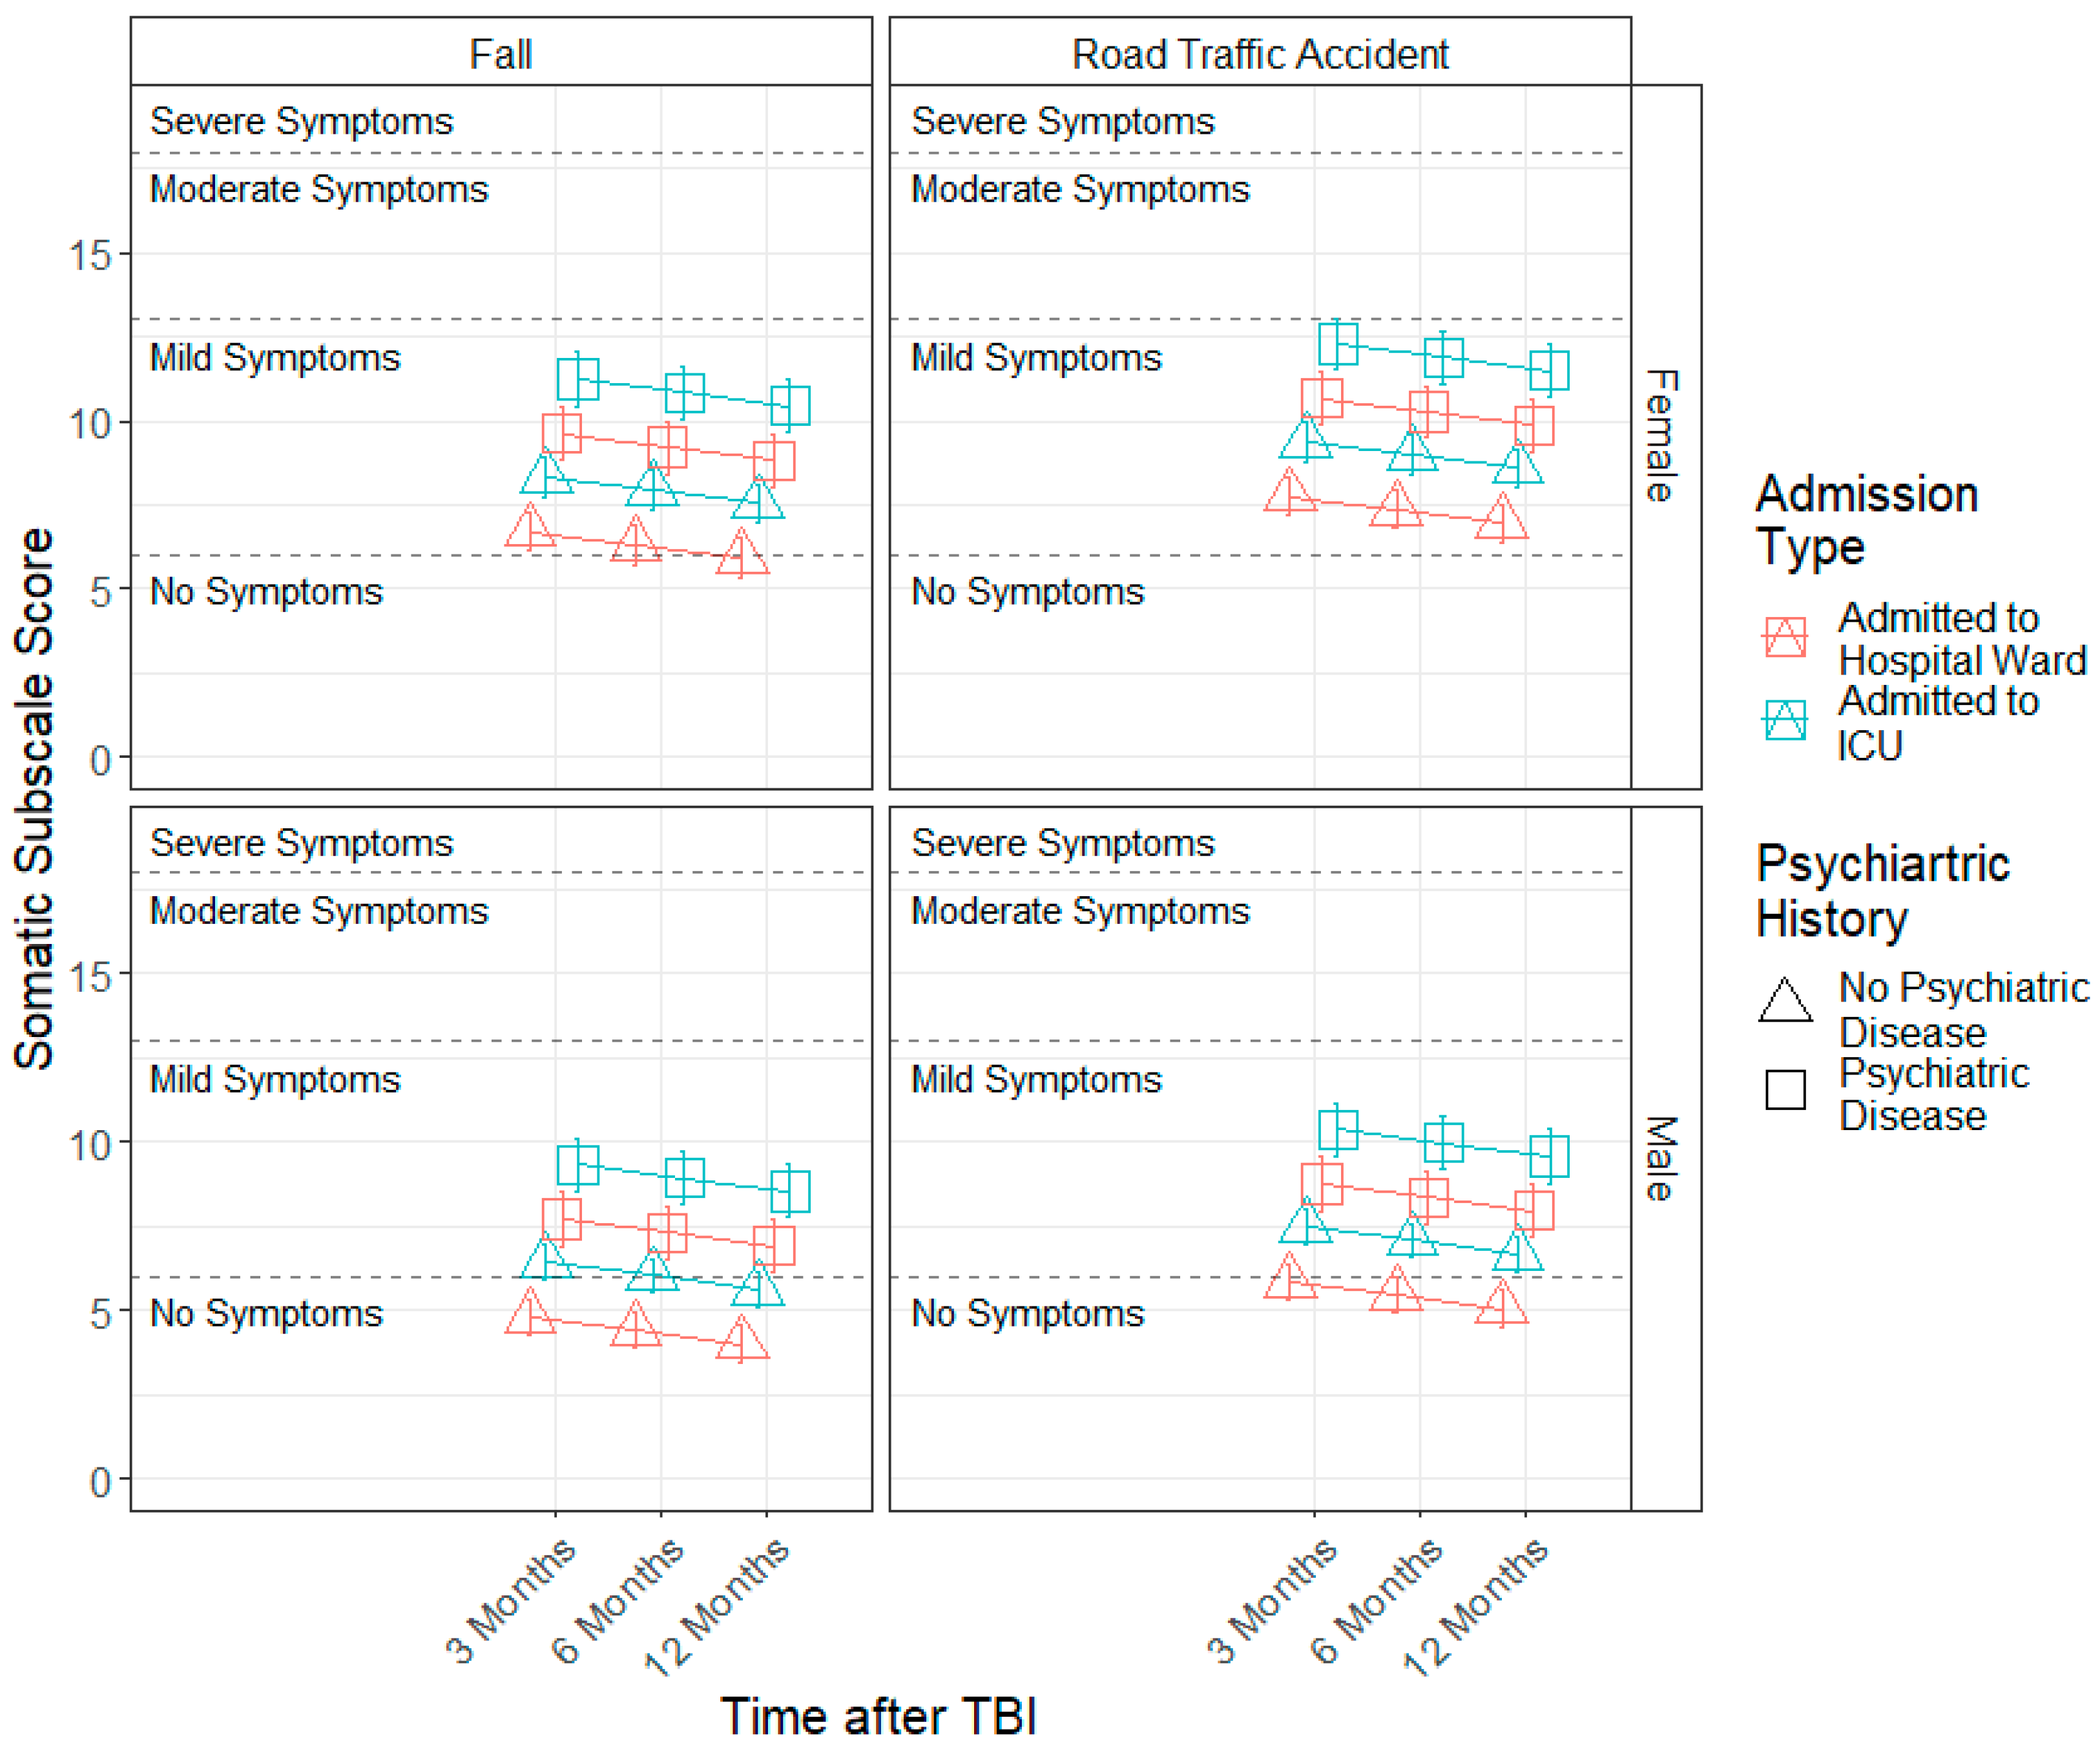
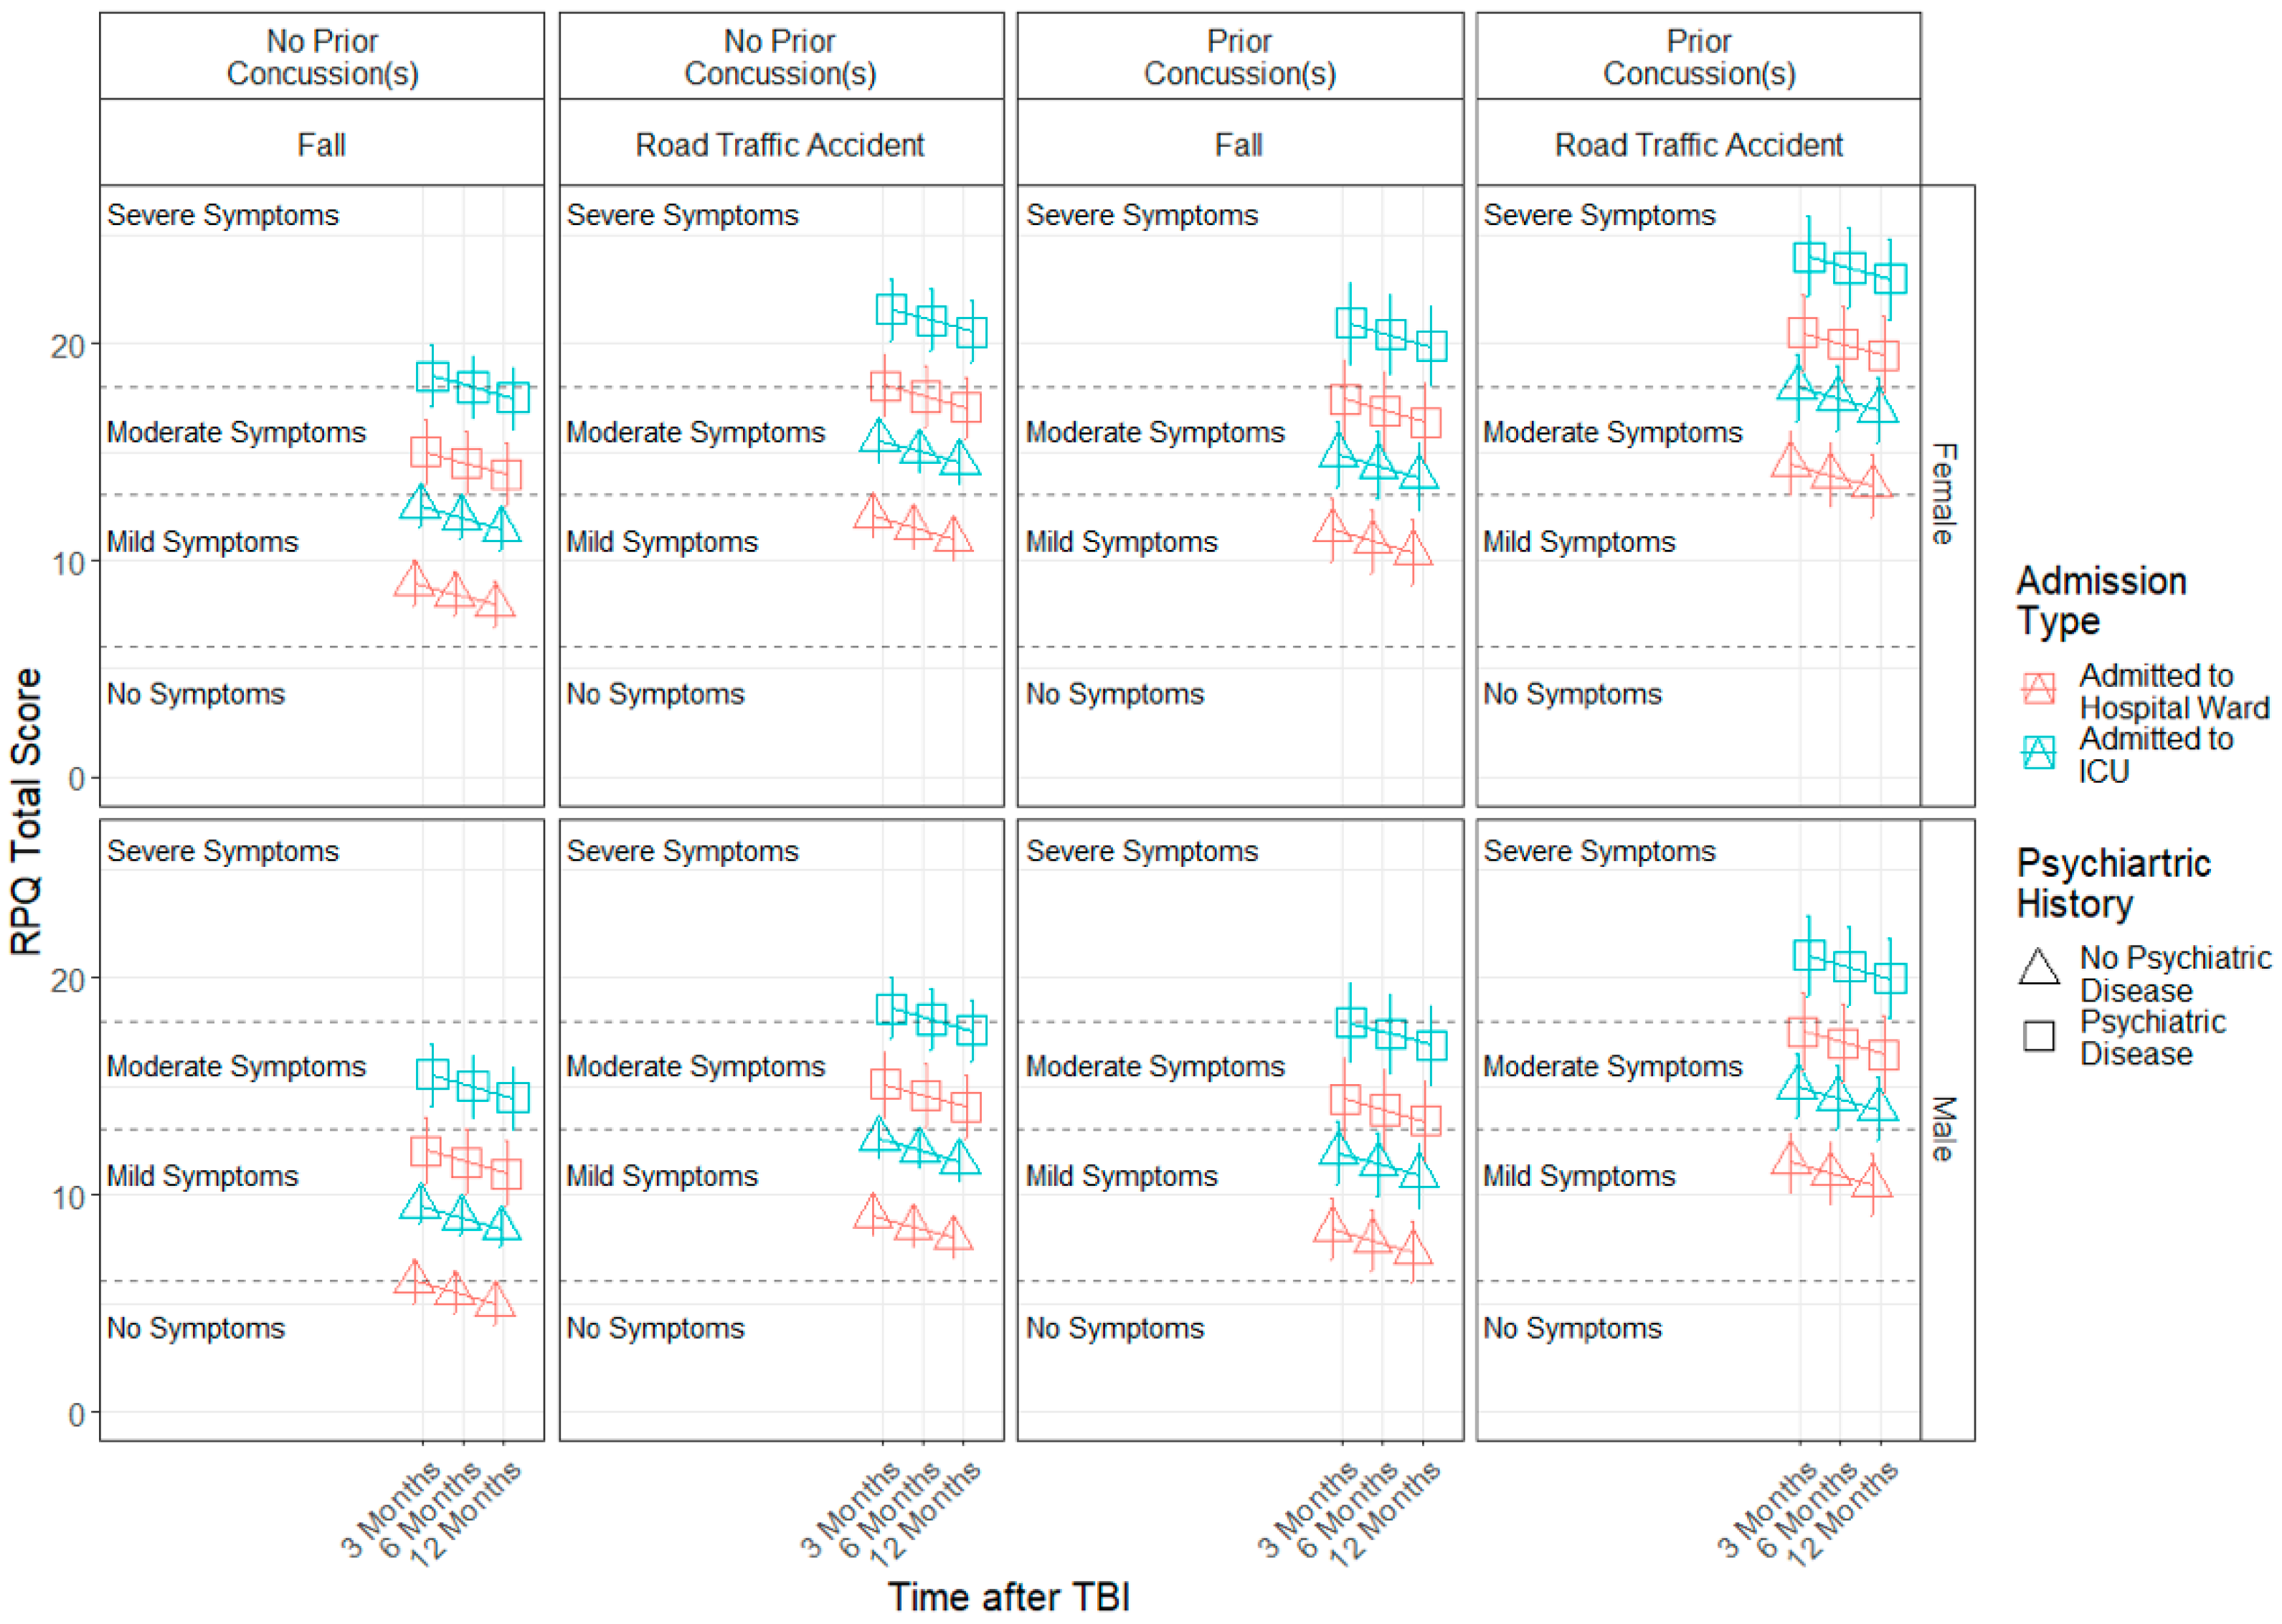
3.3. Demographic and Injury Predictors of Factor Scores across 3, 6 and 12 Months
4. Discussion
4.1. Limitations
4.2. Implications
5. Conclusions
Supplementary Materials
Author Contributions
Funding
Institutional Review Board Statement
Informed Consent Statement
Data Availability Statement
Acknowledgments
Conflicts of Interest
Appendix A

| Time Point | Item | Mean | SD | Median | Skew | Kurtosis | SE |
|---|---|---|---|---|---|---|---|
| 3M | Headaches | 0.99 | 1.17 | 0 | 0.82 | −0.58 | 0.04 |
| Dizziness | 0.96 | 1.22 | 0 | 0.95 | −0.31 | 0.04 | |
| Nausea | 0.27 | 0.7 | 0 | 2.97 | 9.01 | 0.02 | |
| Noise Sensitivity | 0.8 | 1.14 | 0 | 1.19 | 0.21 | 0.04 | |
| Sleep Disturbance | 1.02 | 1.25 | 0 | 0.98 | −0.25 | 0.04 | |
| Fatigue | 1.65 | 1.31 | 2 | 0.13 | −1.17 | 0.04 | |
| Irritable | 0.94 | 1.13 | 1 | 0.98 | −0.10 | 0.04 | |
| Depressed | 0.91 | 1.16 | 0 | 0.98 | −0.28 | 0.04 | |
| Frustrated | 1.06 | 1.2 | 1 | 0.81 | −0.55 | 0.04 | |
| Forgetful | 1.27 | 1.24 | 1 | 0.58 | −0.79 | 0.04 | |
| Poor Concentration | 1.16 | 1.21 | 1 | 0.65 | −0.74 | 0.04 | |
| Longer to Think | 1.05 | 1.2 | 1 | 0.78 | −0.57 | 0.04 | |
| Blurred Vision | 0.63 | 1.07 | 0 | 1.66 | 1.75 | 0.03 | |
| Light Sensitivity | 0.53 | 0.95 | 0 | 1.82 | 2.6 | 0.03 | |
| Double Vision | 0.35 | 0.9 | 0 | 2.79 | 7.07 | 0.03 | |
| Restless | 0.71 | 1.03 | 0 | 1.29 | 0.64 | 0.03 | |
| 6M | Headaches | 0.88 | 1.14 | 0 | 1 | −0.22 | 0.04 |
| Dizziness | 0.82 | 1.13 | 0 | 1.13 | 0.15 | 0.04 | |
| Nausea | 0.2 | 0.59 | 0 | 3.22 | 10.07 | 0.02 | |
| Noise Sensitivity | 0.78 | 1.14 | 0 | 1.28 | 0.5 | 0.04 | |
| Sleep Disturbance | 0.93 | 1.19 | 0 | 1.03 | −0.11 | 0.04 | |
| Fatigue | 1.49 | 1.32 | 1 | 0.31 | −1.15 | 0.04 | |
| Irritable | 0.93 | 1.13 | 0 | 0.97 | −0.13 | 0.04 | |
| Depressed | 0.85 | 1.13 | 0 | 1.09 | 0.06 | 0.04 | |
| Frustrated | 0.95 | 1.14 | 1 | 0.95 | −0.20 | 0.04 | |
| Forgetful | 1.24 | 1.19 | 1 | 0.53 | −0.79 | 0.04 | |
| Poor Concentration | 1.09 | 1.17 | 1 | 0.69 | −0.69 | 0.04 | |
| Longer to Think | 1.02 | 1.16 | 1 | 0.78 | −0.53 | 0.04 | |
| Blurred Vision | 0.6 | 1.05 | 0 | 1.77 | 2.2 | 0.03 | |
| Light Sensitivity | 0.54 | 0.98 | 0 | 1.84 | 2.54 | 0.03 | |
| Double Vision | 0.32 | 0.84 | 0 | 2.95 | 8.37 | 0.03 | |
| Restless | 0.65 | 1 | 0 | 1.5 | 1.39 | 0.03 | |
| 12M | Headaches | 0.84 | 1.14 | 0 | 1.11 | 0.07 | 0.04 |
| Dizziness | 0.76 | 1.09 | 0 | 1.26 | 0.55 | 0.03 | |
| Nausea | 0.23 | 0.63 | 0 | 3.3 | 12.02 | 0.02 | |
| Noise Sensitivity | 0.83 | 1.21 | 0 | 1.21 | 0.22 | 0.04 | |
| Sleep Disturbance | 1.01 | 1.25 | 0 | 0.99 | −0.23 | 0.04 | |
| Fatigue | 1.42 | 1.32 | 1 | 0.39 | −1.10 | 0.04 | |
| Irritable | 0.93 | 1.1 | 1 | 0.94 | −0.14 | 0.03 | |
| Depressed | 0.87 | 1.15 | 0 | 1.1 | 0.07 | 0.04 | |
| Frustrated | 0.93 | 1.14 | 0 | 1.01 | −0.05 | 0.04 | |
| Forgetful | 1.28 | 1.25 | 1 | 0.58 | −0.79 | 0.04 | |
| Poor Concentration | 1.17 | 1.22 | 1 | 0.67 | −0.67 | 0.04 | |
| Longer to Think | 1.06 | 1.2 | 1 | 0.8 | −0.49 | 0.04 | |
| Blurred Vision | 0.49 | 0.93 | 0 | 2.04 | 3.64 | 0.03 | |
| Light Sensitivity | 0.56 | 0.96 | 0 | 1.72 | 2.16 | 0.03 | |
| Double Vision | 0.28 | 0.75 | 0 | 3.15 | 10.19 | 0.02 | |
| Restless | 0.69 | 1.01 | 0 | 1.37 | 1.02 | 0.03 |
| Factor | Time Point | Indicator/Item | Not Experienced at All | No More of a Problem (Than Before) | A Mild Problem | A Moderate Problem | A Severe Problem |
|---|---|---|---|---|---|---|---|
| Somatic | 3M | Headaches | 0.02 | −0.06 | −0.02 | 0.03 | 0.02 |
| Dizziness | 0 | −0.04 | −0.01 | 0.02 | 0.03 | ||
| Nausea | −0.06 | 0.02 | 0.02 | 0.01 | 0.01 | ||
| Noise Sensitivity | −0.07 | −0.04 | 0.03 | 0.04 | 0.04 | ||
| Sleep Disturbance | −0.11 | 0.06 | −0.01 | 0.03 | 0.03 | ||
| Fatigue | 0.2 | −0.15 | −0.15 | 0.02 | 0.07 | ||
| Blurred Vision | −0.05 | −0.02 | 0.02 | 0.02 | 0.03 | ||
| Light Sensitivity | −0.12 | 0.02 | 0.05 | 0.04 | 0.02 | ||
| Double Vision | −0.06 | 0.02 | 0.02 | 0.01 | 0.02 | ||
| 6M | Headaches | 0 | 0 | 0.01 | 0 | 0 | |
| Dizziness | 0 | 0 | 0 | 0 | 0 | ||
| Nausea | −0.01 | 0.01 | 0 | 0.01 | −0.01 | ||
| Noise Sensitivity | 0 | 0 | 0 | −0.09 | 0.09 | ||
| Sleep Disturbance | 0 | −0.01 | 0 | 0.12 | −0.12 | ||
| Fatigue | 0 | 0.01 | 0 | 0.02 | −0.03 | ||
| Blurred Vision | 0 | 0.01 | −0.01 | 0 | 0.01 | ||
| Light Sensitivity | 0 | 0 | 0 | −0.01 | 0.01 | ||
| Double Vision | 0 | −0.01 | 0.01 | 0 | 0 | ||
| 12M | Headaches | −0.01 | 0.01 | 0 | 0 | 0 | |
| Dizziness | 0 | 0 | 0 | 0 | 0 | ||
| Nausea | 0.01 | −0.01 | 0 | 0 | 0 | ||
| Noise Sensitivity | 0.02 | 0 | −0.02 | 0.01 | −0.01 | ||
| Sleep Disturbance | −0.06 | 0.06 | −0.01 | −0.01 | 0 | ||
| Fatigue | 0.07 | −0.09 | 0.02 | 0.01 | −0.01 | ||
| Blurred Vision | −0.01 | 0.01 | −0.01 | 0.01 | 0 | ||
| Light Sensitivity | 0.03 | −0.03 | 0 | 0 | 0 | ||
| Double Vision | 0.01 | −0.01 | 0 | 0 | 0 | ||
| Emotional | 3M | Irritable | −0.01 | −0.09 | 0 | 0.07 | 0.03 |
| Depressed | −0.04 | −0.09 | 0.03 | 0.08 | 0.03 | ||
| Frustrated | 0.06 | −0.23 | 0.04 | 0.1 | 0.03 | ||
| Restless | −0.07 | −0.04 | 0.04 | 0.05 | 0.02 | ||
| 6M | Irritable | 0 | −0.11 | 0.03 | 0.06 | 0.02 | |
| Depressed | −0.03 | −0.10 | 0.02 | 0.08 | 0.03 | ||
| Frustrated | 0.01 | −0.20 | 0.06 | 0.1 | 0.03 | ||
| Restless | −0.09 | −0.04 | 0.07 | 0.05 | 0.01 | ||
| 12M | Irritable | 0.01 | −0.13 | 0.02 | 0.07 | 0.02 | |
| Depressed | −0.06 | −0.10 | 0.06 | 0.08 | 0.02 | ||
| Frustrated | −0.04 | −0.19 | 0.11 | 0.1 | 0.03 | ||
| Restless | −0.06 | −0.05 | 0.05 | 0.05 | 0.01 | ||
| Cognitive | 3M | Forgetful | 0 | 0 | 0 | 0 | 0 |
| Poor Concentration | 0.01 | −0.01 | 0 | 0 | 0 | ||
| Longer to Think | 0 | 0 | 0 | 0 | 0 | ||
| 6M | Forgetful | 0.09 | −0.16 | −0.07 | 0.09 | 0.04 | |
| Poor Concentration | 0.09 | −0.28 | 0.05 | 0.11 | 0.03 | ||
| Longer to Think | 0.02 | −0.18 | 0.03 | 0.09 | 0.03 | ||
| 12M | Forgetful | 0.03 | −0.01 | 0 | −0.01 | 0 | |
| Poor Concentration | 0.03 | −0.02 | −0.01 | 0 | 0 | ||
| Longer to Think | 0.03 | −0.02 | −0.01 | 0 | 0 |
References
- Dewan, M.C.; Rattani, A.; Gupta, S.; Baticulon, R.E.; Hung, Y.-C.; Punchak, M.; Agrawal, A.; Adeleye, A.O.; Shrime, M.G.; Rubiano, A.M.; et al. Estimating the Global Incidence of Traumatic Brain Injury. J. Neurosurg. 2018, 130, 1080–1097. [Google Scholar] [CrossRef] [PubMed] [Green Version]
- Brazinova, A.; Rehorcikova, V.; Taylor, M.S.; Buckova, V.; Majdan, M.; Psota, M.; Peeters, W.; Feigin, V.; Theadom, A.; Holkovic, L.; et al. Epidemiology of traumatic brain injury in europe: A living systematic review. J. Neurotrauma 2021, 38, 1411–1440. [Google Scholar] [CrossRef] [PubMed] [Green Version]
- Savola, O.; Hillbom, M. Early predictors of post-Concussion symptoms in patients with mild head injury. Eur. J. Neurol. 2003, 10, 175–181. [Google Scholar] [CrossRef] [PubMed]
- Meares, S.; Shores, E.A.; Taylor, A.J.; Batchelor, J.; Bryant, R.A.; Baguley, I.J.; Chapman, J.; Gurka, J.; Dawson, K.; Capon, L.; et al. Mild traumatic brain injury does not predict acute postconcussion syndrome. J. Neurol. Neurosurg. Psychiatry 2008, 79, 300–306. [Google Scholar] [CrossRef] [Green Version]
- Dischinger, P.C.; Ryb, G.E.; Kufera, J.A.; Auman, K.M. Early predictors of postconcussive syndrome in a population of trauma patients with mild traumatic brain injury. J. Trauma Acute Care Surg. 2009, 66, 289–297. [Google Scholar] [CrossRef]
- Hoffman, J.M.; Lucas, S.; Dikmen, S.; Braden, C.A.; Brown, A.W.; Brunner, R.; Diaz-Arrastia, R.; Walker, W.C.; Watanabe, T.K.; Bell, K.R. Natural history of headache after traumatic brain injury. J. Neurotrauma 2011, 28, 1719–1725. [Google Scholar] [CrossRef] [Green Version]
- Walker, W.C.; Marwitz, J.H.; Wilk, A.R.; Ketchum, J.M.; Hoffman, J.M.; Brown, A.W.; Lucas, S. Prediction of headache severity (density and functional impact) after traumatic brain injury: A longitudinal multicenter study. Cephalalgia 2013, 33, 998–1008. [Google Scholar] [CrossRef]
- Meares, S.; Shores, E.A.; Taylor, A.J.; Batchelor, J.; Bryant, R.A.; Baguley, I.J.; Chapman, J.; Gurka, J.; Marosszeky, J.E. The prospective course of postconcussion syndrome: The role of mild traumatic brain injury. Neuropsychology 2011, 25, 454–465. [Google Scholar] [CrossRef] [Green Version]
- Merritt, V.C.; Arnett, P.A. Premorbid predictors of postconcussion symptoms in collegiate athletes. J. Clin. Exp. Neuropsychol. 2014, 36, 1098–1111. [Google Scholar] [CrossRef]
- Ling, H.; Hardy, J.; Zetterberg, H. Neurological consequences of traumatic brain injuries in sports. Mol. Cell. Neurosci. 2015, 66, 114–122. [Google Scholar] [CrossRef]
- Cnossen, M.C.; Winkler, E.A.; Yue, J.K.; Okonkwo, D.O.; Valadka, A.B.; Steyerberg, E.W.; Lingsma, H.F.; Manley, G.T.; Dams-O’Connor, K.; Gordon, W.A.; et al. Development of a prediction model for post-Concussive symptoms following mild traumatic brain injury: A Track-TBI Pilot study. J. Neurotrauma 2017, 34, 2396–2409. [Google Scholar] [CrossRef] [PubMed]
- Houck, Z.; Asken, B.; Bauer, R.; Clugston, J. Predictors of post-Concussion symptom severity in a university-Based concussion clinic. Brain Inj. 2019, 33, 480–489. [Google Scholar] [CrossRef] [PubMed]
- Cnossen, M.C.; van der Naalt, J.; Spikman, J.M.; Nieboer, D.; Yue, J.K.; Winkler, E.A.; Manley, G.T.; von Steinbuechel, N.; Polinder, S.; Steyerberg, E.W.; et al. Prediction of persistent post-Concussion symptoms after mild traumatic brain injury. J. Neurotrauma 2018, 35, 2691–2698. [Google Scholar] [CrossRef] [PubMed]
- Chamelian, L.; Feinstein, A. Outcome after mild to moderate traumatic brain injury: The role of dizziness. Arch. Phys. Med. Rehabil. 2004, 85, 1662–1666. [Google Scholar] [CrossRef] [PubMed]
- Ponsford, J.; Nguyen, S.; Downing, M.; Bosch, M.; McKenzie, J.E.; Turner, S.; Chau, M.; Mortimer, D.; Gruen, R.L.; Knott, J.; et al. Factors associated with persistent post-Concussion symptoms following mild traumatic brain injury in adults. J. Rehabil. Med. 2019, 51, 32–39. [Google Scholar] [CrossRef] [PubMed] [Green Version]
- Ganti, L.; Khalid, H.; Patel, P.S.; Daneshvar, Y.; Bodhit, A.N.; Peters, K.R. Who gets post-Concussion syndrome? an emergency department-Based prospective analysis. Int. J. Emerg. Med. 2014, 7, 31. [Google Scholar] [CrossRef] [Green Version]
- Stein, M.B.; Ursano, R.J.; Campbell-Sills, L.; Colpe, L.J.; Fullerton, C.S.; Heeringa, S.G.; Nock, M.K.; Sampson, N.A.; Schoenbaum, M.; Sun, X.; et al. Prognostic indicators of persistent post-Concussive symptoms after deployment-Related mild traumatic brain injury: A prospective longitudinal study in U.S. army soldiers. J. Neurotrauma 2016, 33, 2125–2132. [Google Scholar] [CrossRef] [Green Version]
- Goodrich, G.L.; Martinsen, G.L.; Flyg, H.M.; Kirby, J.; Garvert, D.W.; Tyler, C.W. Visual function, traumatic brain injury, and posttraumatic stress disorder. J. Rehabil. Res. Dev. 2014, 51, 547–558. [Google Scholar] [CrossRef] [Green Version]
- Porter, K.E.; Stein, M.B.; Martis, B.; Avallone, K.M.; McSweeney, L.B.; Smith, E.R.; Simon, N.M.; Gargan, S.; Liberzon, I.; Hoge, C.W.; et al. Postconcussive Symptoms (PCS) Following Combat-Related Traumatic Brain Injury (TBI) in Veterans with Posttraumatic Stress Disorder (PTSD): Influence of TBI, PTSD, and Depression on Symptoms Measured by the Neurobehavioral Symptom Inventory (NSI). J. Psychiatr. Res. 2018, 102, 8–13. [Google Scholar] [CrossRef]
- Towns, S.J.; Silva, M.A.; Belanger, H.G. Subjective Sleep Quality and Postconcussion Symptoms Following Mild Traumatic Brain Injury. Brain Inj. 2015, 29, 1337–1341. [Google Scholar] [CrossRef]
- Cronin, H.; O’Loughlin, E. Sleep and Fatigue after TBI. NeuroRehabilitation 2018, 43, 307–317. [Google Scholar] [CrossRef] [PubMed]
- Andelic, N.; Røe, C.; Brunborg, C.; Zeldovich, M.; Løvstad, M.; Løke, D.; Borgen, I.M.; Voormolen, D.C.; Howe, E.I.; Forslund, M.V.; et al. Frequency of Fatigue and Its Changes in the First 6 Months after Traumatic Brain Injury: Results from the CENTER-TBI Study. J. Neurol. 2021, 268, 61–73. [Google Scholar] [CrossRef] [PubMed]
- Cantor, J.B.; Bushnik, T.; Cicerone, K.; Dijkers, M.P.; Gordon, W.; Hammond, F.M.; Kolakowsky-Hayner, S.A.; Lequerica, A.; Nguyen, M.; Spielman, L.A. Insomnia, Fatigue, and Sleepiness in the First 2 Years After Traumatic Brain Injury: An NIDRR TBI Model System Module Study. J. Head Trauma Rehabil. 2012, 27, E1. [Google Scholar] [CrossRef] [PubMed]
- Zeldovich, M.; Wu, Y.-J.; Gorbunova, A.; Mikolic, A.; Polinder, S.; Plass, A.M.; Covic, A.; Asendorf, T.; Andelic, N.; Voormolen, D.C.; et al. Influence of Sociodemographic, Premorbid, and Injury-Related Factors on Post-Concussion Symptoms after Traumatic Brain Injury. J. Clin. Med. 2020, 9, 1931. [Google Scholar] [CrossRef] [PubMed]
- Tator, C.H.; Davis, H.S.; Dufort, P.A.; Tartaglia, M.C.; Davis, K.D.; Ebraheem, A.; Hiploylee, C. Postconcussion Syndrome: Demographics and Predictors in 221 Patients. J. Neurosurg. 2016, 125, 1206–1216. [Google Scholar] [CrossRef] [Green Version]
- Rabinowitz, A.R.; Levin, H.S. Cognitive Sequelae of Traumatic Brain Injury. Psychiatr. Clin. 2014, 37, 1–11. [Google Scholar] [CrossRef] [Green Version]
- Dockree, P.M.; Bellgrove, M.A.; O’Keeffe, F.M.; Moloney, P.; Aimola, L.; Carton, S.; Robertson, I.H. Sustained Attention in Traumatic Brain Injury (TBI) and Healthy Controls: Enhanced Sensitivity with Dual-Task Load. Exp. Brain Res. 2006, 168, 218–229. [Google Scholar] [CrossRef]
- Stewart-Willis, J.J.; Heyanka, D.; Proctor-Weber, Z.; England, H.; Bruhns, M. Premorbid IQ Predicts Postconcussive Symptoms in OEF/OIF/OND Veterans with MTBI. Arch. Clin. Neuropsychol. 2018, 33, 206–215. [Google Scholar] [CrossRef]
- Heidari, K.; Asadollahi, S.; Jamshidian, M.; Abrishamchi, S.N.; Nouroozi, M. Prediction of Neuropsychological Outcome after Mild Traumatic Brain Injury Using Clinical Parameters, Serum S100B Protein and Findings on Computed Tomography. Brain Inj. 2015, 29, 33–40. [Google Scholar] [CrossRef]
- Theadom, A.; Parag, V.; Dowell, T.; McPherson, K.; Starkey, N.; Barker-Collo, S.; Jones, K.; Ameratunga, S.; Feigin, V.L.; on behalf of the BIONIC Research Group. Persistent Problems 1 Year after Mild Traumatic Brain Injury: A Longitudinal Population Study in New Zealand. Br. J. Gen. Pract. 2016, 66, e16–e23. [Google Scholar] [CrossRef] [Green Version]
- Shah, S.A.; Goldin, Y.; Conte, M.M.; Goldfine, A.M.; Mohamadpour, M.; Fidali, B.C.; Cicerone, K.; Schiff, N.D. Executive Attention Deficits after Traumatic Brain Injury Reflect Impaired Recruitment of Resources. NeuroImage Clin. 2017, 14, 233–241. [Google Scholar] [CrossRef] [PubMed]
- Ozga, J.E.; Povroznik, J.M.; Engler-Chiurazzi, E.B.; Haar, C.V. Executive (Dys)Function after Traumatic Brain Injury: Special Considerations for Behavioral Pharmacology. Behav. Pharmacol. 2018, 29, 617–637. [Google Scholar] [CrossRef] [PubMed]
- Pettemeridou, E.; Kennedy, M.R.T.; Constantinidou, F. Executive Functions, Self-Awareness and Quality of Life in Chronic Moderate-to-Severe TBI. NeuroRehabilitation 2020, 46, 109–118. [Google Scholar] [CrossRef] [PubMed]
- Sigurdardottir, S.; Andelic, N.; Wehling, E.; Roe, C.; Anke, A.; Skandsen, T.; Holthe, O.O.; Jerstad, T.; Aslaksen, P.M.; Schanke, A.-K. Neuropsychological Functioning in a National Cohort of Severe Traumatic Brain Injury: Demographic and Acute Injury–Related Predictors. J. Head Trauma Rehabil. 2015, 30, E1–E12. [Google Scholar] [CrossRef] [PubMed] [Green Version]
- Skandsen, T.; Finnanger, T.G.; Andersson, S.; Lydersen, S.; Brunner, J.F.; Vik, A. Cognitive Impairment 3 Months After Moderate and Severe Traumatic Brain Injury: A Prospective Follow-Up Study. Arch. Phys. Med. Rehabil. 2010, 91, 1904–1913. [Google Scholar] [CrossRef]
- Finnanger, T.G.; Skandsen, T.; Andersson, S.; Lydersen, S.; Vik, A.; Indredavik, M. Differentiated Patterns of Cognitive Impairment 12 Months after Severe and Moderate Traumatic Brain Injury. Brain Inj. 2013, 27, 1606–1616. [Google Scholar] [CrossRef]
- Davis-Hayes, C.; Gossett, J.D.; Levine, W.N.; Shams, T.; Harada, J.; Mitnick, J.; Noble, J. Sex-Specific Outcomes and Predictors of Concussion Recovery. JAAOS-J. Am. Acad. Orthop. Surg. 2017, 25, 818–828. [Google Scholar] [CrossRef]
- Calvillo, M.; Irimia, A. Neuroimaging and Psychometric Assessment of Mild Cognitive Impairment After Traumatic Brain Injury. Front. Psychol. 2020, 11, 1423. [Google Scholar] [CrossRef]
- Singh, R.; Mason, S.; Lecky, F.; Dawson, J. Prevalence of Depression after TBI in a Prospective Cohort: The SHEFBIT Study. Brain Inj. 2018, 32, 84–90. [Google Scholar] [CrossRef]
- Seel, R.T.; Macciocchi, S.; Kreutzer, J.S. Clinical Considerations for the Diagnosis of Major Depression After Moderate to Severe TBI. J. Head Trauma Rehabil. 2010, 25, 99–112. [Google Scholar] [CrossRef]
- Rapoport, M.J. Depression Following Traumatic Brain Injury. CNS Drugs 2012, 26, 111–121. [Google Scholar] [CrossRef] [PubMed]
- Ponsford, J. Anxiety and depression following TBI. In Neurobehavioural Disability and Social Handicap Following Traumatic Brain Injury; Psychology Press: London, UK, 2017; ISBN 978-1-315-68471-0. [Google Scholar]
- Scholten, A.C.; Haagsma, J.A.; Cnossen, M.C.; Olff, M.; van Beeck, E.F.; Polinder, S. Prevalence of and Risk Factors for Anxiety and Depressive Disorders after Traumatic Brain Injury: A Systematic Review. J. Neurotrauma 2016, 33, 1969–1994. [Google Scholar] [CrossRef] [PubMed]
- Clarke, L.A.; Genat, R.C.; Anderson, J.F.I. Long-Term Cognitive Complaint and Post-Concussive Symptoms Following Mild Traumatic Brain Injury: The Role of Cognitive and Affective Factors. Brain Inj. 2012, 26, 298–307. [Google Scholar] [CrossRef]
- Sigurdardottir, S.; Andelic, N.; Roe, C.; Jerstad, T.; Schanke, A.-K. Post-Concussion Symptoms after Traumatic Brain Injury at 3 and 12 Months Post-Injury: A Prospective Study. Brain Inj. 2009, 23, 489–497. [Google Scholar] [CrossRef]
- Ponsford, J.; Cameron, P.; Fitzgerald, M.; Grant, M.; Mikocka-Walus, A.; Schönberger, M. Predictors of Postconcussive Symptoms 3 Months after Mild Traumatic Brain Injury. Neuropsychology 2012, 26, 304–313. [Google Scholar] [CrossRef] [PubMed]
- Bahraini, N.H.; Simpson, G.K.; Brenner, L.A.; Hoffberg, A.S.; Schneider, A.L. Suicidal Ideation and Behaviours after Traumatic Brain Injury: A Systematic Review. Brain Impair. 2013, 14, 92–112. [Google Scholar] [CrossRef] [Green Version]
- Mackelprang, J.L.; Bombardier, C.H.; Fann, J.R.; Temkin, N.R.; Barber, J.K.; Dikmen, S.S. Rates and Predictors of Suicidal Ideation During the First Year After Traumatic Brain Injury. Am. J. Public Health. 2014, 104, e100–e107. [Google Scholar] [CrossRef]
- Tsaousides, T.; Cantor, J.B.; Gordon, W.A. Suicidal Ideation Following Traumatic Brain Injury: Prevalence Rates and Correlates in Adults Living in the Community. J. Head Trauma Rehabil. 2011, 26, 265–275. [Google Scholar] [CrossRef]
- Rosenthal, J.F.; Erickson, J.C. Post-Traumatic Stress Disorder in U.S. Soldiers with Post-Traumatic Headache. Headache J. Head Face Pain 2013, 53, 1564–1572. [Google Scholar] [CrossRef]
- Rao, V.; Spiro, J.R.; Schretlen, D.J.; Cascella, N.G. Apathy Syndrome After Traumatic Brain Injury Compared with Deficits in Schizophrenia. Psychosomatics 2007, 48, 217–222. [Google Scholar] [CrossRef]
- Starkstein, S.E.; Pahissa, J. Apathy Following Traumatic Brain Injury. Psychiatr. Clin. 2014, 37, 103–112. [Google Scholar] [CrossRef] [PubMed]
- Yang, C.-C.; Hua, M.-S.; Lin, W.-C.; Tsai, Y.-H.; Huang, S.-J. Irritability Following Traumatic Brain Injury: Divergent Manifestations of Annoyance and Verbal Aggression. Brain Inj. 2012, 26, 1185–1191. [Google Scholar] [CrossRef]
- Hammond, F.M.; Davis, C.S.; Cook, J.R.; Philbrick, P.; Hirsch, M.A. Relational Dimension of Irritability Following Traumatic Brain Injury: A Qualitative Analysis. Brain Inj. 2012, 26, 1287–1296. [Google Scholar] [CrossRef] [PubMed]
- Miles, S.R.; Hammond, F.M.; Neumann, D.; Silva, M.A.; Tang, X.; Kajankova, M.; Dillahunt-Aspillaga, C.; Nakase-Richardson, R. Evolution of Irritability, Anger, and Aggression after Traumatic Brain Injury: Identifying and Predicting Subgroups. J. Neurotrauma 2021, 38, 1827–1833. [Google Scholar] [CrossRef] [PubMed]
- Gracia-Garcia, P.; Mielke, M.M.; Rosenberg, P.; Bergey, A.; Rao, V. Personality Changes in Brain Injury. JNP 2011, 23, E14. [Google Scholar] [CrossRef]
- Rush, B.K.; Malec, J.F.; Brown, A.W.; Moessner, A.M. Personality and Functional Outcome Following Traumatic Brain Injury. Rehabil. Psychol. 2006, 51, 257–264. [Google Scholar] [CrossRef]
- Lippert-Grüner, M.; Kuchta, J.; Hellmich, M.; Klug, N. Neurobehavioural Deficits after Severe Traumatic Brain Injury (TBI). Brain Inj. 2006, 20, 569–574. [Google Scholar] [CrossRef]
- Wolfe, L.F.; Sahni, A.S.; Attarian, H. Sleep Disorders in Traumatic Brain Injury. NeuroRehabilitation 2018, 43, 257–266. [Google Scholar] [CrossRef]
- Ouellet, M.-C.; Beaulieu-Bonneau, S.; Morin, C.M. Insomnia in Patients with Traumatic Brain Injury: Frequency, Characteristics, and Risk Factors. J. Head Trauma Rehabil. 2006, 21, 199–212. [Google Scholar] [CrossRef]
- Jain, A.; Mittal, R.S.; Sharma, A.; Sharma, A.; Gupta, I.D. Study of Insomnia and Associated Factors in Traumatic Brain Injury. Asian J. Psychiatry 2014, 8, 99–103. [Google Scholar] [CrossRef]
- King, N.S.; Crawford, S.; Wenden, F.J.; Moss, N.E.G.; Wade, D.T. The Rivermead Post Concussion Symptoms Questionnaire: A Measure of Symptoms Commonly Experienced after Head Injury and Its Reliability. J Neurol. 1995, 242, 587–592. [Google Scholar] [CrossRef] [PubMed]
- Carroll, L.; Cassidy, J.D.; Peloso, P.; Borg, J.; von Holst, H.; Holm, L.; Paniak, C.; Pépin, M. Prognosis for Mild Traumatic Brain Injury: Results of the Who Collaborating Centre Task Force on Mild Traumatic Brain Injury. J. Rehabil. Med. 2004, 36, 84–105. [Google Scholar] [CrossRef] [PubMed] [Green Version]
- Røe, C.; Sveen, U.; Alvsåker, K.; Bautz-Holter, E. Post-Concussion Symptoms after Mild Traumatic Brain Injury: Influence of Demographic Factors and Injury Severity in a 1-Year Cohort Study. Disabil. Rehabil. 2009, 31, 1235–1243. [Google Scholar] [CrossRef] [PubMed]
- King, N. Permanent Post Concussion Symptoms after Mild Head Injury: A Systematic Review of Age and Gender Factors. NeuroRehabilitation 2014, 34, 741–748. [Google Scholar] [CrossRef]
- Hiploylee, C.; Dufort, P.A.; Davis, H.S.; Wennberg, R.A.; Tartaglia, M.C.; Mikulis, D.; Hazrati, L.-N.; Tator, C.H. Longitudinal Study of Postconcussion Syndrome: Not Everyone Recovers. J. Neurotrauma 2017, 34, 1511–1523. [Google Scholar] [CrossRef] [Green Version]
- Gorgoraptis, N.; Zaw-Linn, J.; Feeney, C.; Tenorio-Jimenez, C.; Niemi, M.; Malik, A.; Ham, T.; Goldstone, A.P.; Sharp, D.J. Cognitive Impairment and Health-Related Quality of Life Following Traumatic Brain Injury. NeuroRehabilitation 2019, 44, 321–331. [Google Scholar] [CrossRef] [Green Version]
- Polinder, S.; Haagsma, J.A.; van Klaveren, D.; Steyerberg, E.W.; van Beeck, E.F. Health-Related Quality of Life after TBI: A Systematic Review of Study Design, Instruments, Measurement Properties, and Outcome. Popul. Health Metr. 2015, 13, 4. [Google Scholar] [CrossRef] [Green Version]
- Dijkers, M.P. Quality of Life after Traumatic Brain Injury: A Review of Research Approaches and Findings11No Commercial Party Having a Direct Financial Interest in the Results of the Research Supporting This Article Has or Will Confer a Benefit upon the Authors(s) or upon Any Organization with Which the Author(s) Is/Are Associated. Arch. Phys. Med. Rehabil. 2004, 85, 21–35. [Google Scholar] [CrossRef]
- Wäljas, M.; Iverson, G.L.; Lange, R.T.; Liimatainen, S.; Hartikainen, K.M.; Dastidar, P.; Soimakallio, S.; Öhman, J. Return to Work Following Mild Traumatic Brain Injury. J. Head Trauma Rehabil. 2014, 29, 443–450. [Google Scholar] [CrossRef]
- van Velzen, J.M.; van Bennekom, C.A.M.; Edelaar, M.J.A.; Sluiter, J.K.; Frings-Dresen, M.H.W. How Many People Return to Work after Acquired Brain Injury?: A Systematic Review. Brain Inj. 2009, 23, 473–488. [Google Scholar] [CrossRef]
- Sigurdardottir, S.; Andelic, N.; Wehling, E.; Anke, A.; Skandsen, T.; Holthe, O.O.; Manskow, U.S.; Roe, C. Return to Work after Severe Traumatic Brain Injury: A National Study with a One-Year Follow-Up of Neurocognitive and Behavioural Outcomes. Neuropsychol. Rehabil. 2020, 30, 281–297. [Google Scholar] [CrossRef] [PubMed]
- Toglia, J.; Golisz, K. Traumatic Brain Injury (TBI) and the impact on daily life. In Changes in the Brain: Impact on Daily Life; Chiaravalloti, N.D., Goverover, Y., Eds.; Springer: New York, NY, USA, 2017; pp. 117–143. ISBN 978-0-387-98188-8. [Google Scholar]
- García-Molina, A.; Bernabeu Guitart, M.; Roig-Rovira, T. Traumatic brain injury and daily life: The role of executive function. Psicothema 2010, 22, 430–435. [Google Scholar] [PubMed]
- Bivona, U.; D’Ippolito, M.; Giustini, M.; Vignally, P.; Longo, E.; Taggi, F.; Formisano, R. Return to Driving After Severe Traumatic Brain Injury: Increased Risk of Traffic Accidents and Personal Responsibility. J. Head Trauma Rehabil. 2012, 27, 210–215. [Google Scholar] [CrossRef]
- Preece, M.H.W.; Geffen, G.M.; Horswill, M.S. Return-To-Driving Expectations Following Mild Traumatic Brain Injury. Brain Inj. 2013, 27, 83–91. [Google Scholar] [CrossRef] [PubMed] [Green Version]
- Tian, R.; Liu, W.; Dong, J.; Zhang, J.; Xu, L.; Zhang, B.; Tao, X.; Li, J.; Liu, B. Prognostic Predictors of Early Outcomes and Discharge Status of Patients Undergoing Decompressive Craniectomy After Severe Traumatic Brain Injury. World Neurosurg. 2019, 126, e101–e108. [Google Scholar] [CrossRef]
- Gritti, P.; Zangari, R.; Carobbio, A.; Zucchi, A.; Lorini, F.L.; Ferri, F.; Agostinis, C.; Lanterna, L.A.; Brembilla, C.; Foresti, C.; et al. Acute and Subacute Outcome Predictors in Moderate and Severe Traumatic Brain Injury: A Retrospective Monocentric Study. World Neurosurg. 2019, 128, e531–e540. [Google Scholar] [CrossRef]
- Steyerberg, E.W.; Mushkudiani, N.; Perel, P.; Butcher, I.; Lu, J.; McHugh, G.S.; Murray, G.D.; Marmarou, A.; Roberts, I.; Habbema, J.D.F.; et al. Predicting Outcome after Traumatic Brain Injury: Development and International Validation of Prognostic Scores Based on Admission Characteristics. PLoS Med. 2008, 5, e165. [Google Scholar] [CrossRef] [Green Version]
- Booker, J.; Sinha, S.; Choudhari, K.; Dawson, J.; Singh, R. Description of the Predictors of Persistent Post-Concussion Symptoms and Disability after Mild Traumatic Brain Injury: The SHEFBIT Cohort. Br. J. Neurosurg. 2019, 33, 367–375. [Google Scholar] [CrossRef]
- Brown, N.J.; Mannix, R.C.; O’Brien, M.J.; Gostine, D.; Collins, M.W.; Meehan, W.P. III Effect of Cognitive Activity Level on Duration of Post-Concussion Symptoms. Pediatrics 2014, 133, e299–e304. [Google Scholar] [CrossRef] [Green Version]
- Sullivan, K.A.; Edmed, S.L.; Greenslade, J.H.; White, M.; Chu, K.; Lukin, B.; Lange, R.T.; Lurie, J.K. Psychological Predictors of Postconcussive Symptoms Following Traumatic Injury. J. Head Trauma Rehabil. 2018, 33, E47–E60. [Google Scholar] [CrossRef]
- Seagly, K.S.; O’Neil, R.L.; Hanks, R.A. Pre-Injury Psychosocial and Demographic Predictors of Long-Term Functional Outcomes Post-TBI. Brain Inj. 2018, 32, 78–83. [Google Scholar] [CrossRef] [PubMed]
- Yue, J.K.; Cnossen, M.C.; Winkler, E.A.; Deng, H.; Phelps, R.R.L.; Coss, N.A.; Sharma, S.; Robinson, C.K.; Suen, C.G.; Vassar, M.J.; et al. Pre-Injury Comorbidities Are Associated with Functional Impairment and Post-Concussive Symptoms at 3- and 6-Months After Mild Traumatic Brain Injury: A TRACK-TBI Study. Front. Neurol. 2019, 10, 343. [Google Scholar] [CrossRef] [PubMed]
- Kraus, J.F.; Peek-Asa, C.; McArthur, D. The Independent Effect of Gender on Outcomes Following Traumatic Brain Injury: A Preliminary Investigation. Neurosurg. Focus 2000, 8, 1–7. [Google Scholar] [CrossRef] [PubMed]
- Wood, R.L.; Rutterford, N.A. Demographic and Cognitive Predictors of Long-Term Psychosocial Outcome Following Traumatic Brain Injury. J. Int. Neuropsychol. Soc. 2006, 12, 350–358. [Google Scholar] [CrossRef] [PubMed]
- Arango-Lasprilla, J.C.; Kreutzer, J.S. Racial and Ethnic Disparities in Functional, Psychosocial, and Neurobehavioral Outcomes After Brain Injury. J. Head Trauma Rehabil. 2010, 25, 128–136. [Google Scholar] [CrossRef] [PubMed]
- Gary, K.W.; Arango-Lasprilla, J.C.; Stevens, L.F. Do Racial/Ethnic Differences Exist in Post-Injury Outcomes after TBI? A Comprehensive Review of the Literature. Brain Inj. 2009, 23, 775–789. [Google Scholar] [CrossRef] [PubMed]
- Zador, Z.; Sperrin, M.; King, A.T. Predictors of Outcome in Traumatic Brain Injury: New Insight Using Receiver Operating Curve Indices and Bayesian Network Analysis. PLoS ONE 2016, 11, e0158762. [Google Scholar] [CrossRef]
- Colantonio, A.; Escobar, M.D.; Chipman, M.; McLellan, B.; Austin, P.C.; Mirabella, G.; Ratcliff, G. Predictors of Postacute Mortality Following Traumatic Brain Injury in a Seriously Injured Population. J. Trauma Acute Care Surg. 2008, 64, 876–882. [Google Scholar] [CrossRef] [Green Version]
- Traylor, J.I.; El Ahmadieh, T.Y.; Bedros, N.M.; Al Adli, N.; Stutzman, S.E.; Venkatachalam, A.M.; Pernik, M.N.; Collum, C.M.; Douglas, P.M.; Aiyagari, V.; et al. Quantitative Pupillometry in Patients with Traumatic Brain Injury and Loss of Consciousness: A Prospective Pilot Study. J. Clin. Neurosci. 2021, 91, 88–92. [Google Scholar] [CrossRef]
- De Guise, E.; Leblanc, J.; Dagher, J.; Lamoureux, J.; Jishi, A.A.; Maleki, M.; Marcoux, J.; Feyz, M. Early Outcome in Patients with Traumatic Brain Injury, Pre-Injury Alcohol Abuse and Intoxication at Time of Injury. Brain Inj. 2009, 23, 853–865. [Google Scholar] [CrossRef]
- Andelic, N.; Jerstad, T.; Sigurdardottir, S.; Schanke, A.-K.; Sandvik, L.; Roe, C. Effects of Acute Substance Use and Pre-Injury Substance Abuse on Traumatic Brain Injury Severity in Adults Admitted to a Trauma Centre. J Trauma Manag. Outcomes 2010, 4, 6. [Google Scholar] [CrossRef] [PubMed] [Green Version]
- Kolakowsky-Hayner, S.A.; Kreutzer, J.S. Pre-Injury Crime, Substance Abuse, and Neurobehavioural Functioning after Traumatic Brain Injury. Brain Inj. 2001, 15, 53–63. [Google Scholar] [CrossRef] [PubMed]
- Khan, K.A.; Choudhary, M.; Sinha, V.D.; Gora, N.; Bairwa, M. Predictors of Outcome After Traumatic Brain Injuries: Experience of a Tertiary Health Care Institution in Northwest India. World Neurosurg. 2019, 126, e699–e705. [Google Scholar] [CrossRef] [PubMed]
- Sullivan, K.A.; Edmed, S.L.; Allan, A.C.; Smith, S.S.; Karlsson, L.J.E. The Role of Psychological Resilience and MTBI as Predictors of Postconcussional Syndrome Symptomatology. Rehabil. Psychol. 2015, 60, 147–154. [Google Scholar] [CrossRef] [PubMed]
- Mallya, S.; Sutherland, J.; Pongracic, S.; Mainland, B.; Ornstein, T.J. The Manifestation of Anxiety Disorders after Traumatic Brain Injury: A Review. J. Neurotrauma 2015, 32, 411–421. [Google Scholar] [CrossRef] [PubMed]
- Lange, R.T.; French, L.M.; Lippa, S.M.; Bailie, J.M.; Brickell, T.A. Posttraumatic Stress Disorder Is a Stronger Predictor of Long-Term Neurobehavioral Outcomes Than Traumatic Brain Injury Severity. J. Trauma. Stress 2020, 33, 318–329. [Google Scholar] [CrossRef]
- Wäljas, M.; Iverson, G.L.; Lange, R.T.; Hakulinen, U.; Dastidar, P.; Huhtala, H.; Liimatainen, S.; Hartikainen, K.; Öhman, J. A Prospective Biopsychosocial Study of the Persistent Post-Concussion Symptoms Following Mild Traumatic Brain Injury. J. Neurotrauma 2015, 32, 534–547. [Google Scholar] [CrossRef]
- Wilde, E.A.; Whiteneck, G.G.; Bogner, J.; Bushnik, T.; Cifu, D.X.; Dikmen, S.; French, L.; Giacino, J.T.; Hart, T.; Malec, J.F.; et al. Recommendations for the Use of Common Outcome Measures in Traumatic Brain Injury Research. Arch. Phys. Med. Rehabil. 2010, 91, 1650–1660.e17. [Google Scholar] [CrossRef]
- NINDS Project Overview. Available online: https://www.commondataelements.ninds.nih.gov/Traumatic%20Brain%20Injury (accessed on 17 May 2022).
- Smith-Seemiller, L.; Fow, N.R.; Kant, R.; Franzen, M.D. Presence of Post-Concussion Syndrome Symptoms in Patients with Chronic Pain vs Mild Traumatic Brain Injury. Brain Inj. 2003, 17, 199–206. [Google Scholar] [CrossRef]
- Eyres, S.; Carey, A.; Gilworth, G.; Neumann, V.; Tennant, A. Construct Validity and Reliability of the Rivermead Post-Concussion Symptoms Questionnaire. Clin. Rehabil. 2005, 19, 878–887. [Google Scholar] [CrossRef]
- Herrmann, N.; Rapoport, M.J.; Rajaram, R.D.; Chan, F.; Kiss, A.; Ma, A.K.; Feinstein, A.; McCullagh, S.; Lanctôt, K.L. Factor Analysis of the Rivermead Post-Concussion Symptoms Questionnaire in Mild-to-Moderate Traumatic Brain Injury Patients. JNP 2009, 21, 181–188. [Google Scholar] [CrossRef] [PubMed]
- Lannsjö, M.; Borg, J.; Björklund, G.; Af Geijerstam, J.-L.; Lundgren-Nilsson, A. Internal Construct Validity of the Rivermead Post-Concussion Symptoms Questionnaire. J. Rehabil. Med. 2011, 43, 997–1002. [Google Scholar] [CrossRef] [PubMed] [Green Version]
- Thomas, M.; Skilbeck, C.; Cannan, P.; Slatyer, M. The Structure of the Rivermead Post-Concussion Symptoms Questionnaire in Australian Adults with Traumatic Brain Injury. Brain Impair. 2018, 19, 166–182. [Google Scholar] [CrossRef]
- Zeldovich, M.; Bockhop, F.; Plass, A.M.; Covic, A.; Mueller, I.; Polinder, S.; Mikolic, A.; van der Vlegel, M.; Steinbuechel, N. CENTER-TBI participants and investigators Comparability of the Six Rivermead Post-Concussion Symptoms Questionnaire Translations: Results from the CENTER-TBI Study. PLoS ONE 2021. under revision. [Google Scholar]
- Potter, S.; Leigh, E.; Wade, D.; Fleminger, S. The Rivermead Post Concussion Symptoms Questionnaire. J. Neurol. 2006, 253, 1603–1614. [Google Scholar] [CrossRef] [PubMed]
- Liu, Y.; Millsap, R.E.; West, S.G.; Tein, J.-Y.; Tanaka, R.; Grimm, K.J. Testing Measurement Invariance in Longitudinal Data with Ordered-Categorical Measures. Psychol. Methods 2017, 22, 486–506. [Google Scholar] [CrossRef] [PubMed]
- Agtarap, S.; Kramer, M.D.; Campbell-Sills, L.; Yuh, E.; Mukherjee, P.; Manley, G.T.; McCrea, M.A.; Dikmen, S.; Giacino, J.T.; Stein, M.B.; et al. Invariance of the Bifactor Structure of Mild Traumatic Brain Injury (MTBI) Symptoms on the Rivermead Postconcussion Symptoms Questionnaire Across Time, Demographic Characteristics, and Clinical Groups: A TRACK-TBI Study. Assessment 2021, 28, 1656–1670. [Google Scholar] [CrossRef]
- Steyerberg, E.W.; Wiegers, E.; Sewalt, C.; Buki, A.; Citerio, G.; De Keyser, V.; Ercole, A.; Kunzmann, K.; Lanyon, L.; Lecky, F.; et al. Case-Mix, Care Pathways, and Outcomes in Patients with Traumatic Brain Injury in CENTER-TBI: A European Prospective, Multicentre, Longitudinal, Cohort Study. Lancet Neurol. 2019, 18, 923–934. [Google Scholar] [CrossRef]
- Teasdale, G.; Jennett, B. Assessment of coma and impaired consciousness: A Practical Scale. Lancet 1974, 304, 81–84. [Google Scholar] [CrossRef]
- Gennarelli, T.A.; Wodzin, E. The Abbreviated Injury Scale 2005. Available online: https://www.nazl.nl/sites/nazl/files/2021-06/AIS0508_codeboek.pdf (accessed on 11 July 2022).
- Kline, R.B. Principles and Practice of Structural Equation Modeling, 4th ed.; Guilford Publications: New York, NY, USA, 2015; ISBN 978-1-4625-2335-1. [Google Scholar]
- Schreiber, J.B.; Nora, A.; Stage, F.K.; Barlow, E.A.; King, J. Reporting Structural Equation Modeling and Confirmatory Factor Analysis Results: A Review. J. Educ. Res. 2006, 99, 323–338. [Google Scholar] [CrossRef]
- R Core Team. R: A Language and Environment for Statistical Computing; R Foundation for Statistical Computing: Vienna, Austria, 2020. [Google Scholar]
- Bates, D.; Mächler, M.; Bolker, B.; Walker, S. Fitting Linear Mixed-Effects Models Using Lme4. J. Stat. Soft. 2015, 67, 1–48. [Google Scholar] [CrossRef]
- Rosseel, Y. Lavaan: An R Package for Structural Equation Modeling. J. Stat. Soft. 2012, 48, 1–36. [Google Scholar] [CrossRef] [Green Version]
- Van De Schoot, R.; Schmidt, P.; De Beuckelaer, A.; Lek, K.; Zondervan-Zwijnenburg, M. Editorial: Measurement Invariance. Front. Psychol. 2015, 6, 1064. [Google Scholar] [CrossRef] [PubMed] [Green Version]
- Renga, V. Clinical Evaluation and Treatment of Patients with Postconcussion Syndrome. Neurol. Res. Int. 2021, 2021, e5567695. [Google Scholar] [CrossRef]
- Gozt, A.; Licari, M.; Halstrom, A.; Milbourn, H.; Lydiard, S.; Black, A.; Arendts, G.; Macdonald, S.; Song, S.; MacDonald, E.; et al. Towards the Development of an Integrative, Evidence-Based Suite of Indicators for the Prediction of Outcome Following Mild Traumatic Brain Injury: Results from a Pilot Study. Brain Sci. 2020, 10, 23. [Google Scholar] [CrossRef] [Green Version]
- Roy, D.; Peters, M.E.; Everett, A.; Leoutsakos, J.-M.; Yan, H.; Rao, V.; Bechtold, K.; Sair, H.; Van Meter, T.E.; Falk, H.; et al. Loss of Consciousness and Altered Mental State Predicting Depressive and Post-Concussive Symptoms after Mild Traumatic Brain Injury. Brain Inj. 2019, 33, 1064–1069. [Google Scholar] [CrossRef]
- Voormolen, D.C.; Cnossen, M.C.; Polinder, S.; von Steinbuechel, N.; Vos, P.E.; Haagsma, J.A. Divergent Classification Methods of Post-Concussion Syndrome after Mild Traumatic Brain Injury: Prevalence Rates, Risk Factors, and Functional Outcome. J. Neurotrauma 2018, 35, 1233–1241. [Google Scholar] [CrossRef]


| Variable | Level | n | % | Mean (SD) |
|---|---|---|---|---|
| Age in years | -- | -- | -- | 49.6 (19.1) |
| Education in years | -- | -- | -- | 14.0 (4.1) |
| Sex | Female | 334 | (32.6%) | -- |
| Male | 689 | (67.4%) | -- | |
| Race | Asian | 11 | (1%) | -- |
| Black | 8 | (1%) | -- | |
| White | 982 | (96%) | -- | |
| Missing | 23 | (2%) | -- | |
| Marital status | Partnered | 560 | (54.8%) | -- |
| Single | 461 | (45.8%) | -- | |
| Employment status | Full-time employed | 447 | (46.5%) | -- |
| Part-time employed | 111 | (11.5%) | -- | |
| In training | 100 | (10.4%) | -- | |
| Unemployed | 67 | (7.0%) | -- | |
| Retired | 237 | (24.6%) | -- | |
| Geographical region | Eastern Europe | 8 | (1%) | -- |
| Northern Europe | 299 | (29%) | -- | |
| Southern Europe | 265 | (26%) | -- | |
| Western Europe | 451 | (44%) | -- | |
| TBI severity | Uncomplicated | 233 | (24.6%) | -- |
| Mild | 427 | (45.0%) | -- | |
| Moderate | 93 | (9.8%) | -- | |
| Severe | 196 | (20.7%) | -- | |
| Injury cause | Road traffic accident | 454 | (45.4%) | -- |
| Fall | 410 | (41.0%) | -- | |
| Violent/other | 137 | (13.7%) | -- | |
| Admission type | ADM | 503 | (49.2%) | -- |
| ICU | 520 | (50.8%) | -- | |
| Previous concussions | No | 884 | (90.2%) | -- |
| Yes | 96 | (9.8%) | -- | |
| Prior psychiatric problems | No | 909 | (89.6%) | -- |
| Yes | 106 | (10.4%) | -- |
| N = 1023 | Not Experienced at All | No More of a Problem (Than Before) | A Mild Problem | A Moderate Problem | A Severe Problem | ||||||||||||
|---|---|---|---|---|---|---|---|---|---|---|---|---|---|---|---|---|---|
| Item | Abbreviation 1 | Scale | 3M | 6M | 12M | 3M | 6M | 12M | 3M | 6M | 12M | 3M | 6M | 12M | 3M | 6M | 12M |
| Headaches | Headaches | S | 0.5 | 0.55 | 0.57 | 0.18 | 0.18 | 0.17 | 0.18 | 0.15 | 0.15 | 0.12 | 0.11 | 0.09 | 0.02 | 0.02 | 0.03 |
| Feeling of Dizziness | Dizziness | S | 0.54 | 0.59 | 0.6 | 0.13 | 0.14 | 0.16 | 0.19 | 0.17 | 0.15 | 0.09 | 0.08 | 0.07 | 0.04 | 0.03 | 0.03 |
| Nausea and/or Vomiting | Nausea | S | 0.84 | 0.88 | 0.85 | 0.08 | 0.07 | 0.09 | 0.05 | 0.04 | 0.04 | 0.02 | 0.02 | 0.01 | 0.01 | 0 | 0.01 |
| Noise Sensitivity, easily upset by loud noise | Noise Sensitivity | S | 0.6 | 0.61 | 0.61 | 0.14 | 0.14 | 0.13 | 0.14 | 0.14 | 0.13 | 0.09 | 0.08 | 0.09 | 0.03 | 0.03 | 0.04 |
| Sleep Disturbance | Sleep Disturbance | S | 0.5 | 0.53 | 0.51 | 0.19 | 0.18 | 0.2 | 0.15 | 0.15 | 0.14 | 0.1 | 0.1 | 0.1 | 0.06 | 0.04 | 0.06 |
| Fatigue, tiring more easily | Fatigue | S | 0.28 | 0.34 | 0.36 | 0.16 | 0.17 | 0.16 | 0.27 | 0.24 | 0.24 | 0.21 | 0.18 | 0.17 | 0.08 | 0.07 | 0.07 |
| Being Irritable, easily angered | Irritable | E | 0.49 | 0.51 | 0.49 | 0.23 | 0.21 | 0.23 | 0.15 | 0.17 | 0.17 | 0.1 | 0.09 | 0.09 | 0.03 | 0.03 | 0.02 |
| Feeling Depressed or Tearful | Depressed | E | 0.54 | 0.55 | 0.55 | 0.17 | 0.19 | 0.18 | 0.15 | 0.14 | 0.15 | 0.11 | 0.09 | 0.09 | 0.02 | 0.02 | 0.03 |
| Feeling Frustrated or Impatient | Frustrated | E | 0.46 | 0.5 | 0.51 | 0.21 | 0.22 | 0.22 | 0.17 | 0.16 | 0.15 | 0.13 | 0.1 | 0.09 | 0.04 | 0.03 | 0.03 |
| Forgetfulness, poor memory | Forgetful | C | 0.37 | 0.38 | 0.37 | 0.23 | 0.21 | 0.22 | 0.21 | 0.25 | 0.22 | 0.13 | 0.12 | 0.13 | 0.05 | 0.04 | 0.06 |
| Poor Concentration | Poor Concentration | C | 0.42 | 0.44 | 0.42 | 0.2 | 0.2 | 0.21 | 0.21 | 0.21 | 0.21 | 0.13 | 0.12 | 0.12 | 0.04 | 0.03 | 0.04 |
| Taking Longer to Think | Longer to Think | C | 0.47 | 0.48 | 0.47 | 0.18 | 0.18 | 0.19 | 0.2 | 0.21 | 0.2 | 0.11 | 0.1 | 0.11 | 0.04 | 0.03 | 0.04 |
| Blurred Vision | Blurred Vision | S | 0.67 | 0.69 | 0.72 | 0.15 | 0.14 | 0.14 | 0.09 | 0.09 | 0.09 | 0.06 | 0.05 | 0.03 | 0.03 | 0.03 | 0.02 |
| Light Sensitivity, easily upset by bright light | Light Sensitivity | S | 0.7 | 0.71 | 0.68 | 0.14 | 0.13 | 0.16 | 0.1 | 0.09 | 0.1 | 0.04 | 0.05 | 0.05 | 0.02 | 0.02 | 0.02 |
| Double Vision | Double Vision | S | 0.83 | 0.84 | 0.84 | 0.07 | 0.07 | 0.09 | 0.04 | 0.05 | 0.04 | 0.03 | 0.02 | 0.02 | 0.03 | 0.02 | 0.01 |
| Restlessness | Restless | E | 0.61 | 0.63 | 0.61 | 0.17 | 0.18 | 0.18 | 0.14 | 0.11 | 0.14 | 0.07 | 0.06 | 0.05 | 0.01 | 0.02 | 0.02 |
| Factor | Model | Robust Goodness-of-Fit | CFI | TLI | RMSEA [CI90%] | SRMR | |||||
|---|---|---|---|---|---|---|---|---|---|---|---|
| df | p | ||||||||||
| Somatic | Baseline | 1395.998 | 303 | <0.001 | 0.942 | 0.933 | 0.059 [0.056, 0.063] | 0.069 | -- | -- | -- |
| Loading | 1388.77 | 319 | <0.001 | 0.944 | 0.938 | 0.057 [0.054, 0.060] | 0.069 | 17 | 16 | 0.385 | |
| Threshold | 1656.264 | 362 | <0.001 | 0.932 | 0.934 | 0.059 [0.056, 0.062] | 0.07 | 2390.9 | 43 | <0.001 | |
| Emotional | Baseline | 63.169 | 42 | 0.964 | 0.999 | 0.998 | 0.022 [0.009, 0.033] | 0.015 | -- | -- | -- |
| Loading | 77.636 | 48 | 0.004 | 0.998 | 0.998 | 0.025 [0.014, 0.034] | 0.015 | 120.22 | 6 | 0.057 | |
| Threshold | 479.446 | 79 | <0.001 | 0.977 | 0.981 | 0.070 [0.064, 0.077] | 0.044 | 3540.8 | 31 | <0.001 | |
| Cognitive | Baseline | 12.914 | 18 | 0.797 | 10 | 10 | 0.000 [0.000, 0.018] | 0.006 | -- | -- | -- |
| Loading | 17.947 | 22 | 0.709 | 10 | 10 | 0.000 [0.000, 0.020] | 0.006 | 40.226 | 4 | 0.376 | |
| Threshold | 287.322 | 44 | <0.001 | 0.99 | 0.992 | 0.074 [0.066, 0.082] | 0.033 | 2390.6 | 22 | <0.001 | |
| Somatic | Emotional | Cognitive | Total | |
|---|---|---|---|---|
| Fixed Effects (Reference Group) | β (SE) † | Β (SE) † | Β (SE) † | Β (SE) † |
| Intercept | 7.76 (1.67) *** | 3.96 (1.03) *** | 3.47 (0.89) *** | 13.24 (3.27) *** |
| Time point Linear | −0.79 (0.17) *** | −0.22 (0.11) * | −0.006 (0.09) | −1.03 (0.31) ** |
| Time point Quadratic | 0.26 (0.20) | 0.20 (0.11) | 0.21 (0.09) * | 0.52 (0.33) |
| Age in years | 0.002 (0.01) | −0.006 (0.01) | 0.004 (0.01) | −0.01 (0.04) |
| Education in years | −0.04 (0.04) | −0.04 (0.03) | −0.02 (0.02) | −0.09 (0.09) |
| Sex (Male) | −2.55 (1.10) * | −1.57 (0.72) | −0.77 (0.58) | −4.60 (2.20) * |
| Sex: Age | 0.01 (0.02) | 0.01 (0.01) | 0.005 (0.01) | 0.03 (0.04) |
| Marital State (Single) | 0.003 (0.42) | −0.26 (0.25) * | 0.08 (0.22) | −0.39 (0.84) |
| Severity (GCS + CT)—Linear | −0.65 (0.81) | −0.05 (0.48) | 0.74 (0.46) | 0.67 (1.57) |
| Severity (GCS + CT)—Quadratic | −0.02 (0.85) | −0.25 (0.52) | 0.53 (0.49) | 0.08 (1.99) |
| Severity (GCS + CT)—Cubic | −0.006 (0.76) | 0.16 (0.43) | 0.39 (0.45) | 0.80 (1.61) |
| Injury cause (Fall) | −1.04 (0.40) * | −1.10 (0.25) *** | −0.74 (0.22) ** | −3.07 (0.85) *** |
| Injury cause (Violent/other) | −0.01 (0.64) | −0.04 (0.38) | −0.43 (0.32) | −0.64 (1.17) |
| Admission type (ICU) | 1.62 (0.55) ** | 0.94 (0.33) ** | 0.69 (0.31) * | 3.50 (1.07) ** |
| Total ISS | −0.03 (0.34) | 0.27 (0.25) | 0.03 (0.19) | 0.15 (0.73) |
| Previous concussions (yes) | 0.50 (0.62) | 0.39 (0.39) | 0.87 (0.32) * | 2.42 (1.23) * |
| Prior psychiatric problems (yes) | 2.90 (0.61) *** | 1.80(0.38) *** | 1.56 (0.34) *** | 6.02 (1.25) *** |
Publisher’s Note: MDPI stays neutral with regard to jurisdictional claims in published maps and institutional affiliations. |
© 2022 by the authors. Licensee MDPI, Basel, Switzerland. This article is an open access article distributed under the terms and conditions of the Creative Commons Attribution (CC BY) license (https://creativecommons.org/licenses/by/4.0/).
Share and Cite
Rivera, D.; Greving, S.; Arango-Lasprilla, J.C.; von Steinbuechel, N.; Zeldovich, M.; CENTER-TBI Participants and Investigators. Comparability of (Post-Concussion) Symptoms across Time in Individuals after Traumatic Brain Injury: Results from the CENTER-TBI Study. J. Clin. Med. 2022, 11, 4090. https://doi.org/10.3390/jcm11144090
Rivera D, Greving S, Arango-Lasprilla JC, von Steinbuechel N, Zeldovich M, CENTER-TBI Participants and Investigators. Comparability of (Post-Concussion) Symptoms across Time in Individuals after Traumatic Brain Injury: Results from the CENTER-TBI Study. Journal of Clinical Medicine. 2022; 11(14):4090. https://doi.org/10.3390/jcm11144090
Chicago/Turabian StyleRivera, Diego, Sven Greving, Juan Carlos Arango-Lasprilla, Nicole von Steinbuechel, Marina Zeldovich, and CENTER-TBI Participants and Investigators. 2022. "Comparability of (Post-Concussion) Symptoms across Time in Individuals after Traumatic Brain Injury: Results from the CENTER-TBI Study" Journal of Clinical Medicine 11, no. 14: 4090. https://doi.org/10.3390/jcm11144090
APA StyleRivera, D., Greving, S., Arango-Lasprilla, J. C., von Steinbuechel, N., Zeldovich, M., & CENTER-TBI Participants and Investigators. (2022). Comparability of (Post-Concussion) Symptoms across Time in Individuals after Traumatic Brain Injury: Results from the CENTER-TBI Study. Journal of Clinical Medicine, 11(14), 4090. https://doi.org/10.3390/jcm11144090