
Moderating Effect of the Lean Tissue Index on the Relationship between the Trabecular Bone Score and Augmentation Index in Dialysis Naïve Patients with Stage 5 Chronic Kidney Disease

 , ,
, ,
Abstract
:1. Introduction
2. Materials and Methods
2.1. Patients and Data Collection
2.2. Bone Mineral Density, Body Composition, and Vascular Stiffness Assessment
2.3. Statistical Analysis
3. Results
3.1. Characteristics of the Study Patients
3.2. Correlation of Laboratory Parameters with TBS, LTI, and cAIx75
3.3. Hierarchical Moderated Regression Analyses
4. Discussion
5. Conclusions
Author Contributions
Funding
Institutional Review Board Statement
Informed Consent Statement
Conflicts of Interest
References
- Thompson, S.; James, M.; Wiebe, N.; Hemnnelgarn, B.; Manns, B.; Klarenbach, S.; Tone, M.; Alberta Kidney Disease Network. Cause of death in patients with reduced kidney function. J. Am. Soc. Nephrol. 2015, 26, 2504–2511. [Google Scholar] [CrossRef] [PubMed]
- Moe, S.M.; Nickolas, T.L. Fractures in patients with CKD: Time for action. Clin. J. Am. Soc. Nephrol. 2016, 11, 1929–1931. [Google Scholar] [CrossRef] [Green Version]
- Zanoli, L.; Lentini, P.; Briet, M.; Castellino, P.; House, A.A.; London, G.M.; Malatino, L.; McCullough, P.A.; Mikhailidis, D.P.; Boutouyrie, P. Arterial stiffness in the heart disease of CKD. J. Am. Soc. Nephrol. 2019, 30, 918–928. [Google Scholar] [CrossRef]
- Jablonski, K.L.; Chonchol, M. Vascular calcification in end-stage renal disease. Hemodial. Int. 2013, 17 (Suppl. S1), S17–S21. [Google Scholar] [CrossRef] [PubMed] [Green Version]
- Lioufas, N.; Hawley, C.M.; Cameron, J.D.; Toussaint, N.D. Chronic kidney disease and pulse wave velocity: A narrative review. Int. J. Hypertens. 2019, 2019, 9189362. [Google Scholar] [CrossRef] [PubMed] [Green Version]
- Blacher, J.; Guerin, A.P.; Pannier, B.; Marchais, S.J.; London, G.M. Arterial calcifications, arterial stiffness, and cardiovascular risk in end-stage renal disease. Hypertension 2001, 38, 938–942. [Google Scholar] [CrossRef] [PubMed] [Green Version]
- Bellasi, A.; Di Lullo, L.; Russo, D.; Ciarcia, R.; Magnocavallo, M.; Lavalle, C.; Ratti, C.; Cozzolino, M.; Di Iorio, B.R. Vascular calcification progression modulates the risk associated with vascular calcification burden in incident to dialysis patients. Cells 2021, 10, 1091. [Google Scholar] [CrossRef]
- Hyder, J.A.; Allison, M.A.; Wong, N.; Papa, A.; Lang, T.F.; Sirlin, C.; Gapstur, S.M.; Ouyang, P.; Carr, J.J.; Criqui, M.H. Association of coronary artery and aortic calcium with lumbar bone density: The MESA Abdominal Aortic Calcium Study. Am. J. Epidemiol. 2009, 169, 186–194. [Google Scholar] [CrossRef] [PubMed] [Green Version]
- Kiel, D.P.; Kauppila, L.I.; Cupples, L.A.; Hannan, M.T.; O’Donnell, C.J.; Wilson, P.W. Bone loss and the progression of abdominal aortic calcification over a 25 year period: The framingham heart study. Calcif. Tissue Int. 2001, 68, 271–276. [Google Scholar] [CrossRef]
- Qu, X.; Huang, X.; Jin, F.; Wang, H.; Hao, Y.; Tang, T.; Dai, K. Bone mineral density and all-cause, cardiovascular and stroke mortality: A meta-analysis of prospective cohort studies. Int. J. Cardiol. 2013, 166, 385–393. [Google Scholar] [CrossRef] [PubMed]
- London, G.M.; Marchais, S.J.; Guerin, A.P.; Boutouyrie, P.; Metivier, F.; de Vernejoul, M.C. Association of bone activity, calcium load, aortic stiffness, and calcifications in ESRD. J. Am. Soc. Nephrol. 2008, 19, 1827–1835. [Google Scholar] [CrossRef] [Green Version]
- Aoki, A.; Kojima, F.; Uchida, K.; Tanaka, Y.; Nitta, K. Associations between vascular calcification, arterial stiffness and bone mineral density in chronic hemodialysis patients. Geriatr. Gerontol. Int. 2009, 9, 246–252. [Google Scholar] [CrossRef] [PubMed]
- Matsubara, K.; Suliman, M.E.; Qureshi, A.R.; Axelsson, J.; Martola, L.; Heimburger, O.; Barany, P.; Stenvinkel, P.; Lindholm, B. Bone mineral density in end-stage renal disease patients: Association with wasting, cardiovascular disease and mortality. Blood Purif. 2008, 26, 284–290. [Google Scholar] [CrossRef] [PubMed]
- Iseri, K.; Qureshi, A.R.; Dai, L.; Ripsweden, J.; Heimburger, O.; Barany, P.; Bergstrom, I.; Stenvinkel, P.; Brismar, T.B.; Lindholm, B. Bone mineral density at different sites and 5 years mortality in end-stage renal disease patients: A cohort study. Bone 2020, 130, 115075. [Google Scholar] [CrossRef]
- Ochi, M.; Kohara, K.; Tabara, Y.; Kido, T.; Uetani, E.; Ochi, N.; Igase, M.; Miki, T. Arterial stiffness is associated with low thigh muscle mass in middle-aged to elderly men. Atherosclerosis 2010, 212, 327–332. [Google Scholar] [CrossRef]
- Wohlfahrt, P.; Somers, V.K.; Sochor, O.; Kullo, I.; Jean, N.; Lopez-Jimenez, F. Influence of body fatness distribution and total lean mass on aortic stiffness in nonobese individuals. Am. J. Hypertens. 2015, 28, 401–408. [Google Scholar] [CrossRef] [PubMed] [Green Version]
- Wilkinson, T.J.; Miksza, J.; Yates, T.; Lightfoot, C.J.; Baker, L.A.; Watson, E.L.; Zaccardi, F.; Smith, A.C. Association of sarcopenia with mortality and end-stage renal disease in those with chronic kidney disease: A UK biobank study. J. Cachexia Sarcopenia Muscle 2021, 12, 586–598. [Google Scholar] [CrossRef] [PubMed]
- Pickering, M.E. Cross-talks between the cardiovascular disease-sarcopenia-osteoporosis triad and magnesium in humans. Int. J. Mol. Sci. 2021, 22, 9102. [Google Scholar] [CrossRef] [PubMed]
- Rodriguez, A.J.; Scott, D.; Ebeling, P.R. Exploring the links between common diseases of ageing—Osteoporosis, sarcopenia and vascular calcification. Clin. Rev. Bone Miner. Metab. 2019, 17, 1–23. [Google Scholar] [CrossRef]
- Kim, K.; Song, S.H.; Kim, I.J.; Jeon, Y.K. Is dual-energy absorptiometry accurate in the assessment of bone status of patients with chronic kidney disease? Osteoporos. Int. 2021, 32, 1859–1868. [Google Scholar] [CrossRef] [PubMed]
- Han, B.G.; Han, J.; Lee, K.H. Association of impedance ratio with corrected geriatric nutritional risk index in older patients with nondialysis chronic kidney disease stage 5. JPEN J. Parenter Enter. Nutr. 2022, 46, 93–103. [Google Scholar] [CrossRef] [PubMed]
- Tomiyama, H.; Yamazaki, M.; Sagawa, Y.; Teraoka, K.; Shirota, T.; Miyawaki, Y.; Yamashina, A. Synergistic effect of smoking and blood pressure on augmentation index in men, but not in women. Hypertens. Res. 2009, 32, 122–126. [Google Scholar] [CrossRef] [PubMed]
- Hak, A.E.; Pols, H.A.P.; van Hemert, A.M.; Hofman, A.; Witteman, J.C.M. Progression of aortic calcification is associated with metacarpal bone loss during menopause: A population-based longitudinal study. Arterioscler. Thromb. Vasc. Biol. 2000, 20, 1926–1931. [Google Scholar] [CrossRef] [Green Version]
- Toussain, N.D.; Lau, K.K.; Strauss, B.J.; Polkinghorne, K.R.; Kerr, P.G. Associations between vascular calcification, arterial stiffness and bone mineral density in chronic kidney disease. Nephrol. Dial. Transplant. 2008, 23, 586–593. [Google Scholar] [CrossRef]
- Chen, Y.; Zhao, X.; Wu, H. Arterial stiffness: A focus on vascular calcification and its link to bone mineralization. Arterioscler. Thromb. Vasc. Biol. 2020, 40, 1078–1093. [Google Scholar] [CrossRef] [PubMed]
- Pazianas, M.; Miller, P.D. Osteoporosis and chronic kidney disease-mineral and bone disorder (CKD-MBD): Back to basics. Am. J. Kidney Dis. 2021, 78, 582–589. [Google Scholar] [CrossRef]
- Nelson, A.J.; Raggi, P.; Wolf, M.; Gold, A.M.; Chertow, G.M.; Roe, M.T. Targeting vascular calcification in chronic kidney disease. JACC Basic Transl. Sci. 2020, 5, 398–412. [Google Scholar] [CrossRef]
- London, G.M.; Blacher, J.; Pannier, B.; Guerin, A.P.; Marchais, S.J.; Safar, M.E. Arterial wave reflections and survival in end-stage renal failure. Hypertension 2001, 38, 434–438. [Google Scholar] [CrossRef] [PubMed] [Green Version]
- Jaalkhorol, M.; Fujita, Y.; Kouda, K.; Tannaki, J.; Komatsu, M.; DongMei, N.; Sato, Y.; Tachiki, T.; Yura, A.; Kajita, E.; et al. Low bone mineral density is associated with an elevated risk of developing increased arterial stiffness: A 10-year follow-up of Japanese women from the Japanese Population-based Osteoporosis (JPOS) cohort study. Maturitas 2019, 119, 39–45. [Google Scholar] [CrossRef] [PubMed]
- Raggi, P.; Bellasi, A.; Ferramosca, E.; Block, G.A.; Muntner, P. Pulse wave velocity is inversely related to vertebral bone density in hemodialysis patients. Hypertension 2007, 49, 1278–1284. [Google Scholar] [CrossRef] [PubMed] [Green Version]
- Aleksova, J.; Kurniawan, S.; Elder, G.J. The trabecular bone score is associated with bone mineral density, markers of bone turnover and prevalent fracture in patients with end stage kidney disease. Osteoporos. Int. 2018, 29, 1447–1455. [Google Scholar] [CrossRef] [PubMed]
- Costa, L.R.; Carvalho, A.B.; Bittencourt, A.L.; Rochitte, C.E.; Canziani, M.E.F. Cortical unlike trabecular bone loss is not associated with vascular calcification progression in CKD patients. BMC Nephrol. 2020, 21, 121. [Google Scholar] [CrossRef] [PubMed] [Green Version]
- Li, S.; Wagner, R.; Holm, K.; Lehotsky, J.; Zinaman, M.J. Relationship between soft tissue body composition and bone mass in perimenopausal women. Maturitas 2004, 47, 99–105. [Google Scholar] [CrossRef]
- Douchi, T.; Yamamoto, S.; Oki, T.; Maruta, K.; Kuwahata, R.; Yamasaki, H.; Nagata, Y. Difference in the effect of adiposity on bone density between pre- and postmenopausal women. Maturitas 2000, 34, 261–266. [Google Scholar] [CrossRef]
- Kim, Y.S.; Han, J.J.; Lee, J.; Choi, H.S.; Kim, J.H.; Lee, T. The correlation between bone mineral density/trabecular bone score and body mass index, height, and weight. Osteoporos. Sarcopenia 2017, 3, 98–103. [Google Scholar] [CrossRef] [PubMed]
- Leslie, W.D.; Krieg, M.-A.; Hans, D. Clinical factors associated with trabecular bone score. J. Clin. Densitom. 2013, 16, 374–379. [Google Scholar] [CrossRef]
- Shayganfar, A.; Farrokhi, M.; Shayganfar, S.; Ebrahimian, S. Associations between bone mineral density, trabecular bone score, and body mass index in postmenopausal females. Osteoporos. Sarcopenia 2020, 6, 111–114. [Google Scholar] [CrossRef]
- Brotto, M.; Bonewald, L. Bone and muscle: Interactions beyond mechanical. Bone 2015, 80, 109–114. [Google Scholar] [CrossRef] [Green Version]
- Montenegro, J.; Klein, M.R.S.T.; Bregman, R.; Prado, C.M.; Barreto Silva, M.I. Osteosarcopenia in patients with non-dialysis dependent chronic kidney disease. Clin. Nutr. 2022, 41, 1218–1227. [Google Scholar] [CrossRef]
- Ohnaka, S.; Yamada, S.; Tsujikawa, H.; Arase, H.; Taniguchi, M.; Tokumoto, M.; Tsuruya, K.; Nakano, T.; Kitazono, T. Association of normalized protein catabolic rate (nPCR) with the risk of bone fracture in patients undergoing maintenance hemodialysis: The Q-Chort Study. Clin. Nutr. 2021, 40, 997–1004. [Google Scholar] [CrossRef]
- Haarhaus, M.; Evenepoel, P. Differentiating the causes of adynamic bone in advanced chronic kidney disease informs osteoporosis treatment. Kidney Int. 2021, 100, 546–558. [Google Scholar] [CrossRef] [PubMed]
- Rizzoli, R.; Ammann, P.; Chevalley, T.; Bonjour, J.P. Protein intake and bone disorders in the elderly. Jt. Bone Spine 2001, 68, 383–392. [Google Scholar] [CrossRef]

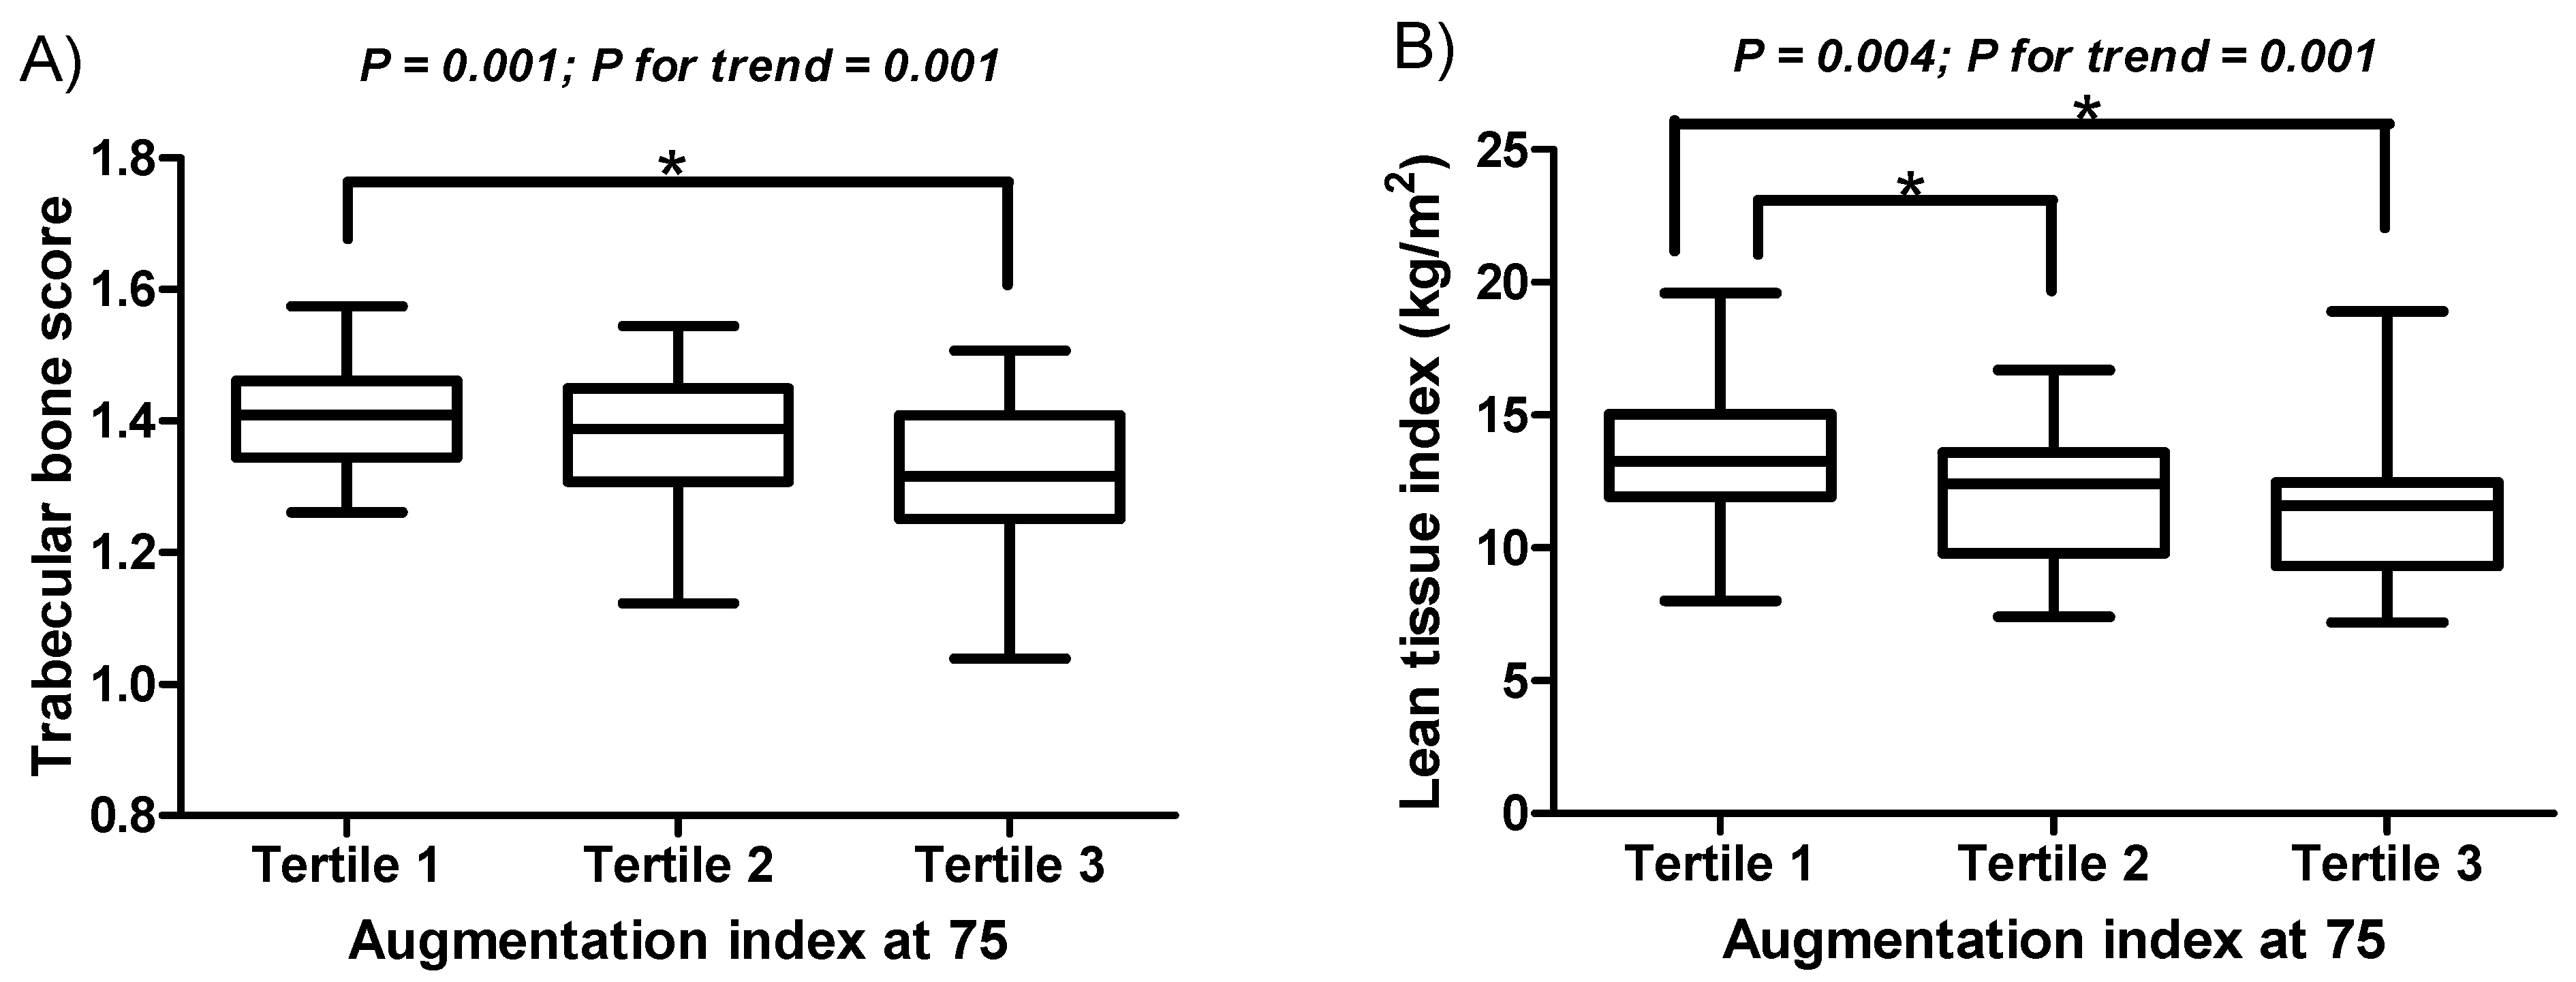
| Variables | Total (n = 117) | Augmentation Index at 75 | p-Value | ||
|---|---|---|---|---|---|
| Tertile 1 (n = 40) | Tertile 2 (n = 39) | Tertile 3 (n = 38) | |||
| Augmentation index at 75, % | 76.68 ± 14.37 | 62.03 ± 7.82 | 76.03 ± 3.23 a | 92.76 ± 8.61 b c | <0.001 |
| Age, years | 59.38 ± 14.00 | 56.08 ± 13.65 | 59.49 ± 15.27 | 62.76 ± 12.44 | 0.107 |
| Sex | |||||
| Male | 63 (53.8%) | 30 (47.6%) | 23 (36.5%) | 10 (15.9%) | <0.001 |
| Female | 54 (46.2%) | 10 (18.5%) | 16 (29.6%) | 28 (51.9%) | |
| Diabetes | |||||
| Yes | 75 (64.1%) | 24 (32.0%) | 28 (37.3%) | 23 (30.7%) | 0.471 |
| No | 42 (35.9%) | 16 (38.1%) | 11 (26.2%) | 15 (35.7%) | |
| TBS, Lumbar spine | 1.37 ± 0.11 | 1.41 ± 0.09 | 1.37 ± 0.11 | 1.32 ± 0.12 b | 0.001 |
| FN-BMD, g/cm2 | 0.64 ± 0.14 | 0.68 ± 0.13 | 0.66 ± 0.13 | 0.59 ± 0.14 b | 0.010 |
| FN-BMD T-score | −1.62 ± 1.16 | −1.34 ± 1.02 | −1.47 ± 1.13 | −2.05 ± 1.24 b | 0.018 |
| LS-BMD, g/cm2 | 0.96 ± 0.18 | 1.00 ± 0.17 | 0.98 ± 0.16 | 0.89 ± 0.19 b | 0.014 |
| LS-BMD T-score | −0.51 ± 1.48 | −0.16 ± 1.42 | −0.35 ± 1.31 | −1.03 ± 1.59 b | 0.023 |
| cBMI, kg/m2 | 24.03 ± 4.15 | 23.50 ± 3.52 | 24.77 ± 4.41 | 23.83 ± 4.47 | 0.371 |
| Height, cm | 161.7 ± 8.61 | 165.1 ± 8.04 | 163.3 ± 8.51 | 156.4 ± 6.74 b c | <0.001 |
| LTI, kg/m2 | 12.28 ± 2.57 | 13.33 ± 2.37 | 11.96 ± 2.36 a | 11.49 ± 2.64 b | 0.004 |
| FTI, kg/m2 | 11.57 ± 4.76 | 10.03 ± 4.07 | 12.62 ± 4.97 a | 12.11 ± 4.93 | 0.036 |
| hs-CRP, mg/dL | 0.71 ± 2.04 | 1.13 ± 3.22 | 0.60 ± 1.24 | 0.40 ± 0.57 | 0.272 |
| iPTH, pg/mL | 348.8 ± 272.2 | 339.9 ± 257.7 | 340.8 ±164.7 | 366.4 ±365.9 | 0.891 |
| Vitamin D3, ng/mL | 15.57 ± 10.11 | 17.09 ± 12.50 | 14.25 ± 7.45 | 15.34 ± 9.71 | 0.456 |
| Total Cholesterol, mg/dL | 139.03 ± 42.72 | 135.70 ± 51.38 | 137.05 ± 37.20 | 144.55 ± 38.34 | 0.622 |
| Triglyceride, mg/dL | 135.60 ± 67.35 | 129.50 ± 59.40 | 128.41 ± 58.68 | 149.39 ± 81.69 | 0.309 |
| ALP, U/L | 82.85 ± 37.74 | 76.55 ± 26.35 | 87.92 ± 37.33 | 84.26 ± 47.23 | 0.395 |
| Calcium, mg/dL | 7.65 ± 1.07 | 7.69 ± 1.02 | 7.60 ± 1.17 | 7.66 ± 1.03 | 0.931 |
| Phosphate, mg/dL | 6.06 ± 1.70 | 5.95 ± 1.77 | 6.02 ± 1.54 | 6.23 ± 1.81 | 0.756 |
| eGFR, mL/min/1.73 m2 | 6.50 ± 2.33 | 6.70 ± 2.29 | 6.71 ± 2.35 | 6.08 ± 2.36 | 0.401 |
| Variables | Augmentation Index at 75 | Trabecular Bone Score, Lumbar Spine (L1–L4) | Lean Tissue Index | |||
|---|---|---|---|---|---|---|
| Correlation Coefficient | p-Value | Correlation Coefficient | p-Value | Correlation Coefficient | p-Value | |
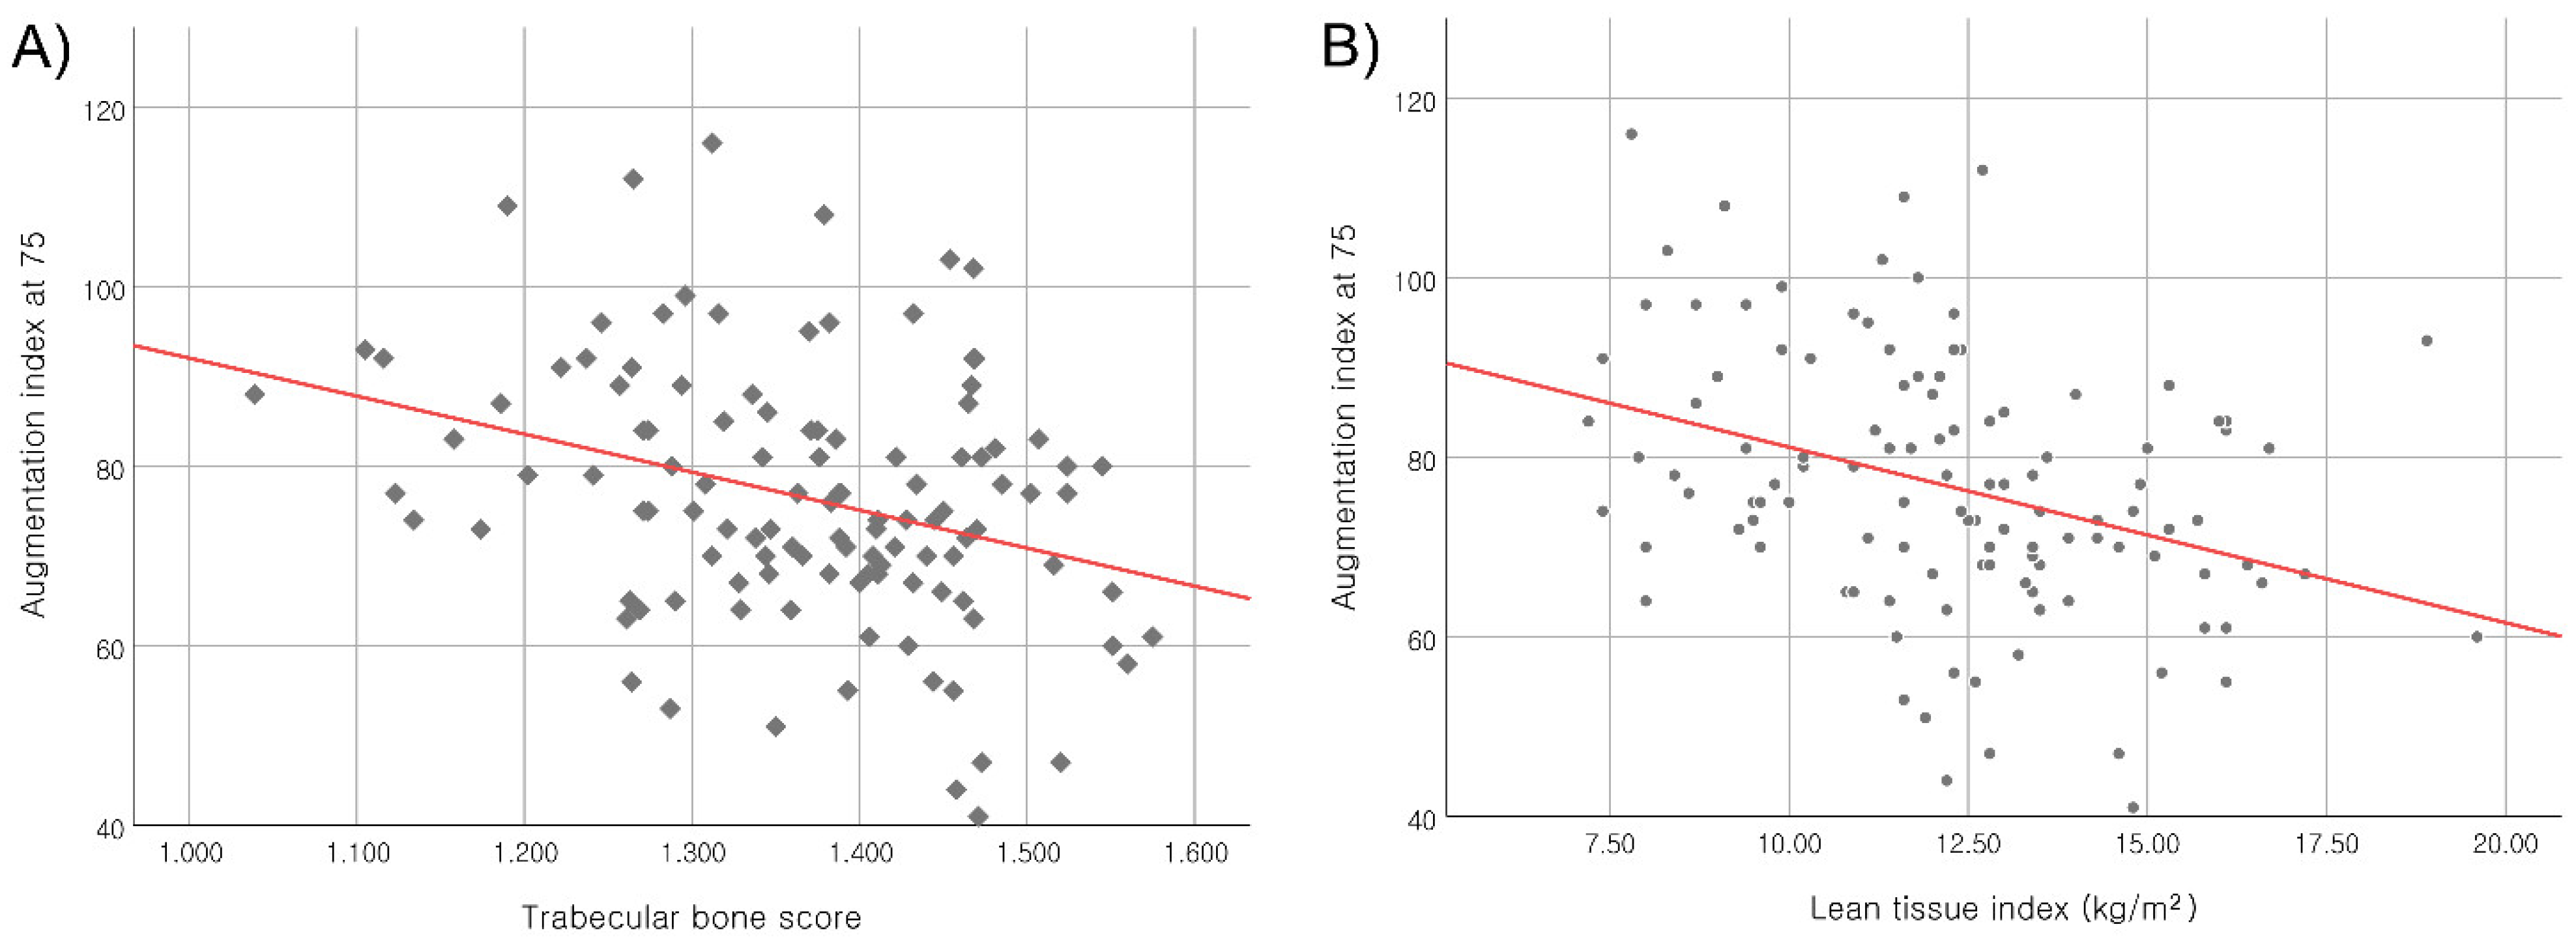
| Age, years | 0.212 | 0.022 | 0.369 | <0.001 | −0.029 | 0.759 |
| cBMI, kg/m2 | −0.023 | 0.802 | −0.305 | 0.001 | 0.055 | 0.556 |
| Height, cm | −0.454 | <0.001 | 0.574 | <0.001 | 0.452 | <0.001 |
| hs-CRP, mg/dL | −0.084 | 0.372 | 0.129 | 0.128 | 0.142 | 0.096 |
| iPTH, pg/mL | 0.109 | 0.242 | 0.084 | 0.326 | 0.145 | 0.088 |
| Vitamin D3, ng/mL | −0.098 | 0.296 | −0.022 | 0.795 | −0.020 | 0.812 |
| Total Cholesterol, mg/dL | 0.052 | 0.579 | −0.010 | 0.029 | 0.048 | 0.572 |
| Triglyceride, mg/dL | 0.102 | 0.276 | −0.135 | 0.114 | −0.158 | 0.065 |
| Alkaline phosphatase, U/L | 0.035 | 0.707 | −0.019 | 0.824 | −0.024 | 0.778 |
| Calcium, mg/dL | 0.021 | 0.824 | 0.024 | 0.778 | 0.112 | 0.190 |
| Phosphate, mg/dL | −0.020 | 0.831 | 0.133 | 0.119 | 0.145 | 0.019 |
| eGFR, mL/min/1.73 m2 | −0.053 | 0.569 | 0.023 | 0.788 | 0.050 | 0.561 |
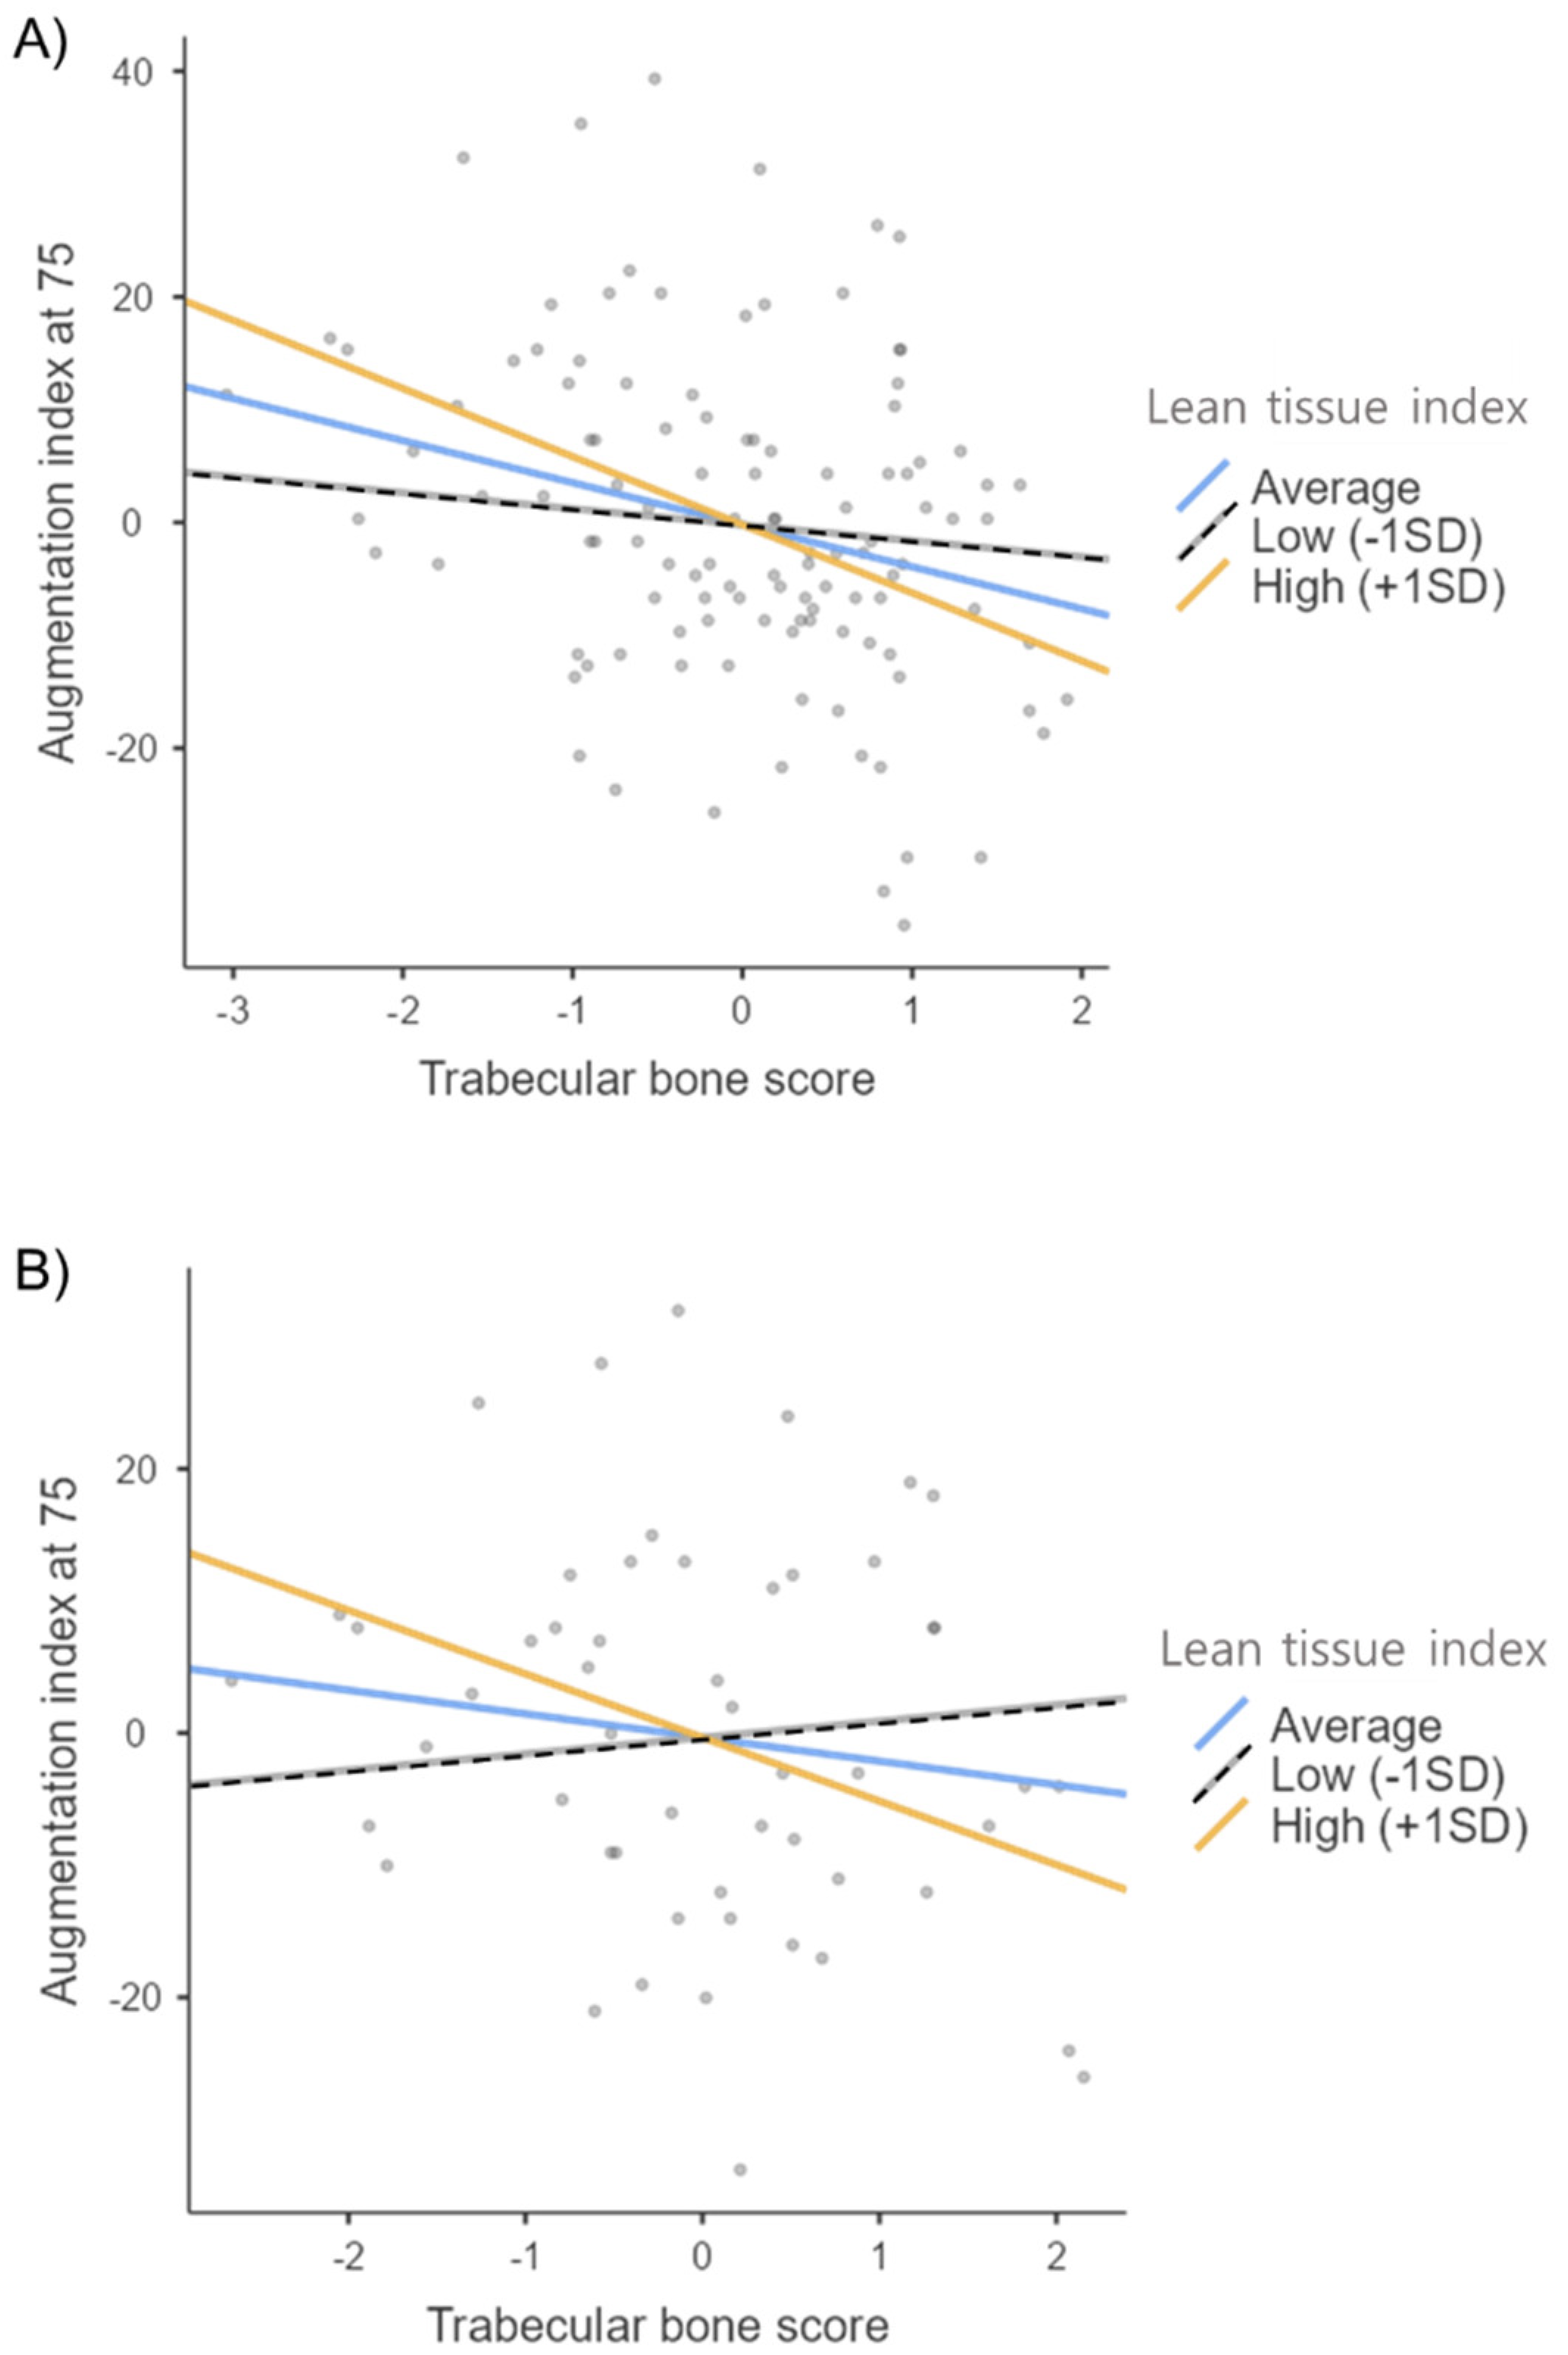
| Predictor | Augmentation Index at 75 | ||||
|---|---|---|---|---|---|
| Adjusted R2 | B | SE | Beta | p-Value | |
| Demographics | 0.259 | ||||
| Age | 3.308 | 1.251 | 0.232 | 0.009 | |
| Sex | 9.818 | 2.867 | 0.344 | 0.001 | |
| Main effects | |||||
| TBS | 0.260 | −1.310 | 1.303 | −0.092 | 0.317 |
| LTI | 0.263 | −2.228 | 1.379 | −0.157 | 0.109 |
| Interaction | |||||
| TBS × LTI | 0.287 | −2.461 | 1.120 | −0.181 | 0.030 |
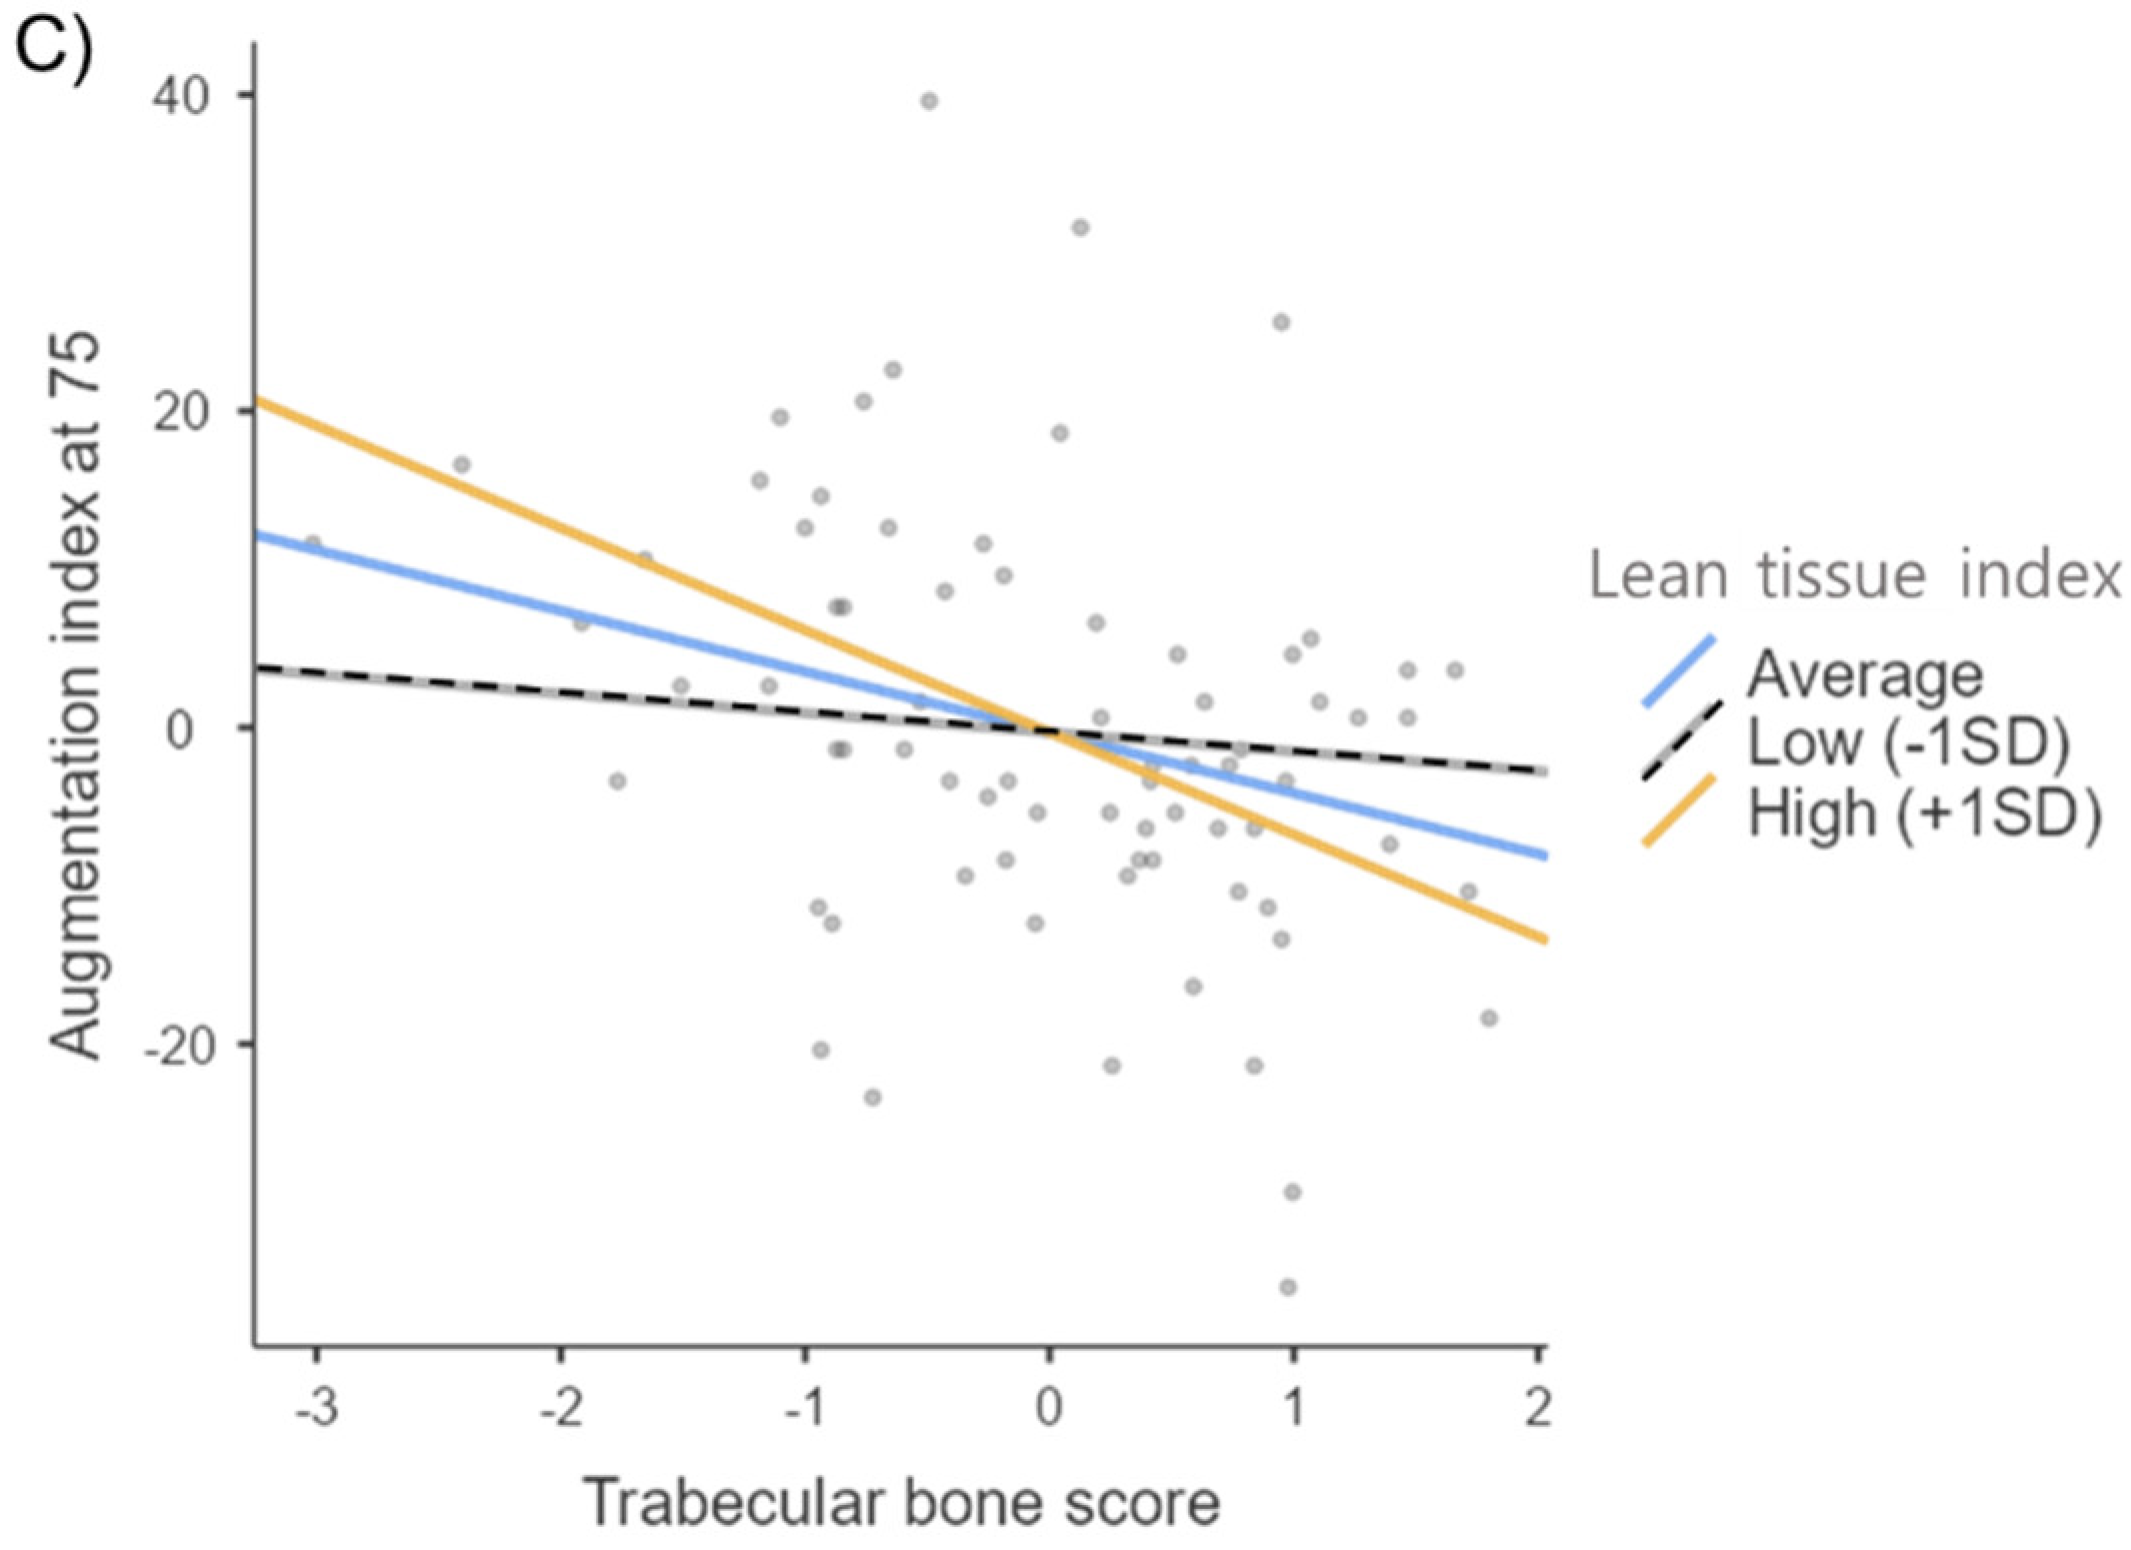
| Subgroup | Predictor | Augmentation Index at 75 | ||||
|---|---|---|---|---|---|---|
| Adjusted R2 | B | SE | Beta | p-Value | ||
| Men | Demographics | |||||
| Age | 0.091 | 4.477 | 1.561 | 0.363 | 0.006 | |
| Main effects | ||||||
| TBS | 0.088 | 0.033 | 1.953 | 0.002 | 0.987 | |
| LTI | 0.087 | −0.753 | 1.677 | −0.057 | 0.655 | |
| Interaction | ||||||
| TBS × LTI | 0.111 | −3.417 | 2.110 | −0.229 | 0.111 | |
| Women | Demographics | |||||
| Age | 0.026 | 1.832 | 2.029 | 0.143 | 0.371 | |
| Main effects | ||||||
| TBS | 0.019 | −3.089 | 2.116 | −0.238 | 0.151 | |
| LTI | 0.014 | −5.336 | 2.825 | −0.311 | 0.065 | |
| Interaction | ||||||
| TBS × LTI | 0.073 | −3.738 | 1.845 | −0.347 | 0.048 | |
| Subgroup | Predictor | Augmentation Index at 75 | ||||
|---|---|---|---|---|---|---|
| Adjusted R2 | B | SE | Beta | p-Value | ||
| Patients without diabetes | Demographics | 0.099 | ||||
| Age | 3.119 | 2.400 | 0.244 | 0.202 | ||
| Sex | 6.098 | 8.050 | 0.193 | 0.454 | ||
| Main effects | ||||||
| TBS | 0.076 | −1.787 | 3.423 | −0.113 | 0.605 | |
| LTI | 0.053 | −0.792 | 3.928 | −0.050 | 0.841 | |
| Interaction | ||||||
| TBS × LTI | 0.069 | −3.480 | 2.703 | −0.215 | 0.206 | |
| Patients with diabetes | Demographics | 0.378 | ||||
| Age | 3.450 | 1.481 | 0.217 | 0.023 | ||
| Sex | 11.486 | 2.899 | 0.421 | <0.001 | ||
| Main effects | ||||||
| TBS | 0.385 | −1.709 | 1.297 | −0.128 | 0.192 | |
| LTI | 0.404 | −3.309 | 1.397 | −0.249 | 0.021 | |
| Interaction | ||||||
| TBS × LTI | 0.431 | −2.436 | 1.178 | −0.196 | 0.042 | |
Publisher’s Note: MDPI stays neutral with regard to jurisdictional claims in published maps and institutional affiliations. |
© 2022 by the authors. Licensee MDPI, Basel, Switzerland. This article is an open access article distributed under the terms and conditions of the Creative Commons Attribution (CC BY) license (https://creativecommons.org/licenses/by/4.0/).
Share and Cite
Han, B.-G.; Pak, D.; Lee, J.Y.; Kim, J.-S.; Yang, J.-W.; Kwon, K.-Y. Moderating Effect of the Lean Tissue Index on the Relationship between the Trabecular Bone Score and Augmentation Index in Dialysis Naïve Patients with Stage 5 Chronic Kidney Disease. J. Clin. Med. 2022, 11, 3897. https://doi.org/10.3390/jcm11133897
Han B-G, Pak D, Lee JY, Kim J-S, Yang J-W, Kwon K-Y. Moderating Effect of the Lean Tissue Index on the Relationship between the Trabecular Bone Score and Augmentation Index in Dialysis Naïve Patients with Stage 5 Chronic Kidney Disease. Journal of Clinical Medicine. 2022; 11(13):3897. https://doi.org/10.3390/jcm11133897
Chicago/Turabian StyleHan, Byoung-Geun, Daewoo Pak, Jun Young Lee, Jae-Seok Kim, Jae-Won Yang, and Ki-Youn Kwon. 2022. "Moderating Effect of the Lean Tissue Index on the Relationship between the Trabecular Bone Score and Augmentation Index in Dialysis Naïve Patients with Stage 5 Chronic Kidney Disease" Journal of Clinical Medicine 11, no. 13: 3897. https://doi.org/10.3390/jcm11133897
APA StyleHan, B.-G., Pak, D., Lee, J. Y., Kim, J.-S., Yang, J.-W., & Kwon, K.-Y. (2022). Moderating Effect of the Lean Tissue Index on the Relationship between the Trabecular Bone Score and Augmentation Index in Dialysis Naïve Patients with Stage 5 Chronic Kidney Disease. Journal of Clinical Medicine, 11(13), 3897. https://doi.org/10.3390/jcm11133897