
Effects of Obesity, Blood Pressure, and Blood Metabolic Biomarkers on Grey Matter Brain Healthcare Quotient: A Large Cohort Study of a Magnetic Resonance Imaging Brain Screening System in Japan

 , , and
Abstract
:1. Introduction
2. Materials and Methods
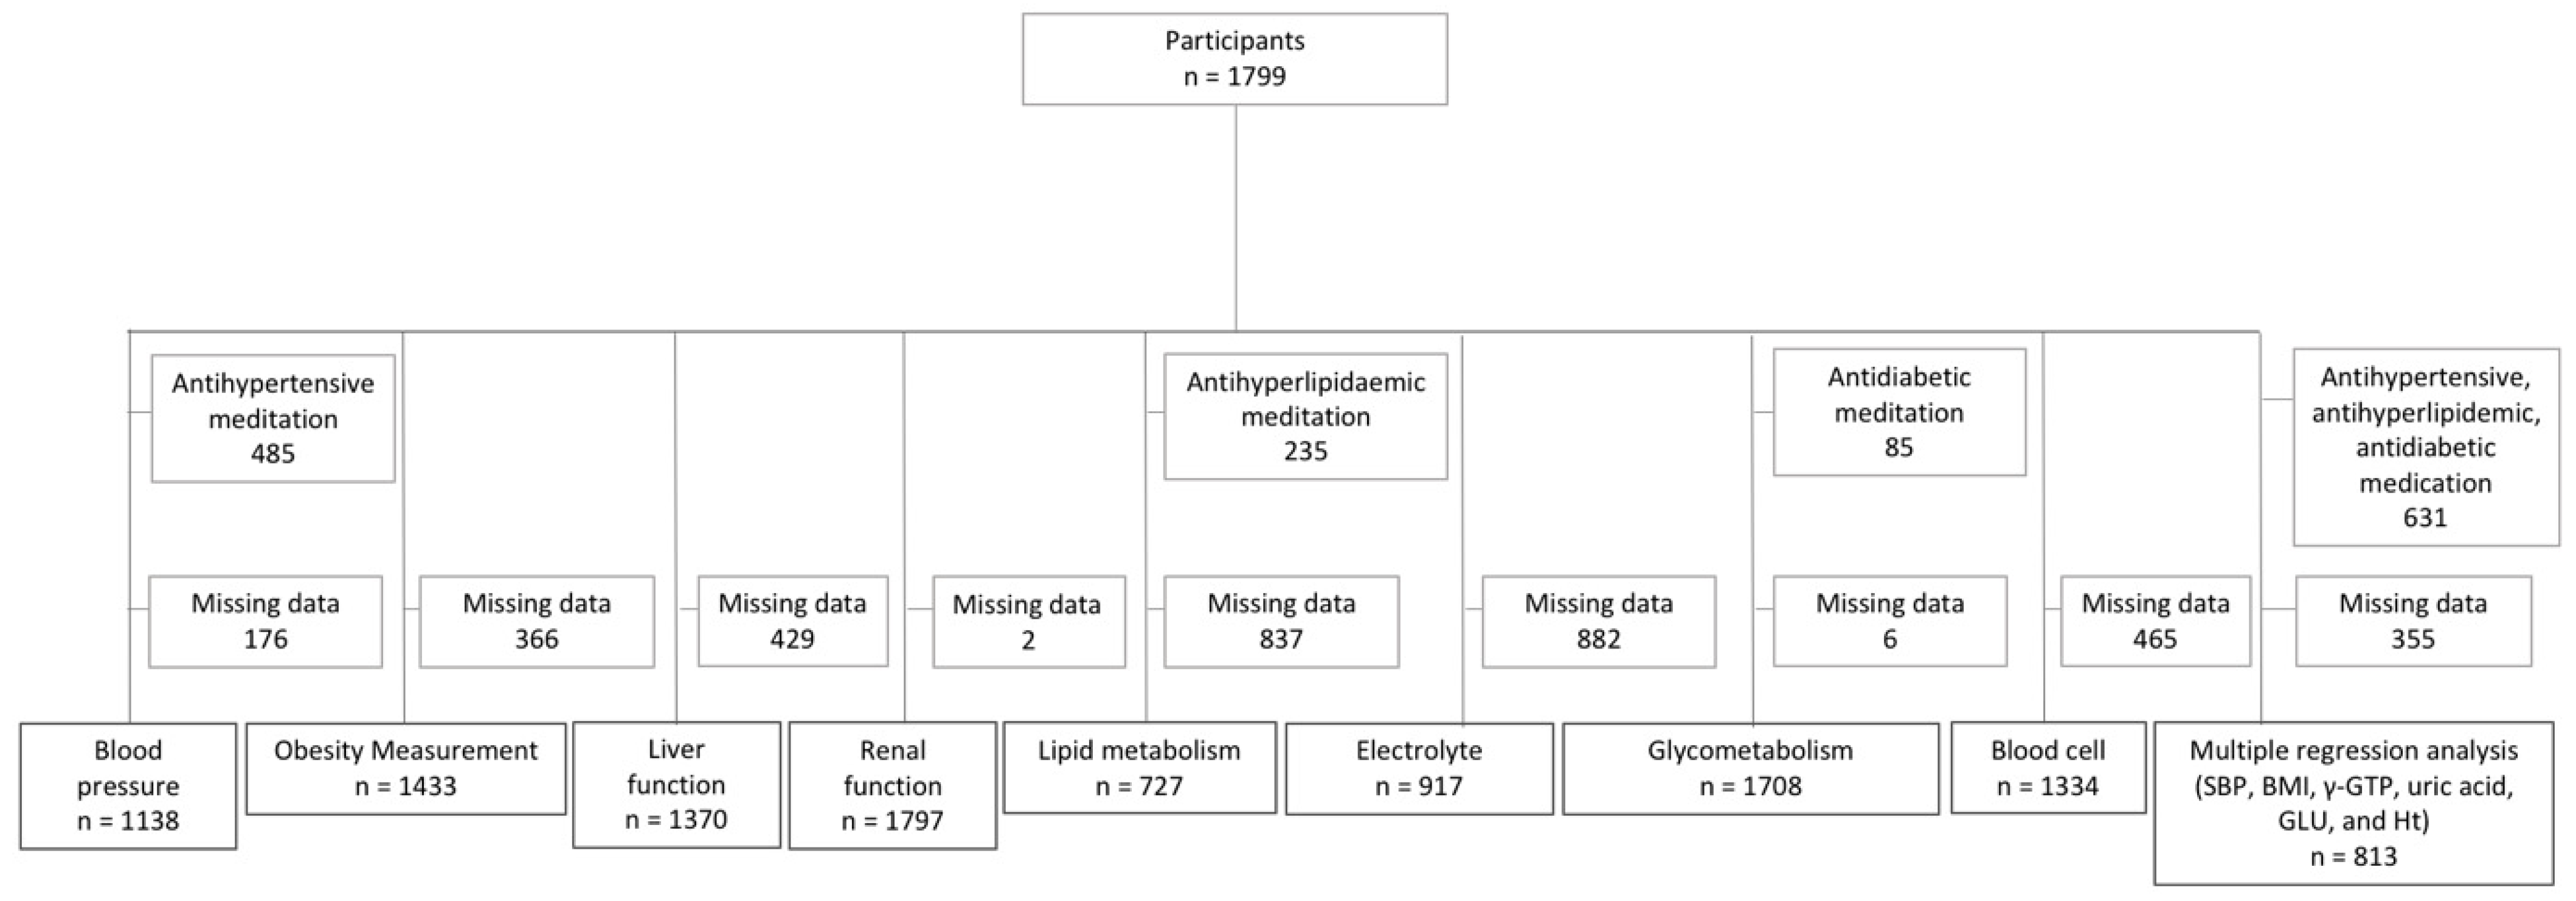
2.1. Participants
2.2. Data Collection
2.3. MRI
2.4. Image Processing for Brain Volume
2.5. Statistical Analyses
2.6. Data Availability
3. Results
3.1. Data of Participants
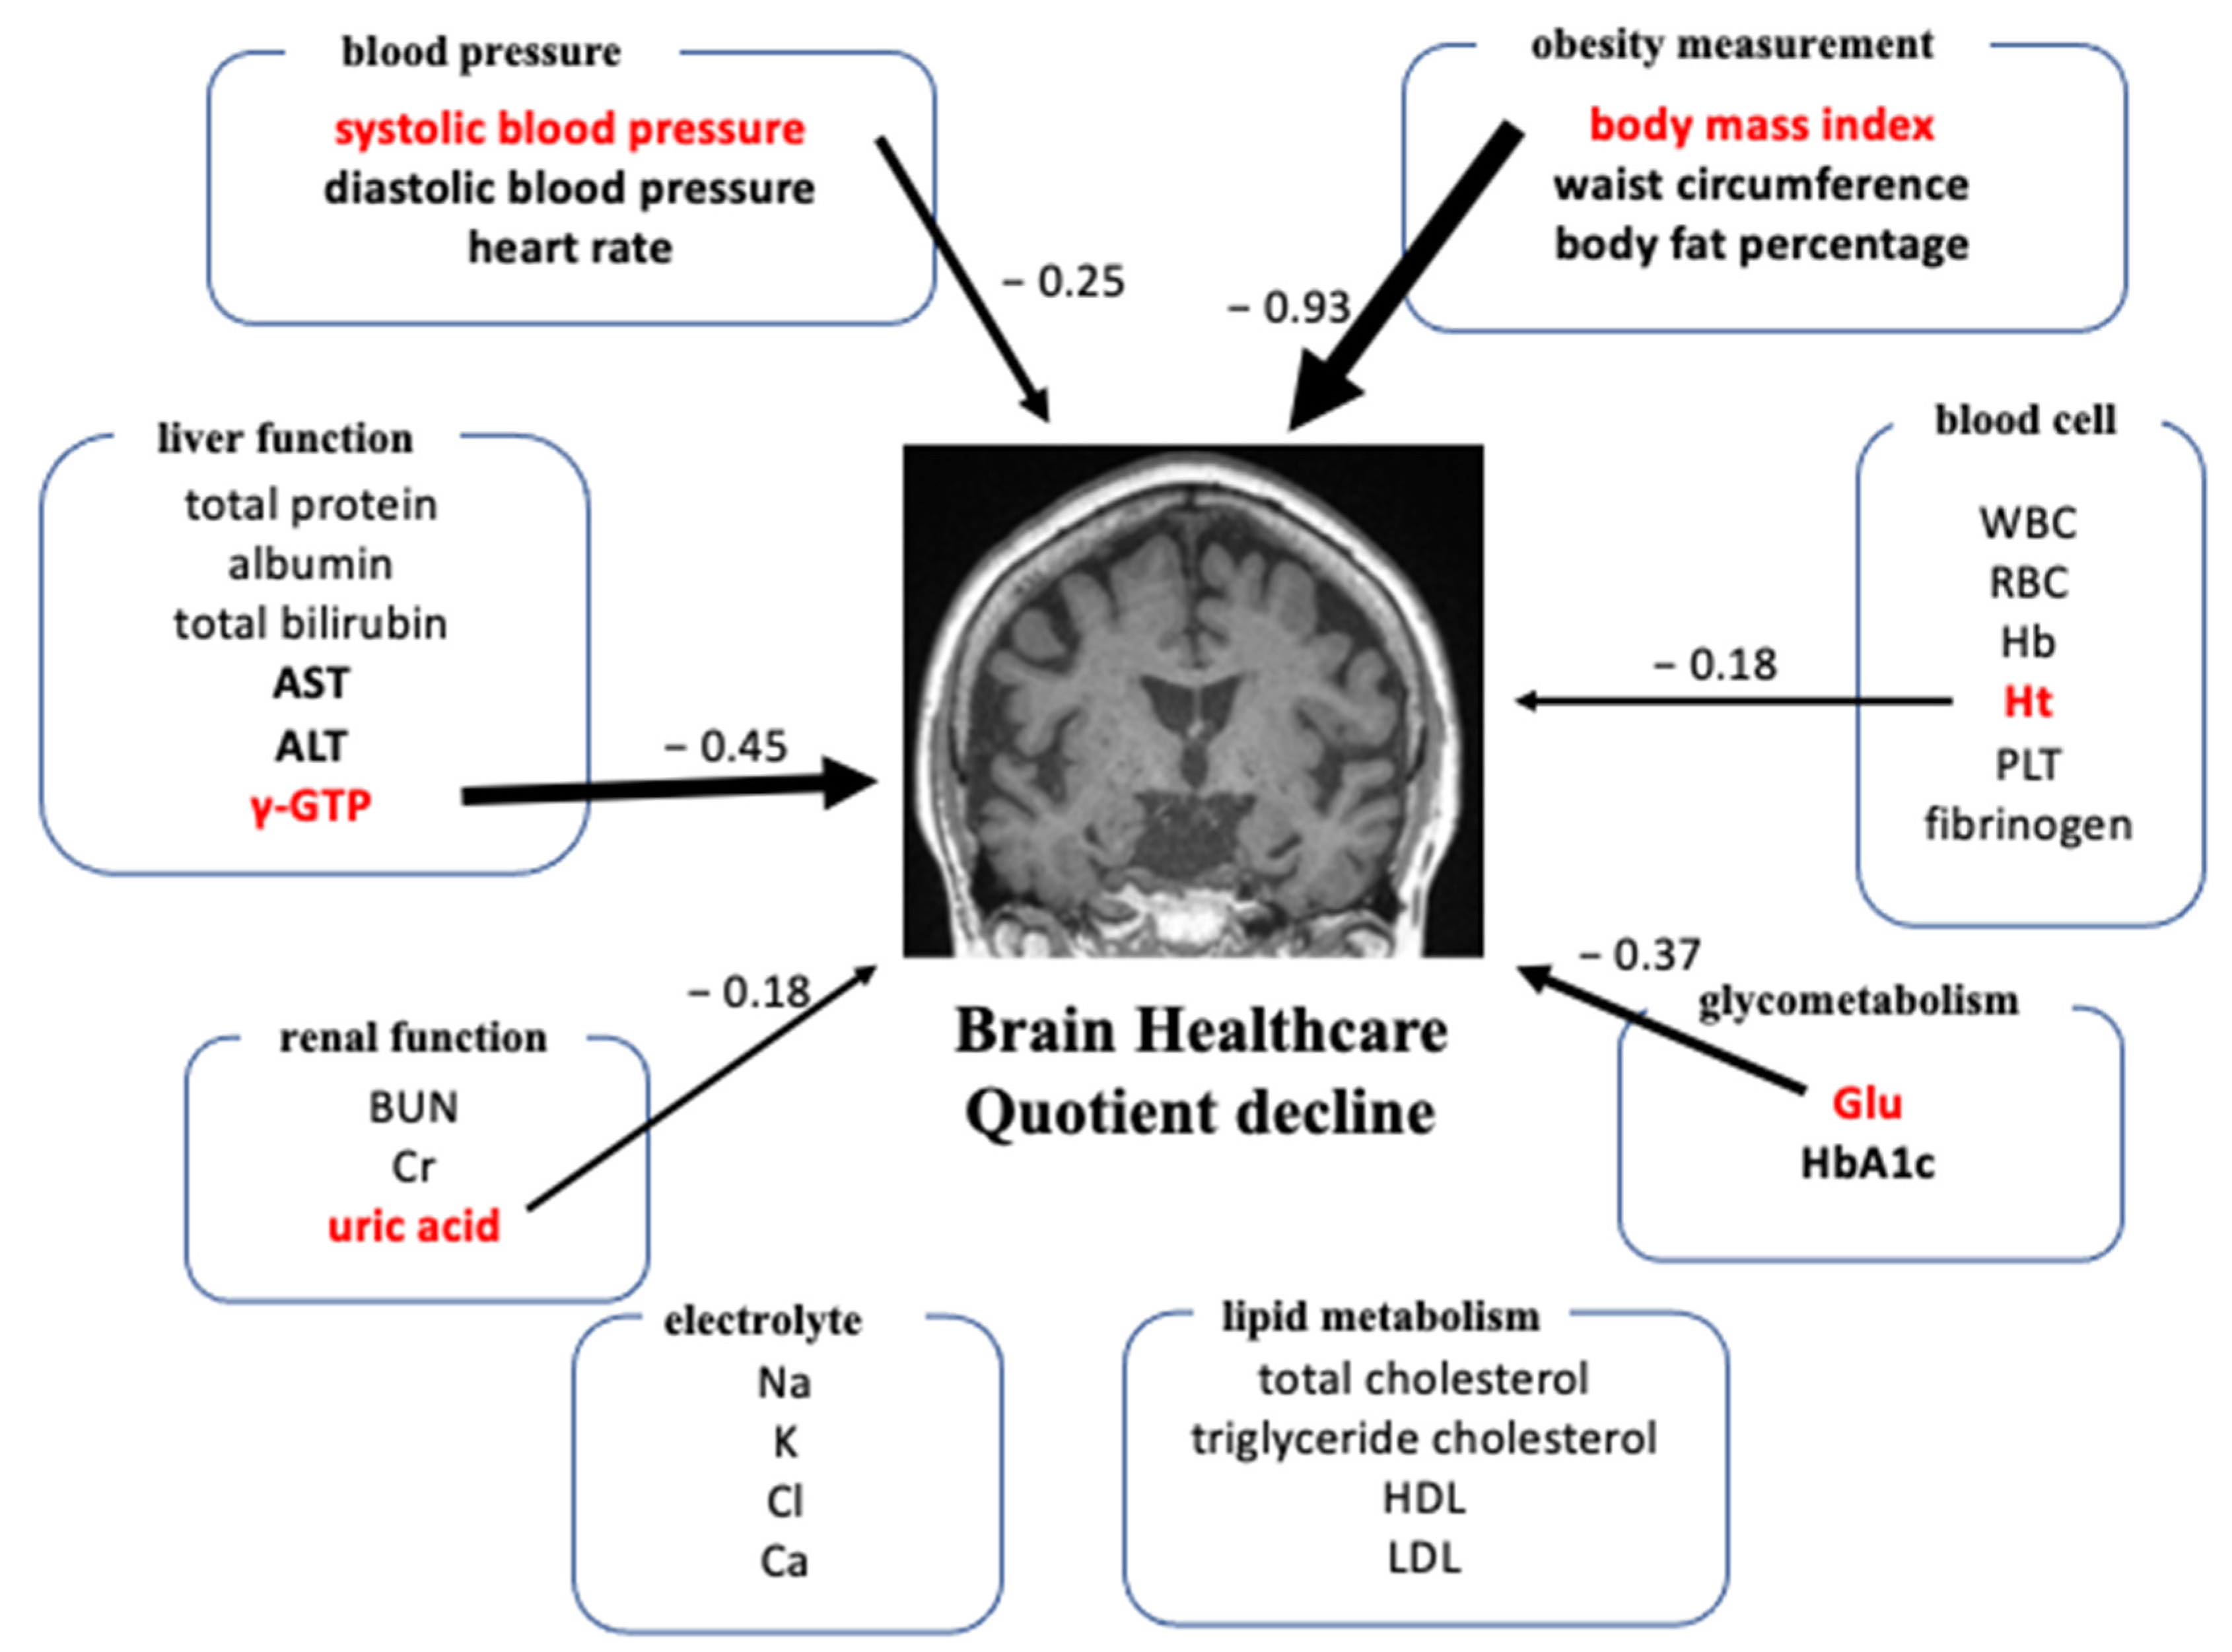
3.2. Partial Correlation Analysis
3.3. Multiple Regression Analysis
4. Discussion
Supplementary Materials
Author Contributions
Funding
Institutional Review Board Statement
Informed Consent Statement
Data Availability Statement
Conflicts of Interest
References
- Mendis, S.B.; Raymont, V.; Tabet, N. Bilingualism: A Global Public Health Strategy for Healthy Cognitive Aging. Front. Neurol. 2021, 12, 628368. [Google Scholar] [CrossRef] [PubMed]
- Hedman, A.M.; van Haren, N.E.; Schnack, H.G.; Kahn, R.S.; Hulshoff Pol, H.E. Human brain changes across the life span: A review of 56 longitudinal magnetic resonance imaging studies. Hum. Brain Mapp. 2012, 33, 1987–2002. [Google Scholar] [CrossRef] [PubMed]
- Neth, B.J.; Graff-Radford, J.; Mielke, M.M.; Przybelski, S.A.; Lesnick, T.G.; Schwarz, C.G.; Reid, R.I.; Senjem, M.L.; Lowe, V.J.; Machulda, M.M.; et al. Relationship Between Risk Factors and Brain Reserve in Late Middle Age: Implications for Cognitive Aging. Front. Aging Neurosci. 2019, 11, 355. [Google Scholar] [CrossRef] [PubMed]
- Taki, Y.; Kinomura, S.; Sato, K.; Inoue, K.; Goto, R.; Okada, K.; Uchida, S.; Kawashima, R.; Fukuda, H. Relationship between body mass index and gray matter volume in 1428 healthy individuals. Obesity 2008, 16, 119–124. [Google Scholar] [CrossRef] [PubMed]
- Raji, C.A.; Ho, A.J.; Parikshak, N.N.; Becker, J.T.; Lopez, O.L.; Kuller, L.H.; Hua, X.; Leow, A.D.; Toga, A.W.; Thompson, P.M. Brain structure and obesity. Hum. Brain Mapp. 2010, 31, 353–364. [Google Scholar] [CrossRef]
- Dekkers, I.A.; Jansen, P.R.; Lamb, H.J. Obesity, Brain Volume, and White Matter Microstructure at MRI: A Cross-sectional UK Biobank Study. Radiology 2019, 291, 763–771. [Google Scholar] [CrossRef]
- Wiseman, R.M.; Saxby, B.K.; Burton, E.J.; Barber, R.; Ford, G.A.; O’Brien, J.T. Hippocampal atrophy, whole brain volume, and white matter lesions in older hypertensive subjects. Neurology 2004, 63, 1892–1897. [Google Scholar] [CrossRef]
- Firbank, M.J.; Wiseman, R.M.; Burton, E.J.; Saxby, B.K.; O’Brien, J.T.; Ford, G.A. Brain atrophy and white matter hyperintensity change in older adults and relationship to blood pressure. Brain atrophy, WMH change and blood pressure. J. Neurol. 2007, 254, 713–721. [Google Scholar] [CrossRef]
- Maillard, P.; Seshadri, S.; Beiser, A.; Himali, J.J.; Au, R.; Fletcher, E.; Carmichael, O.; Wolf, P.A.; DeCarli, C. Effects of systolic blood pressure on white-matter integrity in young adults in the Framingham Heart Study: A cross-sectional study. Lancet Neurol. 2012, 11, 1039–1047. [Google Scholar] [CrossRef] [Green Version]
- Cox, S.R.; Lyall, D.M.; Ritchie, S.J.; Bastin, M.E.; Harris, M.A.; Buchanan, C.R.; Fawns-Ritchie, C.; Barbu, M.C.; de Nooij, L.; Reus, L.M.; et al. Associations between vascular risk factors and brain MRI indices in UK Biobank. Eur. Heart J. 2019, 40, 2290–2300. [Google Scholar] [CrossRef] [Green Version]
- Nemoto, K.; Oka, H.; Fukuda, H.; Yamakawa, Y. MRI-based Brain Healthcare Quotients: A bridge between neural and behavioral analyses for keeping the brain healthy. PLoS ONE 2017, 12, e0187137. [Google Scholar] [CrossRef] [PubMed] [Green Version]
- Kokubun, K.; Nemoto, K.; Oka, H.; Fukuda, H.; Yamakawa, Y.; Watanabe, Y. Association of Fatigue and Stress With Gray Matter Volume. Front. Behav. Neurosci. 2018, 12, 154. [Google Scholar] [CrossRef] [PubMed] [Green Version]
- Kokubun, K.; Yamakawa, Y. Association Between Food Patterns and Gray Matter Volume. Front. Hum. Neurosci. 2019, 13, 384. [Google Scholar] [CrossRef]
- Watanabe, K.; Kakeda, S.; Nemoto, K.; Onoda, K.; Yamaguchi, S.; Kobayashi, S.; Yamakawa, Y. Grey-matter brain healthcare quotient and cognitive function: A large cohort study of an MRI brain screening system in Japan. Cortex 2021, 145, 97–104. [Google Scholar] [CrossRef] [PubMed]
- Morita, A. Value of Brain Dock (Brain Screening) System in Japan. World Neurosurg. 2019, 127, 502. [Google Scholar] [CrossRef]
- Ashburner, J. A fast diffeomorphic image registration algorithm. Neuroimage 2007, 38, 95–113. [Google Scholar] [CrossRef]
- Ashburner, J. SPM: A history. Neuroimage 2012, 62, 791–800. [Google Scholar] [CrossRef] [Green Version]
- Ashburner, J. Computational anatomy with the SPM software. Magn. Reson. Imaging 2009, 27, 1163–1174. [Google Scholar] [CrossRef]
- Tzourio-Mazoyer, N.; Landeau, B.; Papathanassiou, D.; Crivello, F.; Etard, O.; Delcroix, N.; Mazoyer, B.; Joliot, M. Automated anatomical labeling of activations in SPM using a macroscopic anatomical parcellation of the MNI MRI single-subject brain. Neuroimage 2002, 15, 273–289. [Google Scholar] [CrossRef]
- Bhanji, F.; Topjian, A.A.; Nadkarni, V.M.; Praestgaard, A.H.; Hunt, E.A.; Cheng, A.; Meaney, P.A.; Berg, R.A. Survival Rates Following Pediatric In-Hospital Cardiac Arrests During Nights and Weekends. JAMA Pediatr. 2017, 171, 39–45. [Google Scholar] [CrossRef]
- Wormser, D.; Kaptoge, S.; Di Angelantonio, E.; Wood, A.M.; Pennells, L.; Thompson, A.; Sarwar, N.; Kizer, J.R.; Lawlor, D.A.; Nordestgaard, B.G.; et al. Separate and combined associations of body-mass index and abdominal adiposity with cardiovascular disease: Collaborative analysis of 58 prospective studies. Lancet 2011, 377, 1085–1095. [Google Scholar] [CrossRef] [PubMed] [Green Version]
- Gunstad, J.; Paul, R.H.; Cohen, R.A.; Tate, D.F.; Spitznagel, M.B.; Gordon, E. Elevated body mass index is associated with executive dysfunction in otherwise healthy adults. Compr. Psychiatry 2007, 48, 57–61. [Google Scholar] [CrossRef] [PubMed]
- Razay, G.; Vreugdenhil, A. Obesity in middle age and future risk of dementia: Midlife obesity increases risk of future dementia. BMJ 2005, 331, 455. [Google Scholar] [CrossRef] [PubMed] [Green Version]
- Parimisetty, A.; Dorsemans, A.C.; Awada, R.; Ravanan, P.; Diotel, N.; Lefebvre d’Hellencourt, C. Secret talk between adipose tissue and central nervous system via secreted factors-an emerging frontier in the neurodegenerative research. J. Neuroinflamm. 2016, 13, 67. [Google Scholar] [CrossRef] [PubMed] [Green Version]
- Guillemot-Legris, O.; Muccioli, G.G. Obesity-Induced Neuroinflammation: Beyond the Hypothalamus. Trends Neurosci. 2017, 40, 237–253. [Google Scholar] [CrossRef]
- Pflanz, C.P.; Tozer, D.J.; Harshfield, E.L.; Tay, J.; Farooqi, S.; Markus, H.S. Central obesity is selectively associated with cerebral gray matter atrophy in 15,634 subjects in the UK Biobank. Int. J. Obes. 2022, 46, 1059–1067. [Google Scholar] [CrossRef]
- Chen, E.Y.; Eickhoff, S.B.; Giovannetti, T.; Smith, D.V. Obesity is associated with reduced orbitofrontal cortex volume: A coordinate-based meta-analysis. Neuroimage Clin. 2020, 28, 102420. [Google Scholar] [CrossRef]
- Rolls, E.T.; Grabenhorst, F. The orbitofrontal cortex and beyond: From affect to decision-making. Prog. Neurobiol. 2008, 86, 216–244. [Google Scholar] [CrossRef]
- Clarke, R.E.; Verdejo-Garcia, A.; Andrews, Z.B. The role of corticostriatal-hypothalamic neural circuits in feeding behaviour: Implications for obesity. J. Neurochem. 2018, 147, 715–729. [Google Scholar] [CrossRef] [Green Version]
- Fang, F.; Zhan, Y.F.; Zhuo, Y.Y.; Yin, D.Z.; Li, K.A.; Wang, Y.F. Brain atrophy in middle-aged subjects with Type 2 diabetes mellitus, with and without microvascular complications. J. Diabetes 2018, 10, 625–632. [Google Scholar] [CrossRef] [Green Version]
- Luchsinger, J.A.; Tang, M.X.; Shea, S.; Mayeux, R. Hyperinsulinemia and risk of Alzheimer disease. Neurology 2004, 63, 1187–1192. [Google Scholar] [CrossRef] [PubMed]
- Sundermann, E.E.; Thomas, K.R.; Bangen, K.J.; Weigand, A.J.; Eppig, J.S.; Edmonds, E.C.; Wong, C.G.; Bondi, M.W.; Delano-Wood, L. Prediabetes Is Associated With Brain Hypometabolism and Cognitive Decline in a Sex-Dependent Manner: A Longitudinal Study of Nondemented Older Adults. Front. Neurol. 2021, 12, 551975. [Google Scholar] [CrossRef] [PubMed]
- Enzinger, C.; Fazekas, F.; Matthews, P.M.; Ropele, S.; Schmidt, H.; Smith, S.; Schmidt, R. Risk factors for progression of brain atrophy in aging: Six-year follow-up of normal subjects. Neurology 2005, 64, 1704–1711. [Google Scholar] [CrossRef]
- Ridker, P.M. LDL cholesterol: Controversies and future therapeutic directions. Lancet 2014, 384, 607–617. [Google Scholar] [CrossRef]
- Shibata, D.; Suchy-Dicey, A.; Carty, C.L.; Madhyastha, T.; Ali, T.; Best, L.; Grabowski, T.J., Jr.; Longstreth, W.T., Jr.; Buchwald, D. Vascular Risk Factors and Findings on Brain MRI of Elderly Adult American Indians: The Strong Heart Study. Neuroepidemiology 2019, 52, 173–180. [Google Scholar] [CrossRef]
- de Leeuw, F.A.; Karamujić-Čomić, H.; Tijms, B.M.; Peeters, C.F.W.; Kester, M.I.; Scheltens, P.; Ahmad, S.; Vojinovic, D.; Adams, H.H.H.; Hankemeier, T.; et al. Circulating metabolites are associated with brain atrophy and white matter hyperintensities. Alzheimer’s Dement. J. Alzheimer’s Assoc. 2021, 17, 205–214. [Google Scholar] [CrossRef]
- Camont, L.; Chapman, M.J.; Kontush, A. Biological activities of HDL subpopulations and their relevance to cardiovascular disease. Trends Mol. Med. 2011, 17, 594–603. [Google Scholar] [CrossRef]
- Bühler, M.; Mann, K. Alcohol and the human brain: A systematic review of different neuroimaging methods. Alcohol. Clin. Exp. Res. 2011, 35, 1771–1793. [Google Scholar] [CrossRef]
- Moselhy, H.F.; Georgiou, G.; Kahn, A. Frontal lobe changes in alcoholism: A review of the literature. Alcohol Alcohol. (Oxf. Oxfs.) 2001, 36, 357–368. [Google Scholar] [CrossRef] [Green Version]
- Topiwala, A.; Allan, C.L.; Valkanova, V.; Zsoldos, E.; Filippini, N.; Sexton, C.; Mahmood, A.; Fooks, P.; Singh-Manoux, A.; Mackay, C.E.; et al. Moderate alcohol consumption as risk factor for adverse brain outcomes and cognitive decline: Longitudinal cohort study. BMJ (Clin. Res. Ed.) 2017, 357, j2353. [Google Scholar] [CrossRef] [Green Version]
- Sasaki, H.; Abe, O.; Yamasue, H.; Fukuda, R.; Yamada, H.; Takei, K.; Suga, M.; Takao, H.; Kasai, K.; Aoki, S.; et al. Structural and diffusional brain abnormality related to relatively low level alcohol consumption. Neuroimage 2009, 46, 505–510. [Google Scholar] [CrossRef] [PubMed]
- Sinforiani, E.; Zucchella, C.; Pasotti, C.; Casoni, F.; Bini, P.; Costa, A. The effects of alcohol on cognition in the elderly: From protection to neurodegeneration. Funct. Neurol. 2011, 26, 103–106. [Google Scholar] [PubMed]
- Li, T.K.; Bosron, W.F. Genetic variability of enzymes of alcohol metabolism in human beings. Ann. Emerg. Med. 1986, 15, 997–1004. [Google Scholar] [CrossRef]


| Number of participants (female) | 1799 (770) |
| Age, mean ± SD | 62.0 ± 13.1 |
| Self-reported neurologic symptom | |
| Dizziness | 134 (69) |
| Headache | 390 (223) |
| Tinnitus | 330 (142) |
| Subjective cognitive decline | 930 (455) |
| None of the above | 588 (193) |
| No answer | 27 (11) |
| Small infarction | 218 (82) |
| Microhaemorrhage | 236 (92) |
| Both small infarction and microhaemorrhage | 67 (25) |
| Mini-Mental State Examination, mean ± SD | 28.5 ± 2.2 |
| Mean ± Standard Deviation (Range) | Partial Correlation | p | |
|---|---|---|---|
| Blood pressure | |||
| systolic blood pressure | 126.6 ± 16.8 (87–206) mmHg | −0.10 | 0.001 * |
| diastolic blood pressure | 73.4 ± 10.9 (45–128) mmHg | −0.06 | 0.03 |
| heart rate | 63.1 ± 10.5 (37–117) bpm | −0.09 | 0.004 |
| Obesity measurements | |||
| body mass index | 22.9 ± 3.2 (14.2–48.4) | −0.19 | <0.001 * |
| waist circumference | 82.6 ± 9.2 (55.5–127.6) cm | −0.07 | 0.009 |
| body fat percentage | 24.5 ± 6.4 (7.0–48.5) % | −0.13 | <0.001 * |
| Liver function | |||
| total protein | 7.4 ± 0.4 (6.2–10.1) g/dL | 0.00 | 0.921 |
| albumin | 4.4 ± 0.2 (3.4–5.5) g/dL | 0.01 | 0.758 |
| total bilirubin | 0.8 ± 0.3 (0.2–3.5) mg/dL | 0.01 | 0.672 |
| aspartate aminotransferase (AST) | 24.7 ± 11.5 (9–251) U/L | −0.11 | <0.001 * |
| alanine aminotransferase (ALT) | 23.2 ± 15.5 (3–215) U/L | −0.12 | <0.001 * |
| γ-glutamyltransferase (γ-GTP) | 41.0 ± 56.2 (7–1173) U/L | −0.13 | <0.001 * |
| Renal function | |||
| blood urea nitrogen (BUN) | 15.1 ± 4.0 (5.6–55.1) mg/dL | 0.00 | 0.984 |
| creatinine (Cr) | 0.8 ± 0.3 (0.4–8.7) mg/dL | −0.01 | 0.559 |
| uric acid | 5.3 ± 1.3 (0.7–11.1) mg/dL | −0.07 | 0.003 |
| Lipid metabolism | |||
| total cholesterol | 211.0 ± 54.3 (24–2013) mg/dL | 0.07 | 0.05 |
| triglyceride cholesterol | 109.9 ± 69.8 (28–924) mg/dL | −0.12 | 0.744 |
| high-density lipoprotein (HDL) | 64.4 ± 16.4 (30–155) mg/dL | −0.02 | 0.587 |
| low-density lipoprotein (LDL) | 120.0 ± 30.3 (15–236) mg/dL | 0.05 | 0.147 |
| Electrolytes | |||
| Na | 141.0 ± 1.8 (131–146) mEq/L | 0.02 | 0.644 |
| K | 4.1 ± 0.3 (2.6–5.3) mEq/L | −0.03 | 0.45 |
| Cl | 102.7 ± 2.4 (95–111) mEq/L | 0.00 | 0.979 |
| Ca | 9.4 ± 0.3 (7.6–11.0) mEq/L | 0.00 | 0.903 |
| Glycometabolism | |||
| fasting blood glucose (Glu) | 102.2 ± 19.3 (72–334) mg/dL | −0.12 | <0.001 * |
| haemoglobin A1c (HbA1c) | 5.6 ± 0.6 (3.7–10.9) % | −0.09 | <0.001 * |
| Blood cell values | |||
| white blood cell count (WBC) | 54.8 ± 14.6 (18.4–169.3) × 102/μL | 0.01 | 0.792 |
| red blood cell count (RBC) | 460.5 ± 43.9 (241–600) × 104/μL | −0.01 | 0.688 |
| haemoglobin (Hb) | 14.4 ± 1.4 (7.7–19.0) g/dL | −0.05 | 0.061 |
| haematocrit (Ht) | 42.3 ± 3.8 (24–55) % | −0.08 | 0.005 |
| platelet count (PLT) | 22.6 ± 6.1 (5–169) × 104/μL | 0.01 | 0.657 |
| fibrinogen | 288.0 ± 63.7 (140–630) mg/dL | 0.06 | 0.056 |
| b | Standard Error | Standardization Coefficient | t-Value | p | |
|---|---|---|---|---|---|
| Systolic blood pressure | −0.01 | 0.01 | −0.25 | −0.13 | 0.194 |
| Body mass index | −0.28 | 0.06 | −0.93 | −4.69 | <0.001 |
| γ-glutamyltransferase (γ-GTP) | −0.01 | 0 | −0.45 | −2.41 | 0.016 |
| Uric acid | −0.13 | 0.15 | −0.18 | −0.02 | 0.397 |
| Fasting blood glucose | −0.02 | 0.01 | −0.37 | −1.97 | 0.049 |
| Haematocrit | −0.01 | 0.05 | −0.18 | −0.847 | 0.901 |
Publisher’s Note: MDPI stays neutral with regard to jurisdictional claims in published maps and institutional affiliations. |
© 2022 by the authors. Licensee MDPI, Basel, Switzerland. This article is an open access article distributed under the terms and conditions of the Creative Commons Attribution (CC BY) license (https://creativecommons.org/licenses/by/4.0/).
Share and Cite
Watanabe, K.; Kakeda, S.; Nemoto, K.; Onoda, K.; Yamaguchi, S.; Kobayashi, S.; Yamakawa, Y. Effects of Obesity, Blood Pressure, and Blood Metabolic Biomarkers on Grey Matter Brain Healthcare Quotient: A Large Cohort Study of a Magnetic Resonance Imaging Brain Screening System in Japan. J. Clin. Med. 2022, 11, 2973. https://doi.org/10.3390/jcm11112973
Watanabe K, Kakeda S, Nemoto K, Onoda K, Yamaguchi S, Kobayashi S, Yamakawa Y. Effects of Obesity, Blood Pressure, and Blood Metabolic Biomarkers on Grey Matter Brain Healthcare Quotient: A Large Cohort Study of a Magnetic Resonance Imaging Brain Screening System in Japan. Journal of Clinical Medicine. 2022; 11(11):2973. https://doi.org/10.3390/jcm11112973
Chicago/Turabian StyleWatanabe, Keita, Shingo Kakeda, Kiyotaka Nemoto, Keiichi Onoda, Shuhei Yamaguchi, Shotai Kobayashi, and Yoshinori Yamakawa. 2022. "Effects of Obesity, Blood Pressure, and Blood Metabolic Biomarkers on Grey Matter Brain Healthcare Quotient: A Large Cohort Study of a Magnetic Resonance Imaging Brain Screening System in Japan" Journal of Clinical Medicine 11, no. 11: 2973. https://doi.org/10.3390/jcm11112973