
Association between Body Mass Index and Renal Outcomes Modified by Chronic Kidney Disease and Anemia: The Obesity Paradox for Renal Outcomes

 , , and
Abstract
:1. Introduction
2. Materials and Methods
2.1. Study Design and Participants
2.2. Collection of Demographic, Medical, and Laboratory Data
2.3. Outcomes
2.4. Statistical Analysis
3. Results
3.1. Baseline Characteristics Relating to Body Mass Index and Chronic Kidney Disease Stage
3.2. Multivariable Linear Regression for Body Mass Index
3.3. Association between Body Mass Index, Renal Outcomes, and Mortality in Relation to Chronic Kidney Disease Stage
3.4. Association between Body Mass Index, Renal Outcomes, and Mortality in Terms of Hemoglobin Levels
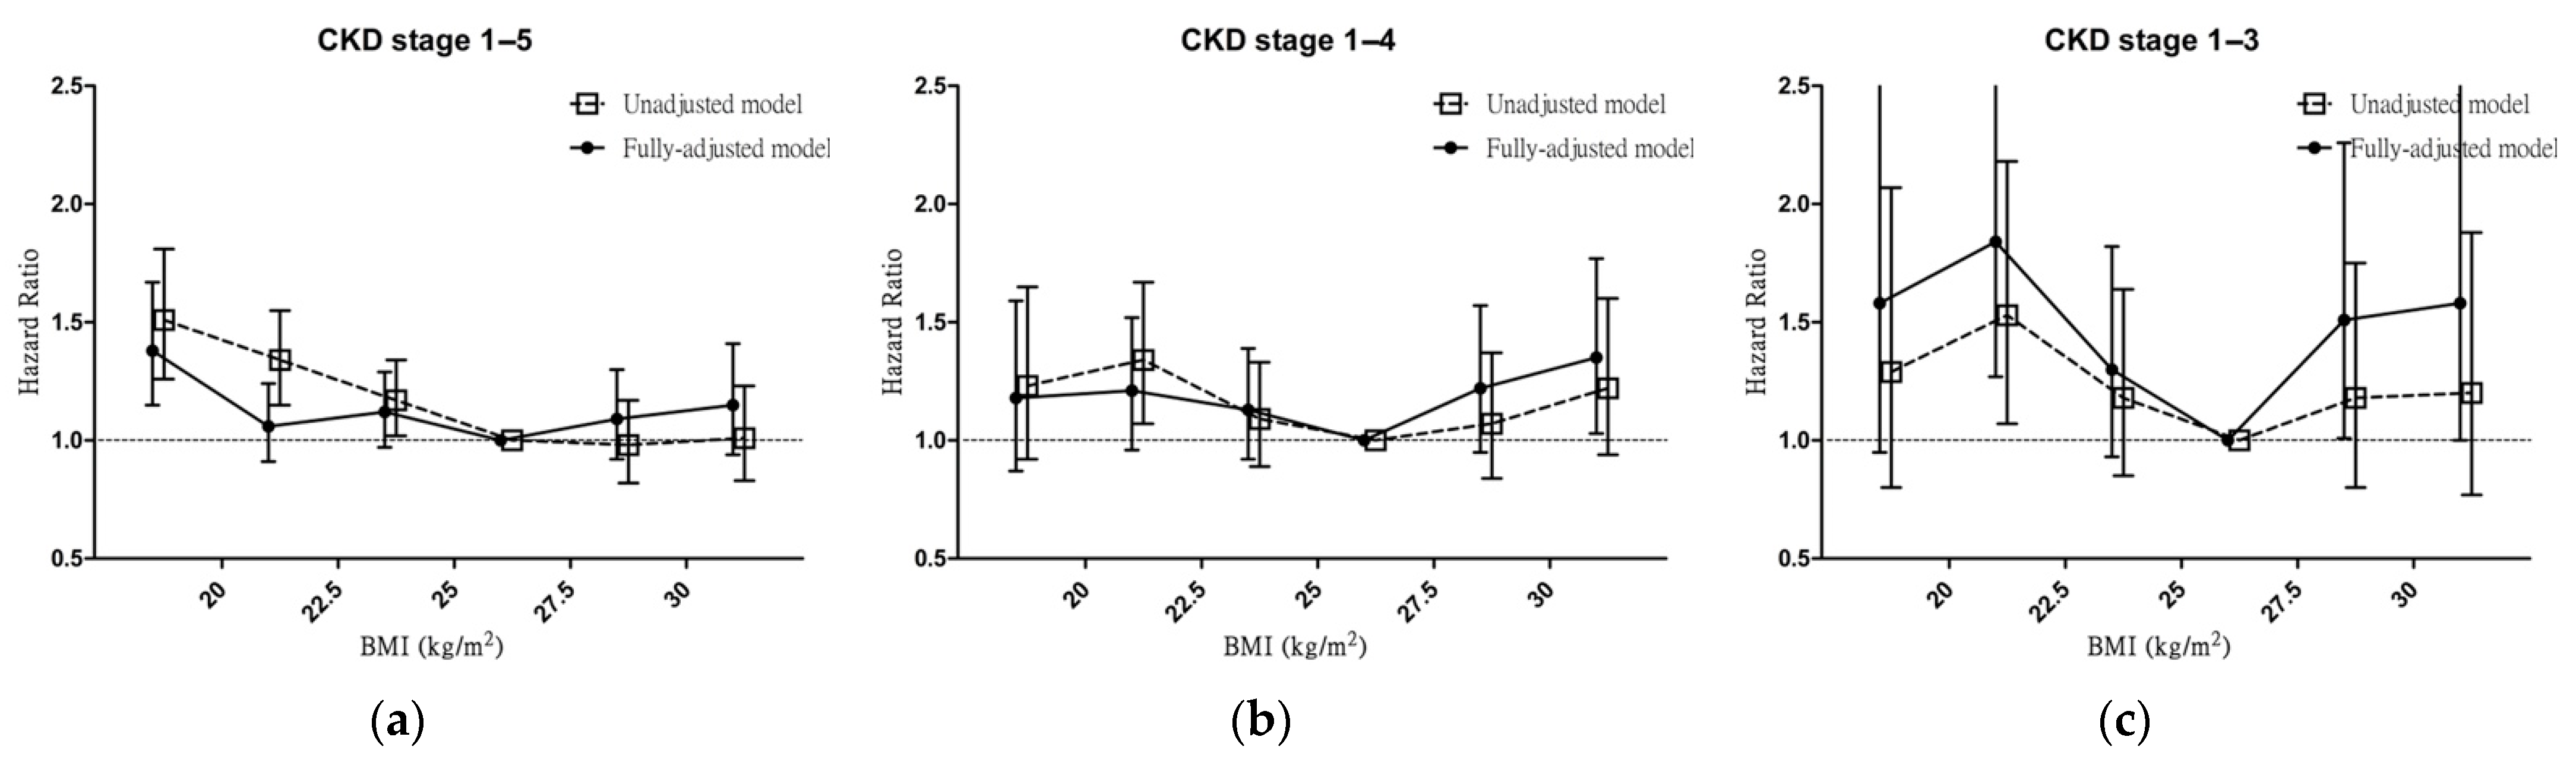
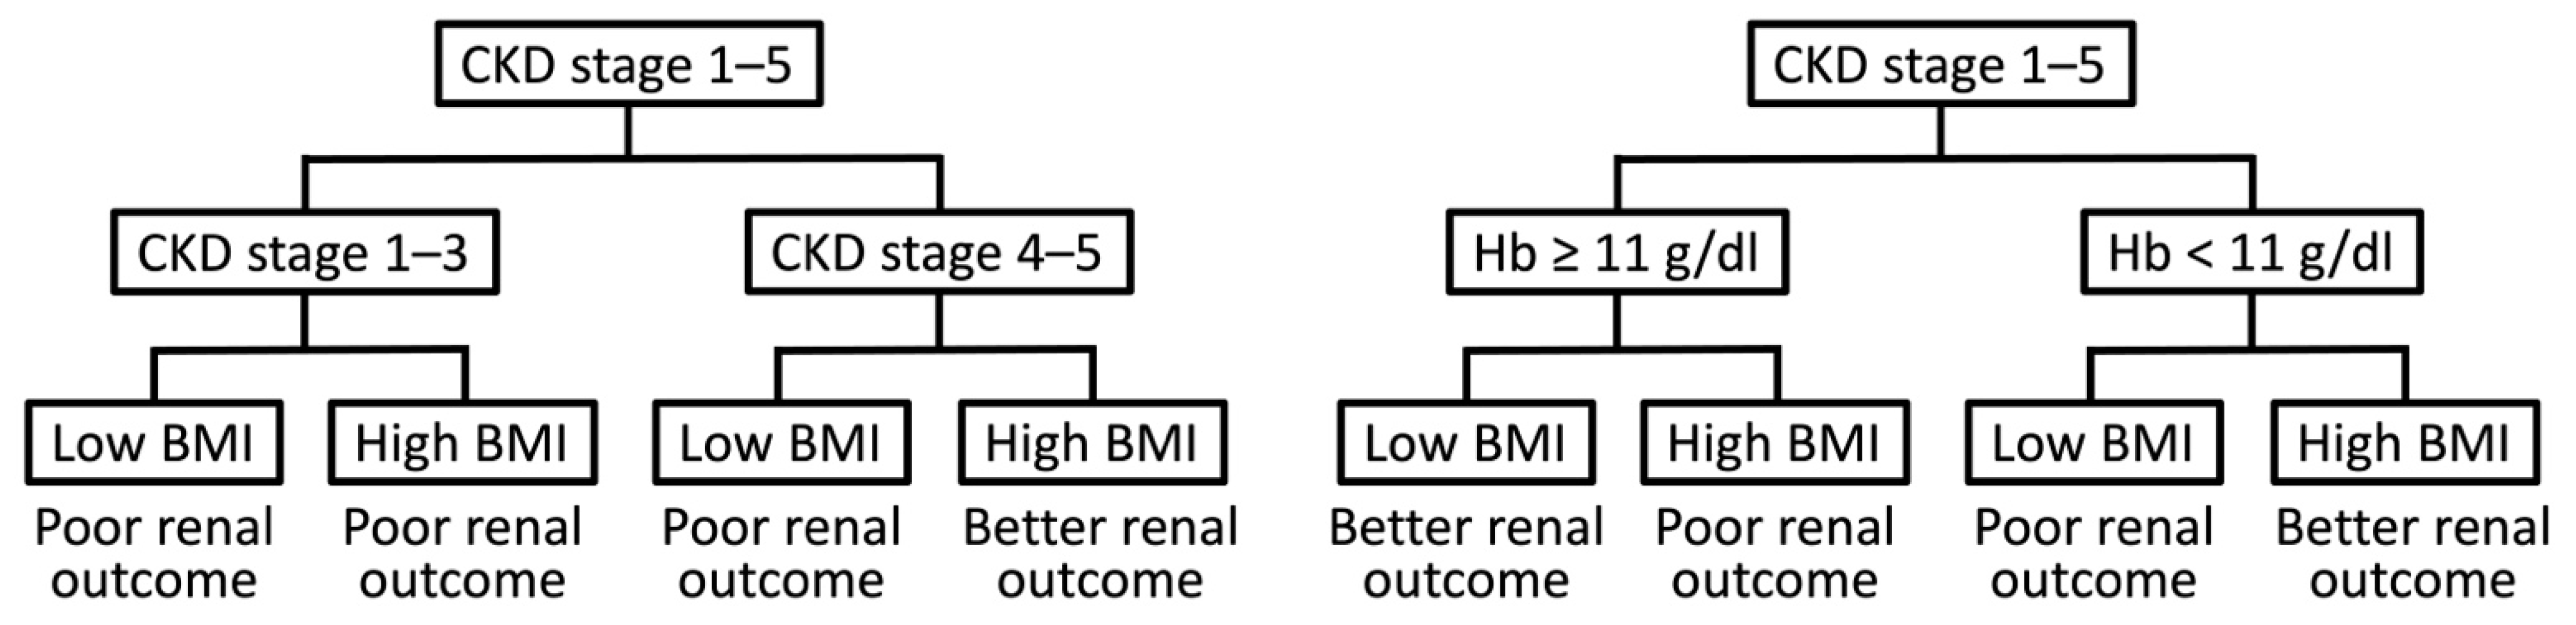
3.5. Association between Body Mass Index and Renal Outcomes in Terms of Chronic Kidney Disease Stage
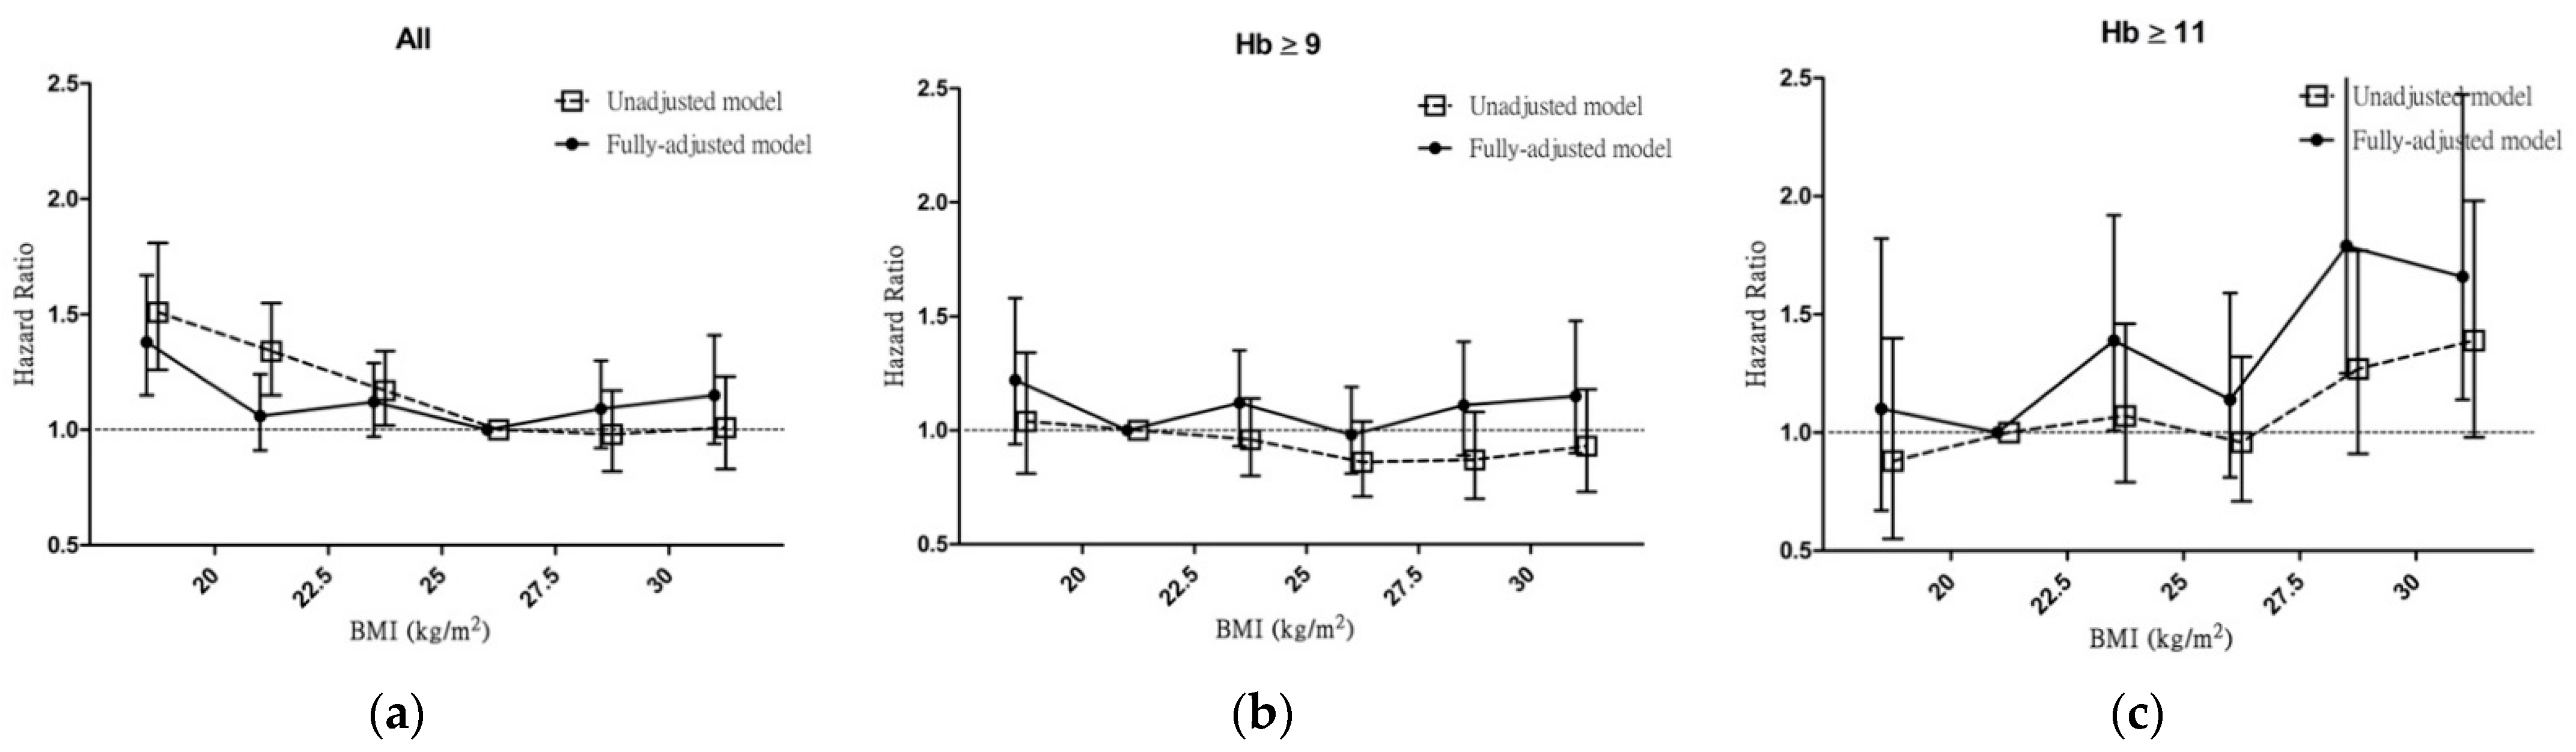
3.6. Association between Body Mass Index and Renal Outcomes According to Hemoglobin Levels
3.7. Association between Body Mass Index, Renal Outcomes, and Mortality According to Hb Levels among Patients with Chronic Kidney Disease Stages 4 and 5
3.8. Association between the Waist-to-Hip Ratio, Renal Outcomes, and Mortality According to Chronic Kidney Disease Stage
3.9. Association between Waist-to-Hip Ratio, Renal Outcomes, and Mortality According to Hemoglobin Levels
4. Discussion
5. Conclusions
Supplementary Materials
Author Contributions
Funding
Institutional Review Board Statement
Informed Consent Statement
Data Availability Statement
Conflicts of Interest
References
- Afshin, A.; Forouzanfar, M.H.; Reitsma, M.B.; Sur, P.; Estep, K.; Lee, A.; Marczak, L.; Mokdad, A.H.; Moradi-Lakeh, M.; Naghavi, M.; et al. Health Effects of Overweight and Obesity in 195 Countries over 25 Years. N. Engl. J. Med. 2017, 377, 13–27. [Google Scholar] [CrossRef] [PubMed]
- Berrington de Gonzalez, A.; Hartge, P.; Cerhan, J.R.; Flint, A.J.; Hannan, L.; MacInnis, R.J.; Moore, S.C.; Tobias, G.S.; Anton-Culver, H.; Freeman, L.B.; et al. Body-mass index and mortality among 1.46 million white adults. N. Engl. J. Med. 2010, 363, 2211–2219. [Google Scholar] [CrossRef] [PubMed] [Green Version]
- Zheng, W.; McLerran, D.F.; Rolland, B.; Zhang, X.; Inoue, M.; Matsuo, K.; He, J.; Gupta, P.C.; Ramadas, K.; Tsugane, S.; et al. Association between Body-Mass Index and Risk of Death in More Than 1 Million Asians. N. Engl. J. Med. 2011, 364, 719–729. [Google Scholar] [CrossRef] [PubMed] [Green Version]
- Chen, Y.; Copeland, W.K.; Vedanthan, R.; Grant, E.; Lee, J.E.; Gu, D.; Gupta, P.C.; Ramadas, K.; Inoue, M.; Tsugane, S.; et al. Association between body mass index and cardiovascular disease mortality in east Asians and south Asians: Pooled analysis of prospective data from the Asia Cohort Consortium. BMJ 2013, 347, f5446. [Google Scholar] [CrossRef] [PubMed] [Green Version]
- Hill, N.R.; Fatoba, S.T.; Oke, J.L.; Hirst, J.A.; O’Callaghan, C.A.; Lasserson, D.S.; Hobbs, F.D. Global Prevalence of Chronic Kidney Disease-A Systematic Review and Meta-Analysis. PLoS ONE 2016, 11, e0158765. [Google Scholar] [CrossRef] [Green Version]
- Kalantar-Zadeh, K.; Abbott, K.C.; Salahudeen, A.K.; Kilpatrick, R.D.; Horwich, T.B. Survival advantages of obesity in dialysis patients. Am. J. Clin. Nutr. 2005, 81, 543–554. [Google Scholar] [CrossRef]
- Madero, M.; Sarnak, M.J.; Wang, X.; Sceppa, C.C.; Greene, T.; Beck, G.J.; Kusek, J.W.; Collins, A.J.; Levey, A.S.; Menon, V. Body mass index and mortality in CKD. Am. J. Kidney Dis. 2007, 50, 404–411. [Google Scholar] [CrossRef]
- Huang, J.C.; Lin, H.Y.; Lim, L.M.; Chen, S.C.; Chang, J.M.; Hwang, S.J.; Tsai, J.C.; Hung, C.C.; Chen, H.C. Body mass index, mortality, and gender difference in advanced chronic kidney disease. PLoS ONE 2015, 10, e0126668. [Google Scholar] [CrossRef]
- Kambham, N.; Markowitz, G.S.; Valeri, A.M.; Lin, J.; D’Agati, V.D. Obesity-related glomerulopathy: An emerging epidemic. Kidney Int. 2001, 59, 1498–1509. [Google Scholar] [CrossRef] [Green Version]
- Fox, C.S.; Larson, M.G.; Leip, E.P.; Culleton, B.; Wilson, P.W.; Levy, D. Predictors of new-onset kidney disease in a community-based population. JAMA 2004, 291, 844–850. [Google Scholar] [CrossRef] [Green Version]
- Foster, M.C.; Hwang, S.J.; Larson, M.G.; Lichtman, J.H.; Parikh, N.I.; Vasan, R.S.; Levy, D.; Fox, C.S. Overweight, obesity, and the development of stage 3 CKD: The Framingham Heart Study. Am. J. Kidney Dis. 2008, 52, 39–48. [Google Scholar] [CrossRef] [PubMed] [Green Version]
- Hsu, C.Y.; McCulloch, C.E.; Iribarren, C.; Darbinian, J.; Go, A.S. Body mass index and risk for end-stage renal disease. Ann. Intern. Med. 2006, 144, 21–28. [Google Scholar] [CrossRef] [PubMed]
- Lu, J.L.; Kalantar-Zadeh, K.; Ma, J.Z.; Quarles, L.D.; Kovesdy, C.P. Association of body mass index with outcomes in patients with CKD. J. Am. Soc. Nephrol. 2014, 25, 2088–2096. [Google Scholar] [CrossRef] [Green Version]
- Babayev, R.; Whaley-Connell, A.; Kshirsagar, A.; Klemmer, P.; Navaneethan, S.; Chen, S.C.; Li, S.; McCullough, P.A.; Bakris, G.; Bomback, A. Association of race and body mass index with ESRD and mortality in CKD stages 3-4: Results from the Kidney Early Evaluation Program (KEEP). Am. J. Kidney Dis. 2013, 61, 404–412. [Google Scholar] [CrossRef]
- De Nicola, L.; Minutolo, R.; Chiodini, P.; Borrelli, S.; Zoccali, C.; Postorino, M.; Iodice, C.; Nappi, F.; Fuiano, G.; Gallo, C.; et al. The effect of increasing age on the prognosis of non-dialysis patients with chronic kidney disease receiving stable nephrology care. Kidney Int. 2012, 82, 482–488. [Google Scholar] [CrossRef] [PubMed] [Green Version]
- Chang, T.J.; Zheng, C.M.; Wu, M.Y.; Chen, T.T.; Wu, Y.C.; Wu, Y.L.; Lin, H.T.; Zheng, J.Q.; Chu, N.F.; Lin, Y.M.; et al. Relationship between body mass index and renal function deterioration among the Taiwanese chronic kidney disease population. Sci. Rep. 2018, 8, 6908. [Google Scholar] [CrossRef] [PubMed]
- Huang, W.H.; Chen, C.Y.; Lin, J.L.; Lin-Tan, D.T.; Hsu, C.W.; Yen, T.H. High body mass index reduces glomerular filtration rate decline in type II diabetes mellitus patients with stage 3 or 4 chronic kidney disease. Medicine 2014, 93, e41. [Google Scholar] [CrossRef] [PubMed]
- Amparo, F.C.; Kamimura, M.A.; Molnar, M.Z.; Cuppari, L.; Lindholm, B.; Amodeo, C.; Carrero, J.J.; Cordeiro, A.C. Diagnostic validation and prognostic significance of the Malnutrition-Inflammation Score in nondialyzed chronic kidney disease patients. Nephrol. Dial. Transplant. 2015, 30, 821–828. [Google Scholar] [CrossRef] [PubMed] [Green Version]
- Zha, Y.; Qian, Q. Protein Nutrition and Malnutrition in CKD and ESRD. Nutrients 2017, 9, 208. [Google Scholar] [CrossRef]
- Rossert, J.; Froissart, M. Role of anemia in progression of chronic kidney disease. Semin. Nephrol. 2006, 26, 283–289. [Google Scholar] [CrossRef]
- Wildman, R.P.; Muntner, P.; Reynolds, K.; McGinn, A.P.; Rajpathak, S.; Wylie-Rosett, J.; Sowers, M.R. The obese without cardiometabolic risk factor clustering and the normal weight with cardiometabolic risk factor clustering: Prevalence and correlates of 2 phenotypes among the US population (NHANES 1999-2004). Arch. Intern. Med. 2008, 168, 1617–1624. [Google Scholar] [CrossRef] [PubMed] [Green Version]
- Shen, F.C.; Chiu, Y.W.; Kuo, M.C.; Lin, M.Y.; Lee, J.J.; Hwang, S.J.; Chang, J.M.; Hung, C.C.; Chen, H.C. U-Shaped Association between Waist-to-Hip Ratio and All-Cause Mortality in Stage 3-5 Chronic Kidney Disease Patients with Body Mass Index Paradox. J. Pers. Med. 2021, 11, 1355. [Google Scholar] [CrossRef] [PubMed]
- Consultation, W. Waist Circumference and Waist-Hip Ratio. Report of a WHO Expert Consultation; World Health Organization: Geneva, Switzerland, 2008; pp. 8–11. [Google Scholar]
- Kalantar-Zadeh, K.; Kopple, J.D.; Block, G.; Humphreys, M.H. A malnutrition-inflammation score is correlated with morbidity and mortality in maintenance hemodialysis patients. Am. J. Kidney Dis. 2001, 38, 1251–1263. [Google Scholar] [CrossRef] [PubMed] [Green Version]
- Sundararajan, V.; Henderson, T.; Perry, C.; Muggivan, A.; Quan, H.; Ghali, W.A. New ICD-10 version of the Charlson comorbidity index predicted in-hospital mortality. J. Clin. Epidemiol. 2004, 57, 1288–1294. [Google Scholar] [CrossRef] [PubMed]
- Chiang, H.P.; Chiu, Y.W.; Lee, J.J.; Hung, C.C.; Hwang, S.J.; Chen, H.C. Blood pressure modifies outcomes in patients with stage 3 to 5 chronic kidney disease. Kidney Int. 2020, 97, 402–413. [Google Scholar] [CrossRef] [PubMed] [Green Version]
- Vivante, A.; Golan, E.; Tzur, D.; Leiba, A.; Tirosh, A.; Skorecki, K.; Calderon-Margalit, R. Body mass index in 1.2 million adolescents and risk for end-stage renal disease. Arch. Intern. Med. 2012, 172, 1644–1650. [Google Scholar] [CrossRef]
- Akchurin, O.M.; Kaskel, F. Update on inflammation in chronic kidney disease. Blood Purif. 2015, 39, 84–92. [Google Scholar] [CrossRef]
- Rapa, S.F.; Di Iorio, B.R.; Campiglia, P.; Heidland, A.; Marzocco, S. Inflammation and Oxidative Stress in Chronic Kidney Disease-Potential Therapeutic Role of Minerals, Vitamins and Plant-Derived Metabolites. Int. J. Mol. Sci. 2019, 21, 263. [Google Scholar] [CrossRef] [Green Version]
- Gupta, J.; Mitra, N.; Kanetsky, P.A.; Devaney, J.; Wing, M.R.; Reilly, M.; Shah, V.O.; Balakrishnan, V.S.; Guzman, N.J.; Girndt, M.; et al. Association between albuminuria, kidney function, and inflammatory biomarker profile in CKD in CRIC. Clin. J. Am. Soc. Nephrol. 2012, 7, 1938–1946. [Google Scholar] [CrossRef] [Green Version]
- Palaka, E.; Grandy, S.; van Haalen, H.; McEwan, P.; Darlington, O. The Impact of CKD Anaemia on Patients: Incidence, Risk Factors, and Clinical Outcomes-A Systematic Literature Review. Int. J. Nephrol. 2020, 2020, 7692376. [Google Scholar] [CrossRef]
- Kalantar-Zadeh, K.; McAllister, C.J.; Lehn, R.S.; Lee, G.H.; Nissenson, A.R.; Kopple, J.D. Effect of malnutrition-inflammation complex syndrome on EPO hyporesponsiveness in maintenance hemodialysis patients. Am. J. Kidney Dis. 2003, 42, 761–773. [Google Scholar] [CrossRef] [Green Version]
- Rattanasompattikul, M.; Molnar, M.Z.; Zaritsky, J.J.; Hatamizadeh, P.; Jing, J.; Norris, K.C.; Kovesdy, C.P.; Kalantar-Zadeh, K. Association of malnutrition-inflammation complex and responsiveness to erythropoiesis-stimulating agents in long-term hemodialysis patients. Nephrol. Dial. Transplant. 2013, 28, 1936–1945. [Google Scholar] [CrossRef] [PubMed] [Green Version]
- Peters, H.P.; Laarakkers, C.M.; Swinkels, D.W.; Wetzels, J.F. Serum hepcidin-25 levels in patients with chronic kidney disease are independent of glomerular filtration rate. Nephrol. Dial. Transplant. 2010, 25, 848–853. [Google Scholar] [CrossRef] [PubMed] [Green Version]
- Yilmaz, M.I.; Solak, Y.; Covic, A.; Goldsmith, D.; Kanbay, M. Renal anemia of inflammation: The name is self-explanatory. Blood Purif. 2011, 32, 220–225. [Google Scholar] [CrossRef]
- Kovesdy, C.P.; Furth, S.L.; Zoccali, C. Obesity and Kidney Disease: Hidden Consequences of the Epidemic. Can. J. Kidney Health Dis. 2017, 4, 1–10. [Google Scholar] [CrossRef] [Green Version]
- Brown, R.N.K.L.; Mohsen, A.; Green, D.; Hoefield, R.A.; Summers, L.K.M.; Middleton, R.J.; O’Donoghue, D.J.; Kalra, P.A.; New, D.I. Body mass index has no effect on rate of progression of chronic kidney disease in non-diabetic subjects. Nephrol. Dial. Transplant. 2012, 27, 2776–2780. [Google Scholar] [CrossRef] [Green Version]
- Després, J.P.; Lemieux, I. Abdominal obesity and metabolic syndrome. Nature 2006, 444, 881–887. [Google Scholar] [CrossRef]
- Postorino, M.; Marino, C.; Tripepi, G.; Zoccali, C. Abdominal obesity and all-cause and cardiovascular mortality in end-stage renal disease. J. Am. Coll. Cardiol. 2009, 53, 1265–1272. [Google Scholar] [CrossRef] [Green Version]
- Kim, C.S.; Han, K.D.; Choi, H.S.; Bae, E.H.; Ma, S.K.; Kim, S.W. Association of Body Mass Index and Waist Circumference with All-Cause Mortality in Hemodialysis Patients. J. Clin. Med. 2020, 9, 1289. [Google Scholar] [CrossRef]
- Eckel, R.H.; Grundy, S.M.; Zimmet, P.Z. The metabolic syndrome. Lancet 2005, 365, 1415–1428. [Google Scholar] [CrossRef]
- Pinto-Sietsma, S.J.; Navis, G.; Janssen, W.M.; de Zeeuw, D.; Gans, R.O.; de Jong, P.E. A central body fat distribution is related to renal function impairment, even in lean subjects. Am. J. Kidney Dis. 2003, 41, 733–741. [Google Scholar] [CrossRef]
- Dong, Y.; Wang, Z.; Chen, Z.; Wang, X.; Zhang, L.; Nie, J.; Zheng, C.; Wang, J.; Shao, L.; Tian, Y.; et al. Comparison of visceral, body fat indices and anthropometric measures in relation to chronic kidney disease among Chinese adults from a large scale cross-sectional study. BMC Nephrol. 2018, 19, 40. [Google Scholar] [CrossRef] [PubMed] [Green Version]
- Kovesdy, C.P.; Anderson, J.E.; Kalantar-Zadeh, K. Paradoxical association between body mass index and mortality in men with CKD not yet on dialysis. Am. J. Kidney Dis. 2007, 49, 581–591. [Google Scholar] [CrossRef]
- Elsayed, E.F.; Tighiouart, H.; Weiner, D.E.; Griffith, J.; Salem, D.; Levey, A.S.; Sarnak, M.J. Waist-to-hip ratio and body mass index as risk factors for cardiovascular events in CKD. Am. J. Kidney Dis. 2008, 52, 49–57. [Google Scholar] [CrossRef] [PubMed] [Green Version]
- Kramer, H.; Shoham, D.; McClure, L.A.; Durazo-Arvizu, R.; Howard, G.; Judd, S.; Muntner, P.; Safford, M.; Warnock, D.G.; McClellan, W. Association of waist circumference and body mass index with all-cause mortality in CKD: The REGARDS (Reasons for Geographic and Racial Differences in Stroke) Study. Am. J. Kidney Dis. 2011, 58, 177–185. [Google Scholar] [CrossRef] [PubMed] [Green Version]
- Hörl, W.H. Anaemia management and mortality risk in chronic kidney disease. Nat. Rev. Nephrol. 2013, 9, 291–301. [Google Scholar] [CrossRef] [PubMed]


| Body Mass Index (kg/m2) | p-Value (ANOVA) | ||||||
|---|---|---|---|---|---|---|---|
| G1 | G2 | G3 | G4 | G5 | G6 | ||
| 15.0–20.0 | 20.0–22.5 | 22.5–25.0 | 25.0–27.5 | 27.5–30.0 | 30.0–35.0 | ||
| CKD stages 1–3 | |||||||
| Demographics/Medical history | |||||||
| Age (years) | 55.3 (20.1) | 59.8 (16.2) | 63.6 (13.4) | 61.6 (13.1) | 60.6 (13.8) | 58.7 (13.2) | <0.001 |
| Sex (male) | 60 (49.6%) | 95 (38.8%) | 103 (24.6%) | 91 (24.1%) | 54 (26.0%) | 39 (26.9%) | <0.001 |
| Cardiovascular disease | 19 (15.7%) | 36 (14.7%) | 36 (14.7%) | 72 (19.1%) | 41 (19.7%) | 30 (20.7%) | 0.574 |
| Diabetes mellitus | 45 (37.2%) | 99 (40.4%) | 185 (44.2%) | 177 (46.9%) | 103 (49.5%) | 87 (60.0%) | 0.001 |
| Hypertension | 52 (43.0%) | 113 (46.1%) | 234 (55.8%) | 228 (60.5%) | 134 (64.4%) | 96 (66.2%) | <0.001 |
| Mean BP (mmHg) | 93.7 (12.3) | 94.9 (13.1) | 99.2 (12.8) | 100.5 (12.5) | 101.8 (12.9) | 102.9 (13.2) | <0.001 |
| Antihypertensive drug | 37 (30.6%) | 86 (35.1%) | 155 (37.0%) | 174 (46.2%) | 112 (53.8%) | 64 (44.1%) | <0.001 |
| Charlson score | 2.98 (2.04) | 3.09 (1.91) | 3.19 (1.97) | 3.24 (2.03) | 3.14 (1.86) | 2.81 (1.72) | 0.283 |
| Metabolic syndrome | 31 (25.6%) | 95 (38.8%) | 247 (58.9%) | 276 (73.2%) | 174 (83.7%) | 132 (91.0%) | <0.001 |
| Malnutrition–inflammation | 36 (29.8%) | 23 (9.4%) | 25 (6.0%) | 23 (6.1%) | 12 (5.8%) | 10 (6.9%) | <0.001 |
| Laboratory data | |||||||
| eGFR (mL/min/1.73 m2) | 44.5 (36.7–70.6) | 43.9 (36.4–59.1) | 43.5 (36.6–55.7) | 45.5 (36.4–57.6) | 44.4 (35.9–56.7) | 49.0 (38.0–63.2) | 0.568 |
| UPCR (mg/g) | 626 (168–1735) | 389 (170–1529) | 421 (166–1361) | 425 (145–1201) | 377 (164–1174) | 493 (171–1322) | 0.283 |
| Hemoglobin (g/dL) | 11.98 (1.98) | 12.39 (1.94) | 12.96 (1.88) | 13.36 (1.92) | 13.46 (1.90) | 13.76 (2.08) | <0.001 |
| Albumin (g/dL) | 3.90 (0.59) | 3.93 (0.54) | 3.99 (0.53) | 4.00 (0.53) | 4.01 (0.49) | 3.99 (0.56) | 0.272 |
| C-reactive protein (mg/L) | 0.5 (0.1–4.7) | 0.6 (0.2–3.3) | 0.9 (0.3–2.6) | 1.0 (0.3–4.1) | 0.9 (0.2–5.0) | 1.7 (0.5–5.2) | 0.757 |
| HbA1c (%) | 6.3 (1.8) | 6.5 (1.8) | 6.5 (1.6) | 6.8 (1.8) | 6.6 (1.5) | 7.1 (1.7) | 0.001 |
| Total cholesterol (mg/dL) | 202 (58) | 205 (65) | 203 (54) | 204 (69) | 198 (48) | 203 (63) | 0.883 |
| Triglyceride (mg/dL) | 101 (54) | 132 (92) | 156 (207) | 159 (102) | 176 (107) | 177 (104) | <0.001 |
| Outcomes | |||||||
| RRT + GFR 50% decline | 23 (19.0%) | 57 (23.3%) | 80 (19.1%) | 65 (17.2%) | 41 (19.7%) | 27 (18.6%) | 0.039 |
| Mortality | 23 (19.0%) | 26 (10.6%) | 45 (10.7%) | 40 (10.6%) | 16 (7.7%) | 17 (11.7%) | 0.047 |
| CKD stages 4 and 5 | |||||||
| Demographics/Medical history | |||||||
| Age (years) | 62.53 (15.90) | 63.79 (13.45) | 63.83 (13.12) | 63.56 (13.57) | 64.45 (12.43) | 61.73 (13.26) | 0.353 |
| Sex (male) | 147 (61.3%) | 226 (54.2%) | 281 (46.4%) | 199 (45.7%) | 120 (50.2%) | 94 (61.4%) | <0.001 |
| Cardiovascular disease | 67 (27.9%) | 102 (24.5%) | 170 (28.1%) | 128 (29.4%) | 80 (33.5%) | 51 (33.3%) | 0.143 |
| Diabetes mellitus | 102 (42.5%) | 190 (45.6%) | 312 (51.5%) | 241 (55.4%) | 146 (61.1%) | 97 (63.4%) | <0.001 |
| Hypertension | 144 (60.0%) | 287 (68.8%) | 438 (72.3%) | 321 (73.8%) | 174 (72.8%) | 107 (69.9%) | 0.004 |
| Mean BP (mmHg) | 95.4 (13.9) | 99.5 (14.1) | 101.0 (13.8) | 100.5 (13.3) | 102.6 (14.1) | 102.2 (15.0) | <0.001 |
| Antihypertensive drug | 79 (32.9%) | 175 (42.0%) | 279 (46.0%) | 201 (46.2%) | 115 (48.1%) | 78 (51.0%) | <0.001 |
| Charlson score | 3.38 (2.01) | 3.55 (2.25) | 3.66 (2.13) | 3.74 (2.14) | 3.72 (1.91) | 3.75 (2.04) | 0.281 |
| Metabolic syndrome | 103 (42.9%) | 235 (56.4%) | 421 (69.5%) | 373 (85.7%) | 216 (90.4%) | 143 (93.5%) | <0.001 |
| Malnutrition–inflammation | 121 (50.4%) | 83 (19.9%) | 125 (20.6%) | 86 (19.8%) | 44 (18.4%) | 33 (21.6%) | <0.001 |
| Laboratory data | |||||||
| eGFR (mL/min/1.73 m2) | 11.5 (7.2–17.5) | 13.0 (8.1–20.3) | 13.4 (8.4–21.0) | 14.8 (9.3–22.2) | 15.0 (9.1–22.8) | 15.9 (9.3–22.8) | <0.001 |
| UPCR (mg/g) | 1487 (799–3025) | 1579 (843–3186) | 1612 (792–3477) | 1573 (860–3311) | 1594 (682–3467) | 1538 (679–3709) | 0.974 |
| Hemoglobin (g/dL) | 9.19 (1.49) | 9.47 (1.64) | 9.86 (1.81) | 10.12 (1.90) | 10.31 (1.98) | 10.53 (1.80) | <0.001 |
| Albumin (g/dL) | 3.67 (0.55) | 3.74 (0.55) | 3.73 (0.55) | 3.77 (0.55) | 3.75 (0.51) | 3.72 (0.49) | 0.362 |
| C-reactive protein (mg/L) | 1.1 (0.4–6.9) | 1.0 (0.5–5.0) | 1.3 (0.5–5.3) | 1.5 (0.5–7.4) | 2.0 (0.5–7.9) | 2.0 (0.5–10.6) | 0.002 |
| HbA1c (%) | 6.0 (1.4) | 6.2 (1.6) | 6.4 (1.6) | 6.6 (1.7) | 6.6 (1.5) | 6.9 (1.7) | <0.001 |
| Total cholesterol (mg/dL) | 185 (55) | 194 (51) | 193 (47) | 199 (58) | 194 (49) | 204 (56) | 0.005 |
| Triglyceride (mg/dL) | 122 (89) | 135 (82) | 148 (93) | 190 (226) | 161 (89) | 195 (126) | <0.001 |
| Outcomes | |||||||
| RRT + GFR 50% decline | 154 (64.2%) | 276 (66.2%) | 405 (66.8%) | 287 (66.0%) | 154 (64.4%) | 106 (69.3%) | 0.005 |
| Mortality | 56 (23.3%) | 79 (18.9%) | 104 (17.2%) | 77 (17.7%) | 39 (16.3%) | 20 (13.1%) | 0.021 |
| Beta Coefficient | 95% CI Beta Coefficient | p-Value | |
|---|---|---|---|
| Constant | 11.749 | ||
| Age (years) | 0.004 | −0.005 to 0.013 | 0.372 |
| Gender (female vs. male) | 0.198 | −0.065 to 0.461 | 0.141 |
| eGFR (mL/min/1.73 m2) | −0.005 | −0.012 to 0.002 | 0.132 |
| Upcr log | 0.060 | −0.199 to 0.319 | 0.650 |
| Diabetes mellitus | 0.726 | 0.463 to 0.989 | <0.001 |
| Cardiovascular disease | 0.231 | −0.047 to 0.508 | 0.103 |
| Glycosylated hemoglobin (%) | 0.154 | 0.075 to 0.233 | <0.001 |
| Mean BP (mmHg) | 0.034 | 0.026 to 0.043 | <0.001 |
| Hemoglobin (g/dL) | 0.436 | 0.364 to 0.509 | <0.001 |
| Albumin (g/dL) | |||
| in CKD 1–3 | 0.007 | −0.395 to 0.410 | 0.972 |
| in CKD 4 and 5 | 0.427 | 0.091 to 0.763 | 0.013 |
| Cholesterol log | 0.579 | −0.513 to 1.670 | 0.299 |
| CRP ln | 0.340 | 0.208 to 0.471 | <0.001 |
| Phosphorus (mg/dL) | −0.041 | −0.162 to 0.079 | 0.498 |
| Uric acid (mg/dl | 0.211 | 0.149 to 0.272 | <0.001 |
| Ferritin log | −0.235 | −0.493 to 0.023 | 0.074 |
| GPT (U/L) | 0.004 | −0.001 to 0.009 | 0.096 |
| Bicarbonate (mEq/L) | −0.037 | −0.070 to −0.004 | 0.027 |
| BMI (kg/m2) | |||||||
|---|---|---|---|---|---|---|---|
| G1 | G2 | G3 | G4 | G5 | G6 | ||
| 15.0–20.0 | 20.0–22.5 | 22.5–25.0 | 25.0–27.5 | 27.5–30.0 | 30.0–35.0 | ||
| HR for renal outcome | |||||||
| CKD stages 1–3 | Unadjusted | 1.29 (0.80–2.07) | 1.53 (1.07–2.18) * | 1.18 (0.85–1.64) | 1 (reference) | 1.18 (0.80–1.75) | 1.20 (0.77–1.88) |
| Fully adjusted | 1.58 (0.95–2.61) | 1.84 (1.27–2.66) * | 1.30 (0.93–1.82) | 1 (reference) | 1.51 (1.01–2.26) * | 1.58 (1.00–2.51) | |
| CKD stages 4 and 5 | Unadjusted | 1.26 (1.03–1.53) * | 1.06 (0.90–1.25) | 1.02 (0.88–1.19) | 1 (reference) | 0.90 (0.74–1.10) | 0.91 (0.73–1.14) |
| Fully adjusted | 1.31 (1.07–1.61) * | 0.96 (0.81–1.13) | 1.05 (0.90–1.22) | 1 (reference) | 1.02 (0.84–1.25) | 1.04 (0.83–1.31) | |
| HR for all-cause mortality | |||||||
| CKD stages 1–3 | Unadjusted | 2.05 (1.28–3.26) * | 1.33 (0.87–2.03) | 1.21 (0.83–1.77) | 1 (reference) | 0.86 (0.52–1.43) | 1.22 (0.73–2.03) |
| Fully adjusted | 2.54 (1.55–4.16) ** | 1.37 (0.88–2.14) | 1.23 (0.84–1.81) | 1 (reference) | 1.01 (0.60–1.68) | 1.44 (0.86–2.42) | |
| CKD stages 4 and 5 | Unadjusted | 1.64 (1.14–2.37) * | 1.45 (1.03–2.05) * | 1.33 (0.95–1.85) | 1.27 (0.90–1.80) | 1.24 (0.85–1.80) | 1 (reference) |
| Fully adjusted | 1.91 (1.30–2.80) ** | 1.58 (1.11–2.25) * | 1.33 (0.94–1.86) | 1.27 (0.89–1.80) | 1.18 (0.81–1.72) | 1 (reference) | |
| BMI (kg/m2) | |||||||
|---|---|---|---|---|---|---|---|
| G1 | G2 | G3 | G4 | G5 | G6 | ||
| 15.0–20.0 | 20.0–22.5 | 22.5–25.0 | 25.0–27.5 | 27.5–30.0 | 30.0–35.0 | ||
| HR for renal outcome | |||||||
| Hb < 11 g/dL | Unadjusted | 1.19 (0.93–1.52) | 1.07 (0.86–1.34) | 1.13 (0.91–1.39) | 1.15 (0.92–1.44) | 1 (reference) | 1.05 (0.78–1.41) |
| Fully adjusted | 1.48 (1.15–1.90) * | 1.15 (0.92–1.45) | 1.15 (0.93–1.43) | 1.09 (0.87–1.38) | 1 (reference) | 1.03 (0.76–1.39) | |
| Hb ≥ 11 g/dL | Unadjusted | 0.88 (0.55–1.40) | 1 (reference) | 1.07 (0.79–1.46) | 0.96 (0.71–1.32) | 1.27 (0.91–1.77) | 1.39 (0.98–1.98) |
| Fully adjusted | 1.10 (0.67–1.82) | 1 (reference) | 1.39 (1.01–1.92) * | 1.14 (0.81–1.59) | 1.79 (1.25–2.55) * | 1.66 (1.14–2.43) * | |
| HR for mortality | |||||||
| Hb < 11 g/dL | Unadjusted | 1.51 (1.00–2.27) * | 1.27 (0.86–1.88) | 1.21 (0.82–1.78) | 1.13 (0.75–1.69) | 1.19 (0.77–1.85) | 1 (reference) |
| Fully adjusted | 1.76 (1.16–2.68) * | 1.41 (0.95–2.11) | 1.15 (0.77–1.70) | 1.09 (0.72–1.64) | 1.02 (0.65–1.59) | 1 (reference) | |
| Hb ≥ 11 g/dL | Unadjusted | 0.98 (0.65–1.48) | 1.23 (0.72–2.12) | 1.08 (0.69–1.69) | 1 (reference) | 1.09 (0.73–1.62) | 0.88 (0.56–1.40) |
| Fully adjusted | 1.12 (0.73–1.70) | 2.10 (1.19–3.71) * | 1.48 (0.92–2.36) | 1 (reference) | 1.30 (0.86–1.98) | 1.08 (0.67–1.73) | |
Publisher’s Note: MDPI stays neutral with regard to jurisdictional claims in published maps and institutional affiliations. |
© 2022 by the authors. Licensee MDPI, Basel, Switzerland. This article is an open access article distributed under the terms and conditions of the Creative Commons Attribution (CC BY) license (https://creativecommons.org/licenses/by/4.0/).
Share and Cite
Hung, C.-C.; Yu, P.-H.; Niu, S.-W.; Kuo, I.-C.; Lee, J.-J.; Shen, F.-C.; Chang, J.-M.; Hwang, S.-J. Association between Body Mass Index and Renal Outcomes Modified by Chronic Kidney Disease and Anemia: The Obesity Paradox for Renal Outcomes. J. Clin. Med. 2022, 11, 2787. https://doi.org/10.3390/jcm11102787
Hung C-C, Yu P-H, Niu S-W, Kuo I-C, Lee J-J, Shen F-C, Chang J-M, Hwang S-J. Association between Body Mass Index and Renal Outcomes Modified by Chronic Kidney Disease and Anemia: The Obesity Paradox for Renal Outcomes. Journal of Clinical Medicine. 2022; 11(10):2787. https://doi.org/10.3390/jcm11102787
Chicago/Turabian StyleHung, Chi-Chih, Pei-Hua Yu, Sheng-Wen Niu, I-Ching Kuo, Jia-Jung Lee, Feng-Ching Shen, Jer-Ming Chang, and Shang-Jyh Hwang. 2022. "Association between Body Mass Index and Renal Outcomes Modified by Chronic Kidney Disease and Anemia: The Obesity Paradox for Renal Outcomes" Journal of Clinical Medicine 11, no. 10: 2787. https://doi.org/10.3390/jcm11102787
APA StyleHung, C.-C., Yu, P.-H., Niu, S.-W., Kuo, I.-C., Lee, J.-J., Shen, F.-C., Chang, J.-M., & Hwang, S.-J. (2022). Association between Body Mass Index and Renal Outcomes Modified by Chronic Kidney Disease and Anemia: The Obesity Paradox for Renal Outcomes. Journal of Clinical Medicine, 11(10), 2787. https://doi.org/10.3390/jcm11102787