
Kinetic Gait Parameters in Unilateral Lower Limb Amputations and Normal Gait in Able-Bodied: Reference Values for Clinical Application

 ,
,  , ,
, ,
Abstract
:1. Introduction
2. Materials and Methods
2.1. Participants
2.2. Data Collection
2.3. Data Preprocessing
2.4. Statistical Analysis
3. Results

| Amputation Level | |||||||
|---|---|---|---|---|---|---|---|
| HDA | TFA | KDA | TTA | FA | Total | ||
| <60 years | female | 9 | 50 | 14 | 48 | 9 | 130 |
| 6.9% | 38.5% | 10.8% | 36.9% | 6.9% | 100.0% | ||
| male | 11 | 232 | 40 | 204 | 49 | 536 | |
| 2.1% | 43.3% | 7.5% | 38.1% | 9.1% | 100.0% | ||
| total | 20 | 282 | 54 | 252 | 58 | 666 | |
| 3.0% | 42.3% | 8.1% | 37.8% | 8.7% | 100.0% | ||
| >60 years | female | 2 | 14 | 0 | 17 | 3 | 36 |
| 5.6% | 38.9% | 0.0% | 47.2% | 8.3% | 100.0% | ||
| male | 0 | 54 | 10 | 93 | 6 | 163 | |
| 0.0% | 33.1% | 6.1% | 57.1% | 3.7% | 100.0% | ||
| total | 2 | 68 | 10 | 110 | 9 | 199 | |
| 1.0% | 34.2% | 5.0% | 55.3% | 4.5% | 100.0% | ||
| total | 22 (2.5%) | 350 (40.5%) | 64 (7.4%) | 362 (41.8%) | 67 (7.7%) | 865 | |
| use of walking aids | 12 | 92 | 10 | 100 | 13 | 227 | |
| (excluded) | 54.5% | 26.3% | 15.6% | 27.6% | 19.4% | 26.2% | |
| Total included < 60 years | 9 | 222 | 48 | 208 | 49 | 536 * | |
| Total included > 60 years | 1 | 36 | 6 | 54 | 5 | 103 * | |
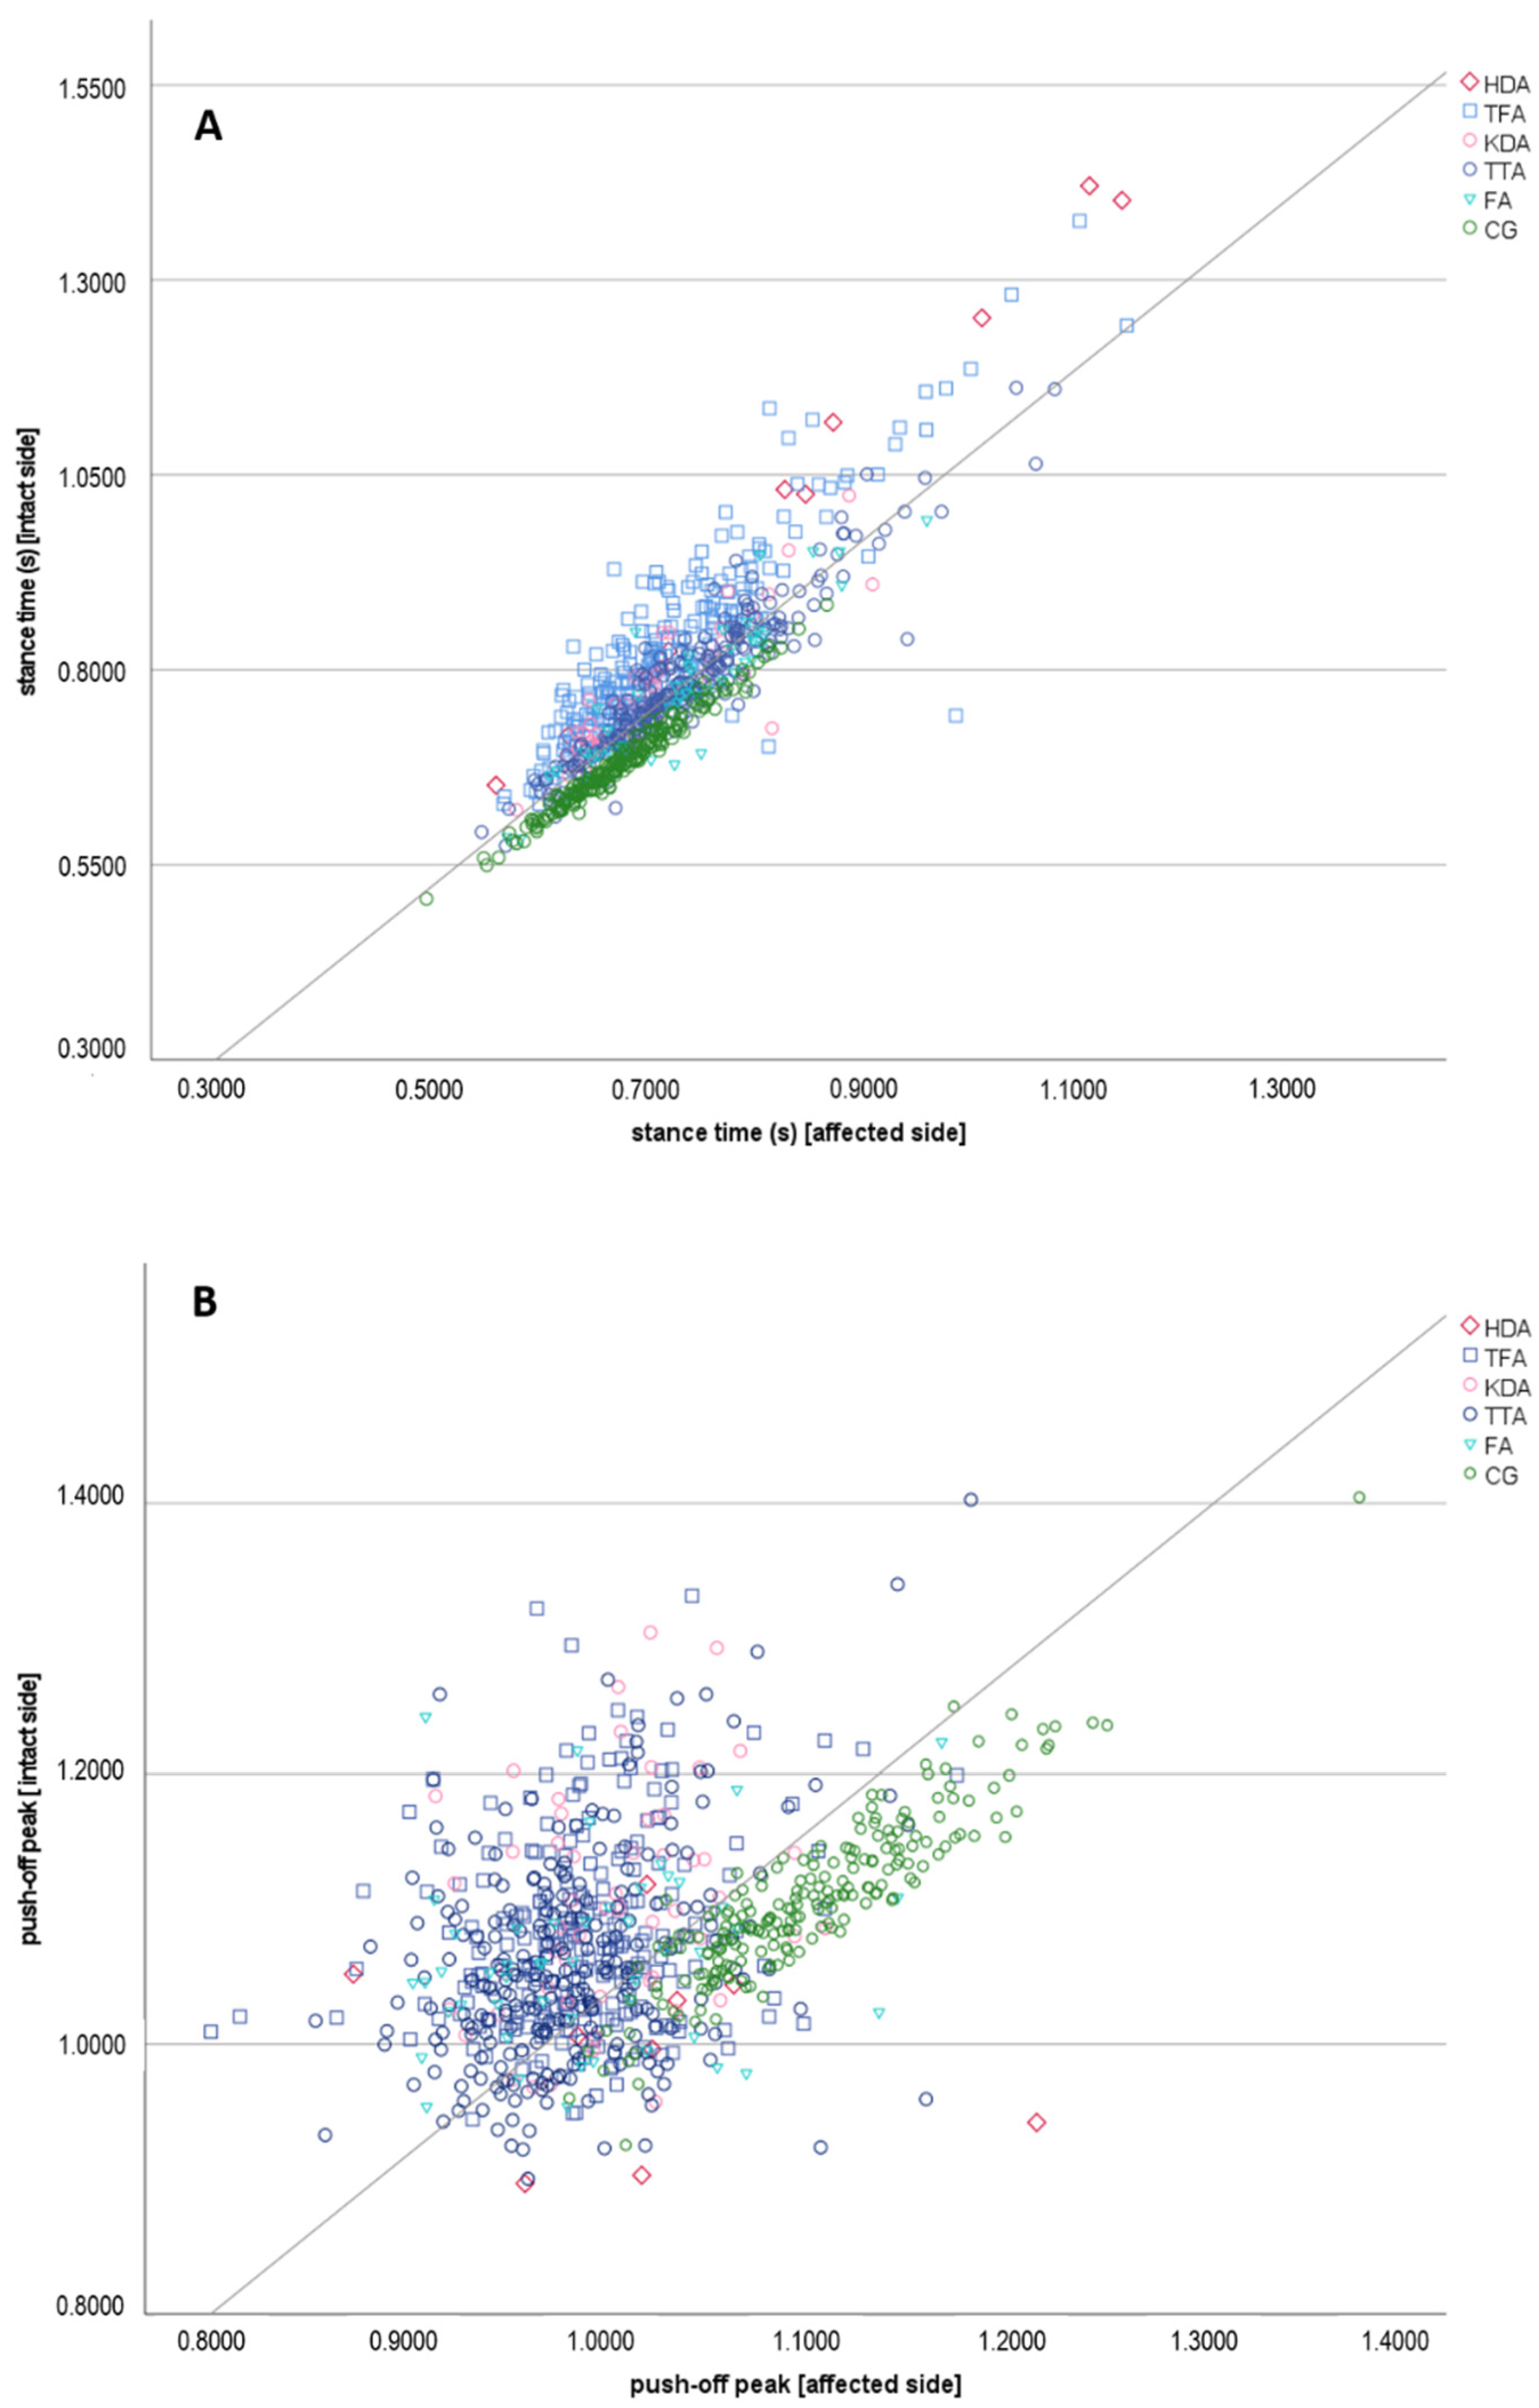
3.1. Kinetic Gait Parameters
3.2. Parameters for a Symmetrical Gait Pattern
3.3. Kinetic Gait in Older Patients
4. Discussion
5. Conclusions
Author Contributions
Funding
Institutional Review Board Statement
Informed Consent Statement
Data Availability Statement
Acknowledgments
Conflicts of Interest
References
- Isakov, E.; Keren, O.; Benjuya, N. Trans-tibial amputee gait: Time-distance parameters and EMG activity. Prosthet. Orthot. Int. 2000, 24, 216–220. [Google Scholar] [CrossRef] [PubMed] [Green Version]
- Jaegers, S.M.; Arendzen, J.H.; de Jongh, H.J. Prosthetic gait of unilateral transfemoral amputees: A kinematic study. Arch. Phys. Med. Rehabil. 1995, 76, 736–743. [Google Scholar] [CrossRef]
- Bateni, H.; Olney, S. Kinematic and Kinetic Variations of Below-Knee Amputee Gait. JPO J. Prosthet. Orthot. 2002, 14, 2–10. [Google Scholar] [CrossRef]
- Nolan, L.; Wit, A.; Dudziñski, K.; Lees, A.; Lake, M.; Wychowañski, M. Adjustments in gait symmetry with walking speed in trans-femoral and trans-tibial amputees. Gait Posture 2003, 17, 142–151. [Google Scholar] [CrossRef]
- Hof, A.L.; van Bockel, R.M.; Schoppen, T.; Postema, K. Control of lateral balance in walking. Experimental findings in normal subjects and above-knee amputees. Gait Posture 2007, 25, 250–258. [Google Scholar] [CrossRef] [Green Version]
- Kovac, I.; Medved, V.; Ostojić, L. Spatial, temporal and kinematic characteristics of traumatic transtibial amputees’ gait. Coll. Antropol. 2010, 34 (Suppl. 1), 205–213. [Google Scholar]
- Highsmith, M.J.; Kahle, J.T.; Bongiorni, D.R.; Sutton, B.S.; Groer, S.; Kaufman, K.R. Safety, energy efficiency, and cost efficacy of the C-Leg for transfemoral amputees: A review of the literature. Prosthet. Orthot. Int. 2010, 34, 362–377. [Google Scholar] [CrossRef] [Green Version]
- Schaarschmidt, M.; Lipfert, S.W.; Meier-Gratz, C.; Scholle, H.C.; Seyfarth, A. Functional gait asymmetry of unilateral transfemoral amputees. Hum. Mov. Sci. 2012, 31, 907–917. [Google Scholar] [CrossRef]
- Roerdink, M.; Roeles, S.; van der Pas, S.C.; Bosboom, O.; Beek, P.J. Evaluating asymmetry in prosthetic gait with step-length asymmetry alone is flawed. Gait Posture 2012, 35, 446–451. [Google Scholar] [CrossRef] [PubMed] [Green Version]
- Bell, J.C.; Wolf, E.J.; Schnall, B.L.; Tis, J.E.; Tis, L.L.; Potter, B.K. Transfemoral amputations: The effect of residual limb length and orientation on gait analysis outcome measures. J. Bone Jt. Surg. Am. Vol. 2013, 95, 408–414. [Google Scholar] [CrossRef]
- Castro, M.P.D.; Meucci, M.; Soares, D.P.; Fonseca, P.; Borgonovo-Santos, M.; Sousa, F.; Machado, L.; Vilas-Boas, J.P. Accuracy and Repeatability of the Gait Analysis by the WalkinSense System. BioMed Res. Int. 2014, 2014, 348659. [Google Scholar] [CrossRef] [PubMed]
- Uchytil, J.; Jandacka, D.; Zahradnik, D.; Farana, R.; Janura, M. Temporal-spatial parameters of gait in transfemoral amputees: Comparison of bionic and mechanically passive knee joints. Prosthet. Orthot. Int. 2014, 38, 199–203. [Google Scholar] [CrossRef] [PubMed] [Green Version]
- Wezenberg, D.; Cutti, A.G.; Bruno, A.; Houdijk, H. Differentiation between solid-ankle cushioned heel and energy storage and return prosthetic foot based on step-to-step transition cost. J. Rehabil. Res. Dev. 2014, 51, 1579–1590. [Google Scholar] [CrossRef] [PubMed]
- Adamczyk, P.G.; Kuo, A.D. Mechanisms of Gait Asymmetry Due to Push-Off Deficiency in Unilateral Amputees. IEEE Trans. Neural Syst. Rehabil. Eng. Publ. IEEE Eng. Med. Biol. Soc. 2015, 23, 776–785. [Google Scholar] [CrossRef] [PubMed]
- Cutti, A.G.; Verni, G.; Migliore, G.L.; Amoresano, A.; Raggi, M. Reference values for gait temporal and loading symmetry of lower-limb amputees can help in refocusing rehabilitation targets. J. Neuroeng. Rehabil. 2018, 15, 61. [Google Scholar] [CrossRef] [Green Version]
- Rutkowska-Kucharska, A.; Kowal, M.; Winiarski, S. Relationship between Asymmetry of Gait and Muscle Torque in Patients after Unilateral Transfemoral Amputation. Appl. Bionics Biomech. 2018, 2018, 5190816. [Google Scholar] [CrossRef]
- Loiret, I.; Villa, C.; Dauriac, B.; Bonnet, X.; Martinet, N.; Paysant, J.; Pillet, H. Are wearable insoles a validated tool for quantifying transfemoral amputee gait asymmetry? Prosthet. Orthot. Int. 2019, 43, 492–499. [Google Scholar] [CrossRef]
- Varrecchia, T.; Serrao, M.; Rinaldi, M.; Ranavolo, A.; Conforto, S.; De Marchis, C.; Simonetti, A.; Poni, I.; Castellano, S.; Silvetti, A.; et al. Common and specific gait patterns in people with varying anatomical levels of lower limb amputation and different prosthetic components. Hum. Mov. Sci. 2019, 66, 9–21. [Google Scholar] [CrossRef]
- Sanderson, D.J.; Martin, P.E. Lower extremity kinematic and kinetic adaptations in unilateral below-knee amputees during walking. Gait Posture 1997, 6, 126–136. [Google Scholar] [CrossRef]
- Mattes, S.J.; Martin, P.E.; Royer, T.D. Walking symmetry and energy cost in persons with unilateral transtibial amputations: Matching prosthetic and intact limb inertial properties. Arch. Phys. Med. Rehabil. 2000, 81, 561–568. [Google Scholar] [CrossRef]
- Castro, M.P.; Soares, D.; Mendes, E.; Machado, L. Plantar pressures and ground reaction forces during walking of individuals with unilateral transfemoral amputation. PM R J. Inj. Funct. Rehabil. 2014, 6, 698–707.e1. [Google Scholar] [CrossRef]
- Barr, J.B.; Wutzke, C.J.; Threlkeld, A.J. Longitudinal gait analysis of a person with a transfemoral amputation using three different prosthetic knee/foot pairs. Physiother. Theory Pract. 2012, 28, 407–411. [Google Scholar] [CrossRef] [PubMed]
- Hak, L.; van Dieën, J.H.; van der Wurff, P.; Houdijk, H. Stepping asymmetry among individuals with unilateral transtibial limb loss might be functional in terms of gait stability. Phys. Ther. 2014, 94, 1480–1488. [Google Scholar] [CrossRef] [Green Version]
- Jaegers, S.M.; Arendzen, J.H.; de Jongh, H.J. An electromyographic study of the hip muscles of transfemoral amputees in walking. Clin. Orthop. Relat. Res. 1996, 328, 119–128. [Google Scholar] [CrossRef]
- Hermodsson, Y.; Ekdahl, C.; Persson, B.M.; Roxendal, G. Standing balance in trans-tibial amputees following vascular disease or trauma: A comparative study with healthy subjects. Prosthet. Orthot. Int. 1994, 18, 150–158. [Google Scholar] [CrossRef] [Green Version]
- Goujon, H.; Bonnet, X.; Sautreuil, P.; Maurisset, M.; Darmon, L.; Fode, P.; Lavaste, F. A functional evaluation of prosthetic foot kinematics during lower-limb amputee gait. Prosthet. Orthot. Int. 2006, 30, 213–223. [Google Scholar] [CrossRef]
- Baum, B.S.; Schnall, B.L.; Tis, J.E.; Lipton, J.S. Correlation of residual limb length and gait parameters in amputees. Injury 2008, 39, 728–733. [Google Scholar] [CrossRef]
- Chow, D.H.; Holmes, A.D.; Lee, C.K.; Sin, S.W. The effect of prosthesis alignment on the symmetry of gait in subjects with unilateral transtibial amputation. Prosthet. Orthot. Int. 2006, 30, 114–128. [Google Scholar] [CrossRef]
- Asano, M.; Rushton, P.; Miller, W.C.; Deathe, B.A. Predictors of quality of life among individuals who have a lower limb amputation. Prosthet. Orthot. Int. 2008, 32, 231–243. [Google Scholar] [CrossRef] [Green Version]
- Gailey, R.; Allen, K.; Castles, J.; Kucharik, J.; Roeder, M. Review of secondary physical conditions associated with lower-limb amputation and long-term prosthesis use. J. Rehabil. Res. Dev. 2008, 45, 15–29. [Google Scholar] [CrossRef]
- Morgenroth, D.C.; Gellhorn, A.C.; Suri, P. Osteoarthritis in the Disabled Population: A Mechanical Perspective. PMR 2012, 4, S20–S27. [Google Scholar] [CrossRef]
- Casey, L.P.; Nicholas, F.T.; Nora, S. Patients receiving inpatient rehabilitation for lower limb orthopaedic conditions do much less physical activity than recommended in guidelines for healthy older adults: An observational study. J. Physiother. 2013, 59, 39–44. [Google Scholar] [CrossRef] [Green Version]
- Struyf, P.A.; van Heugten, C.M.; Hitters, M.W.; Smeets, R.J. The prevalence of osteoarthritis of the intact hip and knee among traumatic leg amputees. Arch. Phys. Med. Rehabil. 2009, 90, 440–446. [Google Scholar] [CrossRef]
- Winter, D.A.; Sienko, S.E. Biomechanics of below-knee amputee gait. J. Biomech. 1988, 21, 361–367. [Google Scholar] [CrossRef]
- Engsberg, J.R.; Lee, A.G.; Tedford, K.G.; Harder, J.A. Normative ground reaction force data for able-bodied and below-knee-amputee children during walking. J. Pediatr. Orthop. 1993, 13, 169–173. [Google Scholar]
- Sagawa, Y.; Turcot, K.; Armand, S.; Thevenon, A.; Vuillerme, N.; Watelain, E. Biomechanics and physiological parameters during gait in lower-limb amputees: A systematic review. Gait Posture 2011, 33, 511–526. [Google Scholar] [CrossRef]
- Kastner, J.W.P. Angewandte Ganganalyse in der Rehabilitation. Med. Orth. Tech. Gentner Verl. Stuttg. 1997, 117, 15–21. [Google Scholar]
- Perry, J. Normal Gait. In Atlas of Limb Prosthetics: Surgical, Prosthetic, and Rehabilitation Principles, 3rd ed.; Bowker, J., Surgeons, A., Eds.; Mosby: St. Louis, MO, USA, 2002. [Google Scholar]
- Beck, R.J.; Andriacchi, T.P.; Kuo, K.N.; Fermier, R.W.; Galante, J.O. Changes in the gait patterns of growing children. J. Bone Jt. Surg. Am. Vol. 1981, 63, 1452–1457. [Google Scholar] [CrossRef]
- Aloba, A.; Luc, A.; Woodward, J.; Dong, Y.; Zhang, R.; Jain, E.; Anthony, L. Quantifying Differences Between Child and Adult Motion Based on Gait Features. In Proceedings of the Universal Access in Human-Computer Interaction. Multimodality and Assistive Environments, Orlando, FL, USA, 26–31 July 2019; pp. 385–402. [Google Scholar]
- Bieringer, S.; Sibbel, B.; Kokegei, D. Exoskelettale Prothesen der unteren Extremität. Orthopädie Und Unf. Up2date 2007, 2, 353–376. [Google Scholar] [CrossRef]
- Greitemann, B. Amputationen am Fuß. Orthopädie Und Unf. Up2date 2016, 11, 121–135. [Google Scholar] [CrossRef]
- Greitemann, B.; Brückner, L.; Schäfer, M.; Baumgartner, R. Amputation und Prothesenversorgung; Auflage Thieme Verlagsgruppe: Stuttgart, Germany; New York, NY, USA; Delhi, India; Rio, Brazil, 2016. [Google Scholar] [CrossRef]
- Behr, J.; Friedly, J.; Molton, I.; Morgenroth, D.; Jensen, M.P.; Smith, D.G. Pain and pain-related interference in adults with lower-limb amputation: Comparison of knee-disarticulation, transtibial, and transfemoral surgical sites. J. Rehabil. Res. Dev. 2009, 46, 963–972. [Google Scholar] [CrossRef] [PubMed]
- Caroline, E.R.; John, B.; Garry, T.A. Predictors of non-use of prostheses by people with lower limb amputation after discharge from rehabilitation: Development and validation of clinical prediction rules. J. Physiother. 2014, 60, 224–231. [Google Scholar] [CrossRef] [Green Version]
| HDA (n = 9) | TFA (n = 222) | KDA (n = 48) | TTA (n = 208) | FA (n = 49) | NORM (n = 201) | ||||||||
|---|---|---|---|---|---|---|---|---|---|---|---|---|---|
| Age | mean ± SD | 35.13 | ±12.46 | 44.31 | ±11.07 | 41.63 | ±12.42 | 43.64 | ±12.08 | 42.89 | ±11.59 | 33.94 | ±12.94 |
| 95% CI | 24.71 | 45.54 | 42.82 | 45.79 | 37.94 | 45.32 | 41.95 | 45.33 | 39.45 | 46.33 | 32.17 | 35.71 | |
| min-max | 17 | 49 | 16 | 60 | 16 | 60 | 16 | 60 | 16 | 59 | 16 | 60 | |
| Walking speed ** | mean ± SD | 55.62 | ±13.87 | 66.15 | ±8.80 | 70.34 | ±8.89 | 69.53 | ±10.29 | 67.40 | ±11.73 | 76.23 | ±7.90 |
| (m/min) | 95% CI | 44.03 | 67.22 | 64.97 | 67.34 | 67.70 | 72.98 | 68.09 | 70.97 | 63.92 | 70.89 | 75.15 | 77.32 |
| median | 52.61 | 66.05 | 70.23 | 68.85 | 66.00 | 76.28 | |||||||
| min-max | 39.69 | 79.08 | 41.75 | 89.65 | 52.57 | 96.37 | 39.13 | 98.80 | 46.58 | 103.20 | 55.66 | 100.92 | |
| Cadence ** | mean ± SD | 87.7095 | ±19.4387 | 100.7493 | ±9.4313 | 105.0909 | ±7.9803 | 103.7823 | ±9.4822 | 103.7325 | ±11.0224 | 112.2100 | ±8.6769 |
| (1/min) | 95% CI | 71.4583 | 103.9606 | 99.4815 | 102.0172 | 102.7210 | 107.4607 | 102.4568 | 105.1079 | 100.4592 | 107.0058 | 111.0238 | 113.3961 |
| median | 83.5410 | 101.4885 | 105.6078 | 103.8062 | 102.7089 | 112.4227 | |||||||
| min-max | 63.5055 | 119.0476 | 72.4813 | 122.7496 | 87.2995 | 122.0504 | 68.1818 | 135.0193 | 81.8889 | 131.9261 | 88.1597 | 141.9558 | |
| Step width (m) ** | mean ± SD | 0.1565 | ±0.0209 | 0.1651 | ±0.0350 | 0.1503 | ±0.0345 | 0.1299 | ±0.0286 | 0.1293 | ±0.0310 | 0.0921 | ±0.0251 |
| 95% CI | 0.1390 | 0.1741 | 0.1604 | 0.1698 | 0.1400 | 0.1605 | 0.1259 | 0.1339 | 0.1201 | 0.1385 | 0.0887 | 0.0956 | |
| median | 0.1591 | 0.1646 | 0.1435 | 0.1274 | 0.1213 | 0.0915 | |||||||
| min-max | 0.1250 | 0.1856 | 0.0792 | 0.2970 | 0.0875 | 0.2424 | 0.0499 | 0.2190 | 0.0785 | 0.2185 | 0.0271 | 0.1631 | |
| Stance time (s) ** | mean ± SD | 1.0047 | ±0.2642 | 0.8070 | ±0.1026 | 0.7581 | ±0.0708 | 0.7704 | ±0.0853 | 0.7718 | ±0.0952 | 0.6819 | ±0.0599 |
| intact limb | 95% CI | 0.7839 | 1.2256 | 0.7932 | 0.8208 | 0.7371 | 0.7791 | 0.7585 | 0.7823 | 0.7435 | 0.8001 | 0.6737 | 0.6901 |
| median | 1.0283 | 0.7832 | 0.7489 | 0.7607 | 0.7698 | 0.6768 | |||||||
| min-max | 0.6520 | 1.4208 | 0.6276 | 1.1860 | 0.6204 | 0.9531 | 0.5744 | 1.1618 | 0.5836 | 0.9920 | 0.5063 | 0.8834 | |
| Stance time (s) ** | mean ± SD | 0.8309 | ±0.1880 | 0.7157 | ±0.0780 | 0.7054 | ±0.0647 | 0.7301 | ±0.0767 | 0.7373 | ±0.0831 | 0.6833 | ±0.0603 |
| amp. limb | 95% CI | 0.6737 | 0.9881 | 0.7052 | 0.7262 | 0.6861 | 0.7246 | 0.7194 | 0.7409 | 0.7127 | 0.7620 | 0.6751 | 0.6916 |
| median | 0.8467 | 0.7024 | 0.6973 | 0.7196 | 0.7407 | 0.6773 | |||||||
| min-max | 0.5644 | 1.1244 | 0.5713 | 1.0124 | 0.5836 | 0.9196 | 0.5508 | 1.0553 | 0.5748 | 0.9710 | 0.4987 | 0.8766 | |
| Stance time (s) ** | mean ± SD | 0.1738 | ±0.0791 | 0.0952 | ±0.0495 | 0.0533 | ±0.0292 | 0.0432 | ±0.0273 | 0.0410 | ±0.0317 | 0.0076 | ±0.0059 |
| diff. | 95% CI | 0.1077 | 0.2399 | 0.0886 | 0.1019 | 0.0447 | 0.0620 | 0.0394 | 0.0471 | 0.0316 | 0.0504 | 0.0068 | 0.0084 |
| median | 0.1816 | 0.0898 | 0.0555 | 0.0382 | 0.0336 | 0.0062 | |||||||
| min-max | 0.0831 | 0.2964 | 0.0173 | 0.2580 | 0.0003 | 0.1204 | 0.0006 | 0.1492 | 0.0022 | 0.1530 | 0.0000 | 0.0280 | |
| Weight-acceptance ** | mean ± SD | 1.1531 | ±0.1291 | 1.1151 | ±0.0997 | 1.1084 | ±0.1080 | 1.1343 | ±0.0864 | 1.2036 | ±0.1369 | 1.1162 | ±0.0702 |
| peak (intact limb) | 95% CI | 1.0451 | 1.2610 | 1.1017 | 1.1285 | 1.0763 | 1.1405 | 1.1222 | 1.1464 | 1.1629 | 1.2442 | 1.1066 | 1.1258 |
| median | 1.0991 | 1.1153 | 1.0968 | 1.1247 | 1.1661 | 1.1099 | |||||||
| min-max | 1.0558 | 1.4027 | 0.8761 | 1.4013 | 0.9307 | 1.4258 | 0.9364 | 1.4288 | 0.9591 | 1.6149 | 0.9971 | 1.3307 | |
| Weight-acceptance ** | mean ± SD | 1.1552 | ±0.0891 | 1.0632 | ±0.0850 | 1.0807 | ±0.0725 | 1.0607 | ±0.0709 | 1.0980 | ±0.0904 | 1.1200 | ±0.0691 |
| peak (amp. limb) | 95% CI | 1.0807 | 1.2297 | 1.0517 | 1.0746 | 1.0592 | 1.1022 | 1.0508 | 1.0707 | 1.0712 | 1.1249 | 1.1106 | 1.1295 |
| median | 1.1415 | 1.0468 | 1.0802 | 1.0529 | 1.0784 | 1.1093 | |||||||
| min-max | 1.0619 | 1.3083 | 0.8487 | 1.4693 | 0.9478 | 1.2527 | 0.9130 | 1.3253 | 0.9664 | 1.4150 | 0.9955 | 1.3267 | |
| Weight-acceptance ** | mean ± SD | 0.0604 | ±0.0572 | 0.1006 | ±0.0805 | 0.0905 | ±0.0706 | 0.0921 | ±0.0696 | 0.1298 | ±0.0930 | 0.0268 | ±0.0193 |
| peak (diff.) | 95% CI | 0.0126 | 0.1082 | 0.0897 | 0.1114 | 0.0695 | 0.1114 | 0.0824 | 0.1018 | 0.1022 | 0.1575 | 0.0241 | 0.0294 |
| median | 0.0483 | 0.0860 | 0.0749 | 0.0763 | 0.1159 | 0.0229 | |||||||
| min-max | 0.0047 | 0.1588 | 0.0007 | 0.3974 | 0.0003 | 0.2822 | 0.0013 | 0.3198 | 0.0095 | 0.3921 | 0.0000 | 0.1000 | |
| Push-off peak ** | mean ± SD | 0.9924 | ±0.0755 | 1.0842 | ±0.0722 | 1.1130 | ±0.0805 | 1.0673 | ±0.0811 | 1.0653 | ±0.0683 | 1.1078 | ±0.0588 |
| (intact limb) | 95% CI | 0.9293 | 1.0555 | 1.0745 | 1.0939 | 1.0891 | 1.1369 | 1.0559 | 1.0786 | 1.0450 | 1.0856 | 1.0998 | 1.1159 |
| median | 1.0012 | 1.0736 | 1.1002 | 1.0557 | 1.0566 | 1.1035 | |||||||
| min-max | 0.8970 | 1.1183 | 0.9442 | 1.3314 | 0.9682 | 1.3044 | 0.9005 | 1.4026 | 0.9537 | 1.2420 | 0.9254 | 1.4044 | |
| Push-off peak ** | mean ± SD | 1.0440 | ±0.0793 | 0.9925 | ±0.0472 | 1.0064 | ±0.0457 | 0.9858 | ±0.0555 | 0.9972 | ±0.0653 | 1.1080 | ±0.0569 |
| (amp. limb) | 95% CI | 0.9777 | 1.1103 | 0.9862 | 0.9989 | 0.9928 | 1.0200 | 0.9781 | 0.9936 | 0.9779 | 1.0166 | 1.1003 | 1.1158 |
| median | 1.0251 | 0.9910 | 1.0084 | 0.9760 | 0.9891 | 1.1004 | |||||||
| min-max | 0.9613 | 1.2235 | 0.8003 | 1.1826 | 0.9155 | 1.1151 | 0.8540 | 1.1898 | 0.9038 | 1.1748 | 0.9840 | 1.3888 | |
| Push-off peak ** | mean ± SD | 0.0797 | ±0.0905 | 0.0993 | ±0.0675 | 0.1106 | ±0.0779 | 0.0941 | ±0.0649 | 0.0876 | ±0.0626 | 0.0199 | ±0.0149 |
| (diff.) | 95% CI | 0.0040 | 0.1553 | 0.0903 | 0.1084 | 0.0875 | 0.1338 | 0.0850 | 0.1032 | 0.0690 | 0.1062 | 0.0178 | 0.0219 |
| median | 0.0472 | 0.0900 | 0.0929 | 0.0827 | 0.0865 | 0.0152 | |||||||
| min-max | 0.0068 | 0.2814 | 0.0017 | 0.3546 | 0.0027 | 0.2789 | 0.0001 | 0.3410 | 0.0060 | 0.3316 | 0.0000 | 0.0875 | |
| Step length (m) ** | mean ± SD | 0.6255 | ±0.0363 | 0.6442 | ±0.0524 | 0.6619 | ±0.0557 | 0.6649 | ±0.0605 | 0.6272 | ±0.0670 | 0.6778 | ±0.0375 |
| intact limb | 95% CI | 0.5952 | 0.6559 | 0.6372 | 0.6513 | 0.6453 | 0.6784 | 0.6564 | 0.6733 | 0.6073 | 0.6471 | 0.6726 | 0.6829 |
| median | 0.6303 | 0.6457 | 0.6650 | 0.6615 | 0.6153 | 0.6760 | |||||||
| min-max | 0.5496 | 0.6665 | 0.5161 | 0.7992 | 0.5387 | 0.8464 | 0.5070 | 0.9126 | 0.5195 | 0.8636 | 0.5797 | 0.8103 | |
| Step length (m) ** | mean ± SD | 0.6373 | ±0.0319 | 0.6573 | ±0.0508 | 0.6710 | ±0.0668 | 0.6689 | ±0.0615 | 0.6653 | ±0.0611 | 0.6789 | ±0.0380 |
| amp. limb | 95% CI | 0.6106 | 0.6640 | 0.6504 | 0.6641 | 0.6512 | 0.6909 | 0.6603 | 0.6775 | 0.6471 | 0.6834 | 0.6737 | 0.6841 |
| median | 0.6408 | 0.6572 | 0.6698 | 0.6675 | 0.6617 | 0.6756 | |||||||
| min-max | 0.5960 | 0.6830 | 0.5423 | 0.8664 | 0.5280 | 0.8843 | 0.5363 | 0.8344 | 0.5597 | 0.9021 | 0.5872 | 0.8237 | |
| Step length (m) ** | mean ± SD | 0.0392 | 0.0168 | 0.0477 | 0.0334 | 0.0456 | 0.0283 | 0.0392 | 0.0278 | 0.0528 | 0.0390 | 0.0173 | 0.0133 |
| diff. | 95% CI | 0.0252 | 0.0533 | 0.0432 | 0.0522 | 0.0372 | 0.0540 | 0.0353 | 0.0431 | 0.0412 | 0.0644 | 0.0155 | 0.0192 |
| median | 0.0447 | 0.0404 | 0.0440 | 0.0331 | 0.0470 | 0.0147 | |||||||
| min-max | 0.0097 | 0.0552 | 0.0004 | 0.1549 | 0.0009 | 0.1059 | 0.0000 | 0.1287 | 0.0021 | 0.1544 | 0.0001 | 0.0539 | |
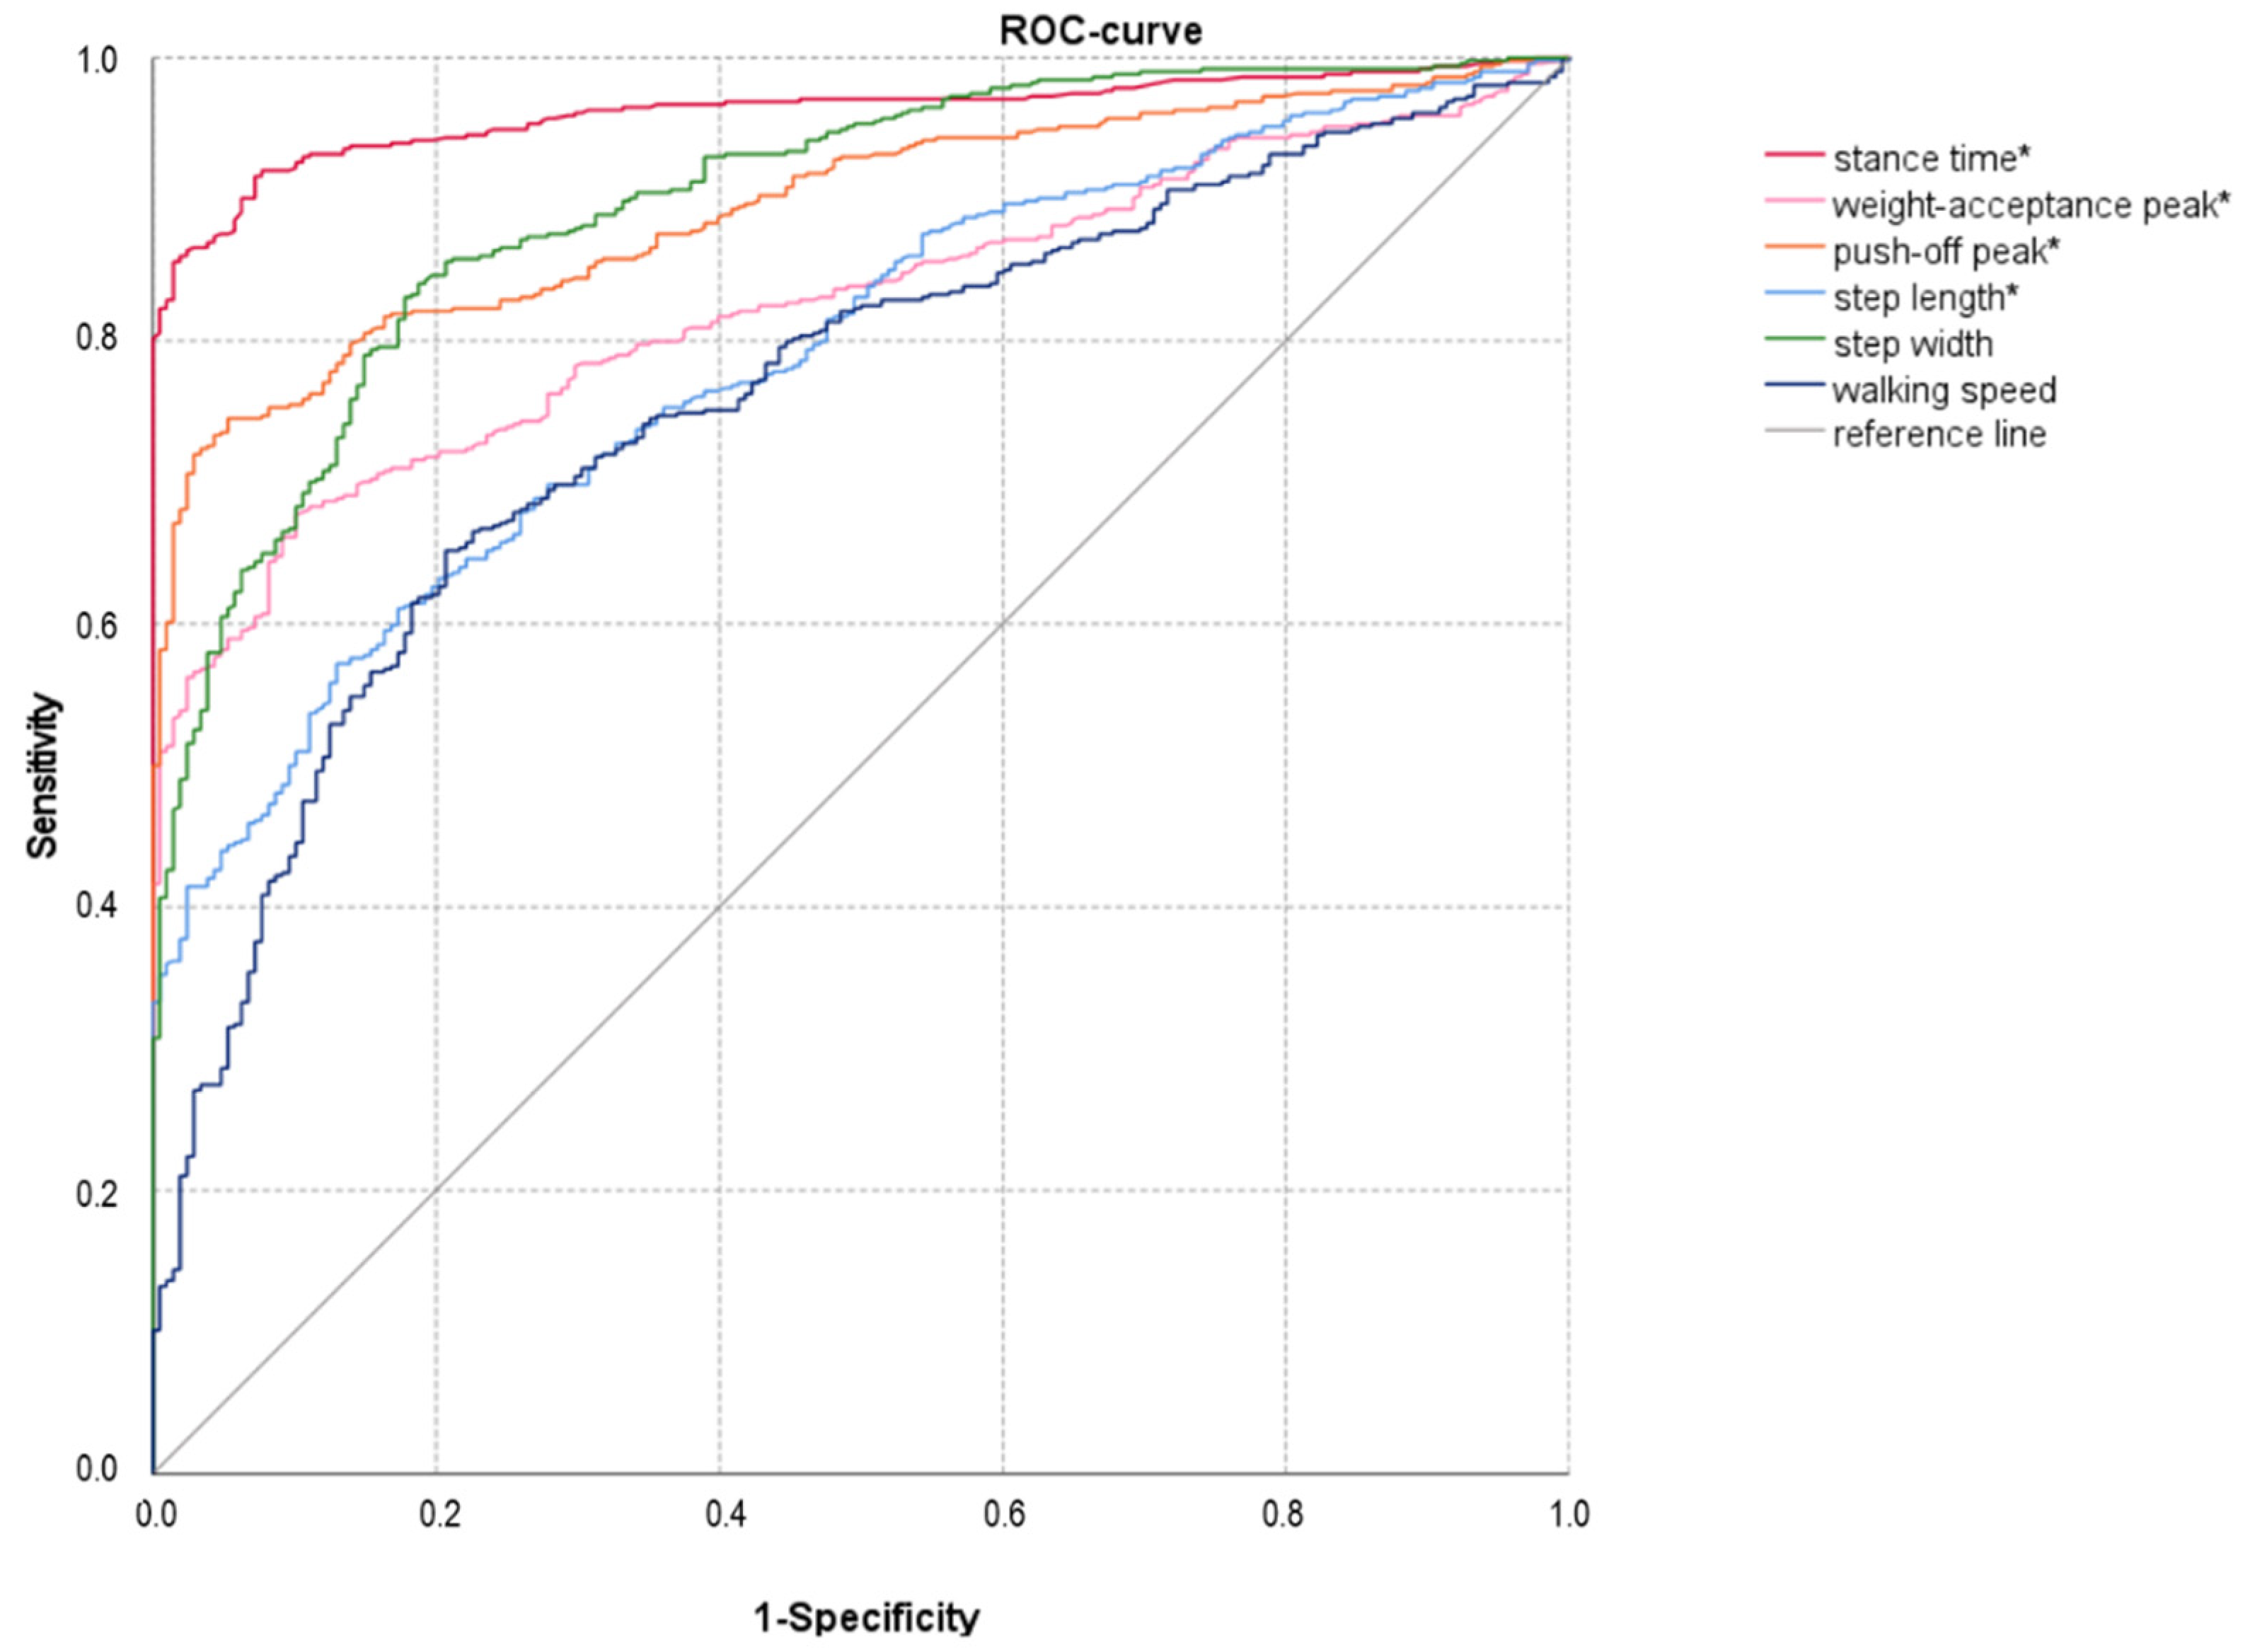
| (A) | Variable | B | SE | β | t | p |
| patients | (constant) | 70.69 | 1.66 | 47.71 | <0.001 | |
| stance time * | −86.17 | 8.3 | −0.405 | −10.39 | <0.001 | |
| weight−acceptance peak * | 10.55 | 4.94 | 0.083 | 2.14 | 0.033 | |
| push−off peak * | 47.91 | 5.69 | 0.327 | 8.42 | <0.001 | |
| controls | (constant) | 75.9 | 2.49 | 30.51 | <0.001 | |
| push−off peak * | 113.13 | 36.32 | 0.213 | 3.11 | 0.002 | |
| (B) | AUC | SE | p | CI | ||
| Lower | Upper | |||||
| stance time * [s] | 0.962 | 0.007 | 0.000 | 0.948 | 0.975 | |
| weight acceptance peak * | 0.824 | 0.015 | 0.000 | 0.795 | 0.853 | |
| push−off peak * | 0.894 | 0.011 | 0.000 | 0.871 | 0.916 | |
| step length * [m] | 0.786 | 0.017 | 0.000 | 0.753 | 0.819 | |
| walking speed [m/min] | 0.757 | 0.019 | 0.000 | 0.721 | 0.794 | |
| step width [m] | 0.897 | 0.012 | 0.000 | 0.874 | 0.92 | |
| TFA (n = 36) | KDA (n = 6) | TTA (n = 54) | FA (n = 5) | NORM (n = 6) | |||||||
|---|---|---|---|---|---|---|---|---|---|---|---|
| Age | mean ± SD | 67.53 | ±4.62 | 67.00 | ±6.48 | 67.96 | ±5.87 | 71.00 | ±4.24 | 65.00 | ±2.16 |
| 95% CI | 65.92 | 69.14 | 60.20 | 73.80 | 66.27 | 69.64 | 32.88 | 109.12 | 61.56 | 68.44 | |
| median | 67 | 63.5 | 67 | 71 | 65.5 | ||||||
| min−max | 61 | 78 | 63 | 79 | 61 | 83 | 68 | 74 | 62 | 67 | |
| Walking speed | mean ± SD | 55.03 | ±8.77 ** | 62.18 | ±7.77 | 58.70 | ±8.43 ** | 58.19 | ±0.59 | 69.56 | ±2.43 |
| (m/min) | 95% CI | 51.97 | 58.09 | 54.03 | 70.34 | 56.28 | 61.12 | 52.93 | 63.45 | 65.69 | 73.44 |
| median | 56.65 | 64.19 | 59.66 | 58.19 | 69.95 | ||||||
| min−max | 35.51 | 69.09 | 48.56 | 69.75 | 38.80 | 76.70 | 57.77 | 58.60 | 66.26 | 72.09 | |
| Cadence | mean ± SD | 90.8833 | ±11.0952 ** | 96.4483 | ±9.5907 | 95.4255 | ±9.5375 | 97.2344 | ±3.0366 | 112.9120 | ±5.2382 |
| (1/min) | 95% CI | 87.0120 | 94.7546 | 86.3835 | 106.5131 | 92.6860 | 98.1650 | 69.9516 | 124.5172 | 104.5769 | 121.2471 |
| median | 92.0238 | 98.2322 | 96.6270 | 97.2344 | 111.3532 | ||||||
| min−max | 63.2022 | 110.8647 | 79.2602 | 107.2194 | 70.8343 | 111.9299 | 95.0872 | 99.3816 | 108.4599 | 120.4819 | |
| Step width (m) | mean ± SD | 0.1781 | ±0.0313 ** | 0.1783 | ±0.0291 | 0.1325 | ±0.0281 | 0.1410 | ±0.0001 | 0.1041 | ±0.0118 |
| 95% CI | 0.1672 | 0.1890 | 0.1478 | 0.2087 | 0.1244 | 0.1406 | 0.1404 | 0.1415 | 0.0853 | 0.1229 | |
| median | 0.1725 | 0.1792 | 0.1323 | 0.1410 | 0.1087 | ||||||
| min−max | 0.1214 | 0.2454 | 0.1397 | 0.2272 | 0.0700 | 0.1962 | 0.1409 | 0.1410 | 0.0867 | 0.1124 | |
| Stance time (s) | mean ± SD | 0.9245 | ±0.1566 ** | 0.8374 | ±0.1145 | 0.8373 | ±0.0987 | 0.7999 | ±0.0189 | 0.6753 | ±0.0427 |
| intact limb | 95% CI | 0.8698 | 0.9791 | 0.7172 | 0.9575 | 0.8089 | 0.8656 | 0.6298 | 0.9701 | 0.6075 | 0.7432 |
| median | 0.9018 | 0.8257 | 0.8124 | 0.7999 | 0.6816 | ||||||
| min−max | 0.6964 | 1.3756 | 0.7232 | 1.0236 | 0.7080 | 1.1600 | 0.7866 | 0.8133 | 0.6177 | 0.7204 | |
| Stance time (s) | mean ± SD | 0.7954 | ±0.1230 | 0.7730 | ±0.0782 | 0.7998 | ±0.0914 | 0.7923 | ±0.0199 | 0.6729 | ±0.0385 |
| amp. limb | 95% CI | 0.7525 | 0.8383 | 0.6910 | 0.8551 | 0.7736 | 0.8261 | 0.6134 | 0.9711 | 0.6116 | 0.7343 |
| median | 0.7818 | 0.7524 | 0.7893 | 0.7923 | 0.6767 | ||||||
| min−max | 0.6088 | 1.1596 | 0.6900 | 0.8976 | 0.6788 | 1.0916 | 0.7782 | 0.8063 | 0.6223 | 0.7160 | |
| Stance time (s) | mean ± SD | 0.1291 | ±0.0606 | 0.0975 | ±0.0357 | 0.0399 | ±0.0245 | 0.0077 | ±0.0010 | 0.0047 | ±0.0014 |
| diff. | 95% CI | 0.1079 | 0.1502 | 0.0601 | 0.1349 | 0.0328 | 0.0469 | −0.0010 | 0.0164 | 0.0025 | 0.0069 |
| median | 0.1181 | 0.1086 | 0.0360 | 0.0077 | 0.0045 | ||||||
| min−max | 0.0320 | 0.3128 | 0.0332 | 0.1260 | 0.0028 | 0.0916 | 0.0070 | 0.0084 | 0.0033 | 0.0065 | |
| Weight−acceptance | mean ± SD | 1.0618 | ±0.0946 | 1.0866 | ±0.0966 | 1.0831 | ±0.0914 | 1.1082 | ±0.0142 | 1.0863 | ±0.0363 |
| peak (intact limb) | 95% CI | 1.0288 | 1.0948 | 0.9852 | 1.1880 | 1.0569 | 1.1094 | 0.9805 | 1.2358 | 1.0286 | 1.1440 |
| median | 1.0280 | 1.0921 | 1.0622 | 1.1082 | 1.0868 | ||||||
| min−max | 0.9630 | 1.3374 | 0.9667 | 1.1798 | 0.8745 | 1.3413 | 1.0981 | 1.1182 | 1.0506 | 1.1212 | |
| Weight−acceptance | mean ± SD | 1.0440 | ±0.0695 | 1.0610 | ±0.0687 | 1.0576 | ±0.0584 | 1.0374 | ±0.0042 | 1.0983 | ±0.0426 |
| peak (amp. limb) | 95% CI | 1.0197 | 1.0682 | 0.9890 | 1.1331 | 1.0408 | 1.0743 | 0.9993 | 1.0755 | 1.0306 | 1.1660 |
| median | 1.0374 | 1.0269 | 1.0641 | 1.0374 | 1.0962 | ||||||
| min−max | 0.9122 | 1.2084 | 0.9971 | 1.1620 | 0.9233 | 1.2258 | 1.0344 | 1.0404 | 1.0484 | 1.1524 | |
| Weight−acceptance | mean ± SD | 0.0741 | ±0.0709 | 0.0961 | ±0.0855 | 0.0608 | ±0.0573 ** | 0.0708 | ±0.0100 | 0.0228 | ±0.0157 |
| peak (diff.) | 95% CI | 0.0493 | 0.0989 | 0.0064 | 0.1859 | 0.0444 | 0.0773 | −0.0188 | 0.1603 | −0.0023 | 0.0478 |
| median | 0.0504 | 0.0931 | 0.0417 | 0.0708 | 0.0253 | ||||||
| min−max | 0.0021 | 0.2874 | 0.0070 | 0.1954 | 0.0001 | 0.2515 | 0.0637 | 0.0778 | 0.0022 | 0.0382 | |
| Push−off peak | mean ± SD | 1.0535 | ±0.0512 ** | 1.0319 | ±0.0737 | 1.0189 | ±0.0528 | 1.0252 | ±0.0493 | 1.0445 | ±0.0635 |
| (intact limb) | 95% CI | 1.0357 | 1.0714 | 0.9546 | 1.1092 | 1.0037 | 1.0341 | 0.5818 | 1.4686 | 0.9435 | 1.1456 |
| median | 1.0462 | 1.0106 | 1.0221 | 1.0252 | 1.0282 | ||||||
| min−max | 0.9824 | 1.1912 | 0.9574 | 1.1362 | 0.9221 | 1.1283 | 0.9903 | 1.0601 | 0.9873 | 1.1345 | |
| Push−off peak | mean ± SD | 0.9834 | ±0.0443 | 0.9924 | ±0.0438 | 0.9845 | ±0.0423 | 0.9387 | ±0.0429 | 1.0554 | ±0.0466 |
| (amp. limb) | 95% CI | 0.9679 | 0.9988 | 0.9464 | 1.0385 | 0.9723 | 0.9966 | 0.5537 | 1.3237 | 0.9813 | 1.1295 |
| median | 0.9888 | 0.9908 | 0.9831 | 0.9387 | 1.0440 | ||||||
| min−max | 0.8647 | 1.1115 | 0.9225 | 1.0477 | 0.8589 | 1.0731 | 0.9084 | 0.9690 | 1.0143 | 1.1194 | |
| Push−off peak | mean ± SD | 0.0712 | ±0.0595 | 0.0648 | ±0.0510 | 0.0502 | ±0.0388 ** | 0.0865 | ±0.0065 | 0.0229 | ±0.0140 |
| (diff.) | 95% CI | 0.0504 | 0.0920 | 0.0113 | 0.1183 | 0.0390 | 0.0613 | 0.0281 | 0.1449 | 0.0007 | 0.0451 |
| median | 0.0640 | 0.0797 | 0.0432 | 0.0865 | 0.0211 | ||||||
| min−max | 0.0004 | 0.2350 | 0.0009 | 0.1210 | 0.0015 | 0.1514 | 0.0819 | 0.0911 | 0.0090 | 0.0406 | |
| Step length (m) | mean ± SD | 0.5864 | ±0.0569 ** | 0.6599 | ±0.0618 | 0.6133 | ±0.0423 | 0.5877 | ±0.0332 | 0.6164 | ±0.0111 |
| intact limb | 95% CI | 0.5665 | 0.6062 | 0.5950 | 0.7248 | 0.6012 | 0.6255 | 0.2898 | 0.8856 | 0.5988 | 0.6340 |
| median | 0.5926 | 0.6542 | 0.6088 | 0.5877 | 0.6134 | ||||||
| min−max | 0.4563 | 0.6970 | 0.5897 | 0.7444 | 0.5231 | 0.7359 | 0.5642 | 0.6111 | 0.6071 | 0.6315 | |
| Step length (m) | mean ± SD | 0.6121 | ±0.0502 | 0.6231 | ±0.0426 | 0.6123 | ±0.0554 | 0.6112 | ±0.0121 | 0.6172 | ±0.0353 |
| amp. limb | 95% CI | 0.5946 | 0.6297 | 0.5784 | 0.6677 | 0.5964 | 0.6282 | 0.5023 | 0.7201 | 0.5611 | 0.6733 |
| median | 0.6174 | 0.6435 | 0.6103 | 0.6112 | 0.6146 | ||||||
| min−max | 0.5176 | 0.7017 | 0.5437 | 0.6515 | 0.5001 | 0.7749 | 0.6027 | 0.6198 | 0.5868 | 0.6529 | |
| Step length (m) | mean ± SD | 0.0627 | ±0.0533 | 0.0707 | ±0.0699 | 0.0373 | ±0.0328 | 0.0320 | ±0.0333 | 0.0221 | ±0.0019 |
| diff. | 95% CI | 0.0440 | 0.0813 | −0.0027 | 0.1440 | 0.0278 | 0.0467 | −0.2675 | 0.3316 | 0.0191 | 0.0252 |
| median | 0.0491 | 0.0488 | 0.0289 | 0.0320 | 0.0219 | ||||||
| min−max | 0.0016 | 0.2053 | 0.0039 | 0.1735 | 0.0007 | 0.1447 | 0.0084 | 0.0556 | 0.0201 | 0.0246 | |
Publisher’s Note: MDPI stays neutral with regard to jurisdictional claims in published maps and institutional affiliations. |
© 2022 by the authors. Licensee MDPI, Basel, Switzerland. This article is an open access article distributed under the terms and conditions of the Creative Commons Attribution (CC BY) license (https://creativecommons.org/licenses/by/4.0/).
Share and Cite
Schmid-Zalaudek, K.; Fischer, T.; Száva, Z.; Lackner, H.K.; Kropiunig, U.; Bittner, C.; Höcker, K.; Winkler, G.; Peternell, G. Kinetic Gait Parameters in Unilateral Lower Limb Amputations and Normal Gait in Able-Bodied: Reference Values for Clinical Application. J. Clin. Med. 2022, 11, 2683. https://doi.org/10.3390/jcm11102683
Schmid-Zalaudek K, Fischer T, Száva Z, Lackner HK, Kropiunig U, Bittner C, Höcker K, Winkler G, Peternell G. Kinetic Gait Parameters in Unilateral Lower Limb Amputations and Normal Gait in Able-Bodied: Reference Values for Clinical Application. Journal of Clinical Medicine. 2022; 11(10):2683. https://doi.org/10.3390/jcm11102683
Chicago/Turabian StyleSchmid-Zalaudek, Karin, Theresa Fischer, Zoltán Száva, Helmut Karl Lackner, Ursula Kropiunig, Christian Bittner, Karl Höcker, Günther Winkler, and Gerfried Peternell. 2022. "Kinetic Gait Parameters in Unilateral Lower Limb Amputations and Normal Gait in Able-Bodied: Reference Values for Clinical Application" Journal of Clinical Medicine 11, no. 10: 2683. https://doi.org/10.3390/jcm11102683
APA StyleSchmid-Zalaudek, K., Fischer, T., Száva, Z., Lackner, H. K., Kropiunig, U., Bittner, C., Höcker, K., Winkler, G., & Peternell, G. (2022). Kinetic Gait Parameters in Unilateral Lower Limb Amputations and Normal Gait in Able-Bodied: Reference Values for Clinical Application. Journal of Clinical Medicine, 11(10), 2683. https://doi.org/10.3390/jcm11102683