
Clot Waveform Analysis Demonstrates Low Blood Coagulation Ability in Patients with Idiopathic Thrombocytopenic Purpura

 ,
,  ,
,
Abstract
:1. Introduction
2. Materials and Methods
Statistical Analyses
3. Results
4. Discussion
5. Conclusions
Author Contributions
Funding
Institutional Review Board Statement
Informed Consent Statement
Data Availability Statement
Acknowledgments
Conflicts of Interest
References
- Al-Samkari, H.; Kuter, D.J. Immune thrombocytopenia in adults: Modern approaches to diagnosis and treatment. Semin. Thromb. Hemost. 2020, 46, 275–288. [Google Scholar] [CrossRef] [PubMed]
- Terrell, D.R.; Neunert, C.E.; Cooper, N.; Heitink-Pollé, K.M.; Kruse, C.; Imbach, P.; Kühne, T.; Ghanima, W. Immune thrombocytopenia (ITP): Current limitations in patient management. Medicina 2020, 56, 667. [Google Scholar] [CrossRef]
- Miltiadous, O.; Hou, M.; Bussel, J.B. Identifying and treating refractory ITP: Difficulty in diagnosis and role of combination treatment. Blood 2020, 135, 472–490. [Google Scholar] [CrossRef]
- Bennett, J.; Brown, C.; Rouse, M.; Hoffmann, M.; Ye, Z. Immune thrombocytopenia purpura secondary to COVID-19. Cureus 2020, 12, e9083. [Google Scholar] [CrossRef] [PubMed]
- Wada, H.; Shiraki, K.; Matsumoto, T.; Ohishi, K.; Shimpo, H.; Shimaoka, M. Effects of platelet and phospholipids on clot formation activated by a small amount of tissue factor. Thromb. Res. 2020, 193, 146–153. [Google Scholar] [CrossRef] [PubMed]
- Wada, H.; Matsumoto, T.; Ohishi, K.; Shiraki, K.; Shimaoka, M. Update on the Clot Waveform Analysis. Clin. Appl. Thromb. Hemost. 2020, 26, 1076029620912027. [Google Scholar] [CrossRef] [PubMed]
- Shima, M.; Matsumoto, T.; Fukuda, K.; Kubota, Y.; Tanaka, I.; Nishiya, K.; Giles, A.R.; Yoshioka, A. The utility of activated partial thromboplastin time (aPTT) clot waveform analysis in the investigation of hemophilia A patients with very low levels of factor VIII activity (FVIII:C). Thromb. Haemost. 2002, 87, 436–441. [Google Scholar]
- Toh, C.H.; Samis, J.; Downey, C.; Walker, J.; Becker, L.; Brufatto, N.; Tejidor, L.; Jones, G.; Houdijk, W.; Giles, A.; et al. Biphasic transmittance waveform in the APTT coagulation assay is due to the formation of a Ca(++)-dependent complex of C-reactive protein with very-low-density lipoprotein and is a novel marker of impending disseminated intravascular coagulation. Blood 2002, 100, 2522–2529. [Google Scholar] [CrossRef] [PubMed]
- Matsumoto, T.; Nogami, K.; Shima, M. A combined approach using global coagulation assays quickly differentiates coagulation disorders with prolonged aPTT and low levels of FVIII activity. Int. J. Hematol. 2017, 105, 174–183. [Google Scholar] [CrossRef]
- Tokutake, T.; Baba, H.; Shimada, Y.; Takeda, W.; Sato, K.; Hiroshima, Y.; Kirihara, T.; Shimizu, I.; Nakazawa, H.; Kobayashi, H.; et al. Exogenous Magnesium Chloride Reduces the Activated Partial Thromboplastin Times of Lupus Anticoagulant-Positive Patients. PLoS ONE 2016, 11, e0157835. [Google Scholar]
- Matsumoto, T.; Wada, H.; Fujimoto, N.; Toyoda, J.; Abe, Y.; Ohishi, K.; Yamashita, Y.; Ikejiri, M.; Hasegawa, K.; Suzuki, K.; et al. An Evaluation of the Activated Partial Thromboplastin Time Waveform. Clin. Appl. Thromb. Hemost. 2018, 24, 764–770. [Google Scholar] [CrossRef] [PubMed]
- Suzuki, K.; Wada, H.; Matsumoto, T.; Ikejiri, M.; Ohishi, K.; Yamashita, Y.; Imai, H.; Iba, T.; Katayama, N. Usefulness of the APTT waveform for the diagnosis of DIC and prediction of the outcome or bleeding risk. Thromb. J. 2019, 17, 12. [Google Scholar] [CrossRef]
- Hasegawa, M.; Wada, H.; Tone, S.; Yamaguchi, T.; Wakabayashi, H.; Ikejiri, M.; Watanabe, M.; Fujimoto, N.; Matsumoto, T.; Ohishi, K.; et al. Monitoring of hemostatic abnormalities in major orthopedic surgery patients treated with edoxaban by APTT waveform. Int. J. Lab. Hematol. 2018, 40, 49–55. [Google Scholar] [CrossRef] [PubMed]
- Hasegawa, M.; Tone, S.; Wada, H.; Naito, Y.; Matsumoto, T.; Yamashita, Y.; Shimaoka, M.; Sudo, A. The evaluation of hemostatic abnormalities using a CWA-small amount tissue factor induced FIX activation assay in major orthopedic surgery patients. Clin. Appl. Thromb. Hemost. 2021, 27, 1076029620976913. [Google Scholar] [CrossRef] [PubMed]
- Maeda, K.; Wada, H.; Shinkai, T.; Tanemura, A.; Matsumoto, T.; Mizuno, S. Evaluation of hemostatic abnormalities in patients who underwent major hepatobiliary pancreatic surgery using activated partial thromboplastin time-clot waveform analysis. Thromb. Res. 2021, 201, 154–160. [Google Scholar] [CrossRef] [PubMed]
- Lambert, M.P.; Gernsheimer, T.B. Clinical updates in adult immune thrombocytopenia. Blood 2017, 129, 2829–2835. [Google Scholar] [CrossRef] [PubMed] [Green Version]
- Wada, H.; Ichikawa, Y.; Ezaki, E.; Matsumoto, T.; Yamashita, Y.; Shiraki, K.; Shimaoka, M.; Shimpo, H. The reevaluation of thrombin time using a clot waveform analysis. J. Clin. Med. 2021, 10, 4840. [Google Scholar] [CrossRef] [PubMed]
- Hicks, S.M.; Coupland, L.A.; Jahangiri, A.; Choi, P.Y.; Gardiner, E.E. Novel scientific approaches and future research directions in understanding ITP. Platelets 2020, 31, 315–321. [Google Scholar] [CrossRef] [PubMed]
- Berntorp, E.; Salvagno, G.L. Standardization and clinical utility of thrombin-generation assays. Semin. Thromb. Hemost. 2008, 34, 670–682. [Google Scholar] [CrossRef] [PubMed]
- Salvagno, G.L.; Berntorp, E. Thrombin generation testing for monitoring hemophilia treatment: A clinical perspective. Semin. Thromb. Hemost. 2010, 36, 780–790. [Google Scholar] [CrossRef]
- Poon, M.C. The Use of Recombinant Activated Factor VII in Patients with Glanzmann’s Thrombasthenia. Thromb. Haemost. 2021, 121, 332–340. [Google Scholar] [CrossRef] [PubMed]
- Brunet, J.G.; Sharma, T.; Tasneem, S.; Liang, M.; Wilson, M.D.; Rivard, G.E.; Hayward, C.P.M. Thrombin generation abnormalities in Quebec platelet disorder. Int. J. Lab. Hematol. 2020, 42, 801–809. [Google Scholar] [CrossRef] [PubMed]
- Gupta, G.K.; Hendrickson, J.E.; Bahel, P.; Siddon, A.J.; Rinder, H.M.; Tormey, C.A. Factor V activity in apheresis platelets: Implications for management of FV deficiency. Transfusion 2021, 61, 405–409. [Google Scholar] [CrossRef]
- Van Dijk, W.E.M.; Brandwijk, O.N.; Heitink-Polle, K.M.J.; Schutgens, R.E.G.; van Galen, K.P.M.; Urbanus, R.T. Hemostatic changes by thrombopoietin-receptor agonists in immune thrombocytopenia patients. Blood Rev. 2021, 47, 100774. [Google Scholar] [CrossRef] [PubMed]
- Garabet, L.; Ghanima, W.; Hellum, M.; Sandset, P.M.; Bussel, J.B.; Tran, H.; Henriksson, C.E. Increased microvesicle-associated thrombin generation in patients with immune thrombocytopenia after initiation of thrombopoietin receptor agonists. Platelets 2020, 31, 322–328. [Google Scholar] [CrossRef] [PubMed]
- Kobayashi, M.; Wada, H.; Fukui, S.; Mizutani, H.; Ichikawa, Y.; Shiraki, K.; Moritani, I.; Inoue, H.; Shimaoka, M.; Shimpo, H. A Clot Waveform Analysis Showing a Hypercoagulable State in Patients with Malignant Neoplasms. J. Clin. Med. 2021, 10, 5352. [Google Scholar] [CrossRef] [PubMed]

| n | Age (Years) | Sex | PLT (×1010/L) | D-Dimer (μg/mL) | APTT (Sec) | PT-INR | |
|---|---|---|---|---|---|---|---|
| ITP | 17 | 40 (30.0–59.0) | F, 9 M, 8 | 3.0 (1.1–4.2) | 0.5 (0.5–0.5) | 28.0 (28.0–30.3) | 0.96 (0.96–0.97) |
| Other thrombocytopenia | 38 | 75.0 *** (70.0–88.0) | F, 21 M, 17 | 5.3 ** (3.8–6.6) | 1.1 *** (0.8–3.3) | 33.5 (26.0–49.0) | 1.07 *** (0.97–1.27) |
| Without thrombocytopenia | 308 | 71.0 ***, ### (57.0–80.0) | F, 115 M, 193 | 19.2 ***, ### (14.2–25.0) | 1.4 *** (0.6–4.7) | 31.0 (28.0–34.0) | 1.02 ** (0.97–1.13) |
| 2nd DP | 1st DP | FF | 2nd DP | 1st DP | FF | |
|---|---|---|---|---|---|---|
| Healthy volunteers | 31.7 (31.1–32.9) | 34.3 (33.8–36.0) | 36.0 (35.6–38.2) | 77.5 (70.3–85.9) | 96.5 (89.3–108) | 95.4 (89.5–108) |
| platelet counts | CWA-APTT | CWA-sTF/FIXa | ||||
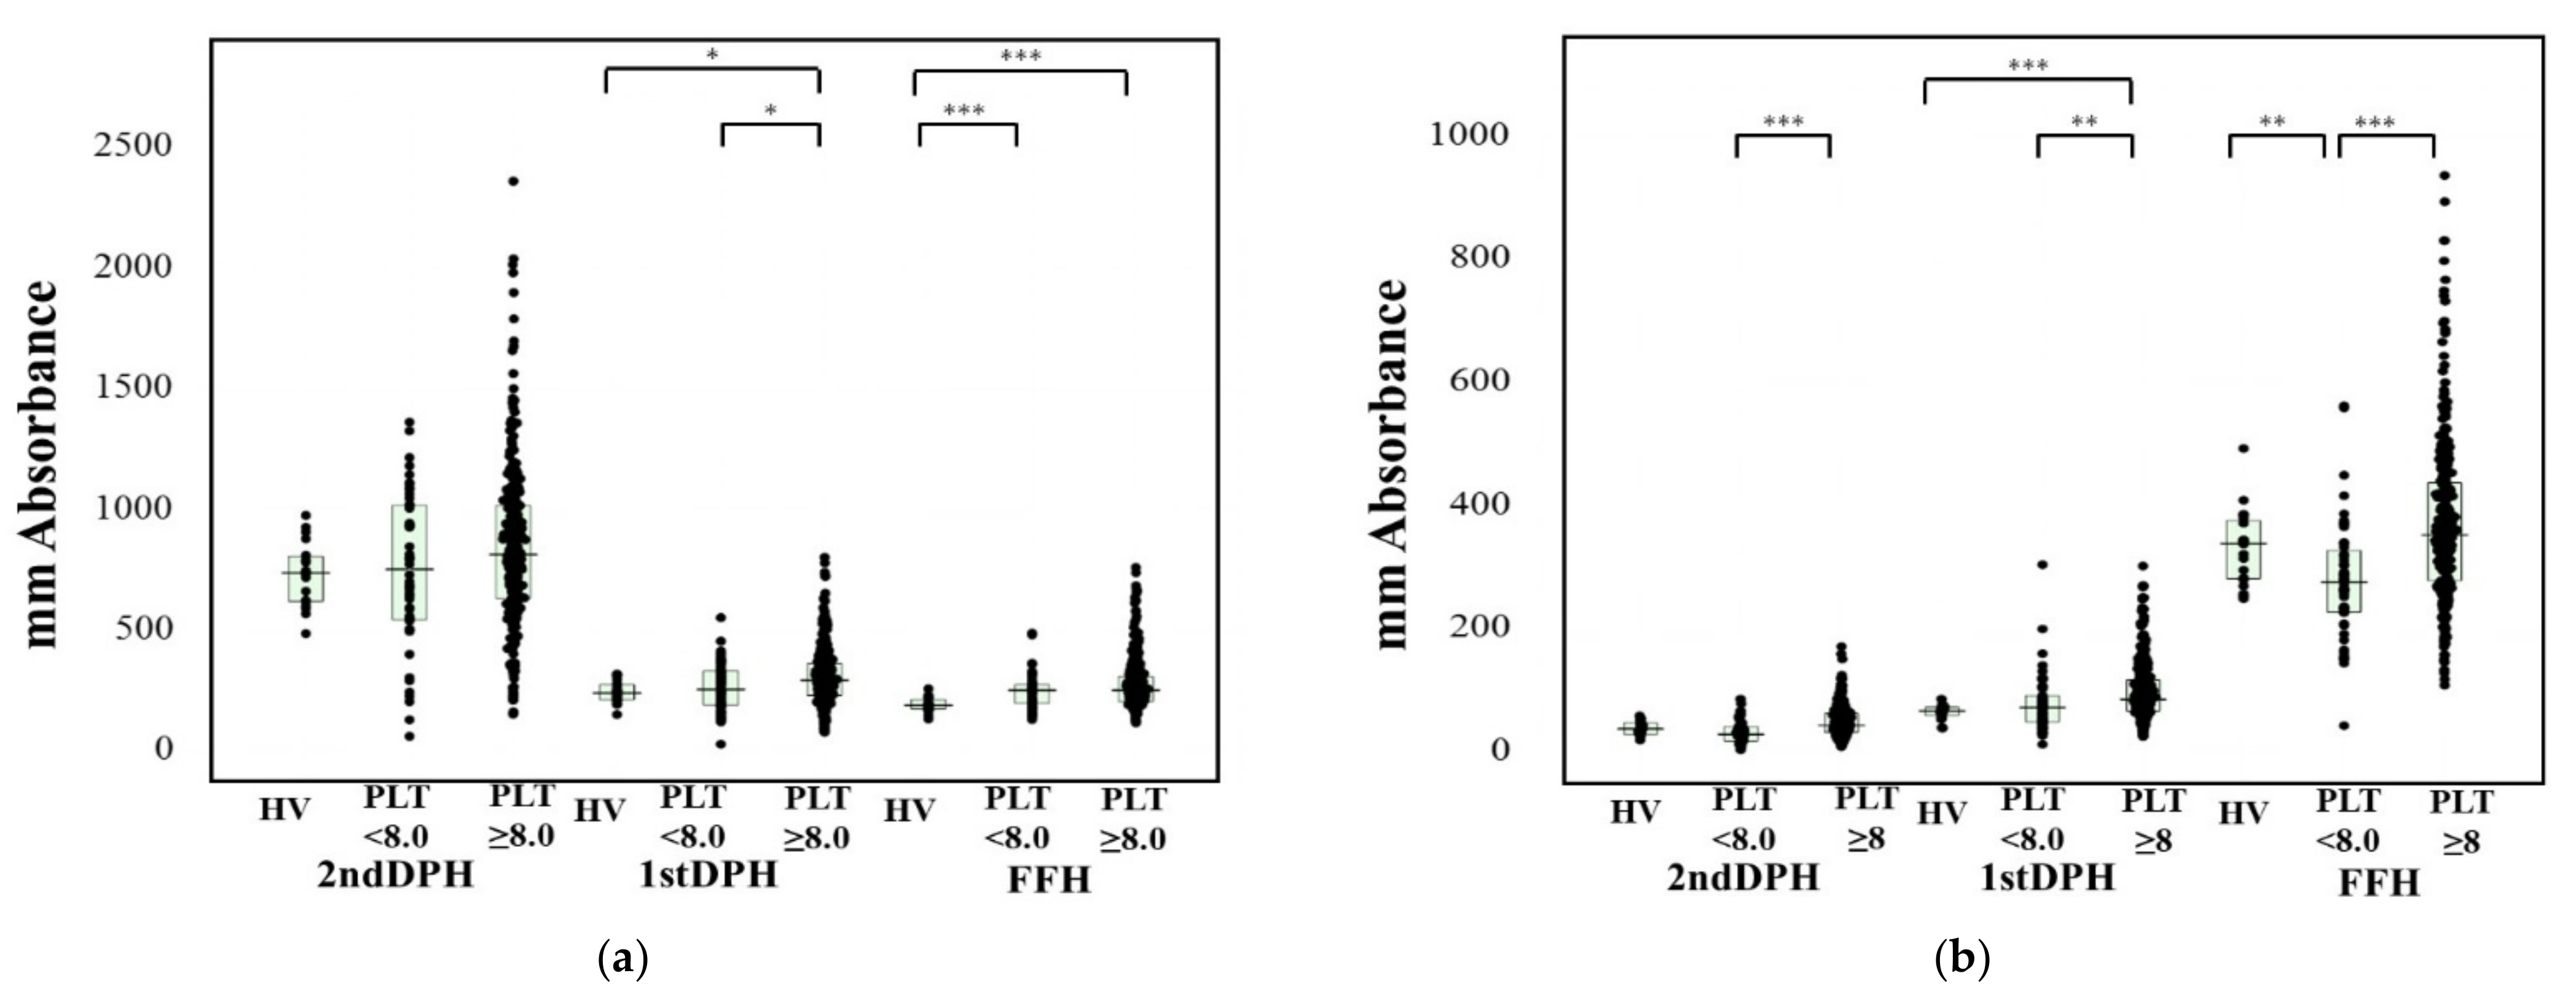
| ≥8.0 × 10⁴/L | 33.6 (30.7–38.5) | 36.4 (33.0–40.5) | 38.2 (35.2–45.9) | 79.0 (74.3–88.8) | 100 (90.5–113) | 104 (94.1–117) |
| <8.0 × 10⁴/L | 33.9 * (30.9–37.9) | 37. 2 * (33.8–42.0) | 39.3 ** (35.9–44.1) | 73.6 *** (65.3–82.6) | 90.4 *### (81.5–102) | 90.9 ### (82.9–104) |
| 2nd DP | 1st DP | FF | 2nd DP | 1st DP | FF | |
|---|---|---|---|---|---|---|
| Healthy volunteers | 31.7 (31.1–32.9) | 34.3 (33.8–36.0) | 36.0 (35.6–38.2) | 77.5 (70.3–85.9) | 96.5 (89.3–108) | 95.4 (89.5–108) |
| CWA-APTT | CWA-sTF/FIXa | |||||
| ITP | 30.3 (29.5–33.0) | 33.1 (32.0–36.4) | 35.3 (33.6–38.3) | 81.5 (75.1–87.5) | 101 (91.2–115) | 105 (97.5–121) |
| Other thrombocytopenia. | 34.9 ***## (32.6–38.8) | 37.9 **# (34.7–41.2) | 40.6 **# (36.6–47.3) | 78.4 (73.7–89.3) | 99.0 (90.2–113) | 103 (92.7–114) |
| Age (Years) | APTT (mm Absorbance) | sTF/FIXa (mm Absorbance) | |||||
|---|---|---|---|---|---|---|---|
| 2nd DP | 1st DP | FF | 2nd DP | 1st DP | FF | ||
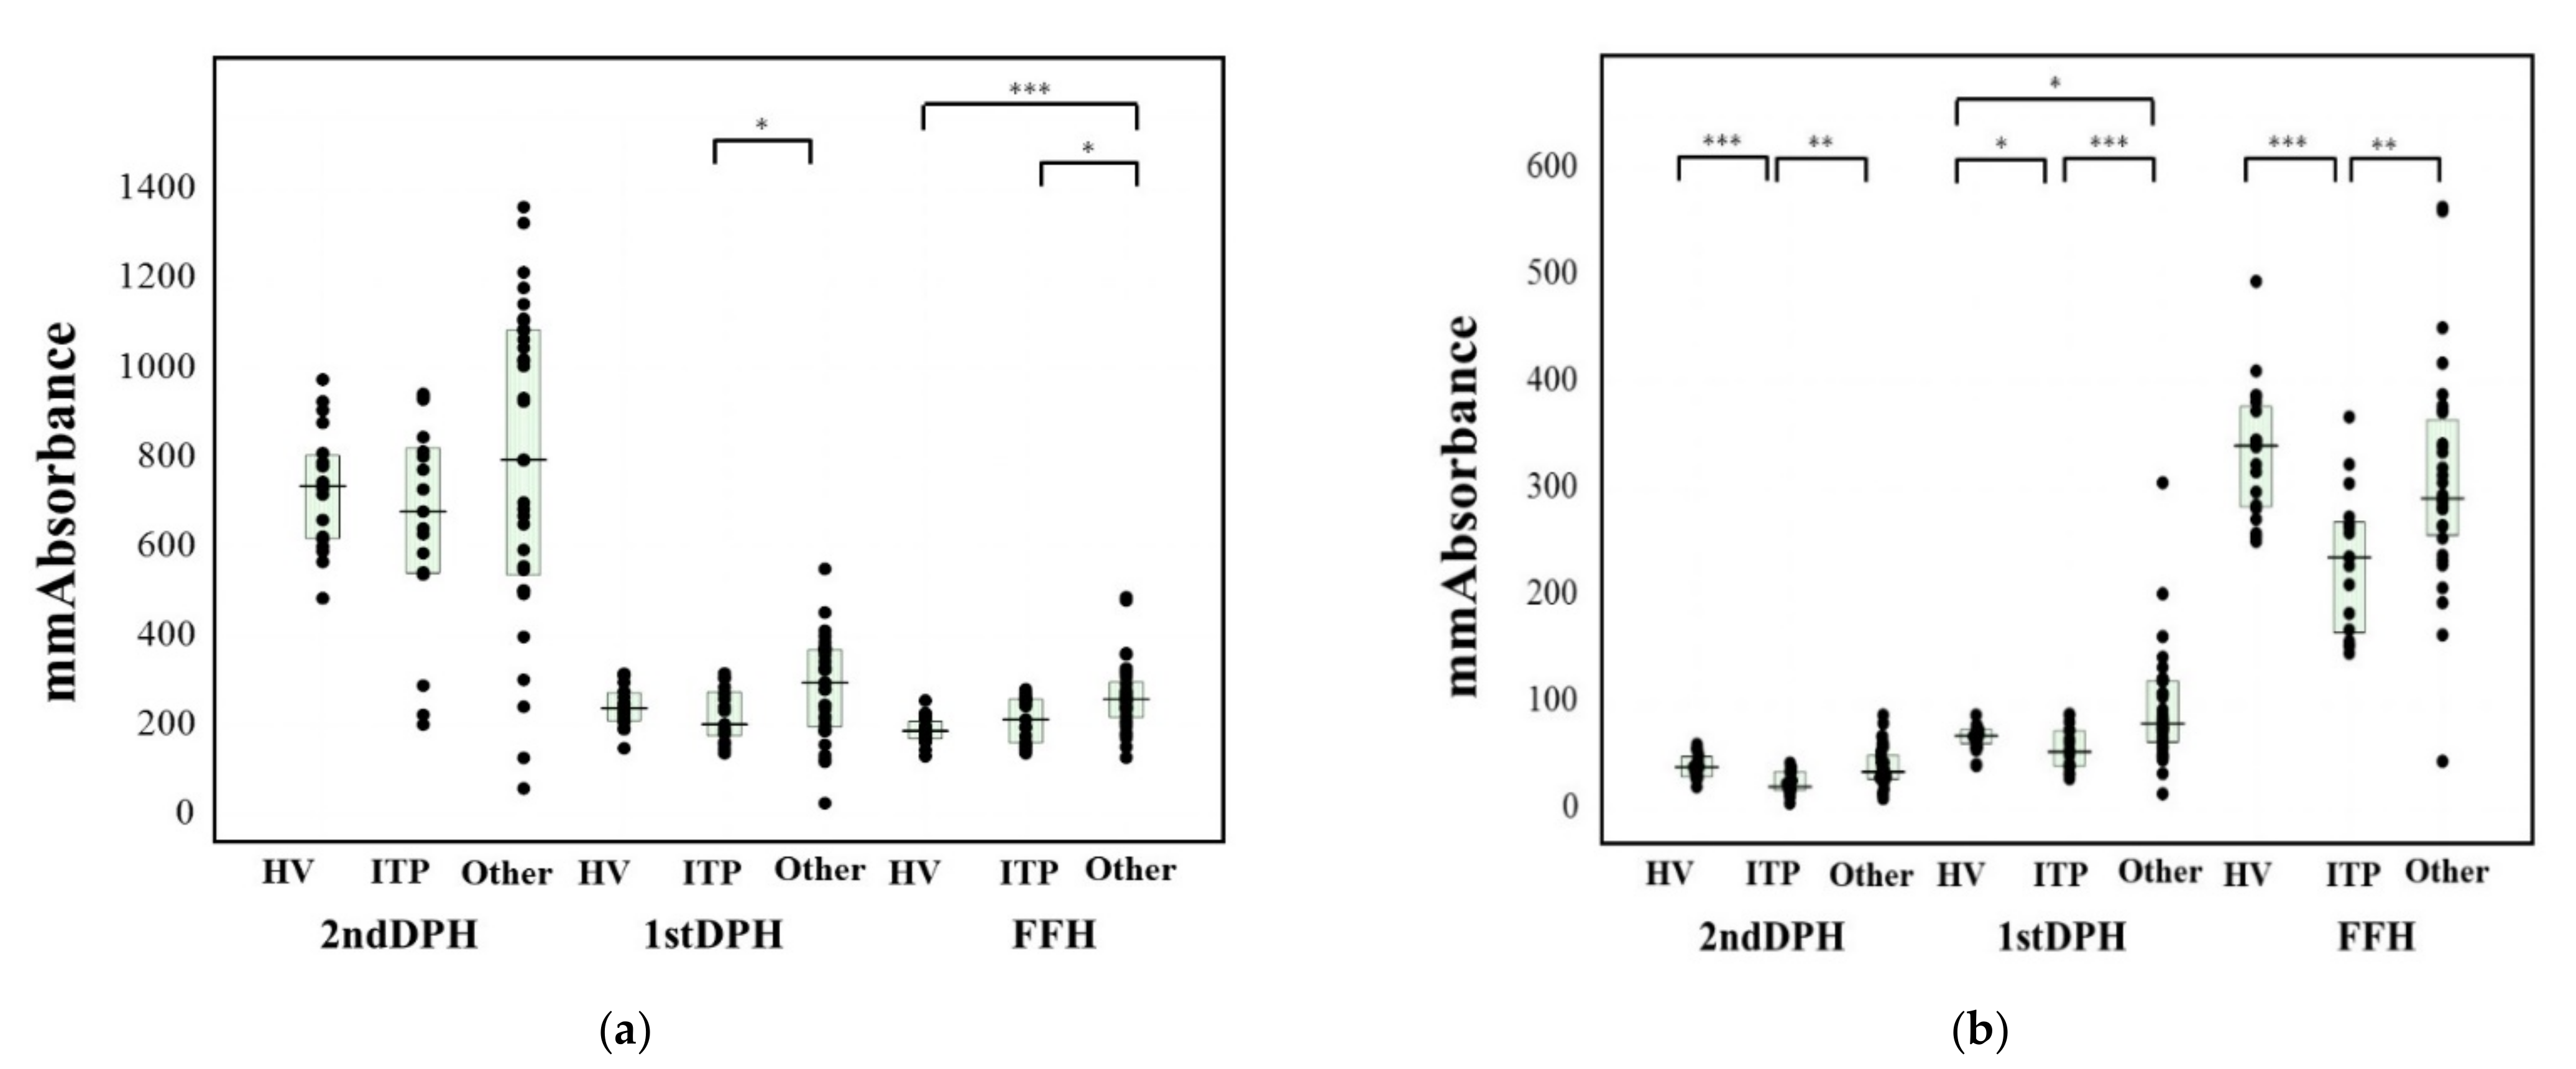
| Other(n = 18) | 3.8 (2–4.7) | 679 * (541–821) | 203 ** (177–275) | 214 * (161–259) | 21.4 * (17.7–35.4) | 54.0 *** (40.5–73.7) | 236 ** (165–269) |
| ITP (n = 17) | 3.0 (1.1–4.2) | 1010 * (670–1110) | 337 ** (280–372) | 257 * (239–322) | 37.4 * (29.6–54.6) | 97.3 *** (75.9–121) | 312 ** (281–378) |
| 2nd DPT | 1st DPT | FFT | 2nd DPH | 1st DPH | FFH | ||
|---|---|---|---|---|---|---|---|
| ITP | PRP | 41.0 * (36.3–46.8) | 48.2 ** (44.5–53.7) | 145 (129–167) | 90.5 ** (80.3–147) | 78.0 *** (75.8–96.4) | 658 * (587–775) |
| PPP | 38.4 (36.4–41.8) | 46.6 * (42.8–49.9) | 189 (159–224) | 114 *** (83.0–147) | 90.6 *** (73.9–103) | 580 * (499–737) | |
| Other | PRP | 35.0 * (32.1–40.0) | 41.3 ** (38.6–46.4) | 128 (113–158) | 168 ** (120–272) | 124 *** (101–155) | 754 (697–866) |
| PPP | 34.5 (30.1–39.0) | 40.0 * (35.5–44.9) | 177 (149–194) | 188 *** (152–284) | 123 *** (112–171) | 688 (564–758) |
Publisher’s Note: MDPI stays neutral with regard to jurisdictional claims in published maps and institutional affiliations. |
© 2021 by the authors. Licensee MDPI, Basel, Switzerland. This article is an open access article distributed under the terms and conditions of the Creative Commons Attribution (CC BY) license (https://creativecommons.org/licenses/by/4.0/).
Share and Cite
Wada, H.; Ichikawa, Y.; Ezaki, M.; Shiraki, K.; Moritani, I.; Yamashita, Y.; Matsumoto, T.; Masuya, M.; Tawara, I.; Shimpo, H.; et al. Clot Waveform Analysis Demonstrates Low Blood Coagulation Ability in Patients with Idiopathic Thrombocytopenic Purpura. J. Clin. Med. 2021, 10, 5987. https://doi.org/10.3390/jcm10245987
Wada H, Ichikawa Y, Ezaki M, Shiraki K, Moritani I, Yamashita Y, Matsumoto T, Masuya M, Tawara I, Shimpo H, et al. Clot Waveform Analysis Demonstrates Low Blood Coagulation Ability in Patients with Idiopathic Thrombocytopenic Purpura. Journal of Clinical Medicine. 2021; 10(24):5987. https://doi.org/10.3390/jcm10245987
Chicago/Turabian StyleWada, Hideo, Yuhuko Ichikawa, Minoru Ezaki, Katsuya Shiraki, Isao Moritani, Yoshiki Yamashita, Takeshi Matsumoto, Masahiro Masuya, Isao Tawara, Hideto Shimpo, and et al. 2021. "Clot Waveform Analysis Demonstrates Low Blood Coagulation Ability in Patients with Idiopathic Thrombocytopenic Purpura" Journal of Clinical Medicine 10, no. 24: 5987. https://doi.org/10.3390/jcm10245987
APA StyleWada, H., Ichikawa, Y., Ezaki, M., Shiraki, K., Moritani, I., Yamashita, Y., Matsumoto, T., Masuya, M., Tawara, I., Shimpo, H., & Shimaoka, M. (2021). Clot Waveform Analysis Demonstrates Low Blood Coagulation Ability in Patients with Idiopathic Thrombocytopenic Purpura. Journal of Clinical Medicine, 10(24), 5987. https://doi.org/10.3390/jcm10245987