Article

Central Sleep Apnea Is Associated with an Abnormal P-Wave Terminal Force in Lead V1 in Patients with Acute Myocardial Infarction Independent from Ventricular Function

1
University Heart Center Regensburg, University Hospital Regensburg, 93053 Regensburg, Germany
2
Department of Radiology, University Hospital Regensburg, 93053 Regensburg, Germany
3
Department of Internal Medicine, Cham Hospital, 93413 Cham, Germany
*
Author to whom correspondence should be addressed.
J. Clin. Med. 2021, 10(23), 5555; https://doi.org/10.3390/jcm10235555
Submission received: 28 October 2021 / Revised: 19 November 2021 / Accepted: 25 November 2021 / Published: 26 November 2021

Abstract

:
Sleep-disordered breathing (SDB) is highly prevalent in patients with cardiovascular disease. We have recently shown that an elevation of the electrocardiographic (ECG) parameter P wave terminal force in lead V1 (PTFV1) is linked to atrial proarrhythmic activity by stimulation of reactive oxygen species (ROS)-dependent pathways. Since SDB leads to increased ROS generation, we aimed to investigate the relationship between SDB-related hypoxia and PTFV1 in patients with first-time acute myocardial infarction (AMI). We examined 56 patients with first-time AMI. PTFV1 was analyzed in 12-lead ECGs and defined as abnormal when ≥4000 µV*ms. Polysomnography (PSG) to assess SDB was performed within 3–5 days after AMI. SDB was defined by an apnea-hypopnea-index (AHI) >15/h. The multivariable regression analysis showed a significant association between SDB-related hypoxia and the magnitude of PTFV1 independent from other relevant clinical co-factors. Interestingly, this association was mainly driven by central but not obstructive apnea events. Additionally, abnormal PTFV1 was associated with SDB severity (as measured by AHI, B 21.495; CI [10.872 to 32.118]; p < 0.001), suggesting that ECG may help identify patients suitable for SDB screening. Hypoxia as a consequence of central sleep apnea may result in atrial electrical remodeling measured by abnormal PTFV1 in patients with first-time AMI independent of ventricular function. The PTFV1 may be used as a clinical marker for increased SDB risk in cardiovascular patients.

1. Introduction

Sleep-disordered breathing (SDB) is a common co-morbidity in patients with cardiovascular disease [1,2,3]. Nearly 50% of patients undergoing coronary artery bypass surgery (CABG) were found to have SDB [4]. Obstructive sleep apnea (OSA) is characterized by the presence of repetitive episodes of upper airway collapse. In contrast, central sleep apnea (CSA) is caused by an intermittent lack of centrally controlled respiratory drive, which often manifests as Cheyne–Stokes respiration and leads to significant oxygen desaturation. Epidemiologic studies indicate a strong association between both OSA and CSA and atrial fibrillation (AF) [5,6]. The most commonly used treatment is continuous positive airway pressure (CPAP), which can alleviate the clinical symptoms of SDB. However, the adherence to this therapy is generally poor and no significant benefit has been shown regarding cardiovascular outcome in patients with OSA [7,8]. The recent randomized controlled trial led by Traaen et al. demonstrated that CPAP treatment does not affect the burden of AF after 5 months of therapy [9]. Moreover, adaptive servo-ventilation has even been reported to increase the risk of cardiovascular death in patients with reduced left ventricular ejection fraction (LV EF) and CSA [10]. Therefore, identification of novel risk markers and new treatment options are of utmost importance.
The P wave terminal force in electrocardiographic (ECG)-lead V1 (PTFV1) was firstly introduced by Morris et al. in 1964 [11]. It is defined as the algebraic product of the amplitude and duration (µV*ms) of the negative area of the P-wave in lead V1 (Figure 1). Accumulating evidence has since linked an abnormally large PTFV1 to atrial dysfunction [4] and AF [12] with increased risk for cardioembolic or cryptogenic stroke [13,14]. Moreover, an abnormally PTFV1 has also been shown to predict cardiovascular risk and cardiac death or hospitalization for heart failure in patients with prior myocardial infarction [15].
Interestingly, we have recently shown that an abnormally large PTFV1 was associated with atrial functional and electrical remodeling by activation of Ca/calmodulin-dependent protein kinase II (CaMKII). CaMKII-dependent dysregulation of cardiomyocytes ion homeostasis has already been associated with atrial pathologies [16], and increased CaMKII-dependent atrial pro-arrhythmic activity was found in cardiovascular patients with SDB [4]. Since CaMKII can be activated by oxidation, intermittent hypoxia could be an important upstream factor.
To date, however, it is unclear which pathophysiologic factor—be it negative intrathoracic pressure fluctuations, intermittent hypoxia, increased production of reactive oxygen-species (ROS), or autonomic imbalance [17]—might be most significant for atrial electrical remodeling. In addition, little is known about the relationship between PTFV1 and SDB in patients with acute myocardial infarction. Therefore, this present study investigated the relationship between SDB and SDB-related hypoxia with PTFV1 in patients presenting with acute myocardial infarction.

2. Materials and Methods

2.1. Study Approval and Design

We performed a sub-analysis of a prospective observational study in patients with acute MI that were enrolled at the University Medical Center Regensburg (Regensburg, Germany) between March 2009 and March 2012. Details of the study design have been published previously [3].
Patients (age 18–80 years) with a first-time AMI and successful percutaneous coronary intervention (PCI) treated at the University Hospital Regensburg within 24 h after symptom onset were eligible for inclusion. Exclusion criteria were previous MI or previous PCI, indication for surgical myocardial revascularization, cardiogenic shock, contraindications for cardiac magnetic resonance imaging (CMR), and severe comorbidities (e.g., lung disease, stroke, treated SDB). The study protocol was reviewed and approved by the local institutional ethics committee (Regensburg, 08-151) and is in accordance with the Declaration of Helsinki and Good Clinical Practice. A written informed consent was obtained from all patients prior to enrolment.
Of 252 consecutive patients who underwent percutaneous coronary intervention, 74 patients were eligible for the prospective observational study, which involved an evaluation of cardiac function (CMR) and SDB severity at the time of MI. In total, 34 patients were excluded from this sub-analysis due to missing CMR (n = 10), missing polysomnography (n = 6), and atrial fibrillation (n = 2). The final sub-analysis included 56 patients, who were divided into two cohorts depending on the PTFV1 (PTFV1 < 4000 µV*ms [n = 40] and PTFV1 ≥4000 µV*ms [n = 16]) (Figure 2).

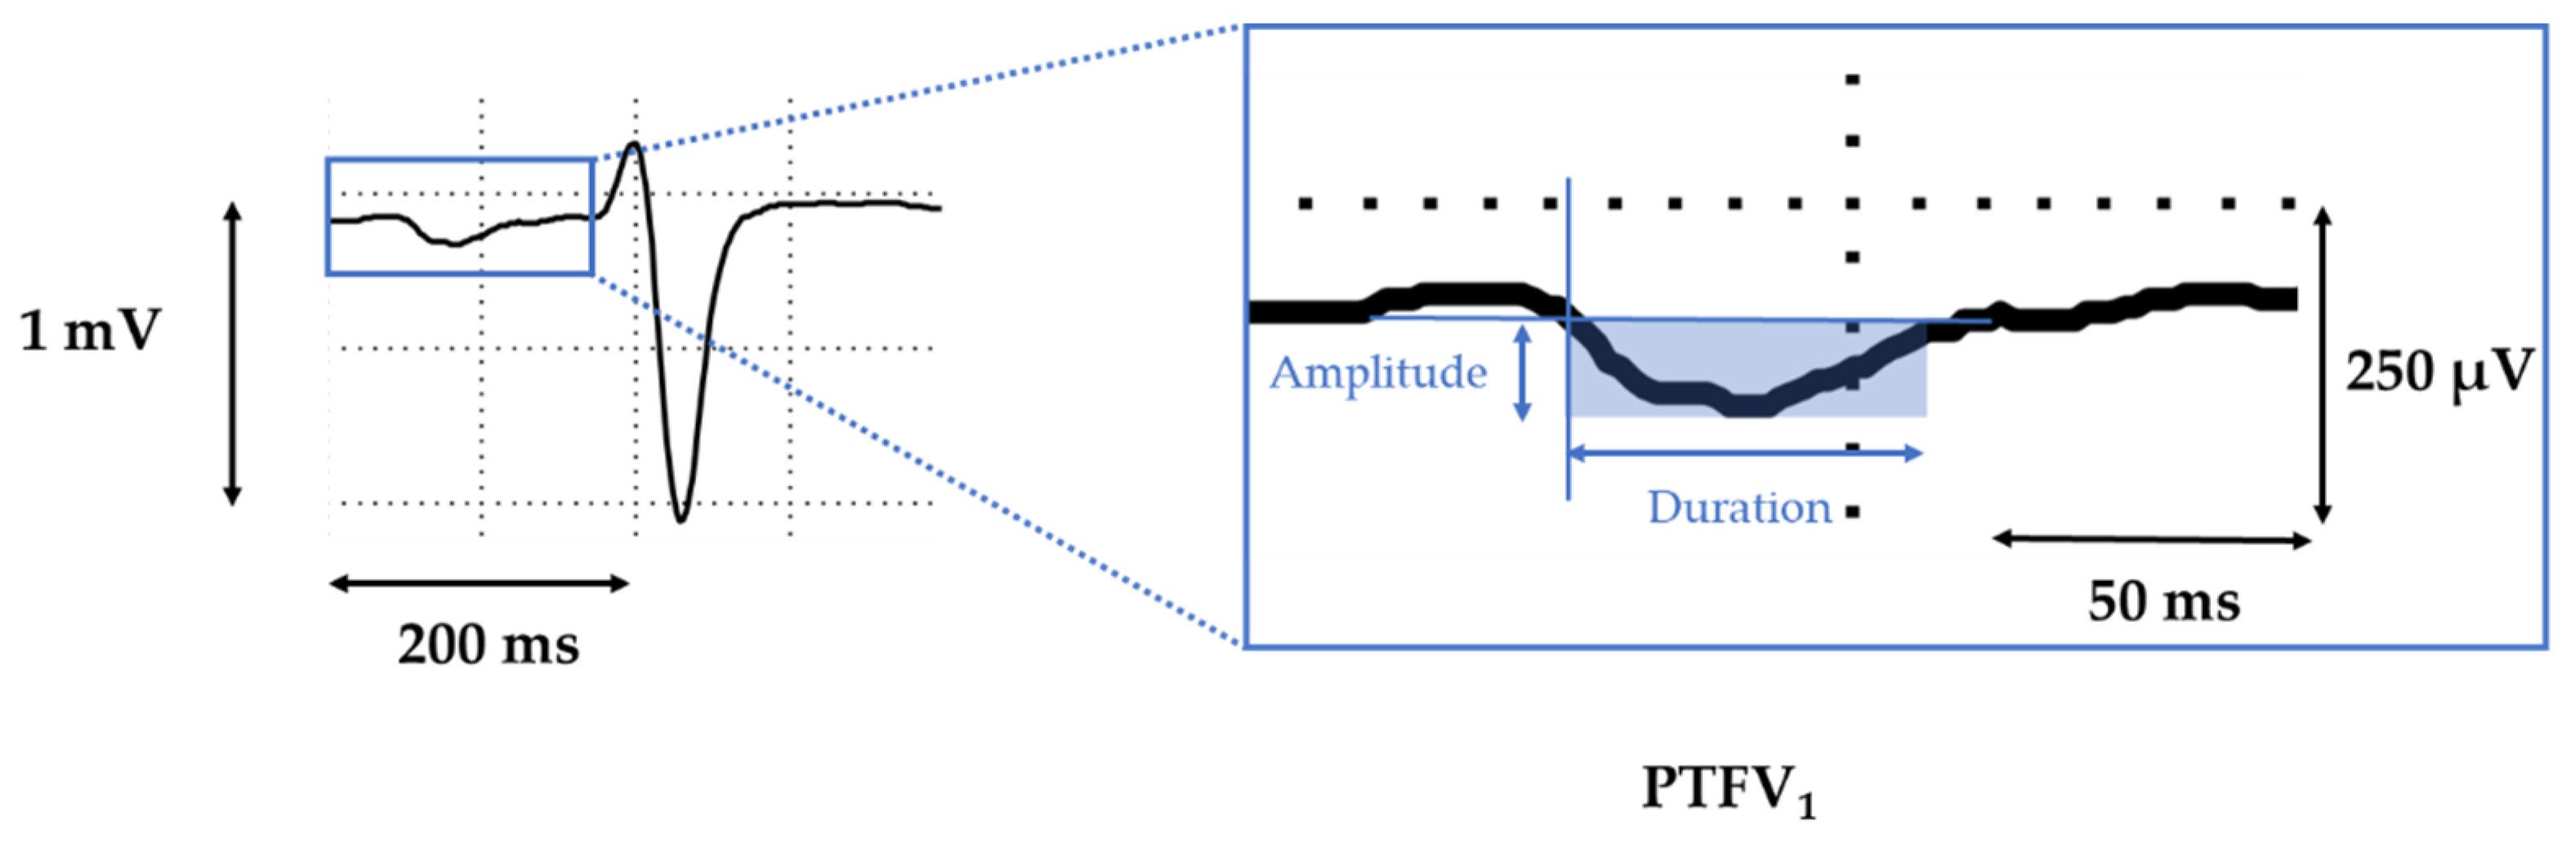
2.2. Electrocardiography

Standard 12-lead electrocardiograms were recorded at a paper speed of 50 mm/s and a standardization of 10 mm/1 mV. All ECGs were digitally processed and scaled using ImageJ (Version 2.00; Java-based image processing program; LOCI, University of Wisconsin, USA) and individually analyzed by two skilled physicians (mean of 3 consecutive P waves). Both investigators were blinded to the clinical and MRI data. PTFV1 was defined as the algebraic product of amplitude (µV) and duration (ms) of the terminal negative component of the P wave in lead V1 (Figure 1) also known as Morris-Index [11]. A PTFV1 of ≥ 4000 µV*ms was considered to be abnormal.

2.3. Polysomnography

Polysomnography (PSG) was performed in all subjects using standard polysomnographic techniques (Alice System; Respironics, Pittsburgh, PA, USA) as previously described [3]. Briefly, respiratory efforts were measured with the use of respiratory inductance plethysmography and airflow by nasal pressure. Sleep stages and arousals, as well as apneas, hypopneas, and respiratory effort-related arousals, were determined according to the American Academy of Sleep Medicine guidelines [18] by an experienced sleep technician blinded to the clinical data. Hypopneas were classified as obstructive if there was out-of-phase motion of the ribcage and abdomen, or if airflow limitation was present. In order to achieve optimal distinction between obstructive and central hypopneas without using an esophageal balloon, we used additional criteria, such as flattening, snoring, paradoxical effort movements, arousal position relative to hypopneas, and associated sleep stage (rapid eye movement (REM)/non-REM). SDB was defined by an apnea-hypopnea-index (AHI) > 15/h determined as the number of central or obstructive apnea and hypopnea episodes per hour of sleep. CSA was defined as >50% central apneas and hypopneas of all apneas and hypopneas. Pulse oximetry implemented in PSG was used to measure oxygen saturation and ODI (number of events per hour in which oxygen saturation decreased by ≥3% from baseline).

2.4. Cardiovascular Magnetic Resonance

Details of CMR data acquisition have been previously described [3]. Shortly, CMR studies were performed on a clinical 1.5 Tesla scanner (Avanto, Siemens Healthcare Sector, Erlangen, Germany) using a phased array receiver coil during breath-hold and that was ECG triggered. Examination of ventricular function was performed by acquisition of steady-state free precession (SSFP) cine images in standard short axis planes (trueFISP; slice thickness 8 mm, inter-slice gap 2 mm, repetition time 60.06 ms, echo time 1.16 ms, flip angle 60°, matrix size 134 × 192, and readout pixel bandwidth 930 Hz*pixel−1). The number of Fourier lines per heartbeat was adjusted to allow the acquisition of 25 cardiac phases covering systole and diastole within a cardiac cycle. The field of view was 300 mm on average and was adapted to the size of the patient. Calculation of left ventricular volumes and EF was performed in the serial short axis slices using commercially available software (syngo Argus, version B15; Siemens Healthcare Sector).

2.5. Statistical Analysis

Continuous variables were compared by Student’s T-test or Welch’s Test depending on their variance. The Chi-square or Fisher’s exact test were used for categorial variables depending on the number of observations. Continuous variables are expressed as mean ±95% confidence interval (CI), and categorial variables as frequencies and percentages, respectively. After linear regression of PTFV1 or AHI with important clinical factors, multivariate linear regression was performed for all variables with a p value < 0.2. An intra class correlation (ICC, by two-way mixed model, type absolute agreement) was used to assess the reproducibility of PTFV1 analysis. All reported P values are two-sided and the threshold for significance was set at p < 0.05. Statistical analysis was performed in SPSS (SPSS Statistics for Mac OS, Version 26.0 Armonk, NY, USA: IBM Corp.).

3. Results

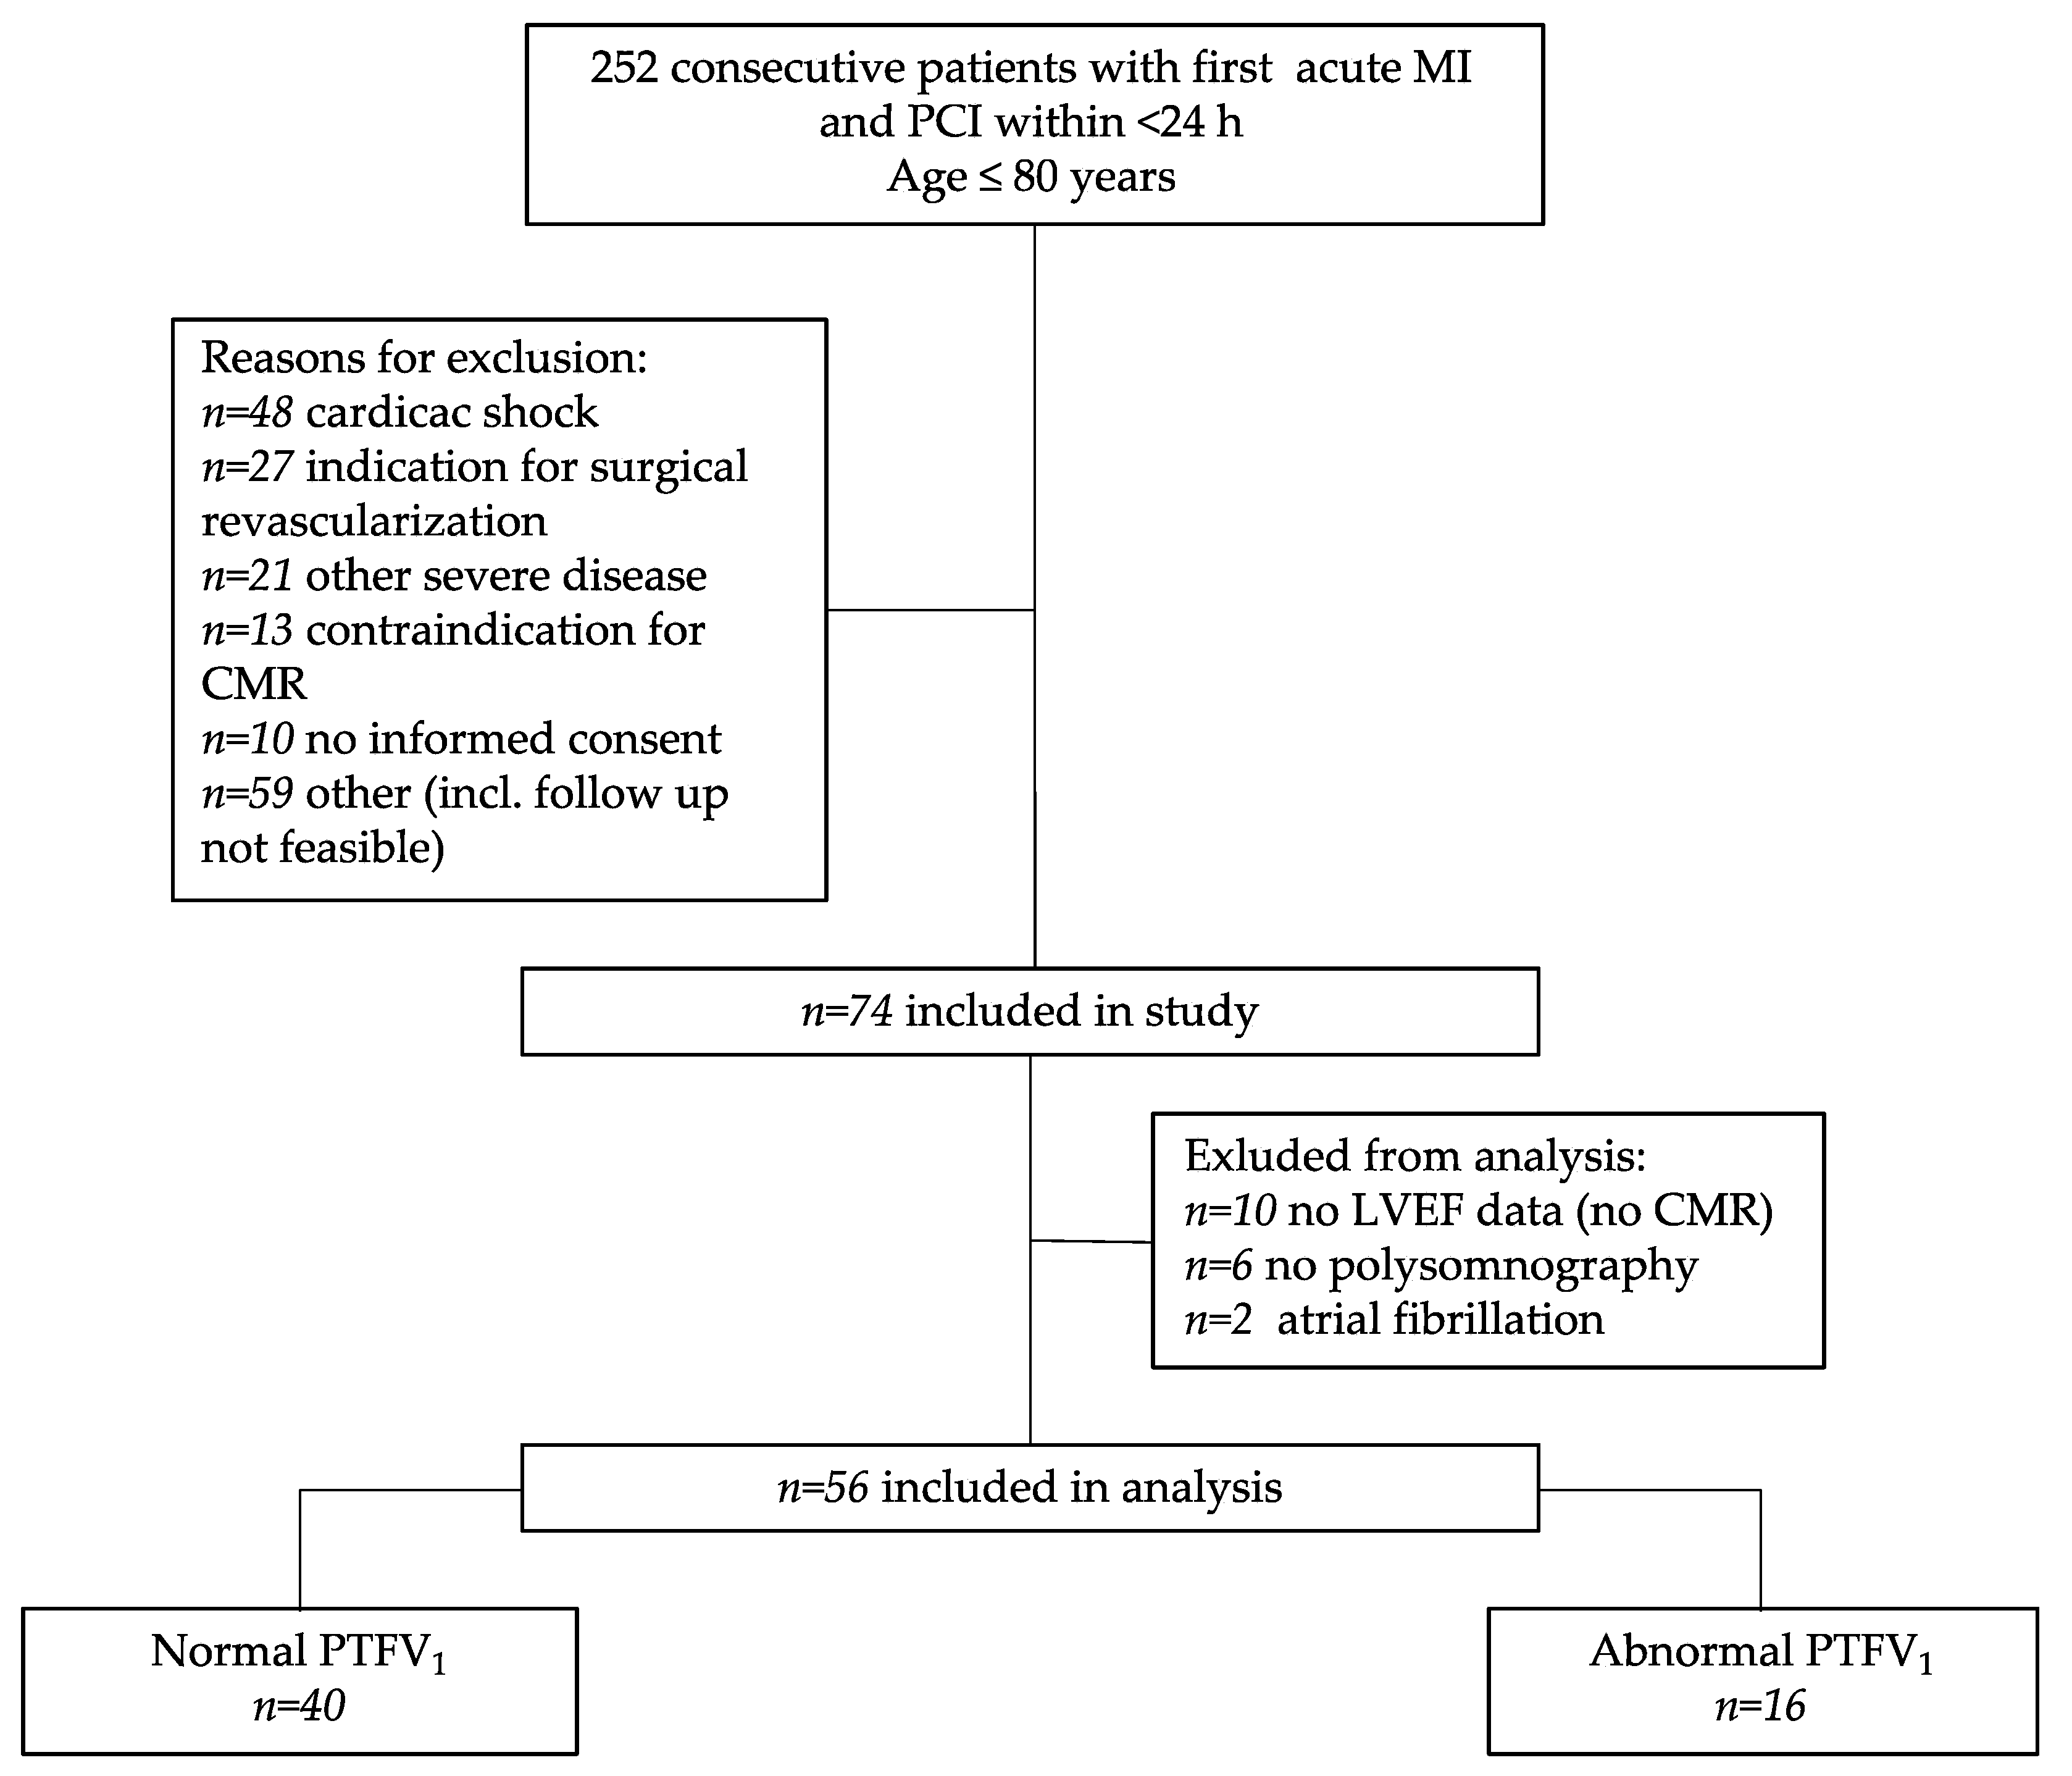
3.1. Study Population

A total of 56 patients consisting of 80% men with an age of 55 ± 9.9 years were separated into groups with normal and abnormal PTFV1 (baseline characteristics in Table 1). There was no significant difference in demographic parameters or comorbidities, such as age, gender, arterial hypertension, diabetes mellitus, hypercholesterolemia, or smoking.
Patients with abnormal PTFV1 presented significantly less with ST segment elevation myocardial infarction (STEMI) (p = 0.035) and had higher levels of NT-proBNP at discharge (p = 0.002) (Table 1). The LV EF was mildly reduced in both groups but worse in patients with abnormal PTFV1 (43.15 ± 11.51% vs. 48.93 ± 7.45%, p = 0.035). Interestingly, volumetric parameters for LA size and function, such as LA fractional area change (FAC) or systolic LA area, were not significantly increased in patients with abnormal PTFV1 (Table 1), indicating that the magnitude of PTFV1 more likely reflects electrical but not structural remodeling as published previously [19].

3.2. Central Sleep Apnea Is Independently Associated with Abnormal PTFV1

Respiratory and sleep characteristics are shown in Table 2. The Epworth Sleepiness Scale score reflecting the daytime sleepiness was within the normal range in both groups (Table 2). Interestingly, in patients with abnormal PTFV1, SDB was highly prevalent (86.7%), with significantly more patients exhibiting central but not obstructive sleep apnea (Table 2). In contrast, only a minority of patients with normal PTFV1 had SDB (42.5%) and if so, a majority was obstructive (Table 2). Moreover, central (cAHI) but not obstructive (oAHI) apnea events were significantly associated with the magnitude of PTFV1 (Table 3). Importantly, the extent of oxygen desaturation (ODI) was an even stronger predictor of the extent of PTFV1 than that of the frequency of central apneas (R2 = 0.268, Table 3). In contrast to this association, the mean arterial oxygen saturation was similar in both groups. There was a trend towards lower minimum arterial oxygen saturation in the group with patients with abnormal PTFV1 (85.74 ± 5.87 vs. 82.20 ± 6.09, p = 0.055) (Table 2).
To test for possible confounding, multivariate linear regression was performed. The association of both ODI and cAHI with the magnitude of PTFV1 remained significant after inclusion of important co-factors, such as age, LVEF, eGFR, and NT-proBNP at discharge. Importantly, the associations of both ODI and cAHI were also independent from obstructive apnea events. For cAHI, R2 was 0.256 (adj. R2 = 0.186; p = 0.014, Table 4), and for ODI, R2 was 0.408 (adj. R2 = 0.317; p = 0.002, Table 4).

3.3. PTFV1 as a Diagnostic Marker for Predicting Sleep-Disordered Breathing

Univariate linear regression for AHI indicated that beside PTFV1, BMI, NT-proBNP at discharge, systolic LA area, LVEF, and smoking status may correlate with apnea and hypopnea events. Strikingly, after incorporation of these factors into a multivariate linear regression model, only PTFV1 significantly correlated with the magnitude of AHI (model 1, R2 = 0.326 (adj. R2 = 0.213); p = 0.021, Table 5). Similarly, after dichotomizing PTFV1 into normal and abnormal, the presence of an abnormal PTFV1 significantly predicted a more severe AHI in multivariate linear regression (model 2, B 21.495; CI [9.097, 20.193]; p < 0.001, Table 5).
Interestingly, no meaningful interactions were found with myocardial ischemia markers, such as troponin I or creatine kinase and abnormal PTFV1 (Table 5), despite the higher prevalence of STEMI in the group with normal PTFV1 (92.5% vs. 68.8%).

4. Discussion

In the present study, we investigated the relationship between SDB and SDB-related hypoxia with PTFV1 in patients presenting with acute myocardial infarction.
We show here that nocturnal oxygen desaturation in SDB was associated with atrial electrical remodeling measured by abnormal PTFV1 in patients with first-time AMI independent of ventricular function. Moreover, we propose PTFV1 as a broadly available clinical marker for increased SDB risk in cardiovascular patients.

4.1. Possible Mechanisms for an Abnormal PTFV1 in SDB

We report here a prevalence of SDB in patients with AMI of 54.5% with 25.9% central sleep apnea, which closely resembles previous data reporting an SDB prevalence ranging from 33.1% to 50% with about 20% central sleep apnea [4,20,21].
CSA in patients with heart failure is commonly explained by pulmonary congestion due to ventricular overload with consequent autonomic triggered tachypnea and subsequently reduced PaCO2, which results in the occurrence of an apnea episode. This leads to accumulation of PaCO2 and restoration of respiratory effort. However, CSA could also have pathophysiological effects on the heart that are independent of ventricular dysfunction. A small study by Lanfranchi showed that severe CSA was associated with increased arrhythmic risk without association to the severity of hemodynamic impairment due to LV dysfunction. This association may be caused by CSA-mediated nocturnal desaturations, which have been proposed as a consequence of impaired autonomic control and disturbed chemoreflex–baroreflex interactions frequently found in CSA [22].
Interestingly, for patients with AMI, a high probability of CSA-dependent nocturnal oxygen desaturations has already been shown [21]. We observe here a high ODI among patients with AMI, which strongly correlates with abnormal PTFV1 independent from many clinical covariates including left ventricular ejection fraction, which might provide an interesting insight into the pathogenesis of atrial remodeling and the development of atrial cardiomyopathy.
There is growing evidence that atrial structural and electrical remodeling even in the absence of atrial fibrillation can also increase the risk of clot formation and cardioembolic stroke. The latter alterations, also known as atrial cardiomyopathy, expand the traditional view of clot formation [13,23,24,25]. In fact, the ongoing ARCADIA trial is investigating the optimal anticoagulant therapy (anticoagulant therapy vs. standard ASA therapy) in patients with cryptogenic stroke and atrial cardiomyopathy and specifically uses an abnormal PTFV1 as an additional clinical marker for atrial cardiomyopathy [26]. We have recently shown that an abnormal PTFV1 is linked to increased CaMKII-dependent atrial pro-arrhythmic activity and atrial contractile dysfunction [4,19]. Atrial CaMKII is a key regulator of cardiac excitation–contraction coupling and plays an important role in triggering arrhythmias and atrial electrical remodeling [4]. Beside arrhythmias, it is tempting to speculate that CaMKII-dependent atrial contractile dysfunction may also be involved in atrial clot formation even in the absence of atrial fibrillation. Thus, CaMKII may be a promising novel treatment target for patients with atrial cardiomyopathy. In this context, the mechanisms of CaMKII activation should be elucidated in more detail. Beside the canonical Ca-dependent activation, CaMKII has been shown to be activated by increased amounts of reactive oxygen species (ROS) [27,28]. SDB-related intermittent hypoxia with consequently increased generation of ROS [29] may result in activation of atrial CaMKII and CaMKII-dependent electrical remodeling manifesting as abnormal PTFV1, but this remains to be shown. Additionally, only little is known about SDB-related hypoxia and electrical atrial remodeling before atrial fibrillation emerges.
Interestingly, in patients with abnormal PTFV1, atrial fibrosis was less likely to be observed [19], indicating that the generation of abnormal PTFV1 may require functional cardiomyocytes.
Beside SDB and SDB-related hypoxia, acute myocardial infarction may also lead to acute ventricular contractile dysfunction, which could also contribute to atrial functional and/or structural alterations.
A longitudinal study recently demonstrated that increasing NT-proBNP levels were associated with LA remodeling and LA contractile dysfunction [30]. In the current study, we observed significantly higher NT-proBNP levels at discharge and lower LV EF in the group with abnormal PTFV1, which may contribute to impaired atrial function and abnormal PTFV1. In accordance, we recently demonstrated a significant negative correlation between functional LA parameters, such as LA conduit and reservoir function, as measured by feature-tracking (FT) strain analysis of cardiac magnetic resonance (CMR) images, and the extent of PTFV1 [19]. In contrast to atrial strain, volumetric MRI parameters for LA function such as systolic LA area or LA FAC did not show a significant association with PTFV1 in the present study, which agrees with previous studies [31,32].
On the other hand, multivariate linear regression analysis revealed that neither higher NT-proBNP levels nor lower LVEF were significantly associated with the magnitude of PTFV1 if SDB and SDB-related hypoxia were also incorporated in the multivariate model. This suggests that ventricular contractile dysfunction is unlikely to contribute decisively to the extent of PTFV1, at least when there is concomitant SDB.
Consistent with this, in the current study, there was also no association of PTFV1 with acute ischemia markers (creatine kinase, troponin I), which may correlate with infarct size and affect LV function. In addition to the possible subordinate role of LV dysfunction for PTFV1, an explanatory approach could also be that a proportion of patients were protected from more extensive infarct-associated ventricular myocardial injury by ischemic preconditioning due to the repetitive SDB-associated hypoxia, which has been shown previously [33]. However, the latter phenomenon should be interpreted with caution and cannot be generalized to all patients after AMI, because the healing process, as measured by myocardial salvage and reduction in infarct size, was worse in patients with SDB within three months after AMI [34]. In addition, patients with AMI and SDB showed worse hospital outcomes [21,35,36]. Regardless of a possible protective or detrimental role of SDB for ventricular injury after AMI, the role of ventricular injury for atrial remodeling and the extent of PTFV1 may be less important, as discussed above.

4.2. PTFV1 as a Diagnostic Marker for SDB and SDB-Related Arrhythmias

It has been found that patients with SDB especially CSA have higher severity of ACS and worse prognosis with longer hospital stay and more complications during hospitalization [21]. However, a clinical marker identifying patients at highest risk is lacking. In our cohort, oxygen desaturation index as a measure of nocturnal desaturation was significantly associated with abnormal PTFV1. Therefore, measurement of PTFV1 may be a simple and cost-effective tool for stratifying patients admitted to the hospital with a first-time AMI. Measurement of PTFV1 was highly reliable in different observers (Table A1). Therefore, we suggest that all patients with abnormal PTFV1 should receive PSG and be stratified according to their SDB risk for follow-up care.
Unfortunately, CPAP therapy may be without benefit for patients with sleep apnea [7,8,9,10], so new treatment options are urgently needed. We have recently shown that increased CaMKII activity is significantly associated with abnormal PTFV1 [19]. Currently, several CaMKII inhibitors are under preclinical investigation [37]. One could speculate that abnormal PTFV1 might help in selecting patients who could benefit from specific pharmacological treatment, such as CaMKII inhibition.

4.3. Limitations

This was a cross-sectional study at a single center with a relatively small sample size that was not designed to examine long-term follow-up of clinical endpoints. In addition, we do not know whether the abnormal PTFV1 we detected at the time of myocardial infarction is a transient phenomenon or persists over time. Larger studies are needed to validate our findings and to investigate the impact on cardiac arrhythmias and serious adverse cardiac events including heart failure exacerbations. Moreover, the definition of the negative part of the P-wave based on the isoelectric line in a slightly rising PR segment is sometimes difficult. However, the interobserver variability ICC for PTFV1 measurements in this study showed very good accuracy (ICC 0.888; lower CI 0.647; upper CI 0.951, Table A1).

5. Conclusions

This study shows that abnormal PTFV1 is tightly linked to SDB and especially to central instead of obstructive sleep apnea. Therefore, we hypothesize that atrial dysfunction expressed as abnormal PTFV1 is caused by stimulation of ROS-dependent pathways due to intermittent hypoxia represented here predominantly in CSA independent of ventricular function.
We show that the severity of SDB can be easily recognized by PTFV1. This ubiquitously available ECG parameter may thus be a simple and cost-effective tool to stratify patients admitted to hospital with first-time AMI for further PSG. Therefore, all patients with abnormal PTFV1 should obtain PSG and be stratified for follow-up care.

Author Contributions

Conceptualization, J.P. and S.W.; methodology, J.P.; software, J.P. and M.W.; validation, J.P., M.W. and S.W.; formal analysis, J.P. and S.W.; investigation, J.P., M.W., C.F., K.D., O.W.H., F.P.; resources, S.B., L.S.M., M.A.; data curation, S.W.; writing—original draft preparation, J.P.; writing—review and editing, M.W. and S.W.; visualization, J.P.; supervision, S.W.; project administration, S.W.; funding acquisition, M.A. and S.W. All authors have read and agreed to the published version of the manuscript.

Funding

M.W. and C.F. are supported by the local ReForM-program. M.A. received grants and personal fees from Philips Respironics (Murrysville, PA 15668), grants and personal fees from ResMed Germany (Martinsried, Germany), grants from the ResMed Foundation (La Jolla, CA 92037), personal fees from Boehringer-Ingelheim, personal fees from Novartis, personal fees from Bresotec, personal fees from NRI, outside the submitted work. S.W. is funded by DFG grants WA 2539/7-1, and 8-1. LSM is funded by DFG grants MA 1982/7-1. SW and LSM are also supported by the DFG SFB 1350 grant (Project Number 387509280, TPA6). M.A. received grant support from the Else-Kroener Fresenius Foundation (2018_A159). CF received a grant from the German Heart Foundation/German Foundation of Heart Research (F/15/20).

Institutional Review Board Statement

The study was conducted according to the guidelines of the Declaration of Helsinki and approved by the Ethics Committee of the University Hospital Regensburg (Regensburg, 08-151).

Informed Consent Statement

Informed consent was obtained from all subjects involved in the study.

Data Availability Statement

The data presented in this study will be shared on reasonable request to the corresponding author. The data are not publicly available due to privacy restrictions.

Conflicts of Interest

The authors declare no conflict of interest.

Appendix A

Table A1. Reproducibility of PTFV1.
Inter-Observer Reproducibility
ICCCIlowerCIupper
PTFV10.8880.6470.951
ICC: intra class correlation; CI: confidence interval; PTFV1: P wave terminal force in lead V1.

References

  1. Uchôa, C.H.G.; Danzi-Soares, N.D.J.; Nunes, F.S.; de Souza, A.A.L.; Nerbass, F.B.; Pedrosa, R.P.; César, L.A.M.; Lorenzi-Filho, G.; Drager, L.F. Impact of OSA on cardiovascular events aft er coronary artery bypass surgery. Chest 2015, 147, 1352–1360. [Google Scholar] [CrossRef] [PubMed]
  2. Oldenburg, O.; Lamp, B.; Faber, L.; Teschler, H.; Horstkotte, D.; Töpfer, V. Sleep-disordered breathing in patients with symptomatic heart failure. A contemporary study of prevalence in and characteristics of 700 patients. Eur. J. Hear. Fail. 2007, 9, 251–257. [Google Scholar] [CrossRef]
  3. Buchner, S.; Greimel, T.; Hetzenecker, A.; Luchner, A.; Hamer, O.W.; Debl, K.; Poschenrieder, F.; Fellner, C.; Riegger, G.A.; Pfeifer, M.; et al. Natural course of sleep-disordered breathing after acute myocardial infarction. Eur. Respir. J. 2012, 40, 1173–1179. [Google Scholar] [CrossRef]
  4. Lebek, S.; Pichler, K.; Reuthner, K.; Trum, M.; Tafelmeier, M.; Mustroph, J.; Camboni, D.; Rupprecht, L.; Schmid, C.; Maier, L.S.; et al. Enhanced CaMKII-Dependent Late INa Induces Atrial Proarrhythmic Activity in Patients with Sleep-Disordered Breathing. Circ. Res. 2020, 126, 603–615. [Google Scholar] [CrossRef]
  5. Mehra, R.; Benjamin, E.; Shahar, E.; Gottlieb, D.J.; Nawabit, R.; Kirchner, H.L.; Sahadevan, J.; Redline, S. Association of nocturnal arrhythmias with sleep-disordered breathing: The sleep heart health study. Am. J. Respir. Crit. Care Med. 2006, 173, 910–916. [Google Scholar] [CrossRef]
  6. Tung, P.; Anter, E. Atrial fibrillation and sleep apnea: Considerations for a dual epidemic. J. Atr. Fibrillation 2016, 8, 84–90. [Google Scholar] [CrossRef]
  7. McEvoy, R.D.; Antic, N.A.; Heeley, E.; Luo, Y.; Ou, Q.; Zhang, X.; Mediano, O.; Chen, R.; Drager, L.F.; Liu, Z.; et al. CPAP for Prevention of Cardiovascular Events in Obstructive Sleep Apnea. N. Engl. J. Med. 2016, 375, 919–931. [Google Scholar] [CrossRef]
  8. Sánchez-De-La-Torre, M.; Sánchez-De-La-Torre, A.; Bertran, S.; Abad, J.; Duran-Cantolla, J.; Cabriada, V.; Mediano, O.; Masdeu, M.J.; Alonso, M.L.; Masa, J.F.; et al. Effect of obstructive sleep apnoea and its treatment with continuous positive airway pressure on the prevalence of cardiovascular events in patients with acute coronary syndrome (ISAACC study): A randomised controlled trial. Lancet Respir. Med. 2020, 8, 359–367. [Google Scholar] [CrossRef]
  9. Traaen, G.M.; Aakerøy, L.; Hunt, T.-E.; Øverland, B.; Bendz, C.; Sande, L.Ø.; Aakhus, S.; Fagerland, M.W.; Steinshamn, S.; Anfinsen, O.-G.; et al. Effect of Continuous Positive Airway Pressure on Arrhythmia in Atrial Fibrillation and Sleep Apnea: A Randomized Controlled Trial. Am. J. Respir. Crit. Care Med. 2021, 204, 573–582. [Google Scholar] [CrossRef] [PubMed]
  10. Cowie, M.R.; Woehrle, H.; Wegscheider, K.; Angermann, C.; d’Ortho, M.-P.; Erdmann, E.; Lévy, P.; Simonds, A.K.; Somers, V.K.; Zannad, F.; et al. Adaptive Servo-Ventilation for Central Sleep Apnea in Systolic Heart Failure. N. Engl. J. Med. 2015, 373, 1095–1105. [Google Scholar] [CrossRef] [PubMed] [Green Version]
  11. Morrisjr, J.J.; Estesjr, E.H.; Whalen, R.E.; Thompsonjr, H.K.; Mcintosh, H.D. P-Wave Analysis in Valvular Heart Disease. Circulation 1964, 29, 242–252. [Google Scholar] [CrossRef] [Green Version]
  12. Eranti, A.; Aro, A.L.; Kerola, T.; Anttonen, O.; Rissanen, H.A.; Tikkanen, J.T.; Junttila, M.J.; Kenttä, T.V.; Knekt, P.; Huikuri, H.V. Prevalence and prognostic significance of abnormal P terminal force in lead V1 of the ECG in the general population. Circ. Arrhythmia Electrophysiol. 2014, 7, 1116–1121. [Google Scholar] [CrossRef] [Green Version]
  13. Kamel, H.; Hunter, M.; Moon, Y.P.; Yaghi, S.; Cheung, K.; Di Tullio, M.R.; Okin, P.M.; Sacco, R.L.; Soliman, E.Z.; Elkind, M.S. Electrocardiographic left atrial abnormality and risk of stroke: Northern manhattan study. Stroke 2015, 46, 3208–3212. [Google Scholar] [CrossRef] [Green Version]
  14. Goda, T.; Sugiyama, Y.; Ohara, N.; Ikegami, T.; Watanabe, K.; Kobayashi, J.; Takahashi, D. P-Wave Terminal Force in Lead V1 Predicts Paroxysmal Atrial Fibrillation in Acute Ischemic Stroke. J. Stroke Cerebrovasc. Dis. 2017, 26, 1912–1915. [Google Scholar] [CrossRef] [PubMed]
  15. Liu, G.; Tamura, A.; Torigoe, K.; Kawano, Y.; Shinozaki, K.; Kotoku, M.; Kadota, J. Abnormal P-wave terminal force in lead V1 is associated with cardiac death or hospitalization for heart failure in prior myocardial infarction. Hear. Vessel. 2013, 28, 690–695. [Google Scholar] [CrossRef] [PubMed]
  16. Neef, S.; Dybkova, N.; Sossalla, S.; Ort, K.R.; Fluschnik, N.; Neumann, K.; Seipelt, R.; Schöndube, F.A.; Hasenfuss, G.; Maier, L.S. CaMKII-Dependent diastolic SR Ca2+ leak and elevated diastolic Ca2+ levels in right atrial myocardium of patients with atrial fibrillation. Circ. Res. 2010, 106, 1134–1144. [Google Scholar] [CrossRef] [Green Version]
  17. Rossi, V.A.; Stradling, J.R.; Kohler, M. Effects of obstructive sleep apnoea on heart rhythm. Eur. Respir. J. 2012, 41, 1439–1451. [Google Scholar] [CrossRef] [PubMed]
  18. Berry, R.B.; Budhiraja, R.; Gottlieb, D.J.; Gozal, D.; Iber, C.; Kapur, V.K.; Marcus, C.L.; Mehra, R.; Parthasarathy, S.; Quan, S.F.; et al. Rules for scoring respiratory events in sleep: Update of the 2007 AASM manual for the scoring of sleep and associated events. J. Clin. Sleep Med. 2012, 8, 597–619. [Google Scholar] [CrossRef] [Green Version]
  19. Lebek, S.; Wester, M.; Pec, J.; Poschenrieder, F.; Tafelmeier, M.; Fisser, C.; Provaznik, Z.; Schopka, S.; Debl, K.; Schmid, C.; et al. Abnormal P-wave terminal force in lead V 1 is a marker for atrial electrical dysfunction but not structural remodelling. ESC Heart Fail. 2021, 8, 4055–4066. [Google Scholar] [CrossRef]
  20. Ludka, O.; Stepanova, R.; Vyskocilova, M.; Galkova, L.; Mikolaskova, M.; Belehrad, M.; Kostalova, J.; Mihalova, Z.; Drozdova, A.; Hlasensky, J.; et al. Sleep apnea prevalence in acute myocardial infarction - The Sleep Apnea in Post-acute Myocardial Infarction Patients (SAPAMI) Study. Int. J. Cardiol. 2014, 176, 13–19. [Google Scholar] [CrossRef] [Green Version]
  21. Florés, M.; de Batlle, J.; Sánchez-De-La-Torre, A.; Sánchez-De-La-Torre, M.; Aldomá, A.; Worner, F.; Galera, E.; Seminario, A.; Torres, G.; Dalmases, M.; et al. Central sleep apnoea is related to the severity and short-term prognosis of acute coronary syndrome. PLOS ONE 2016, 11, e0167031. [Google Scholar] [CrossRef] [Green Version]
  22. Lanfranchi, P.A.; Somers, V.K.; Braghiroli, A.; Corrà, U.; Eleuteri, E.; Giannuzzi, P. Prevalence and Implications for Arrhythmic Risk. Circulation 2003, 107, 727–732. [Google Scholar] [CrossRef] [PubMed] [Green Version]
  23. Yaghi, S.; Kamel, H.; Elkind, M.S.V. Atrial cardiopathy: A mechanism of cryptogenic stroke. Expert Rev. Cardiovasc. Ther. 2017, 15, 591–599. [Google Scholar] [CrossRef] [PubMed]
  24. Kamel, H.; Okin, P.M.; Elkind, M.S.V.; Iadecola, C. Atrial Fibrillation and Mechanisms of Stroke: Time for a New Model. Stroke 2016, 47, 895–900. [Google Scholar] [CrossRef] [PubMed] [Green Version]
  25. Yaghi, S.; Boehme, A.K.; Hazan, R.; Hod, E.A.; Canaan, A.; Andrews, H.F.; Kamel, H.; Marshall, R.S.; Elkind, M.S. Atrial Cardiopathy and Cryptogenic Stroke: A Cross-sectional Pilot Study. J. Stroke Cerebrovasc. Dis. 2016, 25, 110–114. [Google Scholar] [CrossRef] [PubMed] [Green Version]
  26. Kamel, H.; Longstreth, J.W.; Tirschwell, D.L.; Kronmal, R.A.; Broderick, J.P.; Palesch, Y.Y.; Meinzer, C.; Dillon, C.; Ewing, I.; Spilker, J.A.; et al. The AtRial Cardiopathy and Antithrombotic Drugs In prevention after cryptogenic stroke randomized trial: Rationale and methods. Int. J. Stroke 2019, 14, 207–214. [Google Scholar] [CrossRef] [PubMed]
  27. Wagner, S.; Ruff, H.M.; Weber, S.L.; Bellmann, S.; Sowa, T.; Schulte, T.; Anderson, M.E.; Grandi, E.; Bers, D.; Backs, J.; et al. Reactive oxygen species-activated Ca/calmodulin kinase IIδ is required for late INa augmentation leading to cellular Na and Ca overload. Circ. Res. 2011, 108, 555–565. [Google Scholar] [CrossRef] [PubMed] [Green Version]
  28. Erickson, J.R.; Joiner, M.-L.A.; Guan, X.; Kutschke, W.; Yang, J.; Oddis, C.V.; Bartlett, R.K.; Lowe, J.S.; O’Donnell, S.E.; Aykin-Burns, N.; et al. A Dynamic Pathway for Calcium-Independent Activation of CaMKII by Methionine Oxidation. Cell 2008, 133, 462–474. [Google Scholar] [CrossRef] [Green Version]
  29. Dewan, N.A.; Nieto, F.J.; Somers, V.K. Intermittent Hypoxemia and OSA Implications for Comorbidities. Chest 2015, 147, 266–274. [Google Scholar] [CrossRef] [Green Version]
  30. Varadarajan, V.; Ambale-Venkatesh, B.; Hong, S.Y.; Habibi, M.; Ashikaga, H.; Wu, C.O.; Chen, L.Y.; Heckbert, S.R.; Bluemke, D.A.; Lima, J.A.C. Association of Longitudinal Changes in NT-proBNP With Changes in Left Atrial Volume and Function: MESA. Am. J. Hypertens. 2021, 34, 626–635. [Google Scholar] [CrossRef]
  31. Petersson, R.; Berge, H.M.; Gjerdalen, G.F.; Carlson, J.; Holmqvist, F.; Steine, K.; Platonov, P.G. P-wave morphology is unaffected by atrial size: A study in healthy athletes. Ann. Noninvasive Electrocardiol. 2014, 19, 366–373. [Google Scholar] [CrossRef]
  32. Tsao, C.W.; Josephson, M.E.; Hauser, T.H.; O'Halloran, T.D.; Agarwal, A.; Manning, W.J.; Yeon, S.B. Accuracy of electrocardiographic criteria for atrial enlargement: Validation with cardiovascular magnetic resonance. J. Cardiovasc. Magn. Reson. 2008, 10, 7. [Google Scholar] [CrossRef] [PubMed] [Green Version]
  33. Shah, N.; Redline, S.; Yaggi, H.K.; Wu, R.; Zhao, C.G.; Ostfeld, R.; Menegus, M.; Tracy, D.; Brush, E.; Appel, W.D.; et al. Obstructive sleep apnea and acute myocardial infarction severity: Ischemic preconditioning? Sleep Breath. 2013, 17, 819–826. [Google Scholar] [CrossRef] [PubMed]
  34. Buchner, S.; Satzl, A.; Debl, K.; Hetzenecker, A.; Luchner, A.; Husser, O.; Hamer, O.W.; Poschenrieder, F.; Fellner, C.; Zeman, F.; et al. Impact of sleep-disordered breathing on myocardial salvage and infarct size in patients with acute myocardial infarction. Eur. Hear. J. 2014, 35, 192–199. [Google Scholar] [CrossRef] [PubMed] [Green Version]
  35. Lee, C.-H.; Khoo, S.-M.; Chan, Y.Y.M.; Wong, H.-B.; Low, A.F.; Phua, Q.-H.; Richards, A.M.; Tan, H.-C.; Yeo, T.-C. Severe obstructive sleep apnea and outcomes following myocardial infarction. J. Clin. Sleep Med. 2011, 7, 616–621. [Google Scholar] [CrossRef] [PubMed] [Green Version]
  36. Correia, L.C.L.; Souza, A.C.; Garcia, G.; Sabino, M.; Brito, M.; Maraux, M.; Rabelo, M.M.N.; Esteves, J.P. Obstructive sleep apnea affects hospital outcomes of patients with non-ST-elevation acute coronary syndromes. Sleep 2012, 35, 1241–1245. [Google Scholar] [CrossRef]
  37. Lebek, S.; Plößl, A.; Baier, M.; Mustroph, J.; Tarnowski, D.; Lücht, C.; Schopka, S.; Flörchinger, B.; Schmid, C.; Zausig, Y.; et al. The novel CaMKII inhibitor GS-680 reduces diastolic SR Ca leak and prevents CaMKII-dependent pro-arrhythmic activity. J. Mol. Cell. Cardiol. 2018, 118, 159–168. [Google Scholar] [CrossRef]
Figure 1. P wave terminal force in lead V1. Inset shows magnification.
Jcm 10 05555 g001
Figure 2. Flow diagram.
Jcm 10 05555 g002
Table 1. Baseline characteristics: normal PTFV1 and abnormal PTFV1.
Normal PTFV1
(n = 40)
Abnormal PTFV1
(n = 16)
MeanSDMeanSDp Value
Age[years]53.88±9.8757.88±9.630.174 T
BMI[kg*m−2]28.52±3.0628.82±3.990.771 T
Male[n, %]34 (85%)n.a.11 (68.8%)n.a.0.263 Chi
Arterial hypertension[n, %]19 (47.5%)n.a.9 (60%)n.a.0.409 F
Diabetes mellitus[n, %]6 (15%)n.a.3 (20%)n.a.0.692 F
Hypercholesterolemia[n, %]12 (30%)n.a.5 (33.3%)n.a.1.000 F
LDL-cholesterol[mg*dL−1]136.53±35.33111.57±23.40.018 T
Smoking[n, %]30 (75%)n.a.11 (73.3%)n.a.1.000 F
SDB[n, %]17 (42.5%)n.a.13 (86.7%)n.a.0.003Chi
STEMI[n, %]37 (92.5%)n.a.11 (68.8%)n.a.0.035F
CK max[U*L−1]1993.49±1393.212232.07±1588.630.590 T
Troponin I max[ng*mL−1]29.11±66.6340.26±90.60.638 T
NT-proBNP at discharge[pg*mL−1]774.47±835.612201.19±1390.370.002W
eGFR[mL*min−1*1, 73 m−2]95.16±16.5383.63±28.030.152 W
Resting heart rate[min−1]75.46±12.1375.33±22.140.983 W
Systolic blood pressure[mmHg]127.43±22.79127.67±17.650.971 T
Diastolic blood pressure[mmHg]78.43±12.9575.8±11.380.493 T
LV EF[%]48.93±7.4543.15±11.510.035T
RV EF[%]58.25±8.9859±11.240.808 T
TAPSE[mm]20.12±6.0119.99±4.330.943 T
Systolic LA area[cm2]25.9±4.1924.67±3.530.369 T
Diastolic LA area[cm2]18.11±3.0318.44±3.820.764 T
LA FAC[%]32.56±8.4130.75±11.450.574 T
ACEi/ARB at discharge[n, %]38 (97.4%)n.a.15 (100%)n.a.1.000 F
ACEi/ARB at admission[n, %]4 (10%)n.a.1 (6.7%)n.a.1.000 F
β-Blocker at discharge[n, %]37 (97.4%)n.a.14 (93.3%)n.a.0.490 F
β-Blocker at admission[n, %]1 (2.5%)n.a.1 (6.7%)n.a.0.475 F
Loop diuretics at discharge[n, %]14 (36.8%)n.a.8 (53.3%)n.a.0.272 Chi
Loop diuretics at admission[n, %]0n.a.0n.a.n.a.
MRA at discharge[n, %]16 (42.1%)n.a.10 (66.7%)n.a.0.107 Chi
MRA at admission[n, %]0n.a.0n.a.n.a.
ACEi: ACE-inhibitor; ARB: angiotensin receptor blocker; AHI: apnea-hypopnea-index; BMI: body mass index; CK: creatine kinase; EF: ejection fraction; eGFR: estimated glomerular filtration rate; FAC: fractional area change; LA: left atrium; LV: left ventricle; NT-proBNP: N-terminal pro-B-type natriuretic peptide; MRA: Mineralocorticoid receptor antagonist; PTFV1: P wave terminal force in lead (abnormal ≥4000 µV*ms); RV: right ventricle; SD: standard deviation; SDB: sleep-disordered breathing; STEMI: ST-elevation myocardial infarction; TAPSE: tricuspid annular plane systolic excursion. Bold values mean statistical significance calculated by the two-sided Student‘s t-test(T), Welch’s t-test(W), chi-square test(Chi) or Fischer´s exact test(F).
Table 2. Respiratory and sleep characteristics.
Normal PTFV1
(n = 40)
Abnormal PTFV1
(n = 16)
MeanSDMeanSDp Value
SDB[n, %]17 (42.5%)n.a.13 (86.7%)n.a.0.003Chi
-OSA[n, %]10 (25.6%)n.a.6 (40%)n.a.0.333 F
-CSA[n, %]7 (17.9%)n.a.7 (46.7%)n.a.0.043F
AHI[h-1]14.64±13.9136.14±24.87<0.001T
oAHI[h-1]8.10±8.1612.82±10.430.084 T
cAHI[h-1]6.75±9.5523.32±27.030.034W
ODI[h-1]11.39±9.8828.77±23.690.018W
SaO2 mean%93.18±2.2693.00±1.730.783 T
SaO2 min%85.74±5.8782.20±6.090.055 T
Sleep efficiency%72.15±16.2569.95±12.770.653 T
REM%16.07±6.1714.13±7.230.327 T
ESS 7.32±4.575.75±2.600.147 W
AHI: apnea-hypopnea-index; CSA: central sleep apnea; ESS: Epworth Sleepiness Scale score; ODI: oxygen desaturation index; OSA: obstructive sleep apnea; PTFV1: P wave terminal force in lead (abnormal ≥4000 µV*ms); REM: % of total sleep time spent in rapid eye movement sleep stage; SD: standard deviation; SaO2: arterial oxygen saturation; SDB: sleep-disordered breathing; Bold values mean statistical significance calculated by the two-sided Student‘s t-test(T), Welch´s t-test(W), chi-square test(Chi) or Fischer´s exact test(F).
Table 3. Univariate linear regression of PTFV1.
Univariate Linear Regression Analysis with PTFV1
PTFV1 [µV*ms]B95% CIR2 (adj.)p Value
ODI [h-1]68.11635.992 to 100.2400.268<0.001
AHI [h-1]48.84522.644 to 75.0450.197<0.001
cAHI [h-1]46.81015.375 to 78.2460.1280.004
oAHI [h-1]56.127−7.940 to 120.1940.0390.085
NT-proBNP at discharge [pg/mL]0.6280.109 to 1.1480.0970.019
LV EF [%]−60.863−132.377 to 10.6510.0360.094
Age [y]47.404−9.450 to 104.2580.0320.100
eGFR [mL*min−1* 1,73 m−2]−23.099−51.033 to 4.8450.0320.103
RR sys [mmHg]19.564−8.311 to 47.4380.0180.165
BMI [kg/m2]87.580−88.285 to 263.446< 0.0010.322
Trop I max [ng/mL]3.950−4.516 to 12.416−0.0020.353
Systolic LA area−71.394−239.042 to 96.255−0.0060.395
CK max [U/l]0.132−0.276 to 0.540−0.0110.518
Smoking402.290−943.843 to 1748.422−0.0120.551
Male sex−303.380−1741.292 to 1134.532−0.0150.674
Diabetes mellitus251.791−1296.227 to 1799.809−0.0170.745
LA FAC [%]−10.620−85.278 to 64.038−0.0220.775
AHI: apnea-hypopnea-index; BMI: body mass index; BNP: brain natriuretic peptide; CI: confidence interval; CK: creatine kinase; EF: ejection fraction; eGFR: estimated glomerular filtration rate; FAC: fractional area change; LA: left atrium; LV: left ventricle; ODI: oxygen desaturation index; PTFV1: P wave terminal force in lead V1; RA: right atrium; RRsys: systolic blood pressure; Trop: Troponin I; Bold values mean statistical significance.
Table 4. Multivariate linear regression of PTFV1.
Model 1 (with ODI)
Multiple Linear Regression Analysis
R2 = 0.408 (adj. R2 = 0.317); p = 0.002
Model 2 (with AHI)
Multiple Linear Regression Analysis
R2 = 0.330 (adj. R2 = 0.227); p = 0.012
Model 3 (with cAHI)
Multiple Linear Regression Analysis
R2 = 0.256 (adj. R2 = 0.186); p = 0.014
PTFV1 [µV*ms]B *
[95% CI]
P #B *
[95% CI]
P #B *
[95% CI]
P #
ODI [h-1]65.619
[29.717 to 101.522]
0.001
AHI [h-1] 45.170
[11.903 to 78.437]
0.009
cAHI [h-1] 45.172
[11.905 to 78.440]
0.009
oAHI [h-1]−20.049
[−87.368 to 47.269]
0.550−7.992
[−79.286 to 63.303]
0.82237.178
[−27.626 to 101.983]
0.253
NT-proBNP at discharge [pg/mL]0.375
[−0.139 to 0.888]
0.1480.402
[−0.146 to 0.950]
0.1460.402
[−0.146 to 0.950]
0.146
LV EF [%]−60.432
[−128.593 to 7.729]
0.081−50.472
[−122.825 to 21.882]
0.166−50.472
[−122.825 to 21.881]
0.166
Age [y]−24.189
[−101.905 to 53.527]
0.533−40.920
[−123.645 to 41.806]
0.323−40.917
[−123.642 to 41.808]
0.323
eGFR [mL*min−1* 1,73 m−2]−24.263
[−58.700 to 10.175]
0.162−30.712
[−67.833 to 6.409]
0.102−30.710
[−67.831 to 6.411]
0.102
AHI: apnea-hypopnea-index; CI: confidence interval; EF: ejection fraction; eGFR: estimated glomerular filtration rate; LV: left ventricle; NT-proBNP: N-terminal pro-B-type natriuretic peptide; ODI: oxygen desaturation index; PTFV1: P wave terminal force in lead V1; Bold values mean statistical significance, * beta coefficient, # p value.
Table 5. Univariate and multivariate linear regression of AHI.
Univariate Linear Regression Analysis with AHIModel 1
Multiple Linear Regression Analysis
R2 = 0.326 (adj. R2 = 0.213); p = 0.021
Model 2
Multiple Linear Regression Analysis
R2 = 0.351 (adj. R2 = 0.245); p = 0.010
AHI [h-1]B
[95% CI]
p ValueR2 (adj.)B
[95% CI]
p ValueB
[95% CI]
p Value
PTFV1 [µV*ms]0.004
[0.002 to 0.07]
<0.0010.1970.004
[0.001 to 0.07]
0.024
Abnormal PTFV121.495
[10.872 to 32.118]
<0.0010.223 21.209
[4.452 to 37.966]
0.015
BMI [kg/m2]1.807
[0.231 to 3.382]
0.0250.0741.737
[−0.156 to 3.630]
0.0711.500
[−0.296 to 3.295]
0.099
NT-proBNP at discharge [pg/mL]0.005
[<0.001 to 0.009]
0.0620.0530.002
[−0.004 to 0.007]
0.4870.001
[−0.007 to 0.006]
0.823
Systolic LA area0.876
[−0.187 to 1.940]
0.1040.038−0.048
[−1.187 to 1.091]
0.9320.255
[−0.815 to 1.325]
0.632
Smoking−8.729
[−20.929 to 3.471]
0.1570.019−7.268
[−21.764 to7.227]
0.316−9.148
[−23.060 to 4.765]
0.191
LV EF [%]−0.443
[−1.075 to 0.188]
0.1640.020−0.125
[−0.832 to 0.582]
0.723−0.148
[−0.798 to 0.501]
0.646
Male sex7.269
[−6.631 to 21.169]
0.2990.002
LA FAC [%]−0.299
[−0.985 to 0.386]
0.384−0.005
Age [y]0.218
[−0.342 to 0.778]
0.438−0.007
RR sys [mmHg]0.073
[−0.182 to 0.328]
0.570−0.013
Trop I max [ng/mL]0.012
[−0.068 to 0.092]
0.768−0.019
eGFR [mL*min−1* 1,73 m−2]−0.030
[−0.294 to 0.234]
0.822−0.018
CK max [U/l]<0.001
[−0.005 to 0.005]
0.917−0.021
Diabetes mellitus0.416
[−14.225 to 15.057]
0.955−0.019
AHI: apnea-hypopnea-index; BMI: body mass index; CI: confidence interval; CK: creatine kinase; EF: ejection fraction; FAC: fractional area change; LA: left atrium; LV: left ventricle; NT-proBNP: N-terminal pro-B-type natriuretic peptide; ODI: oxygen desaturation index; P wave terminal force in lead V1 (PTFV1) (abnormal ≥4000 µV*ms); RA: right atrium; RRsys: systolic blood pressure; Trop: Troponin I; Bold values mean statistical significance.
Publisher’s Note: MDPI stays neutral with regard to jurisdictional claims in published maps and institutional affiliations.

