
Assessment of Selected Baseline and Post-PCI Electrocardiographic Parameters as Predictors of Left Ventricular Systolic Dysfunction after a First ST-Segment Elevation Myocardial Infarction


Abstract
1. Introduction
2. Methods
2.1. Study Design
- heart rate,
- location of STEMI,
- number of leads with ST-segment elevation,
- sum of ST-segment elevation in all leads,
- maximal ST-segment elevation in a single lead,
- ST-segment resolution,
- presence of reciprocal ST-segment depression ≥0.1 mV on admission to hospital,
- number of leads with pathological Q-waves [19],
- Sclarovsky-Birnbaum ischemia score [2],
- QRS complex duration.
2.2. Echocardiographic Assessment
2.3. Data Collection and Statistical Analysis
3. Results
3.1. The Course of the Study
3.2. Clinical, Demographic, Angiographic and Biochemical Parameters
3.3. Echocardiographic Characteristics
3.4. Electrocardiographic Characteristics
3.5. Characteristics Comparison of Patients with and without LVSD
3.6. Electrocardiographic Characteristics of Patients with LVSD
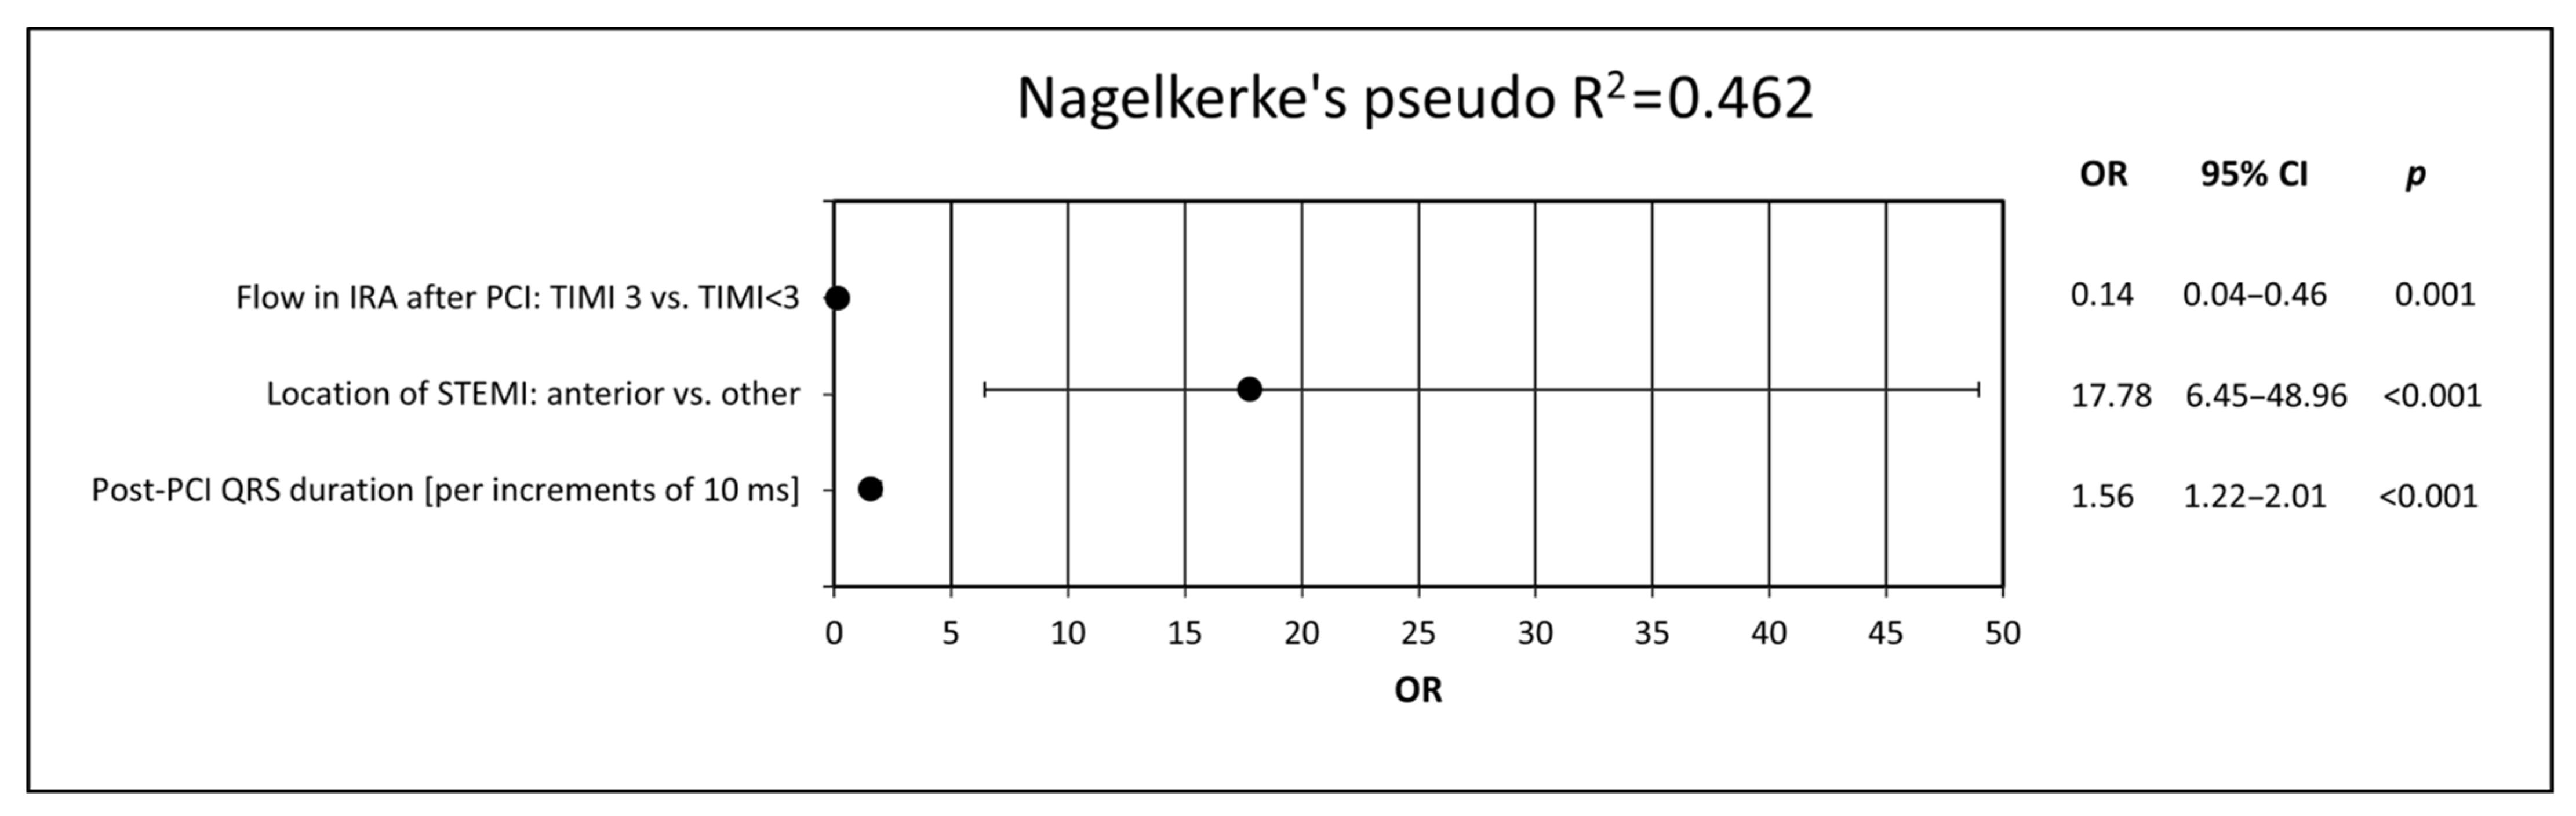
3.7. Predictors of the Presence of LVSD 6 Months after Discharge from Hospital
3.8. Determinants of LVEF Deterioration
4. Discussion
4.1. General Findings and Study Strengths
4.2. Heart Rate
4.3. STEMI Location
4.4. ST-Segment-Elevation-Related Parameters
4.5. ST-Segment Resolution
4.6. Reciprocal ST-Segment Depression
4.7. Pathological Q-Waves
4.8. Sclarovsky-Birnbaum Ischemia Score
4.9. QRS Duration
4.10. Detailed Analysis of the Study Results
4.11. Study Limitations
5. Conclusions
Author Contributions
Funding
Institutional Review Board Statement
Informed Consent Statement
Data Availability Statement
Acknowledgments
Conflicts of Interest
References
- Fye, W.B. A history of the origin, evolution, and impact of electrocardiography. Am. J. Cardiol. 1994, 73, 937–949. [Google Scholar] [CrossRef]
- Herring, N.; Paterson, D.J. ECG diagnosis of acute ischaemia and infarction: Past, present and future. QJM 2006, 99, 219–230. [Google Scholar] [CrossRef] [PubMed]
- Siha, H.; Das, D.; Fu, Y.; Zheng, Y.; Westerhout, C.M.; Storey, R.F.; James, S.; Wallentin, L.; Armstrong, P.W. Baseline Q waves as a prognostic modulator in patients with ST segment elevation: Insights from the PLATO trial. CMAJ 2012, 184, 1135–1142. [Google Scholar] [CrossRef] [PubMed]
- Kaul, P.; Fu, Y.; Westerhout, C.M.; Granger, C.B.; Armstrong, P.W. Relative prognostic value of baseline Q wave and time from symptom onset among men and women with ST-elevation myocardial infarction undergoing percutaneous coronary intervention. Am. J. Cardiol. 2012, 110, 1555–1560. [Google Scholar] [CrossRef]
- Weir, R.A.; McMurray, J.J. Epidemiology of heart failure and left ventricular dysfunction after acute myocardial infarction. Curr. Heart Fail. Rep. 2006, 3, 175–180. [Google Scholar] [CrossRef]
- Sutton, M.G.; Sharpe, N. Left ventricular remodeling after myocardial infarction: Pathophysiology and therapy. Circulation 2000, 101, 2981–2988. [Google Scholar] [CrossRef]
- Minicucci, M.F.; Azevedo, P.S.; Polegato, B.F.; Paiva, S.A.; Zornoff, L.A. Heart failure after myocardial infarction: Clinical implications and treatment. Clin. Cardiol. 2011, 34, 410–414. [Google Scholar] [CrossRef]
- Cohn, J.N.; Ferrari, R.; Sharpe, N. Cardiac remodeling—Concepts and clinical implications: A consensus paper from an international forum on cardiac remodeling. Behalf of an International Forum on Cardiac Remodeling. J. Am. Coll. Cardiol. 2000, 35, 569–582. [Google Scholar] [CrossRef]
- Weir, R.A.; McMurray, J.J.; Velazquez, E.J. Epidemiology of heart failure and left ventricular systolic dysfunction after acute myocardial infarction: Prevalence, clinical characteristics, and prognostic importance. Am. J. Cardiol. 2006, 97, 13F–25F. [Google Scholar] [CrossRef]
- Velazquez, E.J.; Francis, G.S.; Armstrong, P.W.; Aylward, P.E.; Diaz, R.; O’Connor, C.M.; White, H.D.; Henis, M.; Rittenhouse, L.M.; Kilaru, R.; et al. An international perspective on heart failure and left ventricular systolic dysfunction complicating myocardial infarction: The VALIANT registry. Eur. Heart J. 2004, 25, 1911–1919. [Google Scholar] [CrossRef]
- Świątkiewicz, I.; Magielski, P.; Woźnicki, M.; Gierach, J.; Jabłoński, M.; Fabiszak, T.; Koziński, M.; Sukiennik, A.; Bronisz, A.; Kubica, J. Occurrence and predictors of left ventricular systolic dysfunction at hospital discharge and in long-term follow-up after acute myocardial infarction treated with primary percutaneous coronary intervention. Kardiol. Pol. 2012, 70, 329–340. [Google Scholar] [PubMed]
- Nicod, P.; Gilpin, E.; Dittrich, H.; Chappuis, F.; Ahnve, S.; Engler, R.; Henning, H.; Ross, J., Jr. Influence on prognosis and morbidity of left ventricular ejection fraction with and without signs of left ventricular failure after acute myocardial infarction. Am. J. Cardiol. 1988, 61, 1165–1171. [Google Scholar] [CrossRef]
- Ottervanger, J.P.; Ramdat Misier, A.R.; Dambrink, J.H.; de Boer, M.J.; Hoorntje, J.C.; Gosselink, A.T.; Suryapranata, H.; Reiffers, S.; van ’t Hof, A.W.J. Mortality in patients with left ventricular ejection fraction ≤30% after primary percutaneous coronary intervention for ST-elevation myocardial infarction. Am. J. Cardiol. 2007, 100, 793–797. [Google Scholar] [CrossRef] [PubMed]
- Daneault, B.; Généreux, P.; Kirtane, A.J.; Witzenbichler, B.; Guagliumi, G.; Paradis, J.M.; Fahy, M.P.; Mehran, R.; Stone, G.W. Comparison of Three-year outcomes after primary percutaneous coronary intervention in patients with left ventricular ejection fraction <40% versus ≥40% (from the HORIZONS-AMI trial). Am. J. Cardiol. 2013, 111, 12–20. [Google Scholar] [CrossRef] [PubMed]
- Marenzi, G.; Moltrasio, M.; Assanelli, E.; Lauri, G.; Marana, I.; Grazi, M.; Rubino, M.; De Metrio, M.; Veglia, F.; Bartorelli, A.L. Impact of cardiac and renal dysfunction on inhospital morbidity and mortality of patients with acute myocardial infarction undergoing primary angioplasty. Am. Heart J. 2007, 153, 755–762. [Google Scholar] [CrossRef] [PubMed]
- Murkofsky, R.L.; Dangas, G.; Diamond, J.A.; Mehta, D.; Schaffer, A.; Ambrose, J.A. A prolonged QRS duration on surface electrocardiogram is a specific indicator of left ventricular dysfunction. J. Am. Coll. Cardiol. 1998, 32, 476–482. [Google Scholar] [CrossRef]
- Manes, C.; Pfeffer, M.A.; Rutherford, J.D.; Greaves, S.; Rouleau, J.L.; Arnold, J.M.; Menapace, F.; Solomon, S.D. Value of the electrocardiogram in predicting left ventricular enlargement and dysfunction after myocardial infarction. Am. J. Med. 2003, 114, 99–105. [Google Scholar] [CrossRef]
- Kasprzak, M.; Fabiszak, T.; Koziński, M.; Kubica, J. Diagnostic Performance of Selected Baseline Electrocardiographic Parameters for Prediction of Left Ventricular Remodeling in Patients with ST-Segment Elevation Myocardial Infarction. J. Clin. Med. 2021, 10, 2405. [Google Scholar] [CrossRef] [PubMed]
- Thygesen, K.; Alpert, J.S.; White, H.D. on behalf of the Joint ESC/ACCF/AHA/WHF Task Force for the Redefinition of Myocardial Infarction. Universal definition of myocardial infarction. Eur. Heart J. 2007, 28, 2525–2538. [Google Scholar]
- Raymond, I.; Mehlsen, J.; Pedersen, F.; Dimsits, J.; Jacobsen, J.; Hildebrandt, P.R. The prognosis of impaired left ventricular systolic function and heart failure in a middle-aged and elderly population in an urban population segment of Copenhagen. Eur. J. Heart Fail. 2004, 6, 653–661. [Google Scholar] [CrossRef]
- Krumholz, H.M.; Chen, J.; Chen, Y.T.; Wang, Y.; Radford, M.J. Predicting one-year mortality among elderly survivors of hospitalization for an acute myocardial infarction: Results from the Cooperative Cardiovascular Project. J. Am. Coll. Cardiol. 2001, 38, 453–459. [Google Scholar] [CrossRef]
- Rott, D.; Behar, S.; Hod, H.; Feinberg, M.S.; Boyko, V.; Mandelzweig, L.; Kaplinsky, E.; Gottlieb, S.; Argatroban in Acute Myocardial Infarction-2 (ARGAMI-2) Study Group. Improved survival of patients with acute myocardial infarction with significant left ventricular dysfunction undergoing invasive coronary procedures. Am. Heart J. 2001, 141, 267–276. [Google Scholar] [CrossRef] [PubMed]
- Swiatkiewicz, I.; Kozinski, M.; Magielski, P.; Gierach, J.; Fabiszak, T.; Kubica, A.; Sukiennik, A.; Navarese, E.P.; Odrowaz-Sypniewska, G.; Kubica, J. Usefulness of C-reactive protein as a marker of early post-infarct left ventricular systolic dysfunction. Inflamm. Res. 2012, 61, 725–734. [Google Scholar] [CrossRef] [PubMed][Green Version]
- Møller, J.E.; Brendorp, B.; Ottesen, M.; Køber, L.; Egstrup, K.; Poulsen, S.H.; Torp-Pedersen, C. Congestive heart failure with preserved left ventricular systolic function after acute myocardial infarction: Clinical and prognostic implications. Eur. J. Heart Fail. 2003, 5, 811–819. [Google Scholar] [CrossRef]
- McDonagh, T.A.; Metra, M.; Adamo, M.; Gardner, R.S.; Baumbach, A.; Böhm, M.; Burri, H.; Butler, J.; Čelutkienė, J.; Chioncel, O.; et al. 2021 ESC Guidelines for the diagnosis and treatment of acute and chronic heart failure. Eur Heart J. 2021, 42, 3599–3726. [Google Scholar] [CrossRef]
- Ibanez, B.; James, S.; Agewall, S.; Antunes, M.J.; Bucciarelli-Ducci, C.; Bueno, H.; Caforio, A.L.P.; Crea, F.; Goudevenos, J.A.; Halvorsen, S.; et al. 2017 ESC Guidelines for the management of acute myocardial infarction in patients presenting with ST-segment elevation: The Task Force for the management of acute myocardial infarction in patients presenting with ST-segment elevation of the European Society of Cardiology (ESC). Eur. Heart J. 2018, 39, 119–177. [Google Scholar]
- Lang, R.; Bierig, M.; Devereux, B.; Flachskampf, F.A.; Foster, E.; Pellikka, P.A.; Picard, M.H.; Roman, M.J.; Seward, J.; Shanewise, J.; et al. Recommendations for chamber quantification. Eur. J. Echocardiogr. 2006, 7, 79–108. [Google Scholar] [CrossRef]
- Schiller, N.; Shah, P.; Crawford, M.; DeMaria, A.; Devereux, R.; Feigenbaum, H.; Gutgesell, H.; Reichek, N.; Sahn, D.; Schnittger, I.; et al. Recommendations for quantitation of the left ventricle by two-dimensional echocardiography. J. Am. Soc. Echocardiogr. 1989, 2, 358–367. [Google Scholar] [CrossRef]
- Kannel, W.B. Risk stratification in hypertension: New insights from the Framingham Study. Am. J. Hypertens. 2000, 13, 3S–10S. [Google Scholar] [CrossRef]
- Hori, M.; Okamoto, H. Heart rate as a target of treatment of chronic heart failure. J. Cardiol. 2012, 60, 86–90. [Google Scholar] [CrossRef]
- Perret-Guillaume, C.; Joly, L.; Benetos, A. Heart rate as a risk factor for cardiovascular disease. Prog. Cardiovasc. Dis. 2009, 52, 6–10. [Google Scholar] [CrossRef] [PubMed]
- Palatini, P.; Thijs, L.; Staessen, J.A.; Fagard, R.H.; Bulpitt, C.J.; Clement, D.L.; de Leeuw, P.W.; Jaaskivi, M.; Leonetti, G.; Nachev, C.; et al. Predictive value of clinic and ambulatory heart rate for mortality in elderly subjects with systolic hypertension. Arch. Intern. Med. 2002, 162, 2313–2321. [Google Scholar] [CrossRef] [PubMed]
- Reunanen, A.; Karjalainen, J.; Ristola, P.; Heliövaara, M.; Knekt, P.; Aromaa, A. Heart rate and mortality. J. Intern. Med. 2000, 247, 231–239. [Google Scholar] [CrossRef]
- Jensen, M.T.; Marott, J.L.; Allin, K.H.; Nordestgaard, B.G.; Jensen, G.B. Resting heart rate is associated with cardiovascular and all-cause mortality after adjusting for inflammatory markers: The Copenhagen City Heart Study. Eur. J. Prev. Cardiol. 2012, 19, 102–108. [Google Scholar] [CrossRef]
- Jouven, X.; Empana, J.P.; Schwartz, P.J.; Desnos, M.; Courbon, D.; Ducimetière, P. Heart-rate profile during exercise as a predictor of sudden death. N. Engl. J. Med. 2005, 352, 1951–1958. [Google Scholar] [CrossRef] [PubMed]
- Diaz, A.; Bourassa, M.G.; Guertin, M.C.; Tardif, J.C. Long-term prognostic value of resting heart rate in patients with suspected or proven coronary artery disease. Eur. Heart J. 2005, 26, 967–974. [Google Scholar] [CrossRef] [PubMed]
- Shaper, A.G.; Wannamethee, G.; Macfarlane, P.W.; Walker, M. Heart rate, ischaemic heart disease, and sudden cardiac death in middle-aged British men. Br. Heart J. 1993, 70, 49–55. [Google Scholar] [CrossRef]
- Kolloch, R.; Legler, U.F.; Champion, A.; Cooper-Dehoff, R.M.; Handberg, E.; Zhou, Q.; Pepine, C.J. Impact of resting heart rate on outcomes in hypertensive patients with coronary artery disease: Findings from the INternationalVErapamil-SR/trandolapril STudy (INVEST). Eur. Heart J. 2008, 29, 1327–1334. [Google Scholar] [CrossRef]
- O’Riordan, M. High Heart Rate Linked with Increased Mortality in Stable Coronary Heart Disease. Medscape 2010. Available online: http://www.medscape.com/viewarticle/731449 (accessed on 14 October 2021).
- Lonn, E.M.; Rambihar, S.; Gao, P.; Custodis, F.F.; Sliwa, K.; Teo, K.K.; Yusuf, S.; Böhm, M. Heart rate is associated with increased risk of major cardiovascular events, cardiovascular and all-cause death in patients with stable chronic cardiovascular disease: An analysis of ONTARGET/TRANSCEND. Clin. Res. Cardiol. 2014, 103, 149–159. [Google Scholar] [CrossRef]
- MERIT-HF Study Group. Effect of metoprolol CR/XL in chronic heart failure: Metoprolol CR/XL Randomised Intervention Trial in Congestive Heart Failure (MERIT-HF). Lancet 1999, 353, 2001–2007. [Google Scholar] [CrossRef]
- Gullestad, L.; Wikstrand, J.; Deedwania, P.; Hjalmarson, A.; Egstrup, K.; Elkayam, U.; Gottlieb, S.; Rashkow, A.; Wedel, H.; Bermann, G.; et al. What resting heart rate should one aim for when treating patients with heart failure with a beta-blocker? Experiences from the Metoprolol Controlled Release/Extended Release Randomized Intervention Trial in Chronic Heart Failure (MERIT-HF). J. Am. Coll. Cardiol. 2005, 45, 252–259. [Google Scholar] [CrossRef] [PubMed]
- Lechat, P.; Hulot, J.S.; Escolano, S.; Mallet, A.; Leizorovicz, A.; Werhlen-Grandjean, M.; Pochmalicki, G.; Dargie, H. Heart rate and cardiac rhythm relationships with bisoprolol benefit in chronic heart failure in CIBIS II Trial. Circulation 2001, 103, 1428–1433. [Google Scholar] [CrossRef] [PubMed]
- Böhm, M.; Swedberg, K.; Komajda, M.; Borer, J.S.; Ford, I.; Dubost-Brama, A.; Dubost-Brama, A.; Lerebours, G.; Tavazzi, L. Heart rate as a risk factor in chronic heart failure (SHIFT): The association between heart rate and outcomes in a randomised placebo-controlled trial. Lancet 2010, 376, 886–894. [Google Scholar] [CrossRef]
- Swedberg, K.; Komajda, M.; Böhm, M.; Borer, J.S.; Ford, I.; Dubost-Brama, A.; Lerebours, G.; Tavazzi, L. Ivabradine and outcomes in chronic heart failure (SHIFT): A randomised placebo-controlled study. Lancet 2010, 376, 875–885. [Google Scholar] [CrossRef]
- Berton, G.S.; Cordiano, R.; Palmieri, R.; Gheno, G.; Mormino, P.; Palatini, P. Heart rate during myocardial infarction: Relationship with one-year global mortality in men and women. Can. J. Cardiol. 2002, 18, 495–502. [Google Scholar] [PubMed]
- Hjalmarson, A.; Gilpin, E.A.; Kjekshus, J.; Schieman, G.; Nicod, P.; Henning, H.; Ross, J., Jr. Influence of heart rate on mortality after acute myocardial infarction. Am. J. Cardiol. 1990, 65, 547–553. [Google Scholar] [CrossRef]
- Zuanetti, G.; Hernandez-Bernal, F.; Rossi, A.; Comerio, G.; Paolucci, G.; Maggioni, A.P. Relevance of heart rate as a prognostic factor in patients with acute myocardial infarction: The GISSI experience. Eur. Heart J. 1999, 1, H52–H57. [Google Scholar]
- Antoni, M.L.; Boden, H.; Delgado, V.; Boersma, E.; Fox, K.; Schalij, M.J.; Bax, J.J. Relationship between discharge heart rate and mortality in patients after acute myocardial infarction treated with primary percutaneous coronary intervention. Eur. Heart J. 2012, 33, 96–102. [Google Scholar] [CrossRef]
- Hathaway, W.R.; Peterson, E.D.; Wagner, G.S.; Granger, C.B.; Zabel, K.M.; Pieper, K.S.; Clark, K.A.; Woodlief, L.H.; Califf, R.M. Prognostic significance of the initial electrocardiogram in patients with acute myocardial infarction. GUSTO-I Investigators. Global Utilization of Streptokinase and t-PA for Occluded Coronary Arteries. JAMA 1998, 279, 387–391. [Google Scholar] [CrossRef]
- Harjai, K.J.; Mehta, R.H.; Stone, G.W.; Boura, J.A.; Grines, L.; Brodie, B.R.; Cox, D.A.; O’Neill, W.W.; Grines, C.L. Does proximal location of culprit lesion confer worse prognosis in patients undergoing primary percutaneous coronary intervention for ST elevation myocardial infarction? J. Interv. Cardiol. 2006, 19, 285–294. [Google Scholar] [CrossRef]
- Conde-Vela, C.; Moreno, R.; Hernández, R.; Pérez-Vizcayno, M.J.; Alfonso, F.; Escaned, J.; Sabaté, M.; Bañuelos, C.; Macaya, C. Cardiogenic shock at admission in patients with multivessel disease and acute myocardial infarction treated with percutaneous coronary intervention: Related factors. Int. J. Cardiol. 2007, 123, 29–33. [Google Scholar] [CrossRef]
- Jarai, R.; Huber, K.; Bogaerts, K.; Sinnaeve, P.R.; Ezekowitz, J.; Ross, A.M.; Zeymer, U.; Armstrong, P.W.; Van de Werf, F.J. Prediction of cardiogenic shock using plasma B-type natriuretic peptide and the N-terminal fragment of its pro-hormone [corrected] concentrations in ST elevation myocardial infarction: An analysis from the ASSENT-4 Percutaneous Coronary Intervention Trial. Crit. Care Med. 2010, 38, 1793–1801. [Google Scholar] [CrossRef] [PubMed]
- Bolognese, L.; Neskovic, A.N.; Parodi, G.; Cerisano, G.; Buonamici, P.; Santoro, G.M.; Antoniucci, D. Left ventricular remodeling after primary coronary angioplasty: Patterns of left ventricular dilation and long-term prognostic implications. Circulation 2002, 106, 2351–2357. [Google Scholar] [CrossRef] [PubMed]
- Mattichak, S.J.; Harjai, K.J.; Dutcher, J.R.; Boura, J.A.; Stone, G.; Cox, D.; Brodie, B.R.; O’Neill, W.W.; Grines, C.L. Left ventricular remodeling and systolic deterioration in acute myocardial infarction: Findings from the Stent-PAMI Study. J. Interv. Cardiol. 2005, 18, 255–260. [Google Scholar] [CrossRef]
- Rodríguez-Palomares, J.F.; Figueras-Bellot, J.; Descalzo, M.; Moral, S.; Otaegui, I.; Pineda, V.; Del Blanco, B.G.; González-Alujas, M.T.; Evangelista Masip, A.; García-Dorado, D. Relation of ST-segment elevation before and after percutaneous transluminal coronary angioplasty to left ventricular area at risk, myocardial infarct size, and systolic function. Am. J. Cardiol. 2014, 113, 593–600. [Google Scholar] [CrossRef] [PubMed]
- Mauri, F.; Franzosi, M.G.; Maggioni, A.P.; Santoro, E.; Santoro, L. Clinical value of 12-lead electrocardiography to predict the long-term prognosis of GISSI-1 patients. J. Am. Coll. Cardiol. 2002, 39, 1594–1600. [Google Scholar] [CrossRef][Green Version]
- Sejersten, M.; Ripa, R.S.; Maynard, C.; Wagner, G.S.; Andersen, H.R.; Grande, P.; Mortensen, L.S.; Clemmensen, P. Usefulness of quantitative baseline ST-segment elevation for predicting outcomes after primary coronary angioplasty or fibrinolysis (results from the DANAMI-2 trial). Am. J. Cardiol. 2006, 97, 611–616. [Google Scholar] [CrossRef]
- Husser, O.; Bodí, V.; Sanchis, J.; Núnez, J.; Mainar, L.; Rumiz, E.; López-Lereu, M.P.; Monmeneu, J.; Chaustre, F.; Trapero, I.; et al. The sum of ST-segment elevation is the best predictor of microvascular obstruction in patients treated successfully by primary percutaneous coronary intervention. Cardiovascular magnetic resonance study. Rev. Esp. Cardiol. 2010, 63, 1145–1154. [Google Scholar] [CrossRef]
- Bigi, R.; Mafrici, A.; Colombo, P.; Gregori, D.; Corrada, E.; Alberti, A.; De Biase, A.; Orrego, P.S.; Fiorentini, C.; Klugmann, S. Relation of terminal QRS distortion to left ventricular functional recovery and remodeling in acute myocardial infarction treated with primary angioplasty. Am. J. Cardiol. 2005, 96, 1233–1236. [Google Scholar] [CrossRef]
- Van der Zwaan, H.B.; Stoel, M.G.; Roos-Hesselink, J.W.; Veen, G.; Boersma, E.; von Birgelen, C. Early versus late ST-segment resolution and clinical outcomes after percutaneous coronary intervention for acute myocardial infarction. Neth. Heart J. 2010, 18, 416–422. [Google Scholar] [CrossRef]
- Farkouh, M.E.; Reiffel, J.; Dressler, O.; Nikolsky, E.; Parise, H.; Cristea, E.; Baran, D.A.; Dizon, J.; Merab, J.P.; Lansky, A.J.; et al. Relationship between ST-segment recovery and clinical outcomes after primary percutaneous coronary intervention: The HORIZONS-AMI ECG substudy report. Circ. Cardiovasc. Interv. 2013, 6, 216–223. [Google Scholar] [CrossRef] [PubMed]
- Vaturi, M.; Birnbaum, Y. The use of the electrocardiogram to identify epicardial coronary and tissue reperfusion in acute myocardial infarction. J. Thromb. Thrombolysis 2000, 10, 137–147. [Google Scholar] [CrossRef] [PubMed]
- Kumar, S.; Sivagangabalan, G.; Hsieh, C.; Ryding, A.D.; Narayan, A.; Chan, H.; Burgess, D.C.; Ong, A.T.; Sadick, N.; Kovoor, P. Predictive value of ST resolution analysis performed immediately versus at ninety minutes after primary percutaneous coronary intervention. Am. J. Cardiol. 2010, 105, 467–474. [Google Scholar] [CrossRef] [PubMed]
- Matetzky, S.; Novikov, M.; Gruberg, L.; Freimark, D.; Feinberg, M.; Elian, D.; Novikov, I.; Di Segni, E.; Agranat, O.; Har-Zahav, Y.; et al. The significance of persistent ST elevation versus early resolution of ST segment elevation after primary PTCA. J. Am. Coll. Cardiol. 1999, 34, 1932–1938. [Google Scholar] [CrossRef]
- Buller, C.E.; Fu, Y.; Mahaffey, K.W.; Todaro, T.G.; Adams, P.; Westerhout, C.M.; White, H.D.; van ’t Hof, A.W.; Van de Werf, F.J.; Wagner, G.S.; et al. ST-segment recovery and outcome after primary percutaneous coronary intervention for ST-elevation myocardial infarction: Insights from the Assessment of Pexelizumab in Acute Myocardial Infarction (APEX-AMI) trial. Circulation 2008, 118, 1335–1346. [Google Scholar] [CrossRef]
- Wolak, A.; Yaroslavtsev, S.; Amit, G.; Birnbaum, Y.; Cafri, C.; Atar, S.; Gilutz, H.; Ilia, R.; Zahger, D. Grade 3 ischemia on the admission electrocardiogram predicts failure of ST resolution and of adequate flow restoration after primary percutaneous coronary intervention for acute myocardial infarction. Am. Heart J. 2007, 153, 410–417. [Google Scholar] [CrossRef] [PubMed]
- Schröder, R.; Wegscheider, K.; Schröder, K.; Dissmann, R.; Meyer-Sabellek, W. Extent of early ST segment elevation resolution: A strong predictor of outcome in patients with acute myocardial infarction and a sensitive measure to compare thrombolytic regimens. A substudy of the International Joint Efficacy Comparison of Thrombolytics (INJECT) trial. J. Am. Coll. Cardiol. 1995, 26, 1657–1664. [Google Scholar] [PubMed]
- Peterson, E.D.; Hathaway, W.R.; Zabel, K.M.; Pieper, K.S.; Granger, C.B.; Wagner, G.S.; Topol, E.J.; Bates, E.R.; Simoons, M.L.; Califf, R.M. Prognostic significance of precordial ST segment depression during inferior myocardial infarction in the thrombolytic era: Results in 16,521 patients. J. Am. Coll. Cardiol. 1996, 28, 305–312. [Google Scholar] [CrossRef][Green Version]
- Birnbaum, Y.; Herz, I.; Sclarovsky, S.; Zlotikamien, B.; Chetrit, A.; Olmer, L.; Barbash, G.I. Prognostic significance of precordial ST segment depression on admission electrocardiogram in patients with inferior wall myocardial infarction. J. Am. Coll. Cardiol. 1996, 28, 313–318. [Google Scholar] [CrossRef]
- Kozuch, M.; Dobrzycki, S.; Nowak, K.; Prokopczuk, P.; Kralisz, P.; Bachorzewska-Gajewska, H.; Kaminski, K.; Kozieradzka, A.; Korecki, J.; Poniatowski, B.; et al. Lack of ST-segment depression normalization after PCI is a predictor of 5-year mortality in patients with ST-elevation myocardial infarction. Circ. J. 2007, 71, 1851–1856. [Google Scholar] [CrossRef] [PubMed][Green Version]
- Armstrong, P.W.; Fu, Y.; Westerhout, C.M.; Hudson, M.P.; Mahaffey, K.W.; White, H.D.; Todaro, T.G.; Adams, P.X.; Aylward, P.E.; Granger, C.B. Baseline Q-wave surpasses time from symptom onset as a prognostic marker in ST-segment elevation myocardial infarction patients treated with primary percutaneous coronary intervention. J. Am. Coll. Cardiol. 2009, 53, 1503–1509. [Google Scholar] [CrossRef]
- López-Castillo, M.; Aceña, Á.; Pello-Lázaro, A.M.; Viegas, V.; Merchán Muñoz, B.; Carda, R.; Franco-Peláez, J.; Martín-Mariscal, M.L.; Briongos-Figuero, S.; Tuñón, J. Prognostic value of initial QRS analysis in anterior STEMI: Correlation with left ventricular systolic dysfunction, serum biomarkers, and cardiac outcomes. Ann. Noninvasive Electrocardiol. 2021, 26, e12791. [Google Scholar] [CrossRef]
- Birnbaum, Y.; Sclarovsky, S. The grades of ischemia on the presenting electrocardiogram of patients with ST elevation acute myocardial infarction. J. Electrocardiol. 2001, 34, 17–26. [Google Scholar] [CrossRef] [PubMed]
- Garcia-Rubira, J.C.; Perez-Leal, I.; Garcia-Martinez, J.T.; Molano, F.; Hidalgo, R.; Gómez-Barrado, J.J.; Cruz, J.M. The initial electrocardiographic pattern is a strong predictor of outcome in acute myocardial infarction. Int. J. Cardiol. 1995, 51, 301–305. [Google Scholar] [CrossRef]
- Birnbaum, Y.; Herz, I.; Sclarovsky, S.; Zlotikamien, B.; Chetrit, A.; Olmer, L.; Barbash, G.I. Admission clinical and electrocardiographic characteristics predicting an increased risk for early reinfarction after thrombolytic therapy. Am. Heart J. 1998, 135, 805–812. [Google Scholar] [CrossRef]
- Birnbaum, Y.; Herz, I.; Sclarovsky, S.; Zlotikamien, B.; Chetrit, A.; Olmer, L.; Barbash, G.I. Prognostic significance of the admission electrocardiogram in acute myocardial infarction. J. Am. Coll. Cardiol. 1996, 27, 1128–1132. [Google Scholar] [CrossRef][Green Version]
- Birnbaum, Y.; Goodman, S.; Barr, A.; Gates, K.B.; Barbash, G.I.; Battler, A.; Barbagelata, A.; Clemmensen, P.; Sgarbossa, E.B.; Granger, C.B.; et al. Comparison of primary coronary angioplasty versus thrombolysis in patients with ST-segment elevation acute myocardial infarction and grade II and grade III myocardial ischemia on the enrollment electrocardiogram. Am. J. Cardiol. 2001, 88, 842–847. [Google Scholar] [CrossRef]
- Birnbaum, Y.; Kloner, R.; Sclarovsky, S.; Cannon, C.P.; McCabe, C.H.; Davis, V.G.; Zaret, B.L.; Wackers, F.J.; Braunwald, E. Distortion of the terminal portion of the QRS on the admission electrocardiogram in acute myocardial infarction and correlation with infarct size and long term prognosis (Thrombolysis in Myocardial Infarction 4 Trial). Am. J. Cardiol. 1996, 78, 396–403. [Google Scholar] [CrossRef]
- Birnbaum, Y.; Maynard, C.; Wolfe, S.; Mager, A.; Strasberg, B.; Rechavia, E.; Gates, K.; Wagner, G.S. Terminal QRS distortion on admission is better than ST-segment measurements in predicting final infarct size and assessing the Potential effect of thrombolytic therapy in anterior wall acute myocardial infarction. Am. J. Cardiol. 1999, 84, 530–534. [Google Scholar] [CrossRef]
- Birnbaum, Y.; Criger, D.A.; Wagner, G.S.; Strasberg, B.; Mager, A.; Gates, K.; Granger, C.B.; Ross, A.M.; Barbash, G.I. Prediction of the extent and severity of left ventricular dysfunction in anterior acute myocardial infarction by the admission electrocardiogram. Am. Heart J. 2001, 141, 915–924. [Google Scholar] [CrossRef] [PubMed]
- Lee, C.W.; Hong, M.K.; Yang, H.S.; Choi, S.W.; Kim, J.J.; Park, S.W.; Park, S.J. Determinants and prognostic implications of terminal QRS complex distortion in patients treated with primary angioplasty for acute myocardial infarction. Am. J. Cardiol. 2001, 88, 210–213. [Google Scholar] [CrossRef]
- Valle-Caballero, M.J.; Fernández-Jiménez, R.; Díaz-Munoz, R.; Mateos, A.; Rodríguez-Álvarez, M.; Iglesias-Vázquez, J.A.; Saborido, C.; Navarro, C.; Dominguez, M.L.; Gorjón, L.; et al. QRS distortion in pre-reperfusion electrocardiogram is a bedside predictor of large myocardium at risk and infarct size (a METOCARD-CNIC trial substudy). Int. J. Cardiol. 2016, 202, 666–673. [Google Scholar] [CrossRef] [PubMed]
- Fernandez-Jimenez, R.; Valle-Caballero, M.J.; Diaz-Munoz, R.; Pizarro, G.; Fernandez-Friera, L.; Garcia-Ruiz, J.M.; Garcia-Alvarez, A.; Fuster, V.; Garcia-Rubira, J.C.; Ibanez, B. Terminal QRS distortion is an independent predictor of large area at risk and infarct size in patients with anterior STEMI. J. Am. Coll. Cardiol. 2015, 65, A196. [Google Scholar] [CrossRef]
- Tamura, A.; Nagase, K.; Watanabe, T.; Nasu, M. Relationship between terminal QRS distortion on the admission and the time course of left ventricular wall motion in anterior wall acute myocardial infarction. Jpn. Circ. J. 2001, 65, 63–66. [Google Scholar] [CrossRef][Green Version]
- Iuliano, S.; Fisher, S.G.; Karasik, P.E.; Fletcher, R.D.; Singh, S.N. QRS duration and mortality in patients with congestive heart failure. Am. Heart J. 2002, 143, 1085–1091. [Google Scholar] [CrossRef] [PubMed]
- Oikarinen, L.; Nieminen, M.S.; Viitasalo, M.; Toivonen, L.; Sverker, J.; Dahlöf, B.; Devereux, R.B.; Okin, P.M. QRS Duration and QT Interval Predict Mortality in Hypertensive Patients With Left Ventricular Hypertrophy. The Losartan Intervention for Endpoint Reduction in Hypertension Study. Hypertension 2004, 43, 1029–1034. [Google Scholar] [CrossRef] [PubMed]
- Bauer, A.; Watanabe, M.A.; Barthel, P.; Schneider, R.; Ulm, K.; Schmidt, G. QRS duration and late mortality in unselected post-infarction patients of the revascularization era. Eur. Heart J. 2006, 27, 427–433. [Google Scholar] [CrossRef] [PubMed]
- Nwakile, C.; Purushottam, B.; Yun, J.; Bhalla, V.; Morris, D.L.; Figueredo, V.M. QRS duration predicts 30 day mortality following ST elevation myocardial infarction. Int. J. Cardiol. Heart Vasc. 2014, 5, 42–44. [Google Scholar] [PubMed]
- Olesen, L.L.; Andersen, A. ECG as a first step in the detection of left ventricular systolic dysfunction in the elderly. ESC Heart Fail. 2016, 3, 44–52. [Google Scholar] [CrossRef]


| Variable | Overall Study Population (n = 249) | Patients with LVSD at 6 Months (n = 52) | Patients without LVSD at 6 Months (n = 197) | p * |
|---|---|---|---|---|
| Age [years] | 57.0 (51.0–64.0) | 61.0 (52.0–67.0) | 56.0 (51.0–64.0) | 0.090 |
| Gender [male/female] | 186 (74.7%)/63 (25.3%) | 42 (80.8%)/10 (19.3%) | 144 (73.1%)/53 (26.9%) | 0.258 |
| Time from symptom onset to PCI [min] | 220.0 (150.0–331.5) | 223.5 (148.5–346.0) | 220.0 (150.0–321.5) | 0.727 |
| Risk factors for coronary artery disease | ||||
| BMI [kg/m2] | 26.8 (24.2–29.4) | 27.4 (25.0–30.2) | 26.5 (24.1–29.1) | 0.058 |
| Hypertension | 103 (41.4%) | 24 (46.2%) | 79 (40.1%) | 0.431 |
| Diabetes mellitus | 50 (20.1%) | 16 (30.8%) | 34 (17.3%) | 0.031 |
| Current or ex-smoker | 164 (65.9%) | 29 (55.8%) | 135 (68.5%) | 0.084 |
| Positive family history of IHD | 61 (24.5%) | 10 (19.2%) | 51 (25.9%) | 0.321 |
| Angiographic characteristics | ||||
| IRA: LAD/other | 121 (48.6%)/128 (52.4) | 47 (90.4%)/5 (9.6%) | 74 (37.6%)/123 (62.4%) | <0.001 |
| IRA TIMI 0 flow prior to PCI | 144 (57.8%) | 39 (75.0%) | 105 (53.3%) | 0.005 |
| IRA TIMI 3 flow post PCI | 229 (92.0%) | 41 (78.8%) | 188 (95.4%) | 0.001 |
| Multivessel coronary artery disease | 143 (57,4%) | 34 (65.4%) | 109 (55.3%) | 0.192 |
| Stent implantation | 245 (98.4%) | 51 (98.1%) | 194 (98.5%) | 0.678 |
| GP IIb/IIIa inhibitor usage | 66 (26.5%) | 25 (48.1%) | 41 (21.0%) | <0.001 |
| Biochemical characteristics | ||||
| eGFR (CKD-EPI equation) [mL/min/1.73 m2] | 84.4 (74.1–94.5) | 80.3 (72.8–88.1) | 86.5 (75.0–96.6) | 0.036 |
| Glucose on admission [mg/dL] | 138.5 (122.0–169.0) | 157.0 (133.0–193.0) | 135 (118.0–168.0) | 0.001 |
| cTnImax [ng/mL] | 41.2 (11.8–50.0) | 50.0 (50.0–50.0) | 29.1 (9.7–50.0) | <0.001 |
| CK-MBmax [U/L] | 242.0 (116.5–414.0) | 489.0 (361.5–747.0) | 178.5 (95.0–347.5) | <0.001 |
| Total cholesterol [mg/dL] | 223.0 (195.0–251.0) | 223.0 (195.0–252.0) | 223.0 (195.0–251.0) | 0.688 |
| LDL-C [mg/dL] | 145.0 (125.0–173.0) | 145.0 (131.5–170.0) | 146.0 (124.0–174.0) | 0.712 |
| HDL-C [mg/dL] | 52.0 (46.0–59.0) | 51.0 (43.0–56.0) | 52.0(46.0–59.0) | 0.128 |
| Triglycerides [mg/dL] | 82.0 (59.0–128.0) | 89.5 (62.5–130.5) | 78.0(58.0–125.0) | 0.103 |
| BNP on admission [pg/mL] | 53.9 (27.9–106.5) | 74.8 (31.8–155.7) | 50.6(27.3–101.9) | 0.045 |
| BNP at discharge [pg/mL] | 139.8 (74.7–284.2) | 436.7 (223.6–735.5) | 111.9 (65.3–198.3) | <0.001 |
| Variable | Overall Study Population (n = 249) | Patients with LVSD at 6 Months (n = 52) | Patients without LVSD at 6 Months (n = 197) | p * |
|---|---|---|---|---|
| At discharge | ||||
| LA [mm] | 40.0 (37.0–43.0) | 41.0 (38.0–45.0) | 39.0 (37.0–42.0) | 0.007 |
| LVEDd [mm] | 49.0 (45.0–53.0) | 53.0 (49.0–56.0) | 47.0 (45.0–52.0) | <0.001 |
| LVESd [mm] | 34.0 (30.0–37.0) | 38.0 (35.0–40.5) | 33.0 (30.0–36.0) | <0.001 |
| LVEDV [mL] | 99.4 (84.0–121.0) | 121.5 (102.5–132.5) | 93.0 (81.0–111.0) | <0.001 |
| LVESV [mL] | 55.0 (45.0–69.0) | 75.0 (66.0–84.5) | 51.0 (42.5–62.0) | <0.001 |
| LVEF [%] | 44.0 (39.0–48.4) | 36.0 (33.5–38.5) | 45.9 (42.0–50.0) | <0.001 |
| LVSD (LVEF ≤ 40%) | 84.0 (33.7%) | 45 (86.5%) | 39 (19.8%) | <0.001 |
| WMSI [points] | 1.56 (1.38–1.75) | 1.88 (1.78–1.94) | 1.44 (1.38–1.69) | <0.001 |
| 6 months after discharge | ||||
| LA [mm] | 40.0 (38.0–44.0) | 44.0 (40.0–46.0) | 40.0 (37.0–42.0) | <0.001 |
| LVEDd [mm] | 50.0 (46.0–54.0) | 55.0 (52.0–57.0) | 48.0 (45.0–53.0) | <0.001 |
| LVESd [mm] | 34.0 (31.0–37.0) | 40.0 (36.0–44.0) | 33.0 (31.0–36.0) | <0.001 |
| LVEDV [mL] | 110.0 (94.0–134.0) | 145.0 (129.5–163.0) | 105.0 (91.0–125.0) | <0.001 |
| LVESV [mL] | 57.0 (48.0–76.0) | 92.0 (79.0–103.0) | 53.0 (45.0–65.0) | <0.001 |
| LVEF [%] | 46.0 (42.0–51.5) | 36.0 (33.7–38.5) | 48.0 (44.8–52.5) | <0.001 |
| WMSI [points] | 1.44 (1.31–1.69) | 1.88 (1.75–1.94) | 1.38 (1.31–1.50) | <0.001 |
| LVEF ≤ 40 % (LVSD) at 6 Months | |||
|---|---|---|---|
| Absent (n = 197) | Present (n = 52) | ||
| LVEF ≤40 %at hospital discharge | Absent (n = 165) | 158 (63.5%) | 7 (2.8%) |
| Present (n = 84) | 39 (15.7%) | 45 (18.1%) | |
| Variable | Overall Study Population (n = 249) | Patients with LVSD at 6 Months (n = 52) | Patients without LVSD at 6 Months (n = 197) | p * |
|---|---|---|---|---|
| Baseline | ||||
| Heart rate [BPM] | 75.0 (62.0–88.0) | 81.0 (68.5–97.0) | 74.0 (60.0–85.0) | <0.001 |
| Anterior location of STEMI | 116 (47.0%) | 47 (90.4%) | 69 (35.0%) | <0.001 |
| Number of leads with ST-segment elevation [n] | 4.0 (3.0–6.0) | 6.0 (5.0–7.0) | 3.0 (3.0–5.0) | <0.001 |
| Sum of ST-segment elevation [mm] | 8.5 (4.0–14.0) | 13.8 (9.8–18.0) | 7.0 (4.0–12.0) | <0.001 |
| Maximal ST-segment elevation [mm] | 3.0 (2.0–4.0) | 3.5 (3.0–5.0) | 2.5 (1.5–4.0) | <0.001 |
| Number of leads with pathologic Q waves [n] | 2.0 (1.0–4.0) | 4.0 (3.0–5.0) | 2.0 (1.0–3.0) | <0.001 |
| Presence of reciprocal ST-segment depression ≥ 1mm | 193 (77.5%) | 34 (65.4%) | 159 (80.7%) | 0.019 |
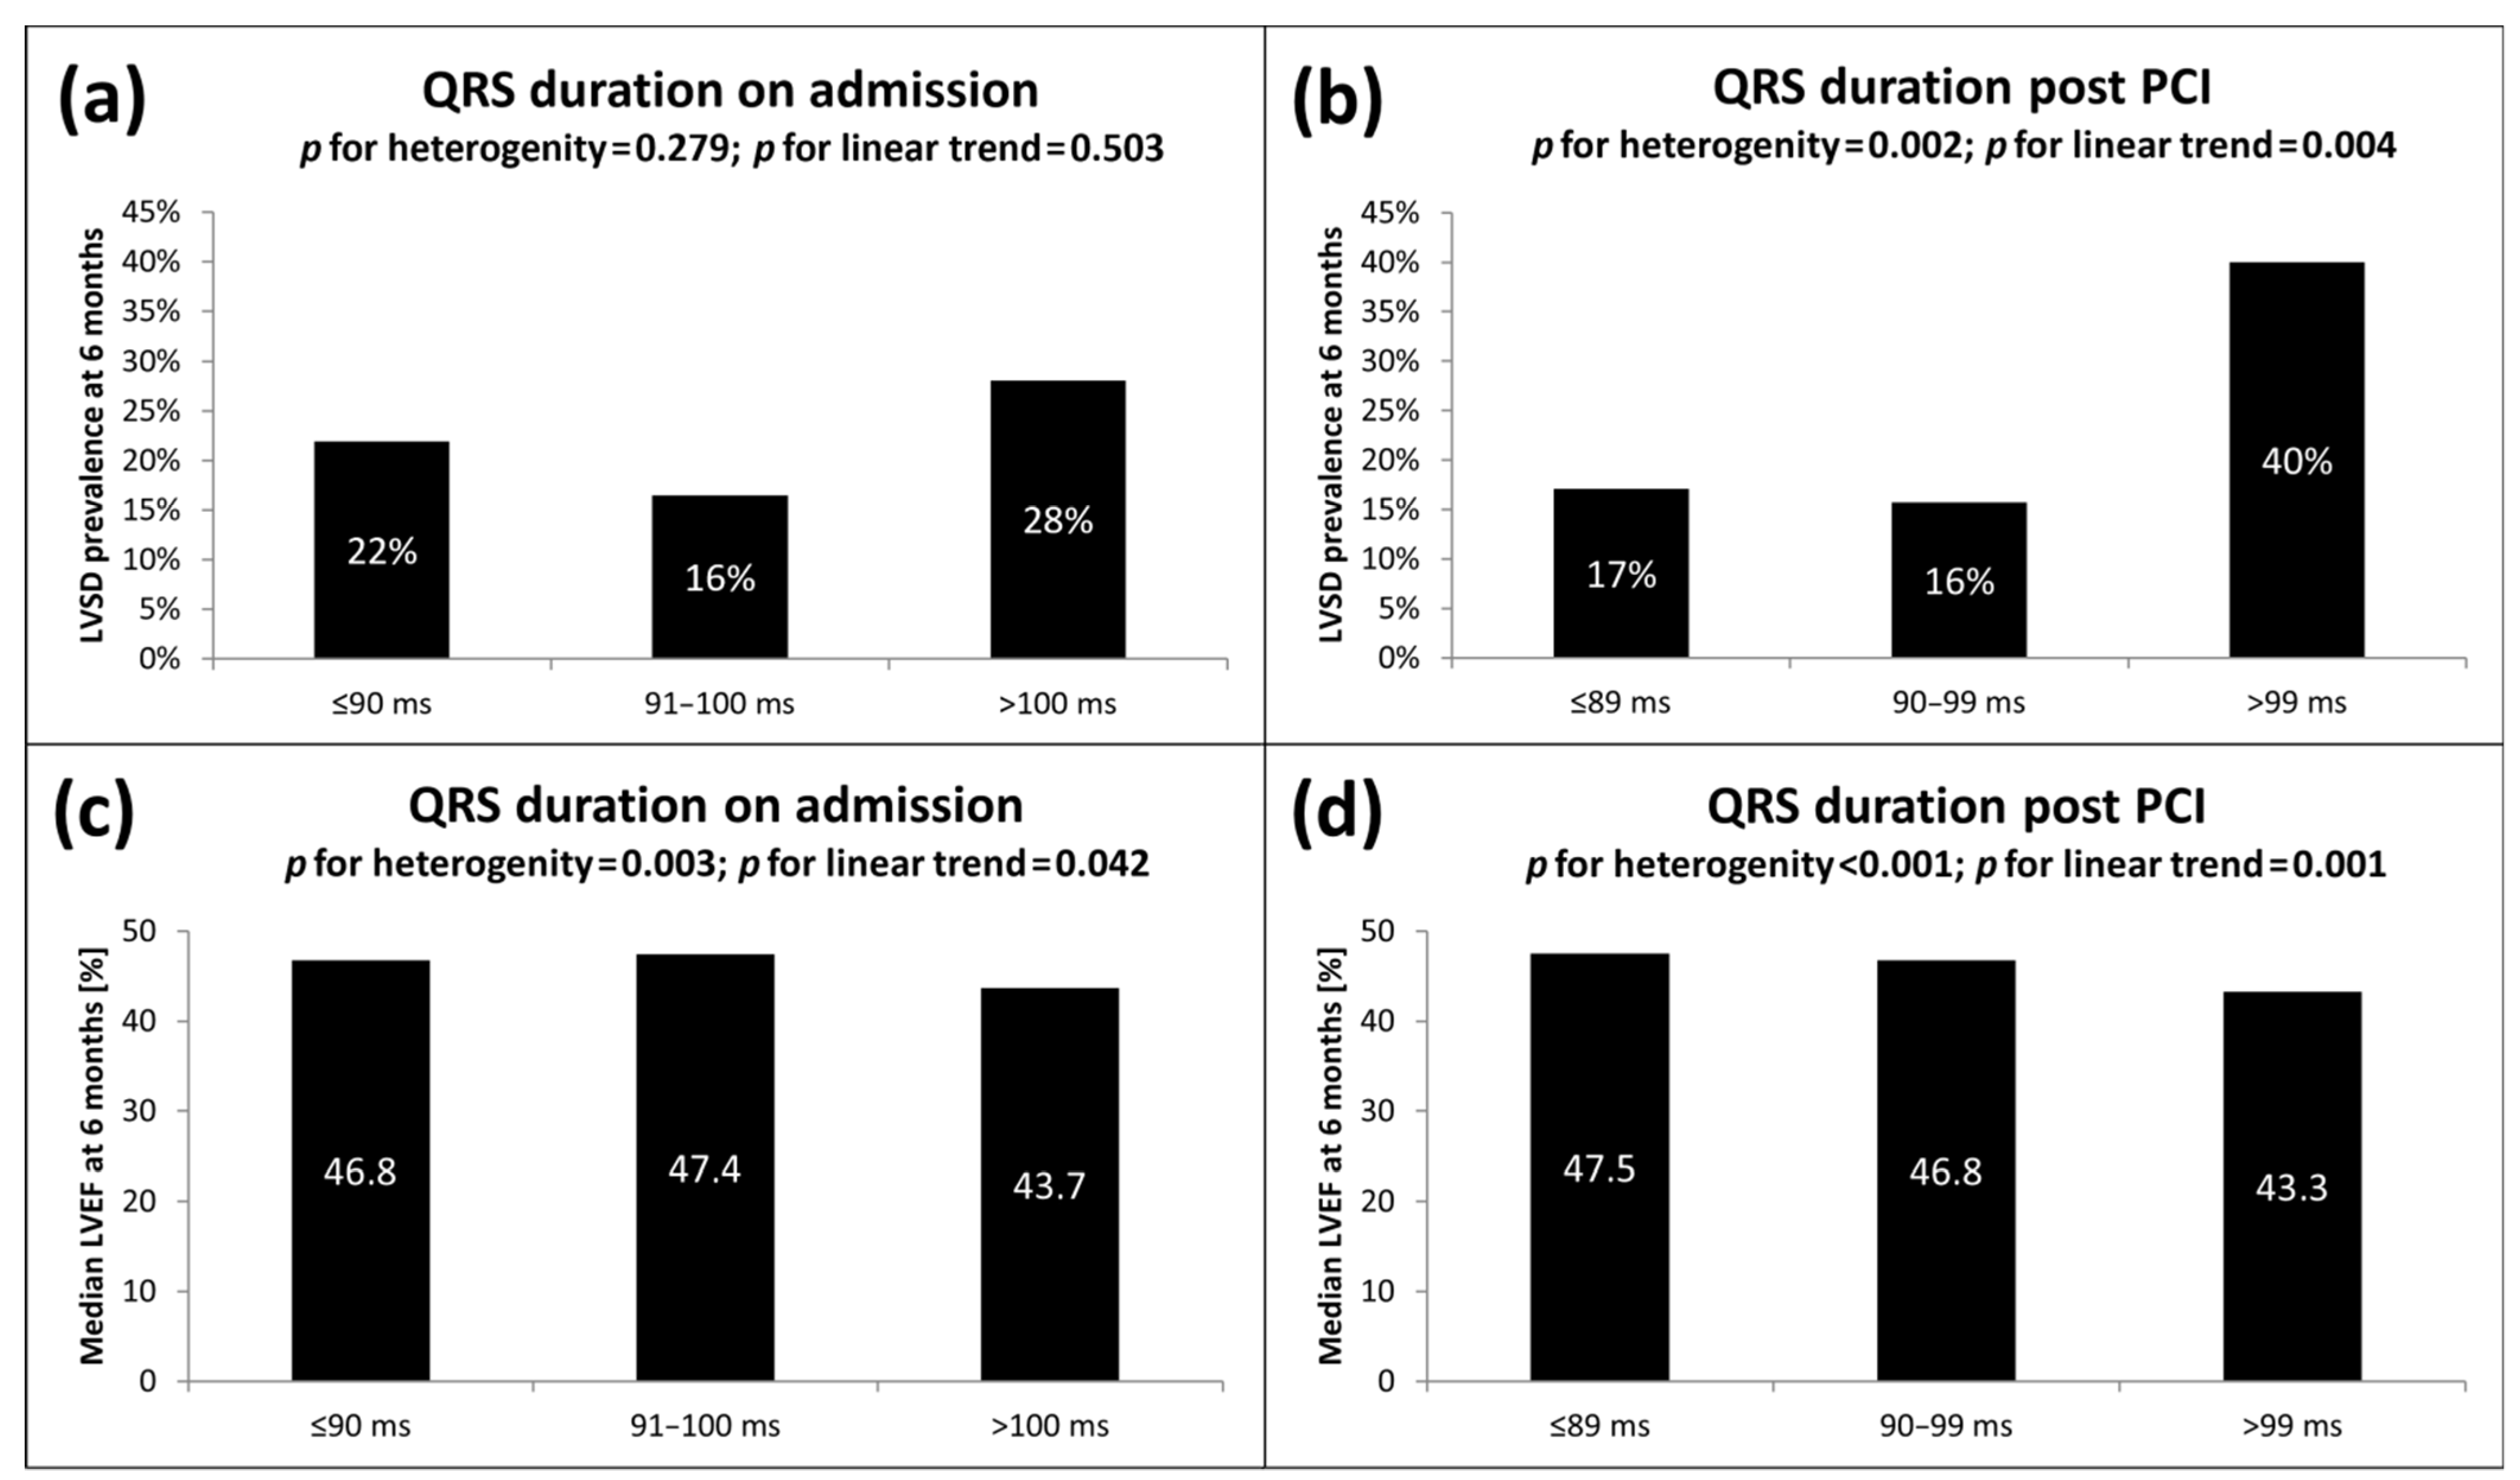
| QRS duration [ms] | 95.0 (85.0–100.0) | 95.0 (86.0–110.0) | 95.0 (85.0–100.0) | 0.399 |
| Sclarovsky-Birnbaum ischemia score | grade 2: 198 (79.5%); grade 3: 51 (20.5%) | grade 2: 35 (67.3%) grade 3: 17 (32.7%) | grade 2: 163 (82.7%); grade 3: 34 (17.3%) | 0.014 |
| Post PCI | ||||
| Heart rate [BPM] | 77.0 (66.0–89.0) | 83.0 (72.0–94.0) | 75.0 (64.0–88.0) | 0.003 |
| ST-segment resolution [%] | 60.6 (30.0–88.9) | 39.4 (0.0–69.3) | 70.0 (40.0–100.0) | <0.001 |
| ST-segment resolution (≥50%) | 160 (64.3%) | 22 (42.3%) | 138 (70.1%) | <0.001 |
| ST-segment resolution after PCI (trichotomised) | <30%–62 (24.9%) ≥30–69%–82 (32.9%) ≥70%–105 (42.2%) | <30%–22 (42.3%) ≥30–69%–24 (46.2%) ≥70%–6 (11.5%) | <30%–40 (20.3%) ≥30–69%–58 (29.4%) ≥70%–99 (50.3%) | <0.001 |
| Number of leads with ST-segment elevation [n] | 3.0 (1.0–5.0) | 5.5 (4.0–7.0) | 3.0 (0.0–4.0) | <0.001 |
| Sum of ST-segment elevation [mm] | 3.0 (1.0–7.0) | 8.3 (5.0–13.0) | 2.0 (0.0–4.5) | <0.001 |
| Maximal ST-segment elevation [mm] | 1.0 (0.5–2.0) | 2.3 (1.5–4.0) | 1.0 (0.5–1.5) | <0.001 |
| Number of leads with pathologic Q waves [n] | 3.0 (2.0–5.0) | 5.0 (4.0–7.0) | 3.0 (1.0–4.0) | <0.001 |
| QRS duration [ms] | 90.0 (84.0–100.0) | 99.5 (87.5–111.0) | 90.0 (83.0–100.0) | 0.003 |
| Variable | Beta Coefficient | Beta Coefficient Standard Error | Direction Component Beta | Direction Component Beta Standard Error | p |
|---|---|---|---|---|---|
| Model characteristics: R = 0.682; R2 = 0.464; corrected R2 = 0.448; p < 0.00001 | |||||
| Intercept | 70.49 | 3.71 | <0.0001 | ||
| BMI [kg/m2] | −0.10 | 0.05 | −0.20 | 0.10 | 0.0461 |
| Glucose on admission [per increments of 10 mg/dL] | −0.16 | 0.05 | −0.21 | 0.07 | 0.0021 |
| IRA TIMI 3 flow after PCI | 0.12 | 0.05 | −3.20 | 1.36 | 0.0196 |
| Anterior location of STEMI | −0.36 | 0.05 | −5.45 | 0.83 | <0.0001 |
| QRS duration on admission [per increments of 10 ms] | −0.28 | 0.05 | −1.36 | 0.25 | <0.0001 |
| Number of leads with pathologic Q waves on admission | −0.24 | 0.05 | −0.82 | 0.18 | <0.0001 |
| Sclarovsky-Birnbaum ischemia score [grade 3 vs. grade 2] | −0.12 | 0.05 | −2.33 | 0.94 | 0.0137 |
Publisher’s Note: MDPI stays neutral with regard to jurisdictional claims in published maps and institutional affiliations. |
© 2021 by the authors. Licensee MDPI, Basel, Switzerland. This article is an open access article distributed under the terms and conditions of the Creative Commons Attribution (CC BY) license (https://creativecommons.org/licenses/by/4.0/).
Share and Cite
Fabiszak, T.; Kasprzak, M.; Koziński, M.; Kubica, J. Assessment of Selected Baseline and Post-PCI Electrocardiographic Parameters as Predictors of Left Ventricular Systolic Dysfunction after a First ST-Segment Elevation Myocardial Infarction. J. Clin. Med. 2021, 10, 5445. https://doi.org/10.3390/jcm10225445
Fabiszak T, Kasprzak M, Koziński M, Kubica J. Assessment of Selected Baseline and Post-PCI Electrocardiographic Parameters as Predictors of Left Ventricular Systolic Dysfunction after a First ST-Segment Elevation Myocardial Infarction. Journal of Clinical Medicine. 2021; 10(22):5445. https://doi.org/10.3390/jcm10225445
Chicago/Turabian StyleFabiszak, Tomasz, Michał Kasprzak, Marek Koziński, and Jacek Kubica. 2021. "Assessment of Selected Baseline and Post-PCI Electrocardiographic Parameters as Predictors of Left Ventricular Systolic Dysfunction after a First ST-Segment Elevation Myocardial Infarction" Journal of Clinical Medicine 10, no. 22: 5445. https://doi.org/10.3390/jcm10225445
APA StyleFabiszak, T., Kasprzak, M., Koziński, M., & Kubica, J. (2021). Assessment of Selected Baseline and Post-PCI Electrocardiographic Parameters as Predictors of Left Ventricular Systolic Dysfunction after a First ST-Segment Elevation Myocardial Infarction. Journal of Clinical Medicine, 10(22), 5445. https://doi.org/10.3390/jcm10225445