Article

The Relationship of ABCB1/MDR1 and CYP1A1 Variants with the Risk of Disease Development and Shortening of Overall Survival in Patients with Multiple Myeloma

by
Szymon Zmorzynski
1,*,
Magdalena Wojcierowska-Litwin
1,
Sylwia Popek-Marciniec
1,
Aneta Szudy-Szczyrek
2,
Wojciech Styk
3,
Sylwia Chocholska
2 and
Agata Anna Filip
1
1
Department of Cancer Genetics with Cytogenetic Laboratory, Medical University of Lublin, 20-059 Lublin, Poland
2
Chair and Department of Hematooncology and Bone Marrow Transplantation, Medical University of Lublin, 20-059 Lublin, Poland
3
Department of Psychology, Institute of Pedagogy and Psychology, Warsaw Management University, 03-772 Warsaw, Poland
*
Author to whom correspondence should be addressed.
J. Clin. Med. 2021, 10(22), 5276; https://doi.org/10.3390/jcm10225276
Submission received: 7 October 2021 / Revised: 5 November 2021 / Accepted: 9 November 2021 / Published: 13 November 2021
(This article belongs to the Section Hematology)

Abstract

:
(1) Background: The aim of our study was to analyze the possible relationship of ABCB1 and CYP1A1 gene variants with susceptibility and outcome of multiple myeloma (MM); (2) Methods: Genomic DNA samples from 110 newly-diagnosed MM patients and 100 healthy blood donors were analyzed by methods-PCR-RFLP (for ABCB1 3435C > T, CYP1A1 6235T > C—m1), automated DNA sequencing (for ABCB1 1236C > T, 2677G > T/A) and allele-specific PCR (for CYP1A1 4889A > G—m2); (3) Results: The genotypic frequencies of CYP1A1 4889A > G variant were not in Hardy-Weinberg equilibrium for MM patients. The presence of m1 and m2 CYP1A1 alleles decreased the risk of MM—OR = 0.49 (p = 0.011) and OR = 0.27 (p = 0.0003), respectively. In turn, TT genotype (ABCB1 2677G > T/A) increased the risk of this disease (p = 0.007). In the multivariate Cox analysis CT + TT genotypes (ABCB1 3435C > T) were associated with decreased risk of death (HR = 0.29, p = 0.04). In log-rank test in patients with CT genotype (ABCB1 3435C > T) was observed association of overall survival with the type of treatment; (4) Conclusions: Our findings suggest that T-alleles of ABCB1 2677G > T/A and m1/m2 alleles of CYP1A1 affected the susceptibility of MM. Moreover, T-allele of ABCB1 3435C > T might be independent positive prognostic factor in MM.

1. Introduction

Multiple myeloma (MM) is a malignant disease characterized by clonal expansion of plasma cells in the bone marrow [1]. Multi-drug resistance (MDR) is one of the major problems, which occurs during clinical therapy [2]. Among many mechanisms of MDR, the most prominent role is played by multidrug resistance-associated protein-1 (MRP1), also known as permeability-glycoprotein (P-GP) or ATP-binding cassette sub-family B member 1 (ABCB1) [3]. It acts as a transmembrane efflux pump that transfers drugs and toxins from cytosol to the extracellular matrix [4]. The ABCB1 protein is involved in the body’s defense against endogenous and exogenous toxic compounds [5]. It is encoded by ABCB1 gene also known as MDR1 or P-GP (locus 7q21). A number of single nucleotide variants were identified in the ABCB1 gene, of which the most common studied are variants 3435C > T (in exon 26, rs1045642), 1236C > T (in exon 12, rs1128503) and 2677G > T/A (in exon 21, rs2032582) [6,7]. These variants may affect protein expression [8]. The variant 2677G > T/A affects the protein sequence (p.Ala893Ser/Thr) and function [6]. In contrast, variants present at nucleotides 3435 [ATC > ATT] and 1236 [GGC > GGT] are caused by synonymous substitution—Ile1145Ile and Gly412Gly, respectively [8]. The presence of the T-allele of the 3435 variant is associated with lower gene expression compared to C-allele [9]. The variants 3435C > T, 1236C > T and 2677G > T/A could impact the transport ability of P-gp-mediated substrates and might be in linkage with other variants associated with MM predisposition [10,11].
ABCB-1-associated drug resistance is observed in about 75% of MM patients treated with proteasome inhibitors [12]. Although MM treatment is usually not curative, the introduction of proteasome inhibitors and new immunomodulatory drugs resulted in improvement of overall survival (OS) relative to previous observations [13,14,15].
Bortezomib, as a proteasome inhibitor, induces an apoptotic cascade and has improved clinical outcomes [16,17]. In bortezomib-resistant MM cells the upregulation of the ABCB1 protein was observed at various levels [18]. However, conflicting data exist for bortezomib as a substrate for ABCB1 [19,20]. Some patients do not respond to bortezomib treatment, or relapse after a response is observed [21,22]. To overcome MDR, the combinations of several drugs, including thalidomide as an immunomodulatory drug, are used [17]. The correlations between response to treatment and ABCB1 gene variants have been not thoroughly studied in MM.
Cytochromes P450 (CYP) are enzymes that play an important role in the metabolism of a wide range of endogenous and foreign compounds [23]. Carcinogen-metabolizing proteins might be involved in individual susceptibility to cancers [24]. The variants of their genes, by altering protein function, might influence the carcinogen activation or deactivation and modulate DNA repair mechanisms [25]. Cytochrome P450 1A1 (CYP1A1) belongs to one of the most active isoenzyme subfamilies and participates in the metabolism of xenobiotics and anti-cancer drugs [26]. The CYP1A1 enzyme can accelerate bortezomib metabolism, leading to its concentration reduction in MM cells, and is encoded by the CYP1A1 gene (locus 15q22q24) [27]. CYP1A1 causes oxidative deboronation of bortezomib, which is the first step of this drug metabolism [28]. The inhibition of the CYP1A1 enzyme increases bortezomib sensitivity in MM cells [27]. CYP1A1 gene variants have been linked to cancer susceptibility, for example in acute myeloid leukemia, prostate cancer, larynx cancer, lung cancer and MM [25,29,30,31,32]. Genetic variants of the CYP1A1 gene are present in exons and non-coding regions. In the present article nomenclature system for CYP1A1 alleles recommended in https://www.pharmvar.org/gene/CYP1A1 (accessed on 30 April 2021) has been followed. In the 3′-UTR at position g.11229T > C (c.6235/c.3798) variant (rs4646903) is located, containing a single thymine (5′-GGGTCC-3′, wild type allele, WT) to cytosine (5′-GGGCCC-3′, genetic variant m1, CYP1A1*2A). CYP1A1 6235T > C variant is also known as MspI polymorphism as it gains the restriction site for this enzyme [33]. Moreover, it can increase the expression of the gene or the stability of messenger RNA, which results in higher enzyme activity [34]. The second genetic variant (rs1048943) is caused by substitution of adenine (wild type allele, WT) to guanine (m2 allele, CYP1A1*2C) at position g.9885A > G (c.4889/c.2454) in exon 7 (ATT to GTT) [31]. The presence of valine (p.Ile462Val) in amino acid chain seems to increase the enzyme activity [35]. Both variants are associated with enhanced metabolism of corresponding substrates and may play an important role in an individual susceptibility to cancer development, including MM [31].
Taking the above into account, we hypothesize that the ABCB1 and CYP1A1 variants might be associated with MM risk development, as well as response to treatment with thalidomide and/or bortezomib. We decided to analyze these two genes together, because ABCB1 may transport bortezomib to the extracellular matrix, and the CYP1A1 enzyme is involved in the bortezomib metabolism. Upregulation of ABCB1 and the higher activity of CYP1A1 may lead to lower sensitivity to bortezomib. Although the research of ABCB1 (mostly rs1045642) and CYP1A1*2A variants was made in MM, in our research we expanded the examined factors to include smoking, type of treatment and response to treatment [6,30]. Furthermore, we have checked whether these variants predict sensitivity to bortezomib in cell cultures derived from studied patients.

2. Materials and Methods

2.1. Patients and Samples

The study group consisted of 110 newly-diagnosed patients with MM (Caucasian population), who were hospitalized (in years 2013–2019) at the Chair and Department of Hematooncology and Bone Marrow Transplantation, Medical University of Lublin. The study received a positive review (no. KE-0254/165/2013 and no. KE-0254/337/2016) from the Bioethics Committee of Medical University of Lublin, according with the ethical standards established by Helsinki Declaration. Detailed patients characteristics are shown in Table 1.
The control samples (Caucasian population) were obtained from 100 healthy blood donors (50 males and 50 females, with mean age 34.4 years) attending the regional Blood Donation and Blood Treatment Center in Kielce, Poland. All participants of the study provided written informed consent.
We followed the methods of Zmorzynski et al. 2020 [36]. The therapeutic induction regimens consisted of thalidomide and/or bortezomib combined with steroids and/or cyclophosphamide. Response to treatment was evaluated according to the International Myeloma Working Group guidelines, as described elsewhere [37,38]. Overall survival (OS) encompassed time from diagnosis until relapse, progression, death due to tumor effect or last follow-up, and time from diagnosis until death by any cause or last follow-up, respectively. Progression free survival (PFS) was estimated as the time elapsed between treatment initiation and tumor progression or death from any cause [36,39].
Peripheral blood (from healthy blood donors) and bone marrow aspirates (from MM patients) were used for DNA isolation and the determination of the ABCB1 and CYP1A1 variants.
Cell cultures from bone marrow aspirates were established to carry out the research associated with bortezomib (n = 50), as described by Zmorzynski et al. 2020 [36].

2.2. DNA Isolation

DNA was isolated with the use of a commercial kit (Qiagen, Hilden, Germany) according to manufacturer’s procedure. The concentration and quality of DNA was checked using NanoDrop device (Thermo Fisher Scientific, Waltham, MA, USA).

2.3. ABCB1 Genotyping

The ABCB1 variants 1236C > T, 2677G > T/A were analyzed using automated DNA sequencing. The genotyping of 3435C > T variant was performed by polymerase chain reaction restriction fragment length polymorphism (PCR-RFLP).

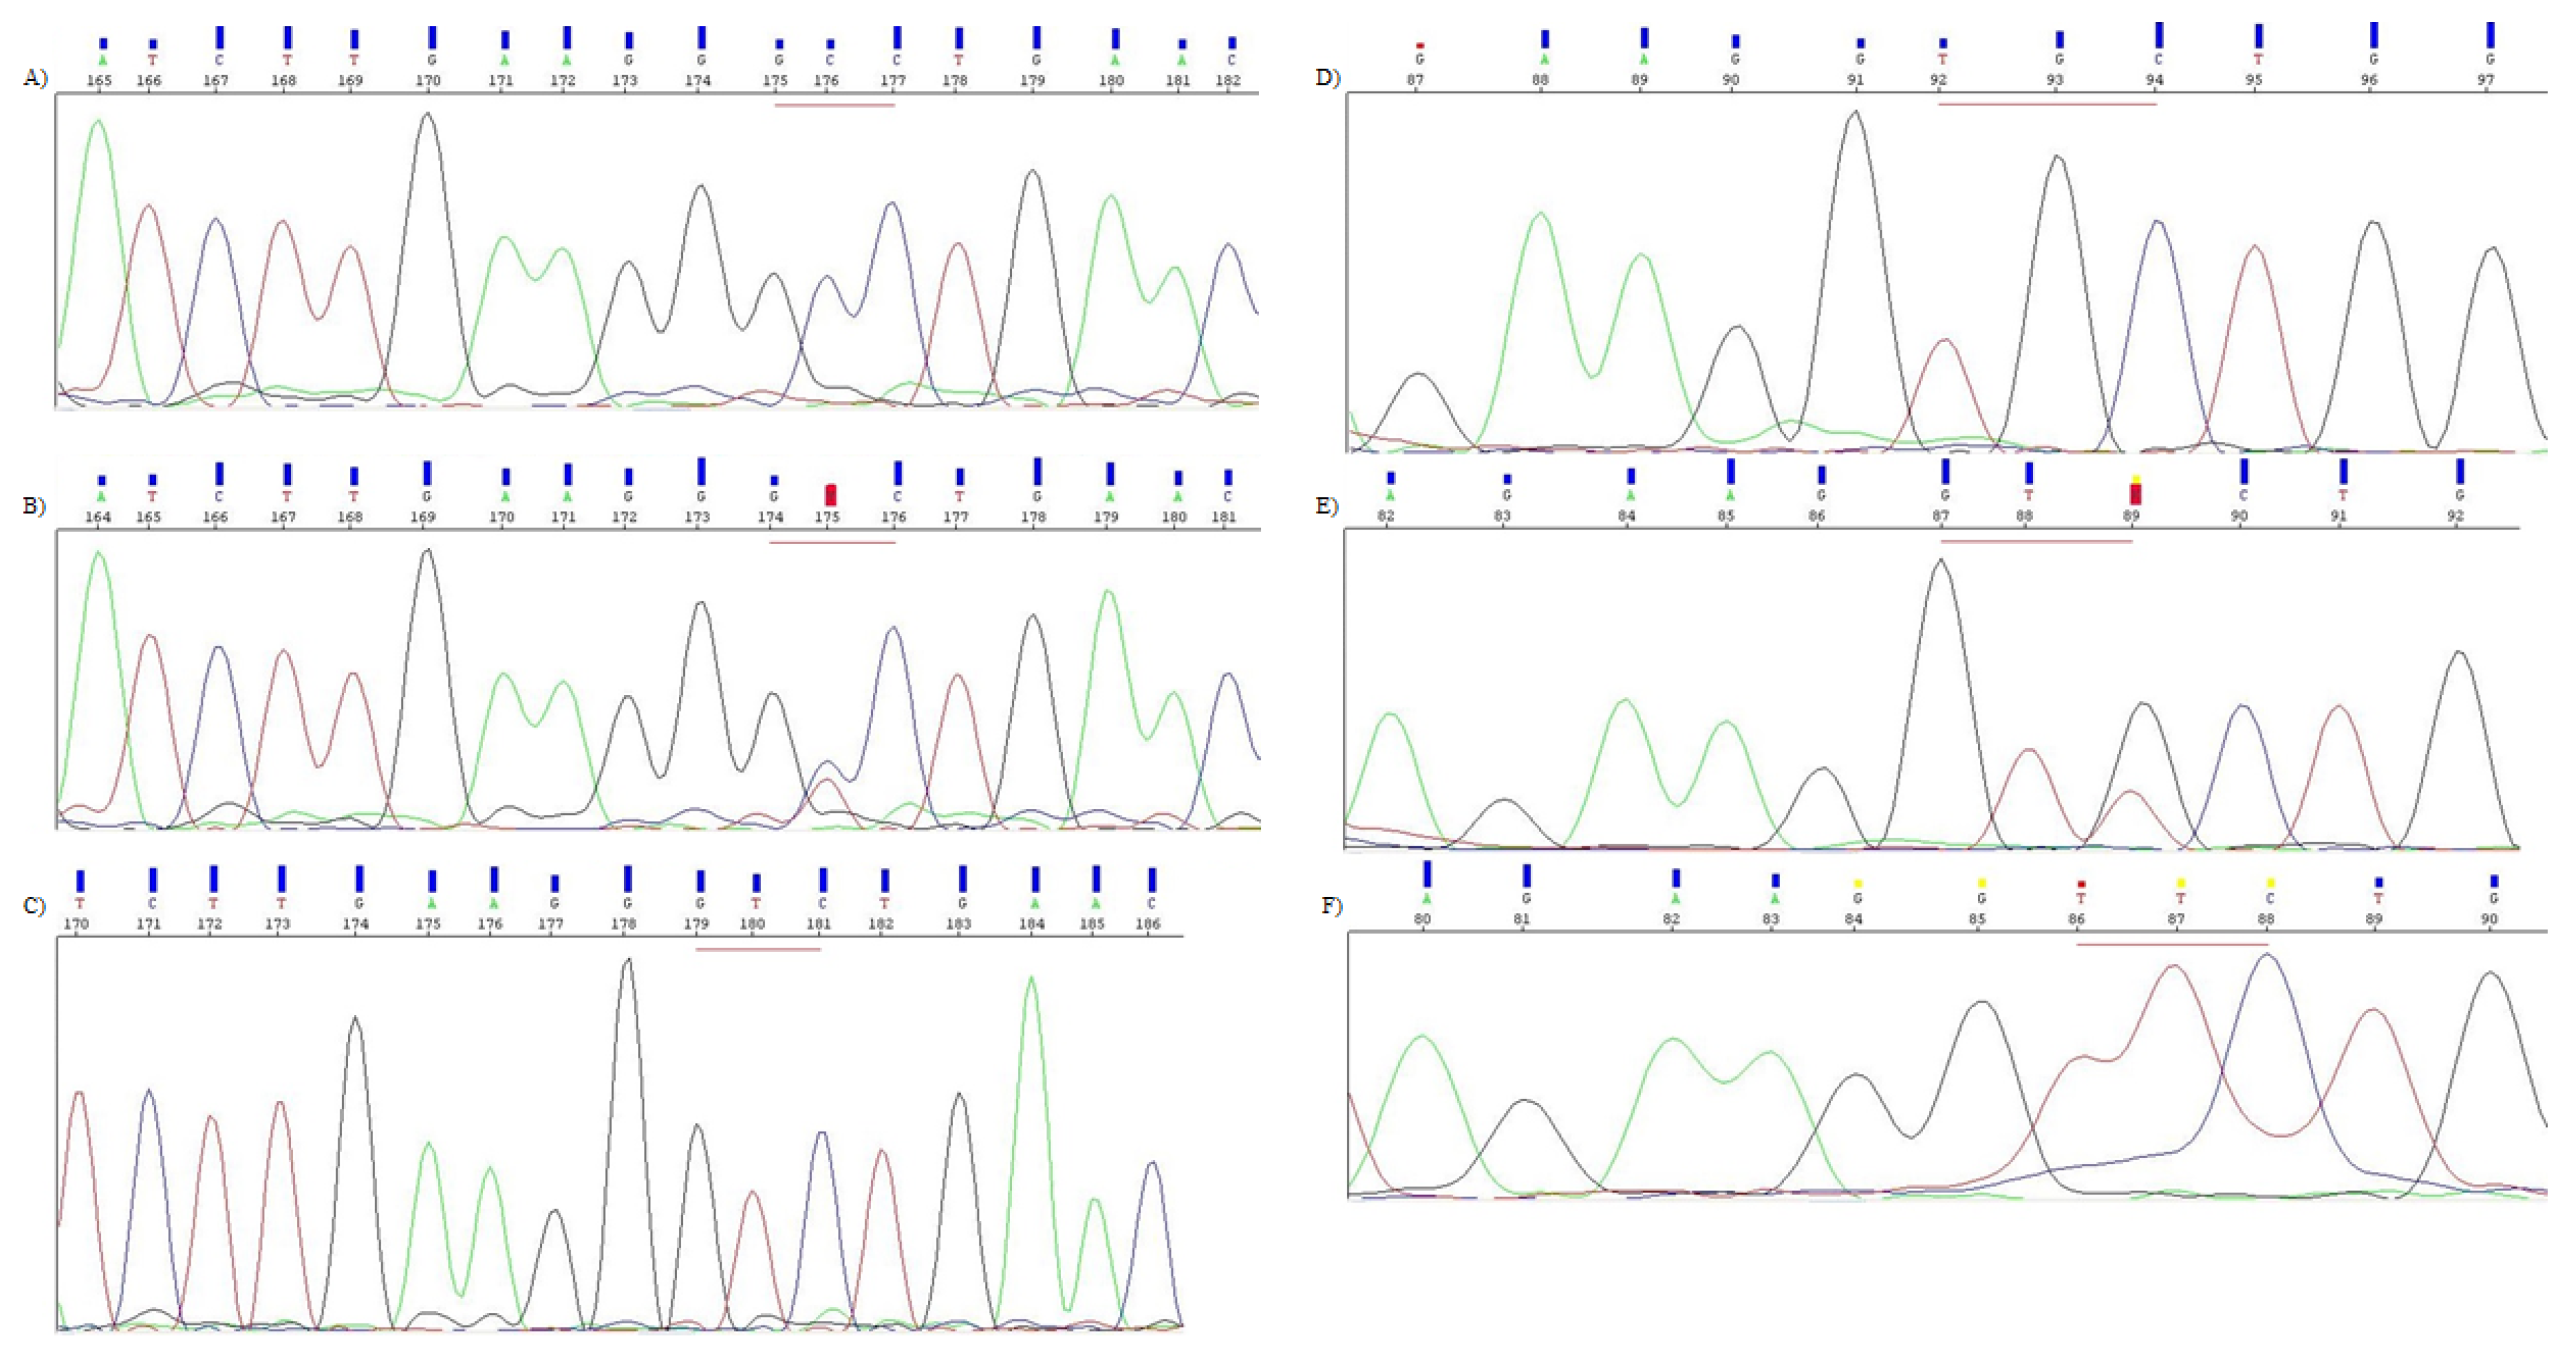
2.3.1. Automated DNA Sequencing

The following primers were used to amplify 346 bp (containing 1236 nucleotide) and 223 bp (containing 2677 nucleotide), respectively.
For 1236C > T:
  • forward 5′-TCA GTT ACC CAT CTC GAA AAG AA-3′
  • reverse 5′-ACA TCA GAA AGA TGT GCA ATG TG-3′
For 2677G > T/A:
  • forward 5′-TAT GGT TGG CAA CTA ACA CT-3′
  • reverse 5′-CAT GAA AAA GAT TGC TTT GA-3′
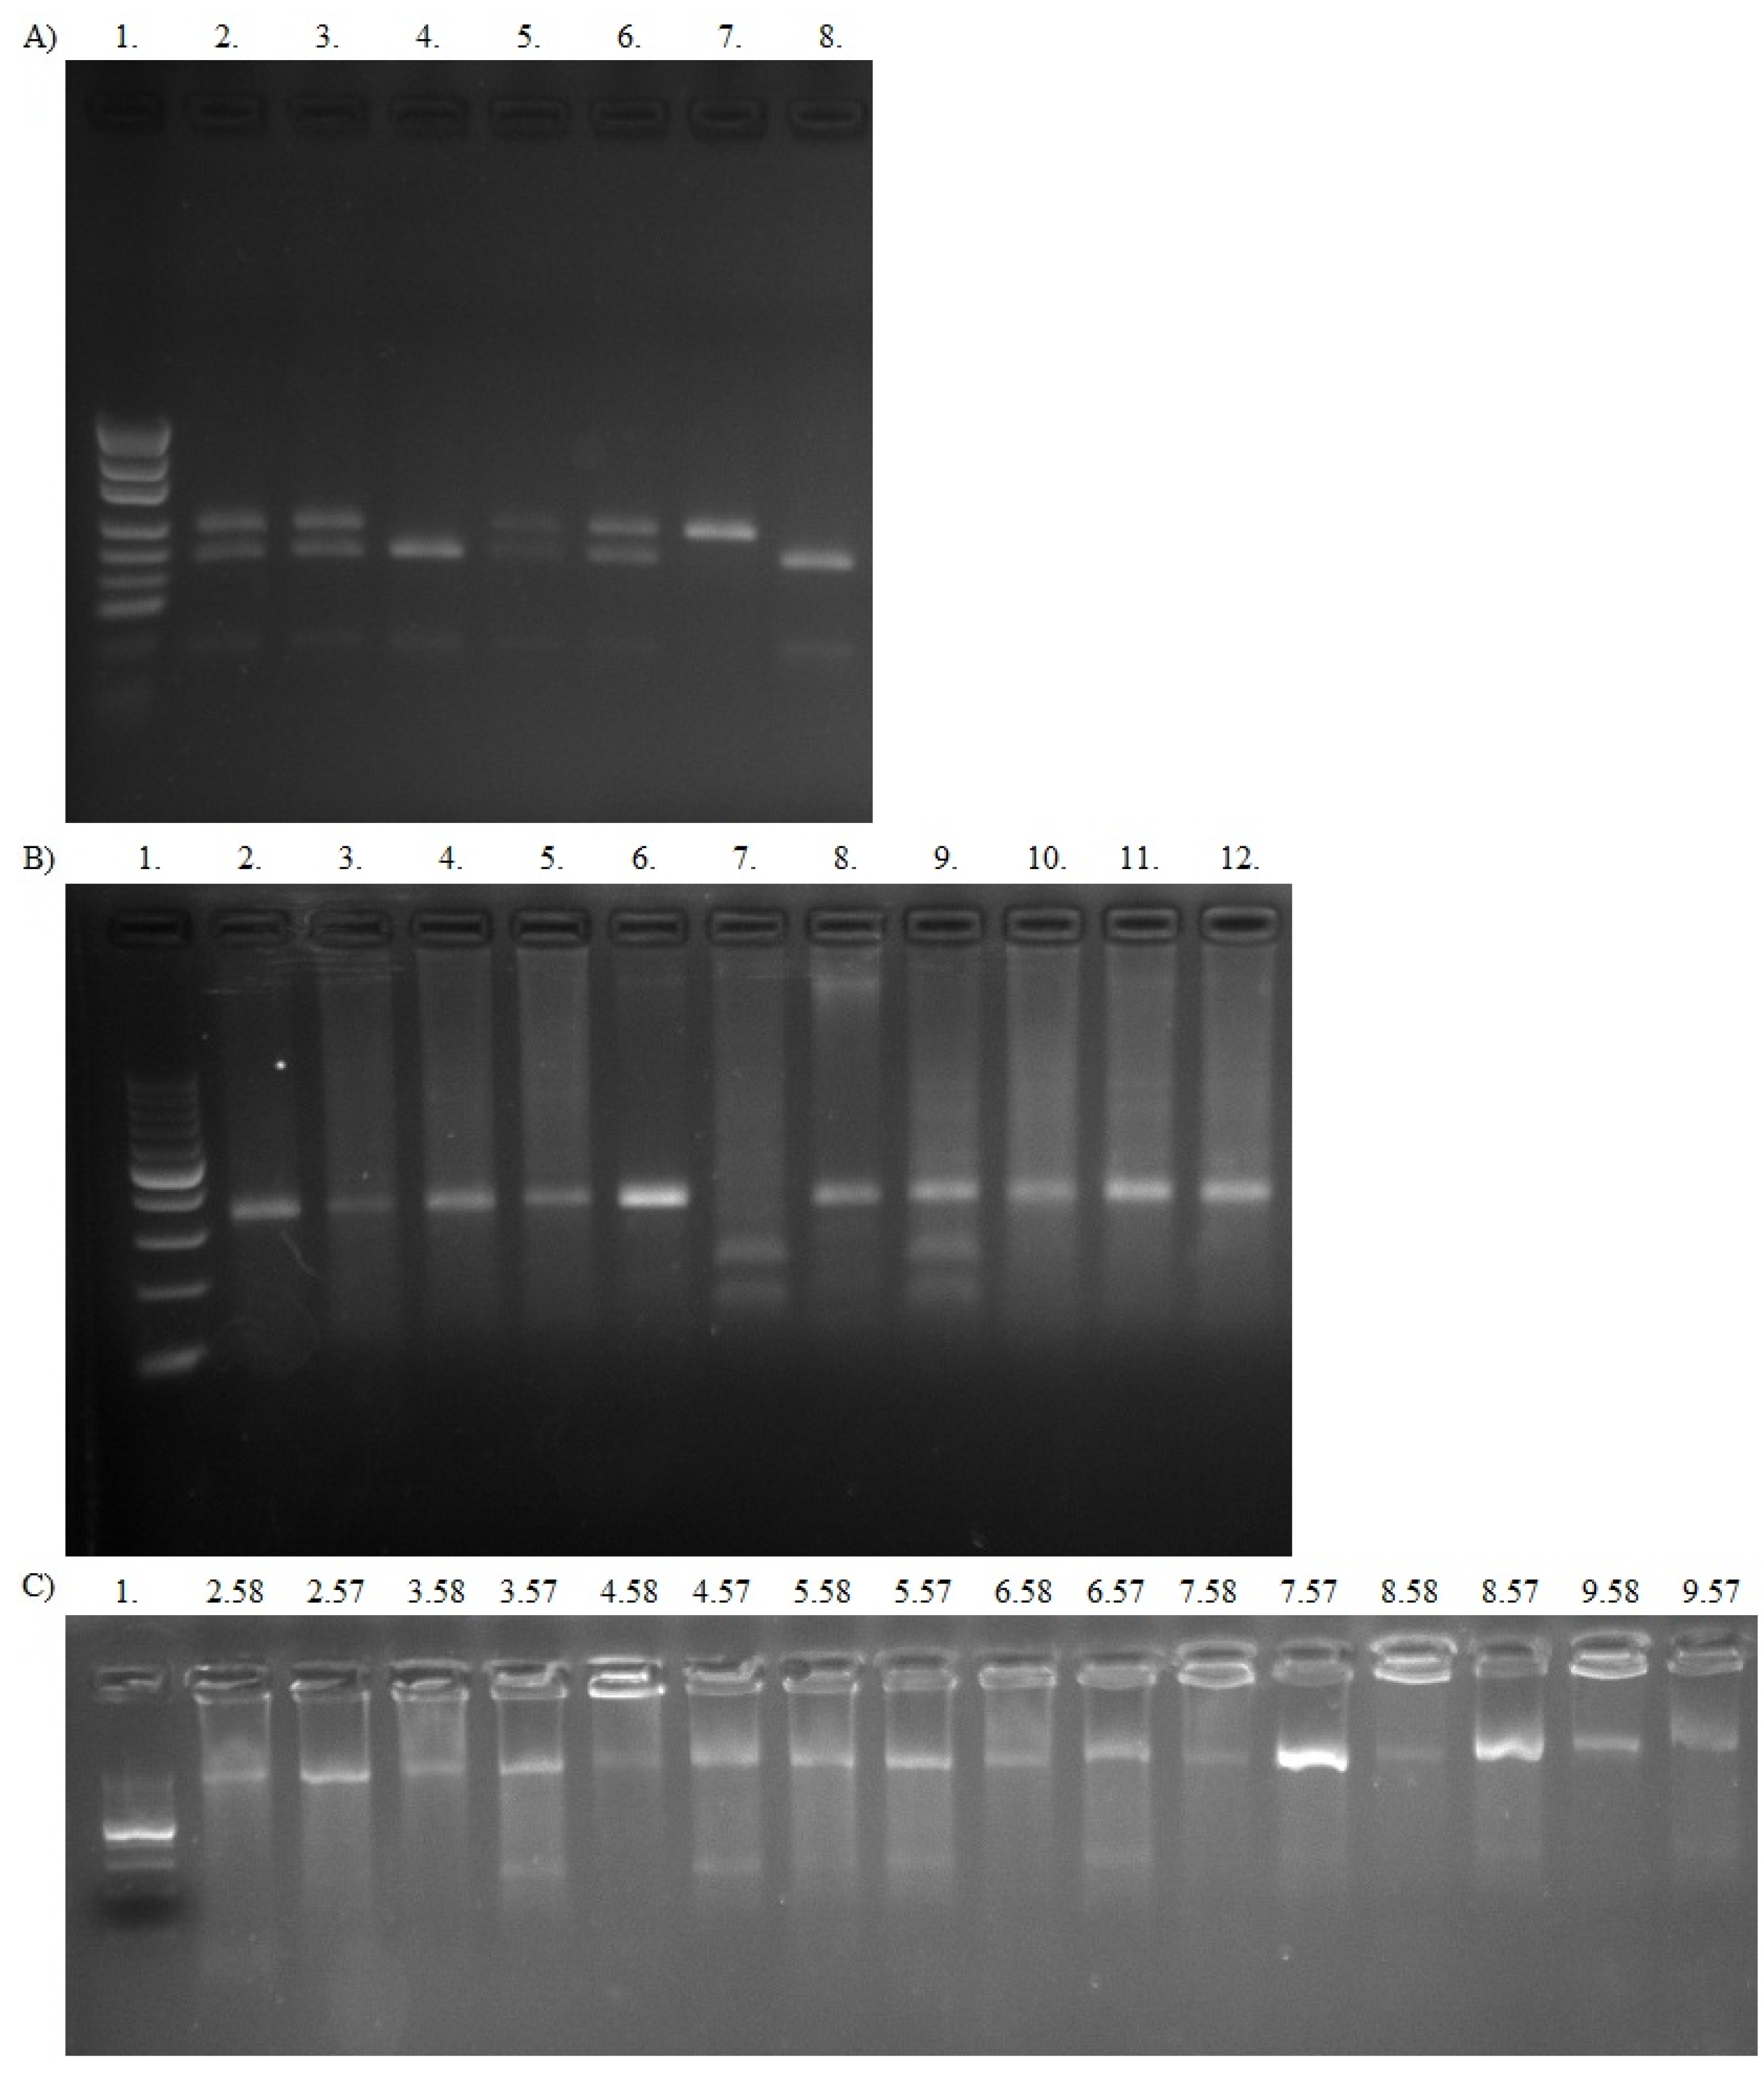
Each PCR mixture (25 µL) contained 100 ng (for 1236C > T)/50 ng (for 2677G > T/A) genomic DNA, PCR buffer (Clontech, Takara Bio USA, San Jose, CA, USA) (for 1236C > T)/PCR buffer (A&A Biotechnology, Gdańsk, Poland) (for 2677G > T/A), dNTPs mixture (0.25 mM), HD polymerase (0.31 U) (Clontech, Takara Bio USA, San Jose, CA, USA) (for 1236C > T)/RUN polymersase (0.25 U) (A&A Biotechnology, Gdańsk, Poland) (for 2677G > T/A) and primers (10 µM of each). The mixture was heated for 94 °C for 5 min and underwent 35 cycles of amplification: denaturation 98 °C for 10 s (for 1236C > T)/94 °C for 30 s (for 2677G > T/A), annealing 56 °C for 10 s (for 1236C > T)/59 °C for 30 s (for 2677G > T/A), elongation 72 °C for 20 s (for 1236C > T)/72 °C for 40 s (for 2677G > T/A). The final elongation taken 4 min at 72 °C. The PCR reactions were performed in a Applied Biosystems 9700 Thermal Cycler (Applied Biosytems, Waltham, WA, USA). Sequencing PCR was performed using BigDye Terminator v3.1 Cycle Sequencing Kit (Applied Biosystems, Waltham, MA, USA) in thermal cycler (as previously). The sequencing PCR product was purified by use of exterminator kit (A&A Biotechnology, Gdańsk, Poland). The sequencing run module was StdSeq50_POP7 in genetic analyzer 3130 (Applied Biosytems, Waltham, MA, USA). The results were analyzed using Applied Biosystems software (Figure 1).

2.3.2. PCR-RFLP

For analysis of 3435C > T variant PCR-RFLP method was applied according to validated protocol of Turgut et al., 2006 [40]. ABCB1 gene fragment length of 238 bp was amplified by PCR using primers:
-
forward 5′-TGC TGG TCC TGA AGT TGA TCT GTG AAC-3′
-
reverse 5′-ACA TTA GGC AGT GAC TCG ATG AAG GCA-3′
Each PCR mixture (25 µL) contained 100 ng genomic DNA and PCR buffer (Clontech, Takara Bio USA, San Jose, CA, USA), dNTPs mixture (0.25 mM), HD polymerase (Clontech, Takara Bio USA, San Jose, CA, USA) and primers (10 µM of each). The mixture was heated 94 °C for 4 min and underwent 35 cycles of amplification: denaturation 98 °C for 15 s, annealing 60 °C for 15 s, elongation 72 °C for 20 s. The PCR reaction was performed in a Applied Biosystems 9700 Thermal Cycler (Applied Biosytems, Waltham, MA, USA).
The PCR product was digested with MboI (Thermo Fisher Scientific, Waltham, MA, USA) according to manufacturer’s procedure. Restriction enzyme produced two fragments of 172 bp and 60 bp or one fragment of 238 bp for presence of C or T allele, respectively. The fragments were analyzed on 3% agarose gel, stained with SimplySafe (Eurx, Gdańsk, Poland) and visualized in G:Box (Syngene, Cambridge, UK) (Figure 2A). For each sample was carried out an independent PCR analysis.

2.4. CYP1A1 Genotyping

For analysis of CYP1A1 6235T > C and 4889A > G variants PCR-RFLP and allele-specific PCR methods were used according to protocols of Kumar et al., 2010 and Drakoulis et al., 1994, respectively [41,42].
For 6235T > C a total of 25 μL reaction mixture consisted of 100 ng genomic DNA, 10µM of each primer, 0.25 mM dNTPs mixture and 0.31 U of HD polymerase (Clontech, Takara Bio USA, San Jose, CA, USA) with 1× PCR reaction buffer (Clontech, Takara Bio USA, San Jose, CA, USA). The primers for PCR reaction were following:
-
forward 5′-AAG AGG TGT AGC CGC TGC ACT-3′
-
reverse 5′-TAG GAG TCT TGT CTC ATG CCT-3′
The thermal profile consisted of initial denaturation 95 °C for 5 min followed by 35 cycles of 98 °C for 15 s, annealing 65 °C for 15 s, elongation 72 °C for 25 s. The PCR reaction was performed in a Applied Biosystems 9700 Thermal Cycler. The restriction enzyme MspI (Thermo Fisher Scientific, Waltham, MA, USA) was used to distinguish 6235T > C variant. The wild type allele (WT, CYP1A1*1) produced single band representing fragment of 340 bp, and the variant allele (m1, CYP1A1*2A) resulted in two fragments of 200 bp and 140 bp. The heterozygote produced all three bands (Figure 2B).
For analysis of 4889A > G variant was made amplification in 25 μL and reaction mixture was as follows—100 ng genomic DNA and PCR buffer (A&A Biotechnology, Gdańsk, Poland), dNTPs mixture (0.25 mM), RUN polymerase (0.25 U) (A&A Biotechnology, Gdańsk, Poland) and primers (10 µM of each). The mixture was heated 95 °C for 5 min and underwent 35 cycles of amplification: denaturation 95 °C for 20 s, annealing 65 °C for 20 s, elongation 72 °C for 30 s. In reaction were used primers producing 1472 bp:
-
forward 5′-ATA GGG TTA GTG GGA GGG ACA CG-3′
-
reverse 5′-GCT CAA TGC AGG CTA GAA CTA GAA TAG AAG-3′
PCR product was divided into two parts (10 μL each, called P57 and P58) and amplified fragments were reamplified. The reaction mixture was the same as that for the first step except the primer mixture—reverse primer was used in two separate reactions. In the first reaction (so called P57), wild type primer (P57, WT, CYP1A1*1) 5′-GAA GTG TAT CGG TGA GAC CG -3′ was used. The second reaction was carried out with the variant primer (P58, m2, CYP1A1*2C) 5′-GAA GTG TAT CGG TGA GAC CG-3′. The mixture was heated 95 °C for 5 min and underwent 20 cycles of amplification—touchdown PCR: denaturation 95 °C for 30 s, annealing 66 °C (−0.5 °C per cycle) for 20 s, elongation 72 °C for 30 s; and 19 cycles with an annealing temperature of 56 °C for 30 s (other conditions remain the same as in touchdown PCR). The obtained product of 996 bp was visualized in G:Box (Syngene, Cambridge, UK). The presence of strong P57 band indicated a wild type allele, while the presence of a strong P58 band indicated a variant allele. Both bands were observed in the case of heterozygtes (Figure 2C).

2.5. Cytogenetic Analyses

Cytogenetic abnormalities observed in MM patients, such as del(17p13.1) and IgHV gene rearrangements—t(4;14), t(14;16) were analyzed by simultaneous staining of cytoplasmic immunoglobulin and FISH (cIg-FISH) according to Ross et al. 2012 recommendations and with the use of previously described protocol with modifications [43,44,45].

2.6. Bortezomib In Vitro Treatment

Bone marrow aspirates (n = 50) (mean number of plasma cells—31.31% ± 20.69) were used with established cell cultures as described by Zmorzynski et al. 2019 [46]. Bortezomib (LC Laboratories, Woburn, MA, USA, 200 mg/mL) was dissolved in DMSO and added to cell cultures. The final concentration of DMSO in culture medium was lower than 0.1%. The cell cultures without bortezomib were used as a control. The cultures were grown without G-CSF and were routinely terminated. To determine the number of apoptotic, necrotic and viable cells Annexin V-Cy3 Apoptosis Detection Kit (Sigma-Aldrich, St. Louis, MO, USA), as well as fluorescence microscope were used. The viable cells were stained with 6-CF (6-carboxyfluorescein)—green dye, and necrotic cells showed red staining due to the presence of AnnCy3 (Annexin V Cy3.18). Cells starting apoptotic process were stained with green and red dyes. Plasma cells were analyzed according to Carter’s et al. [47].

2.7. Statistical Analysis

Laboratory/clinical values were compared with studied genetic variants using an independent t-test and Chi-square test for continuous variables and categorical variables, respectively. The association of analyzed variants with clinical data was evaluated using Chi-square test or Fisher’s exact test. The quantitative data was shown as frequency or percentage. Deviation of genotype frequencies in controls (healthy blood donors) and cases (MM patients) from Hardy-Weinberg equilibrium (HWE) was assessed by Chi-squared test [48]. The Cox proportional hazard model was used for univariate and multivariate analysis of OS and PFS. The Kaplan-Meier method and the log-rank test were used for survival analysis. We assumed a 5% error of inference and a related level of significance p < 0.05 pointing to the existence of statistically significant differences. Statistical analyzes were performed using the Statistica ver. 12.5 (StatSoft) software.

3. Results

3.1. Frequencies of Alleles and Genotypes

Baseline characteristics for 110 MM patients included in this analysis are shown in Table 1. Genotyping of studied genetic variants was successfully performed for MM patients and healthy blood donors. The HWE test showed that the genotypic frequencies of CYP1A1 4889A > G variant were not in HWE for MM patients, because the p value was lower than 0.05 and χ2 was higher than 3.84 (Table 2).

3.2. Studied Variants and the Risk of MM Development

The CYP1A1 6235T > C and ABCB1 gene variants were balanced. The differences in genotypic and allelic frequencies of ABCB1 2677G > T/A (TT genotype and T allele), as well as CYP1A1 variants—6235T > C (WT/m1 genotype and m1 allele) and CYP1A1 4889A > G (m2/m2 genotype and m2 allele), between study and control groups were statistically significant (Table 3).
The studied ABCB1 and CYP1A1 variants influenced the risk of MM. The presence of TT genotype of ABCB1 2677G > T/A polymorphism increased MM risk 2.87-fold (p = 0.007) (Table 3). The presence of CYP1A1*2A (m1) and CYP1A1*2C (m2) alleles decreased the risk of the disease (Table 3).

3.3. ABCB1 and CYP1A1 Variants as a Risk Factors of Death or MM Progression

Rare homozygotes were analyzed together with heterozygotes due to small sample size. A univariate Cox analysis revealed that patients at stage III according to ISS and without auto-HSCT had a 3.03-fold and 6.05-fold increased risk of death (Table 4). Similar findings were observed in the case of disease relapse or progression in MM patients at stage III (HR = 3.12, p = 0.001) and without auto-HSCT (HR = 3.07, p = 0.001) (Table 4). Moreover, the univariate Cox analysis showed decreased risk of death in MM patients with CT + TT genotypes of ABCB1 3435C > T variant (HR = 0.34, p = 0.04) (Table 4).
The multivariate Cox regression analysis confirmed that that patients without auto-HSCT had increased risk of death (Table 5). Moreover, it showed decreased risk of death in the group of MM patients with CT + TT genotypes of ABCB1 3435C > T variant – HR = 0.34, p = 0.04 (Table 5).
The analysis of response rate in MM showed that patients at stage III or without auto-HSCT had an increased chance of progressive disease—OR = 7.66 (p < 0.001) or OR = 5.59 (p = 0.001), respectively. The studied variants of ABCB1 and CYP1A1 genes did not affect the response to treatment of MM patients.

3.4. Correlation between Analyzed Polymorphisms and MM Clinical Features

Potential relationships between clinical data and selected genotypes were analyzed. We found, that wt/m2 + m2/m2 genotypes in comparison to wt/wt genotype of CYP1A1 4889A > G were associated with higher free light chain ratio (618.74 vs. 177.09, p < 0.001), β2-microglobulin concentration (mg/L) (7.68 vs. 5.66, p = 0.03) and creatinine concentration (mg/dL) (2.53 vs. 1.38, p = 0.003) (Table 6). Moreover the presence of CYP1A1*2A allele (of 6235T > C variant) was associated with higher number of platelets (K/µL) (196.4 vs. 241.1, p = 0.01) (Table 6). We did not observe relationships of the studied variants with high-risk chromosomal abnormalities, smoking status, exposure to carcinogens, or family history of cancer.

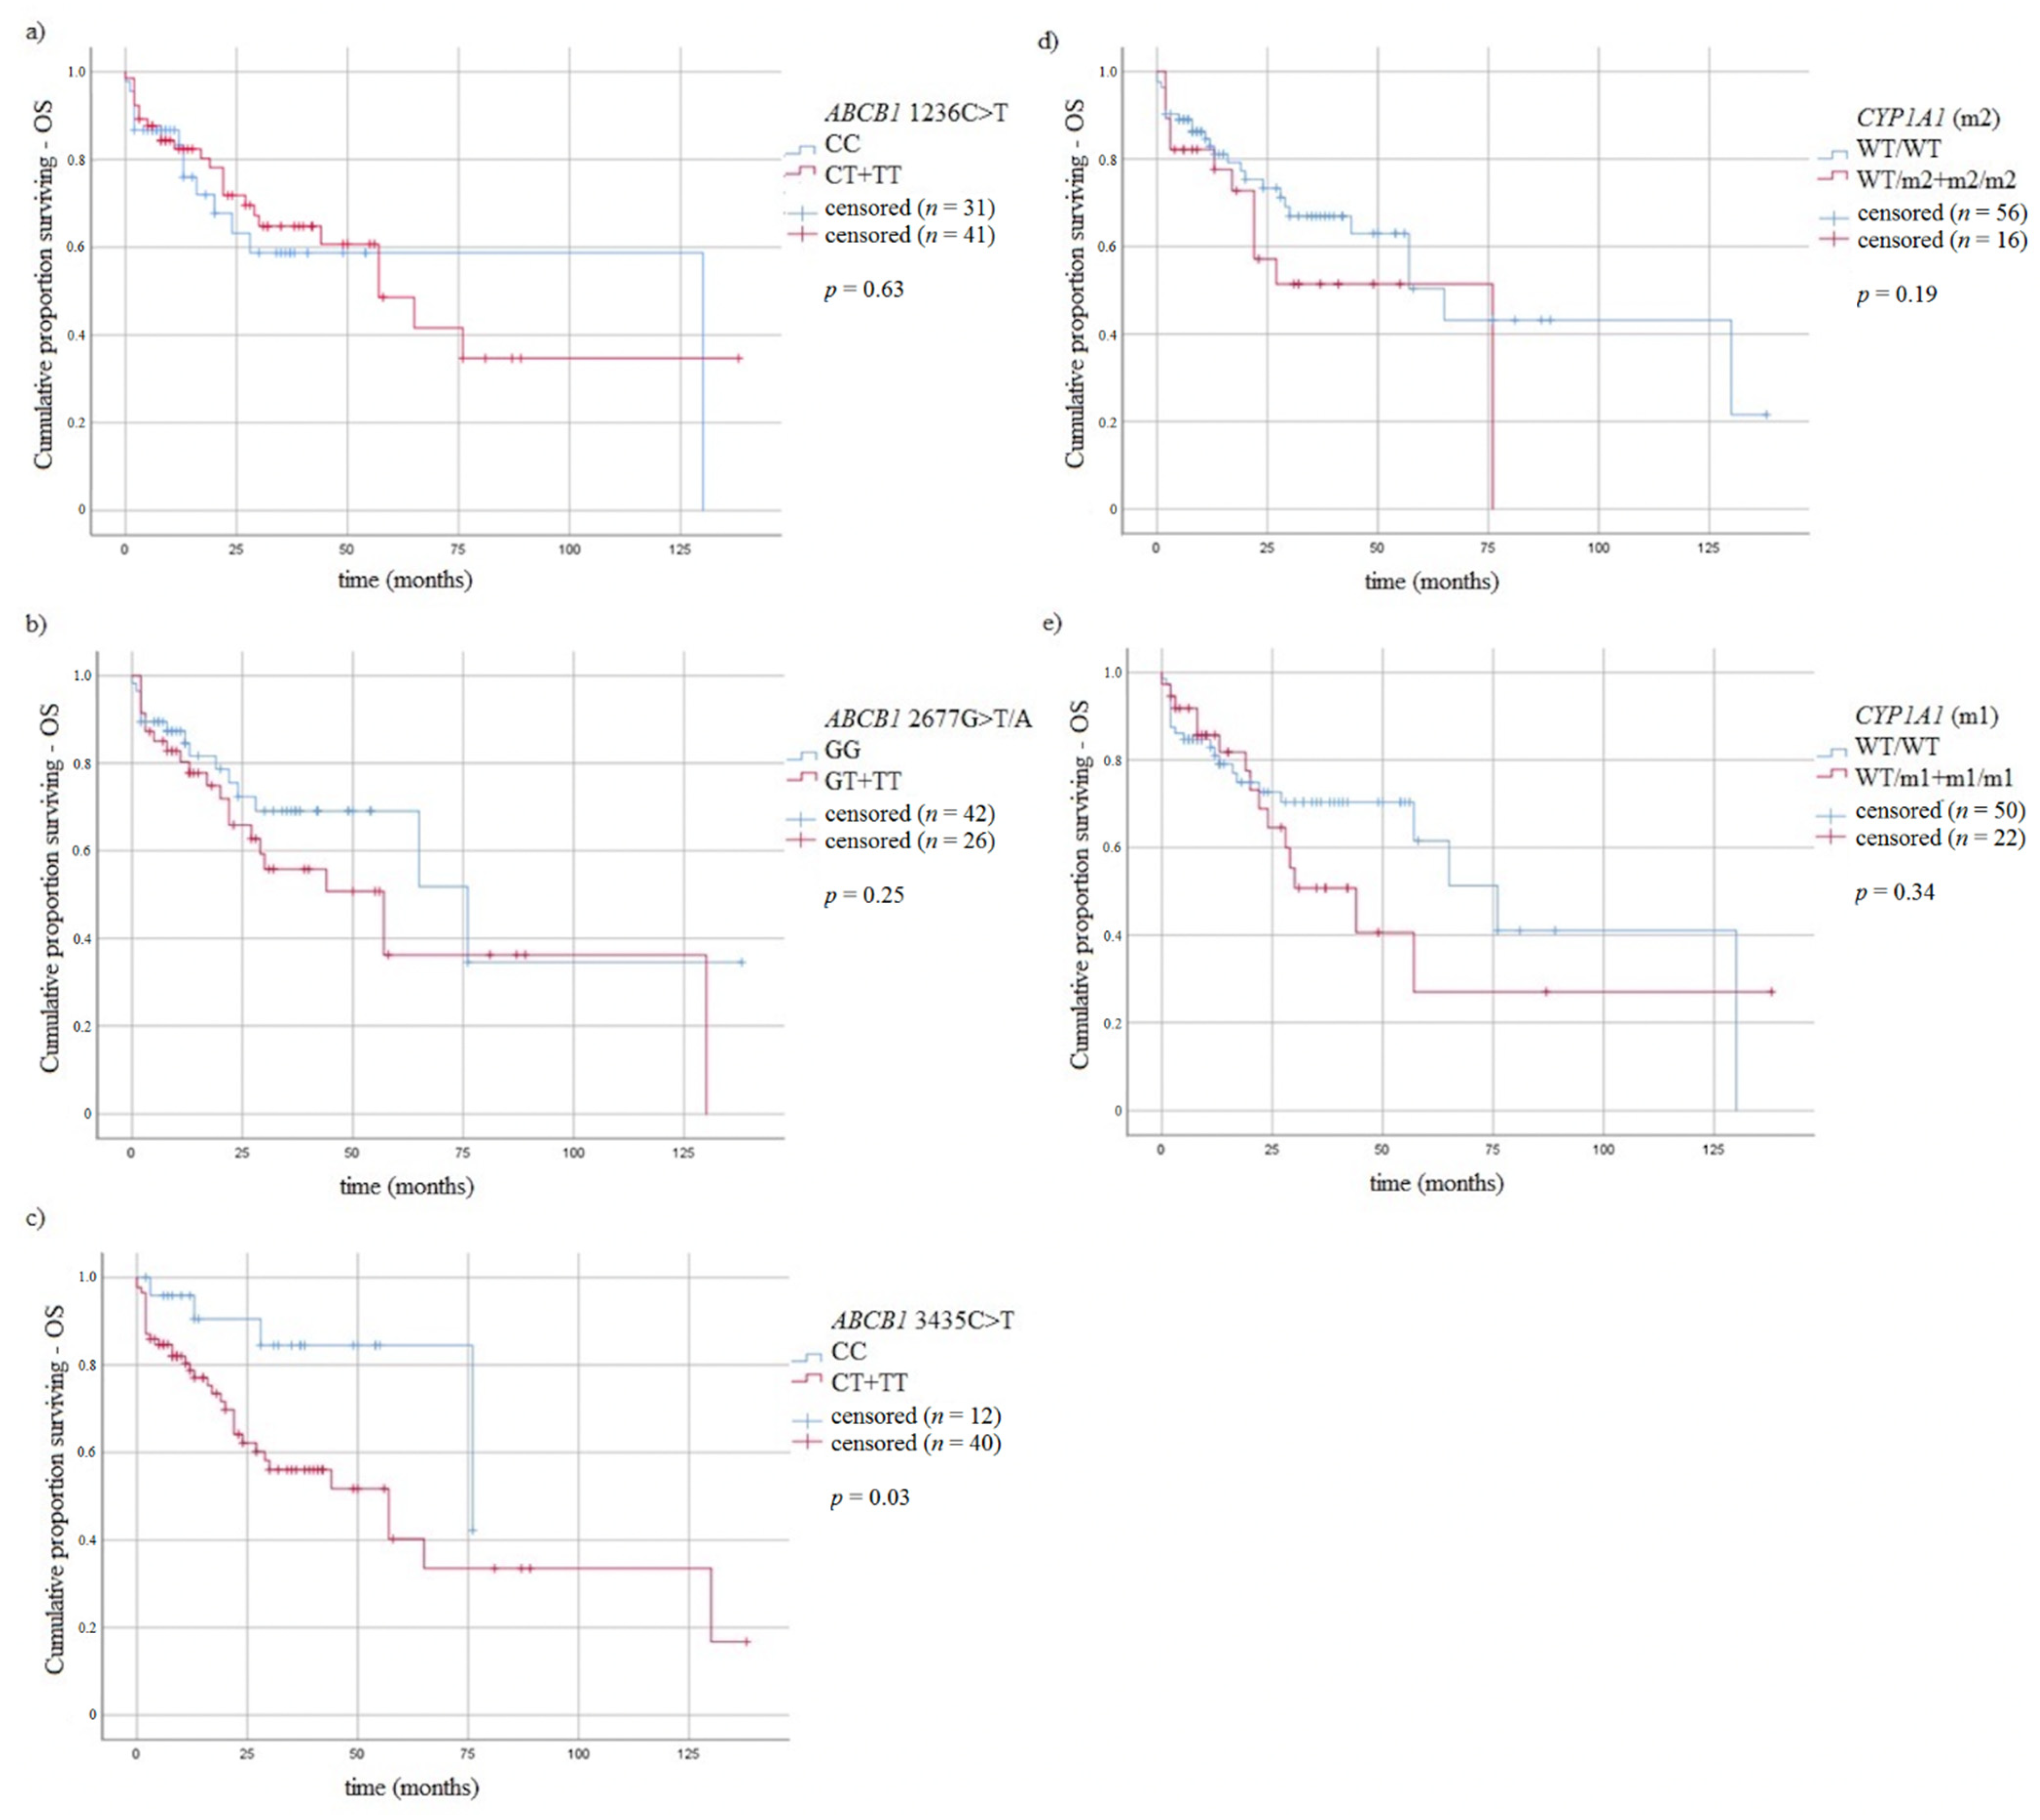
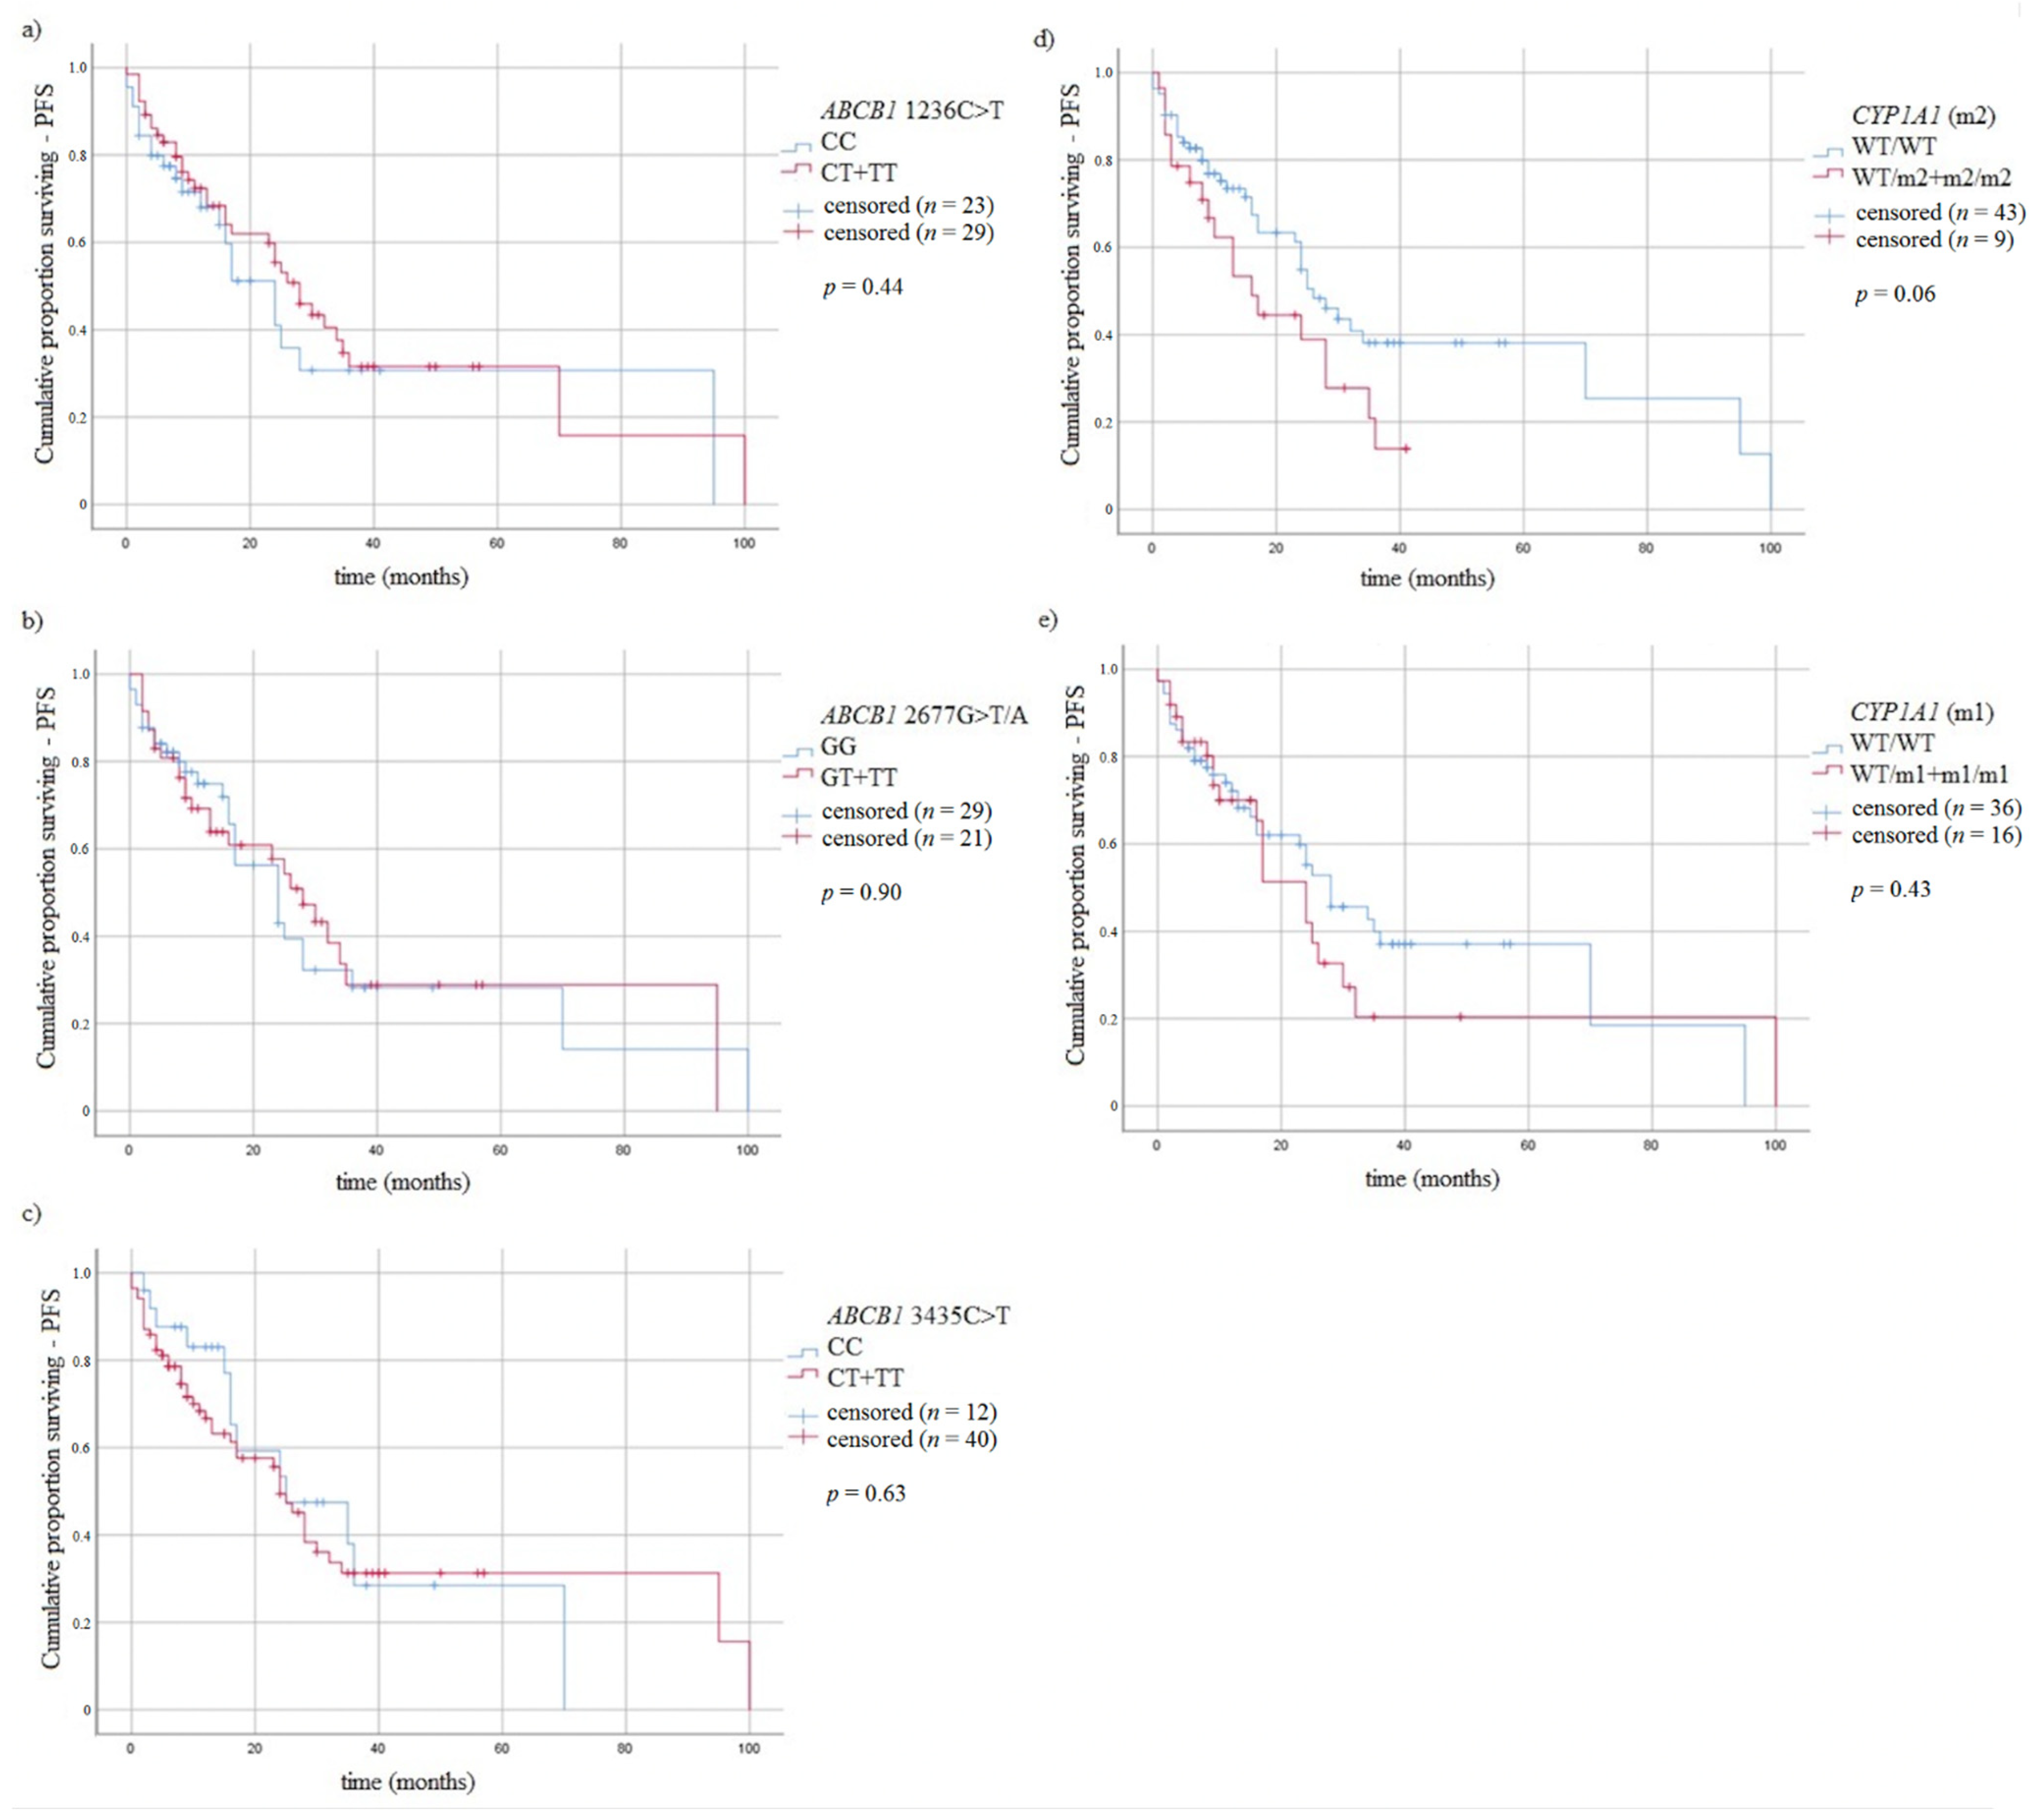
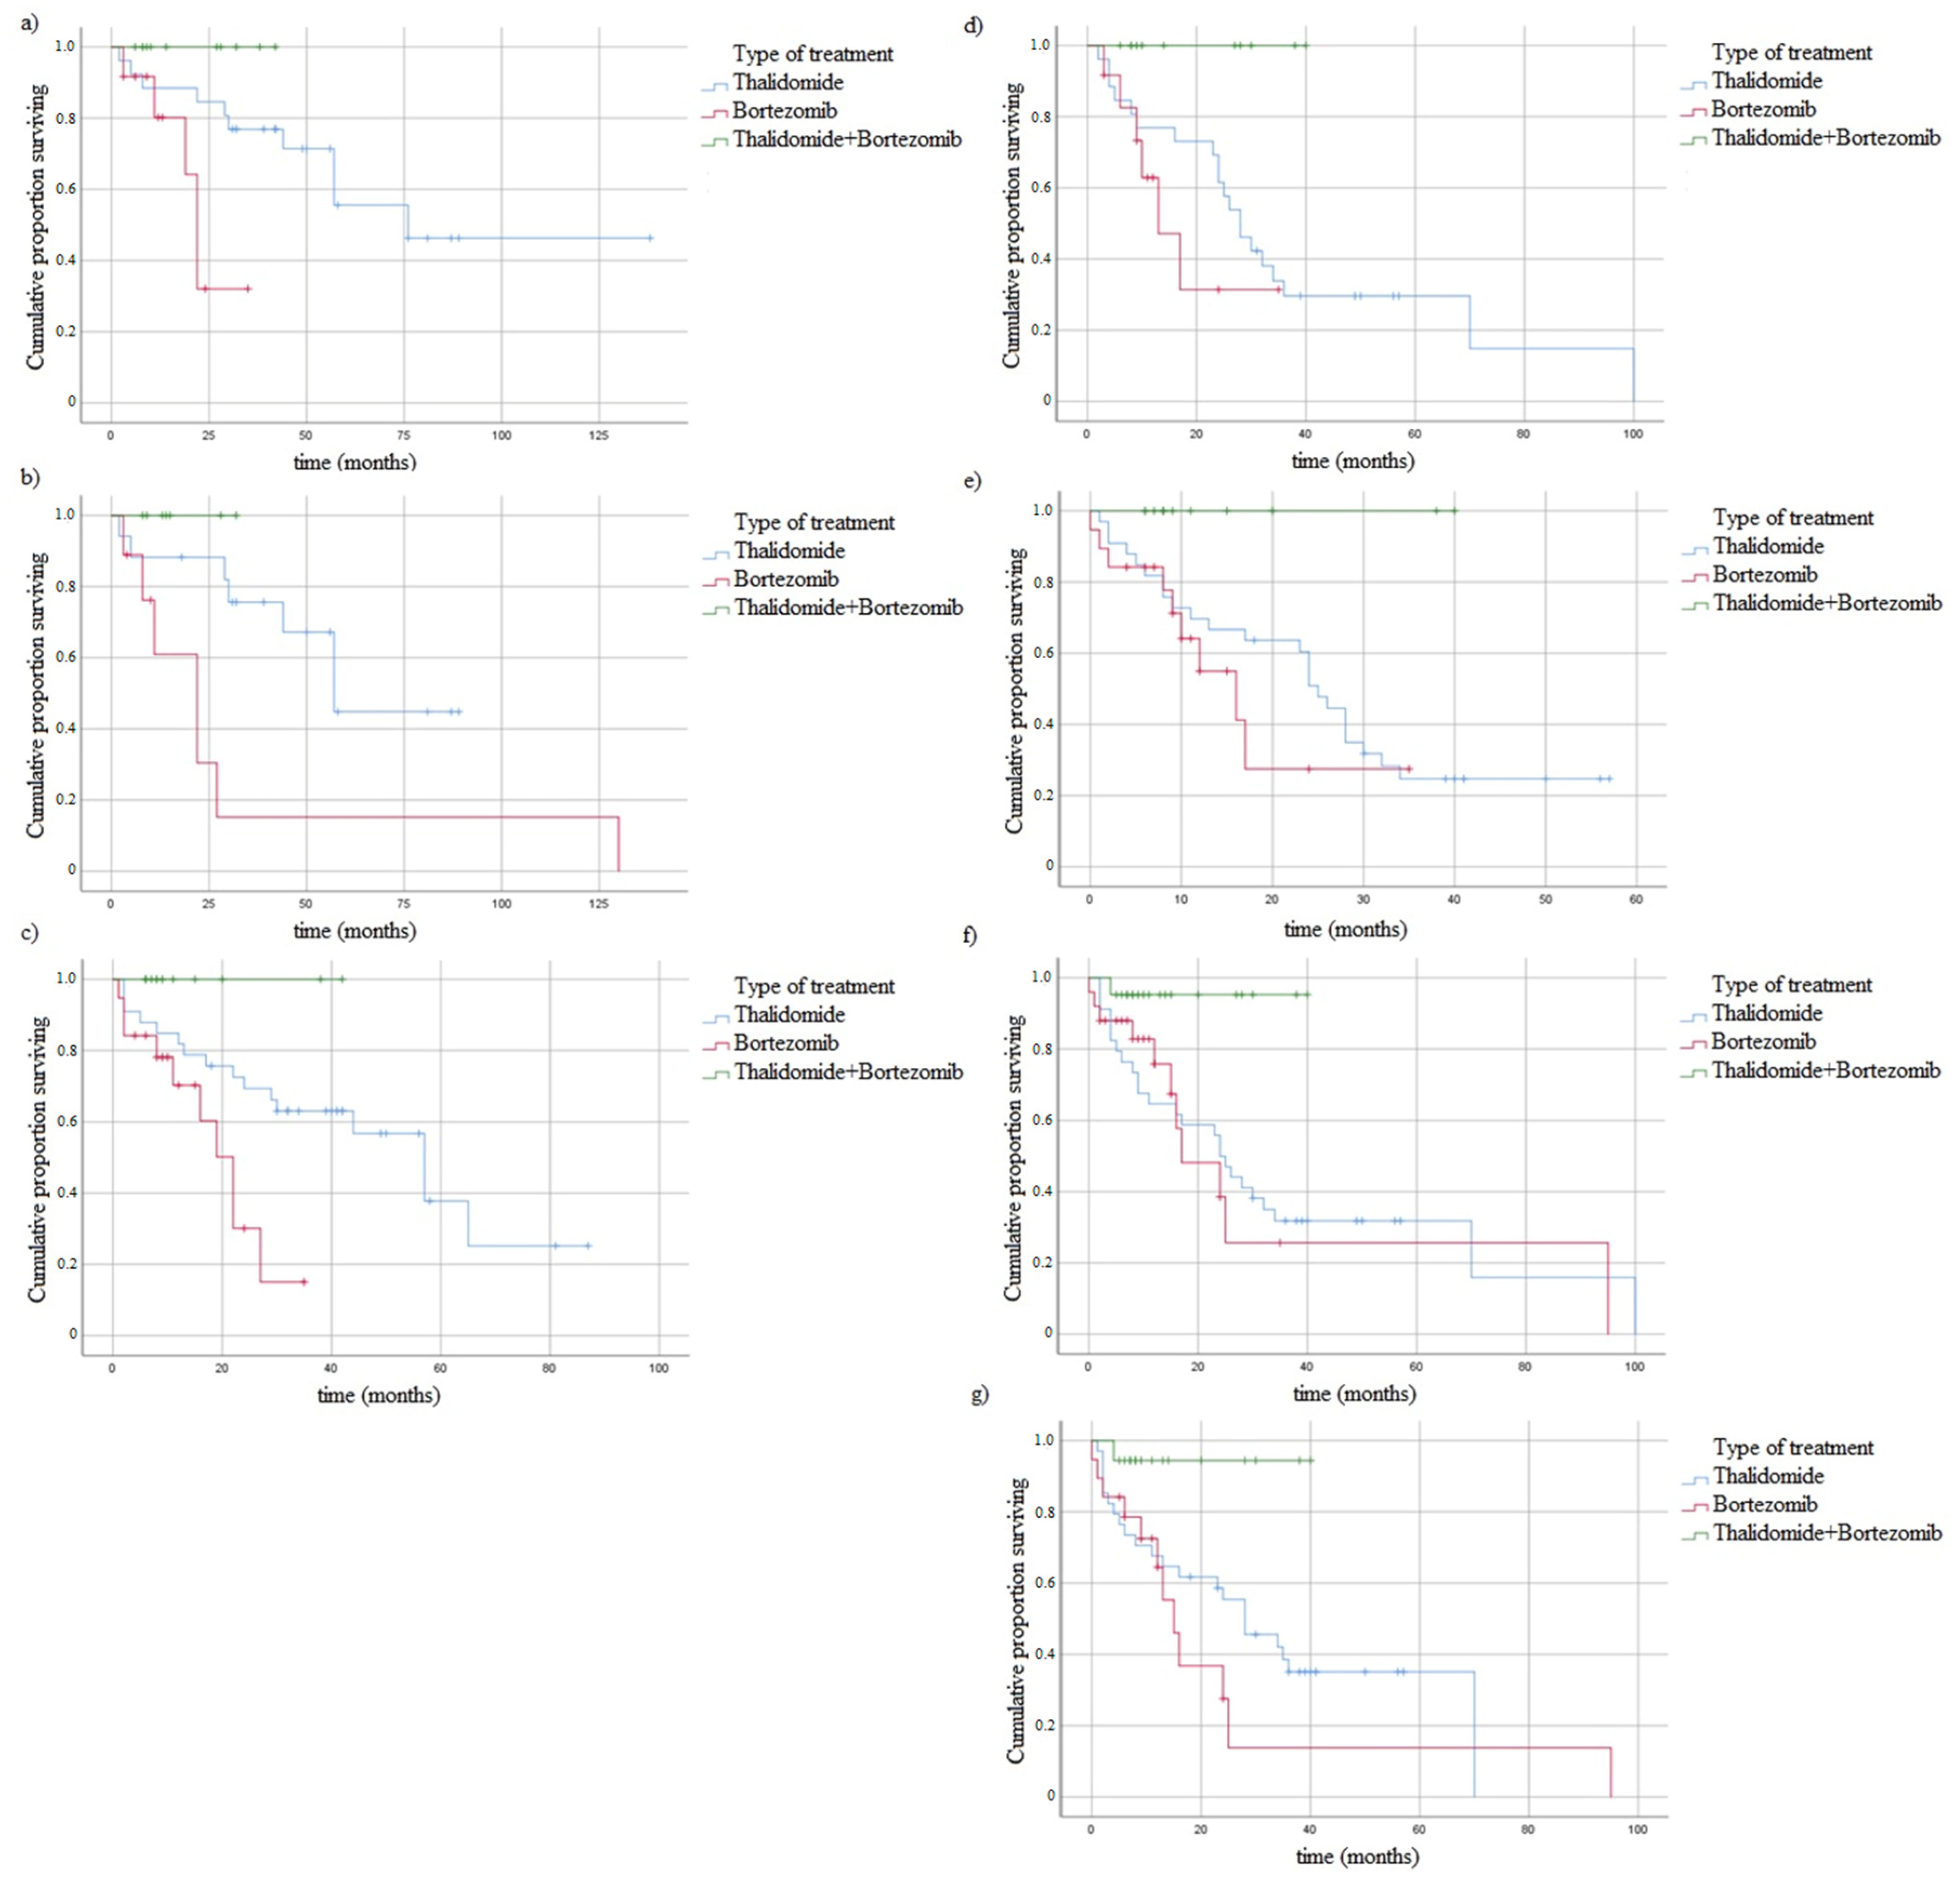
3.5. Survival of MM Patients and Studied Variants

We analyzed the association between studied genotypes and survival of MM patients. In the log rank test (Figure 3 and Figure 4), without taking into account the type of treatment, the difference in OS between CC vs. CT + TT genotypes of ABCB1 3435C > T was observed (Figure 3).
It was performed a log rank analysis taking into account studied variants and the type of treatment (thalidomide vs. bortezomib vs. both—thalidomide and bortezomib). We found association of CT genotype of ABCB1 1236C > T with the treatment type and OS (p = 0.014) or PFS (p = 0.021) (Figure 5). Taking into account the type of treatment and OS similar results were observed in the case of GT genotype of ABCB1 2677G > T/A variant (p = 0.013) and CT genotype of ABCB1 3435C > T variant (p = 0.005). Moreover, in the analysis of treatment and PFS we found association with CT genotype of ABCB1 1236C > T (p = 0.021), CT genotype of ABCB1 3435C > T (p = 0.033), wt/wt genotype of CYP1A1 6235T > C (p = 0.016) and wt/wt genotype of CYP1A1 4889A > G (p = 0.021) (Figure 5).

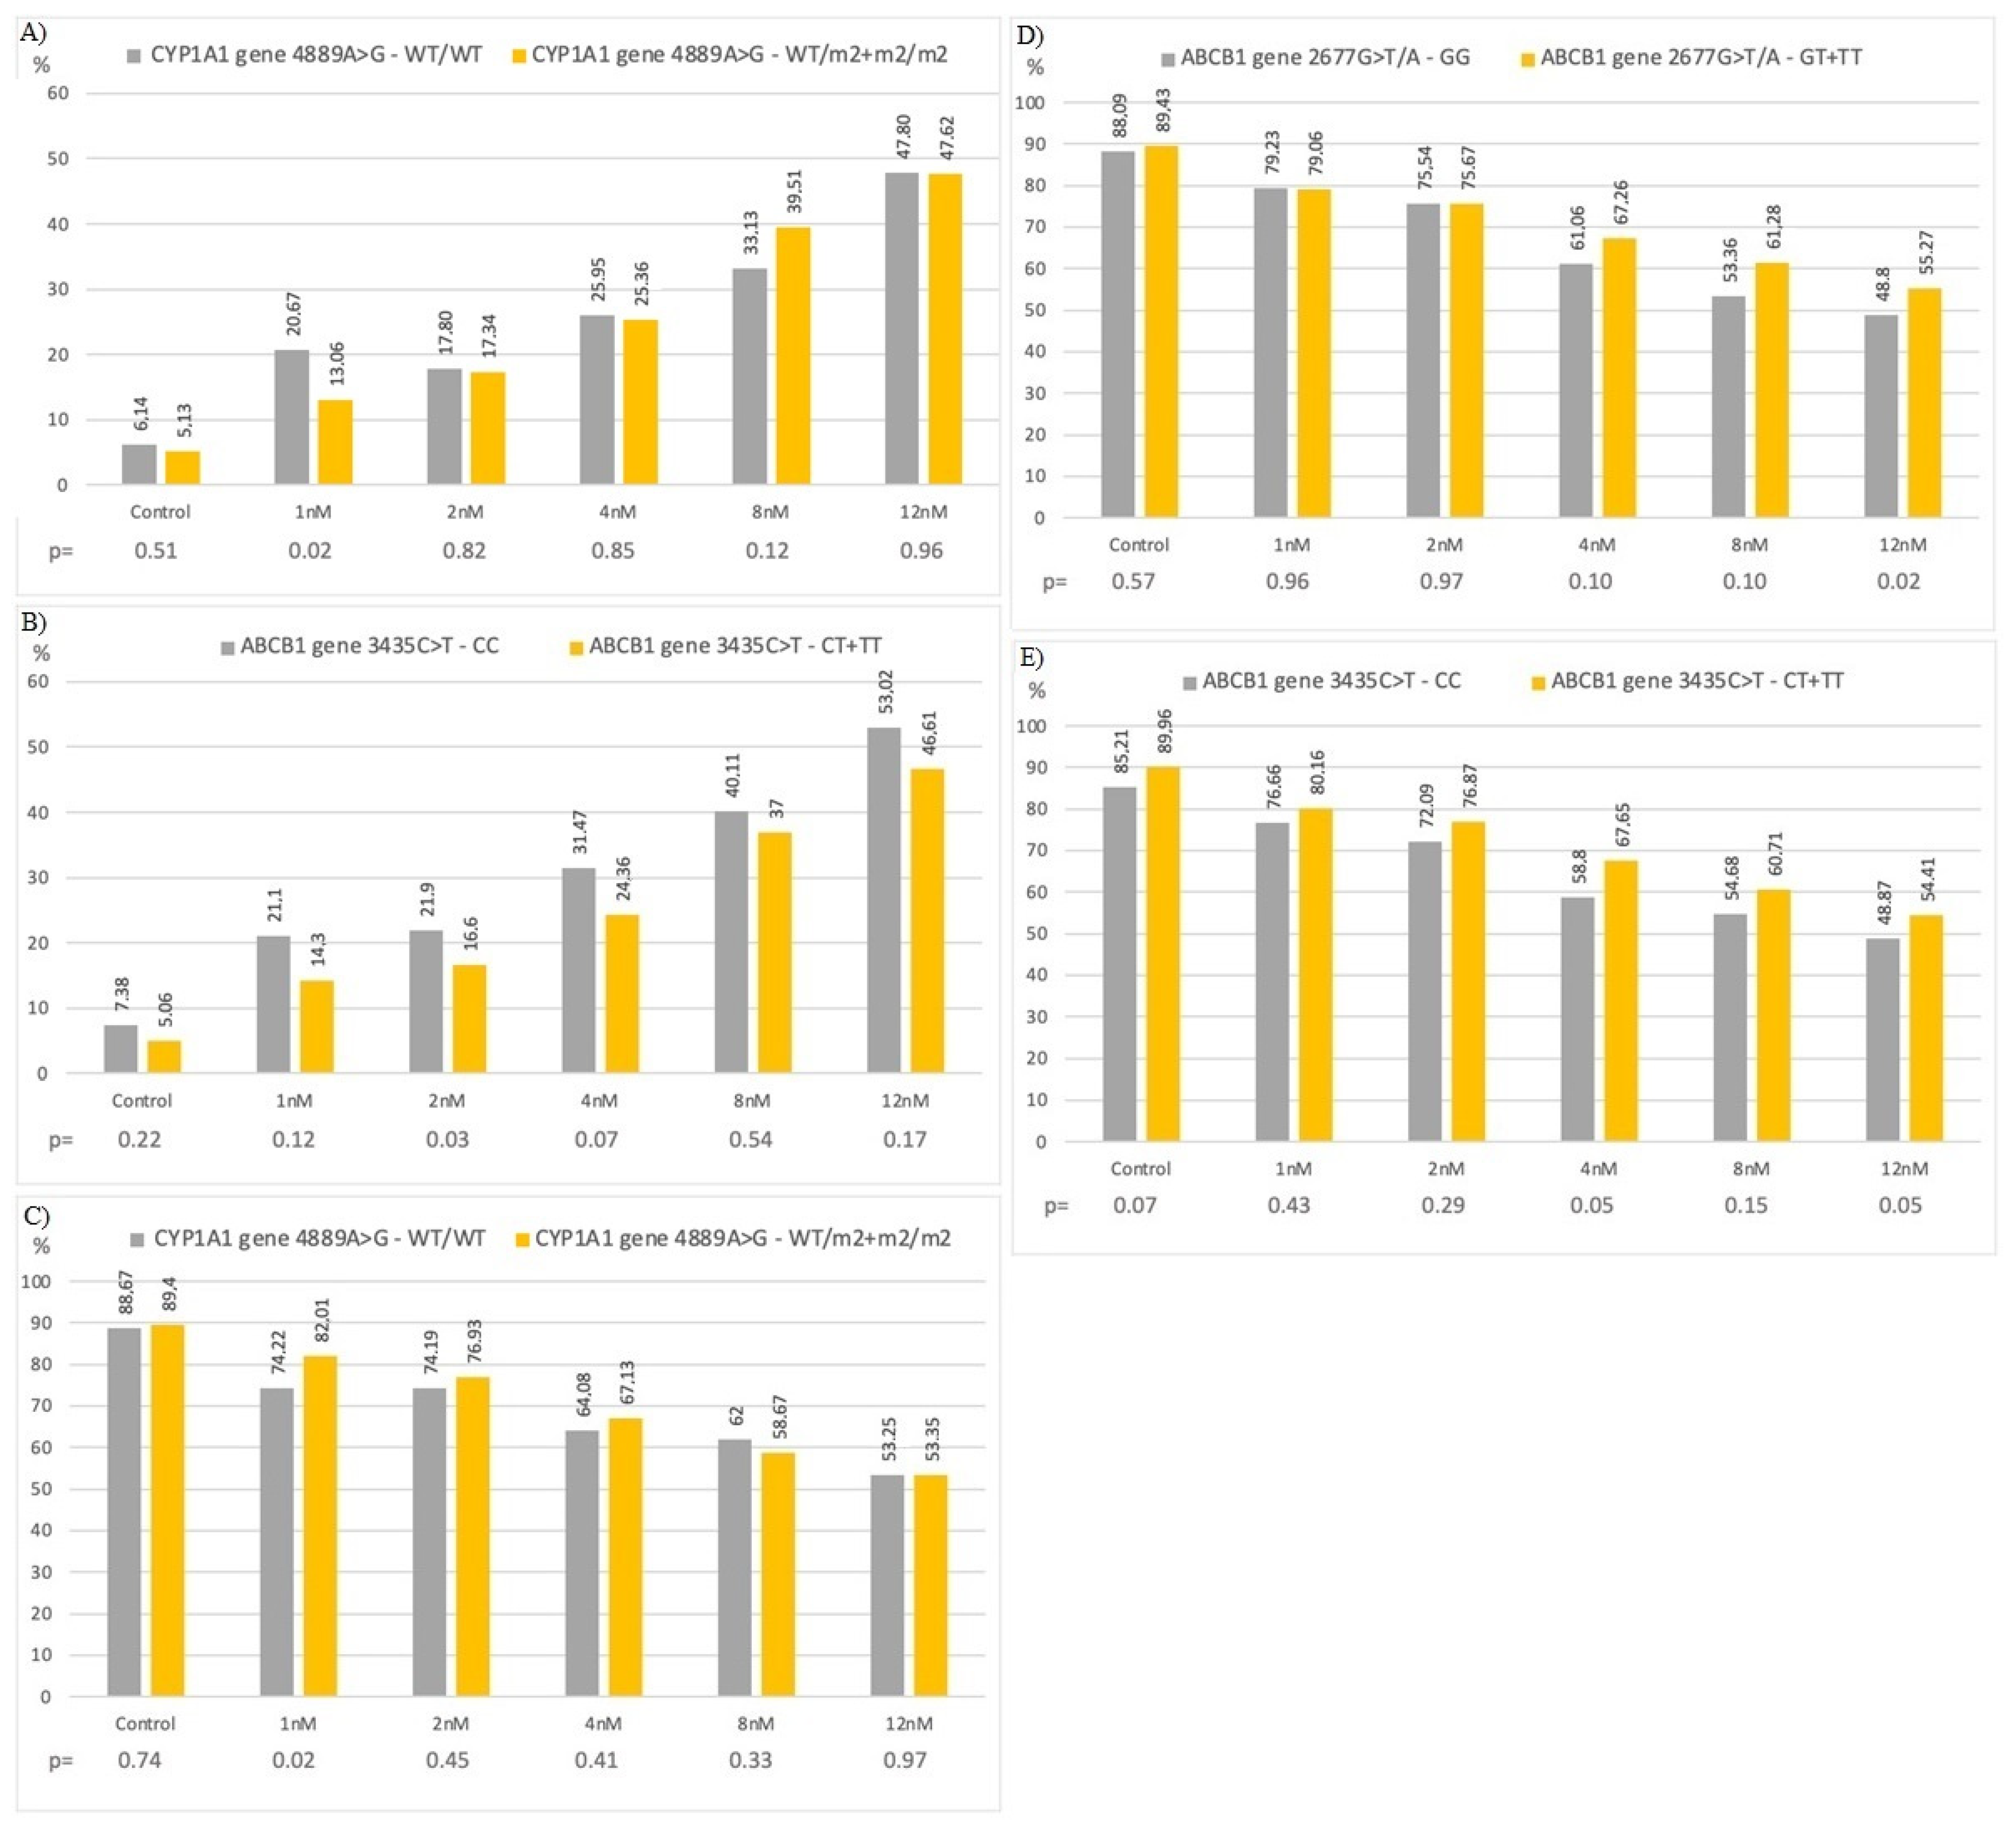
3.6. In Vitro Study with Bortezomib

In in vitro studies, bortezomib increased the number of apoptotic and necrotic cells in all studied genotypes. The higher number of apoptotic cells was observed at 1 nM and 2 nM of bortezomib in patients with wt/wt genotype (of CYP1A1 4889A > G) and CC genotype (of ABCB1 3435 C > T) in comparison to those with wt/m2 + m2/m2 genotypes (20.67% vs. 13.06%, p = 0.02) and CT + TT genotypes (21.90% vs. 16.60%, p = 0.03), respectively (Figure 6A,B). Higher number of viable cells was found at 1 nM and 12 nM of bortezomib in cells with wt/m2 + m2/m2 (of CYP1A1 4889A > G) and GT + TT genotypes (of ABCB1 2677G > T/A) in comparison to wt/wt and GG genotypes, respectively (Figure 6C,D). In the case of 3435C > T variant was observed tendency for lower number of viable cells with CC genotype in comparison to CT + TT genotypes at 4 nM and 12 nM of bortezomib—58.8% vs. 67.65% and 48.87% vs. 54.41%, respectively (Figure 6E).

4. Discussion

In the current study, we analyzed the correlation of ABCB1 and CYP1A1 variants with the risk and the outcome of MM, as well as response to bortezomib treatment under in vitro conditions. We found relationships between the ABCB1 2677G > T/A, CYP1A1 6235T > C and 4889A > G variants with the risk of MM. Moreover, we found that the ABCB1 3435C > T variant affected the OS.
The mechanisms associated with ABC transporters are responsible for the development of the MDR phenotype in MM patients [8]. The tumor cells were able to overcome the drugs cytotoxicity. This was the main cause of treatment failure in MM [8]. The identification of new prognostic and predictor factors may help to define subgroups of patients that most likely can benefit from chemotherapy [49]. Among analyzed variants of the ABCB1 gene, including 3435C > T (synonymous variant), 1236C > T (synonymous variant) and 2677G > T/A (non-synonymous variant), the most important seems to be the one located at nucleotide 3435 [50]. It leads to changes at the mRNA level and affects protein folding [51]. Some studies have confirmed the relationship of the ABCB1 3435 C > T variant with MM risk. However, published data are still inconclusive [50]. The meta-analysis performed by Razi and co-workers did not find an association of ABCB1 3435C > T with MM susceptibility [50]. In contrast, we found the relationship of TT genotypes of 3435C > T with an almost threefold increased risk of MM development. It is possible that the ABCB1 3435C > T variant is in linkage disequilibrium with some alleles, which may impact MM development [6]. Similarly, the presence of the T-allele of ABCB1 2677G > T/A variant was associated with a higher MM risk. Drain et al. in a study of 134 MM patients, found an association between the CC genotype of ABCB1 3435C > T variant with shorter OS, which is in line with our observations [8]. Similar results were obtained by Drain et al. in another study [52]. Moreover, they did not find a relationship between the ABCB1 1236C > T and 2677G > T/A variants with OS [8]. In our study, we observed that allele frequencies and distributions of analyzed ABCB1 variants were comparable in MM patients and healthy blood donors, which is in agreement with previous reports concerning healthy Caucasian populations [5,6]. Silent variants at the 3435 nucleotide of the ABCB1 gene can alter ABCB1 protein conformation, which may change the specificity of binding with substrates [53]. ABCB1 3435C > T variant is present in the gene coding sequence (exon 26), and it is likely linked to other regions that regulate gene expression, for example the promoter or enhancer sequence or regions associated with mRNA processing [49]. It is suggested that the ABCB1 3435C > T variant may be significant only in individuals with specific carcinogen exposure [6]. However, in our study we did not find an association of the analyzed variants with carcinogen exposure, including smoking. Our findings suggest that the T-alleles (CT and TT genotypes) of ABCB1 3435C > T variant might be associated with a lower risk of death in MM patients. Univariate and multivariate Cox analysis suggested that the presence of T (at 3435 nucleotide) might be a positive prognostic factor. The T-allele of this variant can be associated with lower ABCB1 gene expression in comparison to C-allele [54]. Moreover, we observed longer OS for patients with the CT genotype of ABCB1 3435C > T treated with thalidomide and bortezomib in comparison to those with CT genotype treated with thalidomide or bortezomib. This effect might be not observed in TT genotypes due to the small sample size. In the case of second analyzed synonymous variant of ABCB1 gene—1236C > T, we found only association of CT genotype with treatment type and OS/PFS. A more detailed analysis on a larger cohort would be recommended.
The presented study showed that CYP1A1*2A and CYP1A1*2C alleles decreased the risk of MM development. Similar results were obtained by Kang et al., 2008 [30]. However, their study was conducted among an Asian population [30]. The previous report by Lincz et al. suggested no association of CYP1A1 variants with MM in Caucasians [55]. In our study, the CYP1A1 4889A > G variant was not in HWE. The CYP1A1*2A (m1) and CYP1A1*2C (m2) alleles may enhance the enzyme activity and therefore the metabolism of corresponding substrates may be at a higher level [23]. CYP1A1 6235T > C variant raises the risk for solid tumors, for example lung cancer, cervical cancer, prostate cancer and laryngeal cancer [56,57,58,59]. In contrast, negligible relations between CYP1A1 6235T > C variant and gastric cancer, colorectal cancer, breast cancer and esophageal cancer risks were found [60,61,62,63]. Therefore this variant may play a diverse role in different cancers.
The clinical stage of MM can be measured by serum markers, including β2-microglobulin, free light chain ratio, creatinine and C-reactive protein levels followed by confirmation with invasive biopsy of bone marrow [64]. In our study, we found an association of the CYP1A1*2C (m2) allele with a higher free light chain ratio, and higher β2-microglobulin and creatinine concentrations, which are negative prognostic factors. In contrast, the presence of the CYP1A1*2C allele decreased the risk of MM. These results are not consistent and require studies on a larger cohort. Moreover, CYP1A1 4889A > G genotypes were not in HWE, which suggest their role in disease susceptibility. However, due to low sample size this result could be obtained by error sampling.
Interactions between MM cells and the bone marrow microenvironment play a critical role in the development of MDR [65]. We observed the relationship of the ABCB1 and CYP1A1 variants with response to bortezomib treatment under in vitro conditions. In the case of T-allele of ABCB1 2677G > T/A, we noted a statistically significant higher number of viable cells at 12nM of bortezomib. However, we did not observe significant changes in the level of apoptotic and necrotic cells, taking into account the presence of the T-allele of ABCB1 2677G > T/A. It is possible that this result was obtained accidentally or that higher doses of bortezomib should be applied. Similarly, the presence of a T-allele of ABCB1 3435 C > T variant was associated with a lower number of apoptotic cells, but only at 2 nM of bortezomib. The CYP1A1*2C (m2) allele affected the number of viable cells and apoptotic cells only at 1nM of bortezomib. More reliable results would be associated with a significant change in the number of cells with increasing bortezomib dose. It would be recommended to repeat the in-vitro experiment with modified conditions, including the replacement of RPMI with AIM-V media. RMPI and 10% FCS induce apoptosis of primary B-cells [66].
There are some limitations of our study regarding the number of MM patients, as well as apoptosis detection in the in vitro experiment. The number of participants in the study group was relatively small, which was due to the low incidence of MM. However, the number of 110 MM patients was enough for most analyzes. Fluorescent microscopy was used to evaluate apoptosis the in in-vitro study. A more accurate method for apoptosis detection is FACS (flow cytometry-based apoptosis detection). Unfortunately, during the experiment time, FACS was not available to us. The set used for apoptosis analysis was dedicated and validated to fluorescent microscopy.
Several large scale genome-wide association studies (GWASs) have failed to identify ABCB1 and CYP1A1 polymorphisms in association with MM [67,68,69]. Although GWAS was made in the United States and in European ancestry populations, it is possible that in the Polish population the studied variants may have a prognostic significance [69,70,71]. In the case of ABCB1 variants, a similar study in the Polish population was made by Jamroziak and coworkers [6]. They did not find whether common ABCB1 variants affect predisposition to MM [6]. However, we found an association of the ABCB1 2677G > T/A variant with an increased risk of MM. This result might be due to error sampling or due to the fact that the study included the southwestern Polish population. Further analysis in this field would be recommended.

5. Conclusions

In spite of this study’s limitations and the need for prospective studies with larger sample sizes, our findings suggest that the T-allele of ABCB1 2677G > T/A increased the risk of MM. In contrast, CYP1A1*2A (m1) and CYP1A1*2C (m2) alleles decreased the susceptibility of this disease in the Caucasian population in southeastern Poland. Moreover, the C-allele of ABCB1 3435C > T was associated with shorter OS. Further analysis on a larger cohort could help to better understand the significance of studied variants in the development and outcome of MM.

Author Contributions

S.Z., M.W.-L. and S.P.-M. carried out the experiment and performed the molecular analysis of ABCB1/MDR1 and CYP1A1 variants. S.C. performed cytogenetic analysis. S.Z. performed in vitro study with bortezomib. A.A.F. was involved in planning and supervised the work. S.Z., A.S.-S. and W.S. processed the experimental data and performed the analysis. S.Z. and W.S. designed the figures. S.Z. and A.S.-S. wrote the manuscript with support from A.A.F. All authors have read and agreed to the published version of the manuscript.

Funding

This project was supported by the Medical University of Lublin, Poland (Grants MNmb 232 and DS 225).

Institutional Review Board Statement

The study obtained a positive opinions (no. KE-0254/165/2013 and no. KE-0254/337/2016) from the Bioethics Committee of Medical University of Lublin, according with the ethical standards established by Helsinki Declaration. All methods were performed in accordance with the relevant guidelines and regulations. All procedures performed in studies involving human participants were in accordance with the ethical standards of the institutional and/or national research committee and with the 1964 Helsinki declaration and its later amendments or comparable ethical standards.

Informed Consent Statement

Informed consent was obtained from all subjects involved in the study.

Data Availability Statement

The clinical data used to support the findings of this study are available from the corresponding author upon request.

Conflicts of Interest

The authors declare no conflict of interest. The funders had no role in the design of the study; in the collection, analyses, or interpretation of data; in the writing of the manuscript, or in the decision to publish the results.

References

  1. Kumar, S.K. Management of Multiple Myeloma. J. Natl. Compr. Cancer Netw. 2018, 16, 624–627. [Google Scholar] [CrossRef]
  2. Iida, S. Mechanisms of action and resistance for multiple myeloma novel drug treatments. Int. J. Hematol. 2016, 104, 271–272. [Google Scholar] [CrossRef] [Green Version]
  3. Toru, U.; Ayada, C.; Genç, O.; Turgut, S.; Turgut, G.; Bulut, I. MDR-1 gene C/T polymorphism in COPD: Data from Aegean part of Turkey. Int. J. Clin. Exp. Med. 2014, 7, 3573–3577. [Google Scholar] [PubMed]
  4. Dogan, O.T.; Katrancıoglu, N.; Karahan, O.; Sanlı, G.C.; Zorlu, A.; Manduz, S. Frequency of the mdr-1 C > T gene polymorphism in patients with COPD. Clinics 2010, 65, 1115–1117. [Google Scholar] [CrossRef] [PubMed]
  5. Sakaeda, T. MDR1 Genotype-related Pharmacokinetics: Fact or Fiction? Drug Metab. Pharmacokinet. 2005, 20, 391–414. [Google Scholar] [CrossRef] [PubMed] [Green Version]
  6. Jamroziak, K.; Balcerczak, E.; Calka, K.; Piaskowski, S.; Urbanska-Rys, H.; Salagacka, A.; Mirowski, M.; Robak, T. Polymorphisms and haplotypes in the multidrug resistance 1 gene (MDR1/ABCB1) and risk of multiple myeloma. Leuk. Res. 2009, 33, 332–335. [Google Scholar] [CrossRef] [PubMed]
  7. Hoffmeyer, S.; Burk, O.; von Richter, O.; Arnold, H.P.; Brockmöller, J.; Johne, A.; Cascorbi, I.; Gerloff, T.; Roots, I.; Eichelbaum, M.; et al. Functional polymorphisms of the human multidrug-resistance gene: Multiple sequence variations and correlation of one allele with P-glycoprotein expression and activity in vivo. Proc. Natl. Acad. Sci. USA 2000, 97, 3473–3478. [Google Scholar] [CrossRef]
  8. Drain, S.; Flannely, L.; Drake, M.B.; Kettle, P.; Orr, N.; Bjourson, A.J.; Catherwood, M.A.; Alexander, H.D. Multidrug resistance gene expression and ABCB1 SNPs in plasma cell myeloma. Leuk. Res. 2011, 35, 1457–1463. [Google Scholar] [CrossRef]
  9. Nauck, M.; Stein, U.; Von Karger, S.; März, W.; Wieland, H. Rapid detection of the C3435T polymorphism of multidrug resistance gene 1 using fluorogenic hybridization probes. Clin. Chem. 2000, 46, 1995–1997. [Google Scholar] [CrossRef] [Green Version]
  10. Rychlik-Sych, M.; Baranska, M.; Dudarewicz, M.; Skrętkowicz, J.; Żebrowska, A.; Woźniacka, A.; Owczarek, J.; Orszulak-Michalak, D.; Waszczykowska, E. Haplotypes of ABCB1 1236C > T (rs1128503), 2677G > T/A (rs2032582), and 3435C > T (rs1045642) in patients with bullous pemphigoid. Arch. Dermatol. Res. 2018, 310, 515–522. [Google Scholar] [CrossRef] [Green Version]
  11. Dessilly, G.; Panin, N.; Elens, L.; Haufroid, V.; Demoulin, J.-B. Impact of ABCB1 1236C > T-2677G > T-3435C > T polymorphisms on the anti-proliferative activity of imatinib, nilotinib, dasatinib and ponatinib. Sci. Rep. 2016, 6, 29559. [Google Scholar] [CrossRef] [Green Version]
  12. Hawley, T.S.; Riz, I.; Yang, W.; Wakabayashi, Y.; DePalma, L.; Chang, Y.-T.; Peng, W.; Zhu, J.; Hawley, R. Identification of an ABCB1 (P-glycoprotein)-positive carfilzomib-resistant myeloma subpopulation by the pluripotent stem cell fluorescent dye CDy1. Am. J. Hematol. 2013, 88, 265–272. [Google Scholar] [CrossRef] [PubMed] [Green Version]
  13. Palumbo, A.; Anderson, K. Multiple Myeloma. N. Engl. J. Med. 2011, 364, 1046–1060. [Google Scholar] [CrossRef] [PubMed] [Green Version]
  14. Nooka, A.K.; Kastritis, E.; Dimopoulos, M.; Lonial, S. Treatment options for relapsed and refractory multiple myeloma. Blood 2015, 125, 3085–3099. [Google Scholar] [CrossRef]
  15. Rajkumar, S.V.; Harousseau, J.-L.; Durie, B.; Anderson, K.C.; Dimopoulos, M.; Kyle, R.; Blade, J.; Richardson, P.; Orlowski, R.; Siegel, D.; et al. Consensus recommendations for the uniform reporting of clinical trials: Report of the International Myeloma Workshop Consensus Panel 1. Blood 2011, 117, 4691–4695. [Google Scholar] [CrossRef] [Green Version]
  16. Pérez-Galán, P.; Roué, G.; Villamor, N.; Montserrat, E.; Campo, E.; Colomer, D. The proteasome inhibitor bortezomib induces apoptosis in mantle-cell lymphoma through generation of ROS and Noxa activation independent of p53 status. Blood 2006, 107, 257–264. [Google Scholar] [CrossRef] [Green Version]
  17. Xu, D.; Cui, Q.; Xu, Y.; Chen, Z.; Xia, W.; Yang, Y.; Liu, D. Plasma enhance drug sensitivity to bortezomib by inhibition of cyp1a1 in myeloma cells. Transl. Cancer Res. 2019, 8, 2841–2847. [Google Scholar] [CrossRef]
  18. Besse, A.; Besse, A.; Stolze, S.C.; Stolze, S.C.; Rasche, L.; Rasche, L.; Weinhold, N.; Weinhold, N.; Morgan, G.; Morgan, G.; et al. Carfilzomib resistance due to ABCB1/MDR1 overexpression is overcome by nelfinavir and lopinavir in multiple myeloma. Leukemia 2017, 32, 391–401. [Google Scholar] [CrossRef] [Green Version]
  19. Rumpold, H.; Salvador, C.; Wolf, A.M.; Tilg, H.; Gastl, G.; Wolf, D. Knockdown of PgP resensitizes leukemic cells to proteasome inhibitors. Biochem. Biophys. Res. Commun. 2007, 361, 549–554. [Google Scholar] [CrossRef]
  20. Mandery, K.; Glaeser, H.; Fromm, M.F. Interaction of innovative small molecule drugs used for cancer therapy with drug transporters. Br. J. Pharmacol. 2011, 165, 345–362. [Google Scholar] [CrossRef] [Green Version]
  21. Ludwig, H.; Beksac, M.; Bladé, J.; Boccadoro, M.; Cavenagh, J.; Cavo, M.; Dimopoulos, M.; Drach, J.; Einsele, H.; Facon, T.; et al. Current Multiple Myeloma Treatment Strategies with Novel Agents: A European Perspective. Oncology 2010, 15, 6–25. [Google Scholar] [CrossRef] [PubMed]
  22. Palumbo, A.; Rajkumar, S.V. Treatment of newly diagnosed myeloma. Leukemia 2008, 23, 449–456. [Google Scholar] [CrossRef] [Green Version]
  23. Paraskevaidis, A.; Drakoulis, N.; Roots, I.; Orfanos, C.; Zouboulis, C.P.D. Polymorphisms in the Human Cytochrome P-450 1A1 Gene (CYP1A1) as a Factor for Developing Acne. Dermatology 1998, 196, 171–175. [Google Scholar] [CrossRef] [PubMed]
  24. PBoffetta, P. Biomarkers in cancer epidemiology: An integrative approach. Carcinogenesis 2009, 31, 121–126. [Google Scholar] [CrossRef] [Green Version]
  25. Zhuo, W.; Zhang, L.; Wang, Y.; Zhu, B.; Chen, Z. CYP1A1 MspI polymorphism and acute myeloid leukemia risk: Meta-analyses based on 5018 subjects. J. Exp. Clin. Cancer Res. 2012, 31, 62. [Google Scholar] [CrossRef] [PubMed] [Green Version]
  26. Guengerich, F.P.; Shimada, T. Activation of procarcinogens by human cytochrome P450 enzymes. Mutat. Res. Mol. Mech. Mutagen. 1998, 400, 201–213. [Google Scholar] [CrossRef]
  27. Xu, D.; Hu, J.; De Bruyne, E.; Menu, E.; Schots, R.; Vanderkerken, K.; Van Valckenborgh, E. Dll1/Notch activation contributes to bortezomib resistance by upregulating CYP1A1 in multiple myeloma. Biochem. Biophys. Res. Commun. 2012, 428, 518–524. [Google Scholar] [CrossRef] [PubMed]
  28. Pekol, T.; Daniels, J.S.; LaButti, J.; Parsons, I.; Nix, D.; Baronas, E.; Hsieh, F.; Gan, L.-S.; Miwa, G. Human Metabolism of the Proteasome Inhibitor Bortezomib: Identification of Circulating Metabolites. Drug Metab. Dispos. 2005, 33, 771–777. [Google Scholar] [CrossRef] [Green Version]
  29. Kumar, V.; Yadav, C.S.; Singh, S.; Goel, S.; Ahmed, R.S.; Gupta, S.; Grover, R.K.; Banerjee, B.D. CYP 1A1 polymorphism and organochlorine pesticides levels in the etiology of prostate cancer. Chemosphere 2010, 81, 464–468. [Google Scholar] [CrossRef]
  30. Kang, S.-H.; Kim, T.Y.; Kim, H.Y.; Yoon, J.-H.; Cho, H.-I.; Yoon, S.S.; Kang, D.H.; Suh, C.W.; Lee, J.H.; Lee, N.S. Protective Role of CYP1A1*2A in the Development of Multiple Myeloma. Acta Haematol. 2008, 119, 60–64. [Google Scholar] [CrossRef]
  31. Sánchez-Siles, M.; Pelegrín-Hernández, J.; Hellin-Meseguer, D.; Guerrero-Sánchez, Y.; Corno-Caparrós, A.; Cabezas-Herrera, J.; Pastor-Quirante, F.; Fernández-Ruiz, J.; Aliaga-Sánchez, A.; Lucero-Berdugo, M.; et al. Genotype of Null Polymorphisms in Genes GSTM1, GSTT1, CYP1A1, and CYP1A1*2A (rs4646903 T > C)/CYP1A1*2C (rs1048943 A > G) in Patients with Larynx Cancer in Southeast Spain. Cancers 2020, 12, 2478. [Google Scholar] [CrossRef] [PubMed]
  32. Zhang, W.-P.; He, X.-F.; Ye, X.-H. Association between the combined effects of GSTM1 present/null and CYP1A1 MspI polymorphisms with lung cancer risk: An updated meta-analysis. Biosci. Rep. 2020, 40. [Google Scholar] [CrossRef] [PubMed]
  33. Bag, A.; Jyala, N.S.; Bag, N. Cytochrome P450 1A1 genetic polymorphisms as cancer biomarkers. Indian J. Cancer 2015, 52, 479–489. [Google Scholar] [CrossRef] [PubMed]
  34. Shah, P.P.; Saurabh, K.; Pant, M.C.; Mathur, N.; Parmar, D. Evidence for increased cytochrome P450 1A1 expression in blood lymphocytes of lung cancer patients. Mutat. Res. Mol. Mech. Mutagen. 2009, 670, 74–78. [Google Scholar] [CrossRef] [PubMed]
  35. KKawajiri, K.; Nakachi, K.; Imai, K.; Watanabe, J.; Hayashi, S.-I. The CYP1A1 gene and cancer susceptibility. Crit. Rev. Oncol. 1993, 14, 77–87. [Google Scholar] [CrossRef]
  36. Zmorzyński, S.; Popek-Marciniec, S.; Styk, W.; Wojcierowska-Litwin, M.; Korszeń-Pilecka, I.; Szudy-Szczyrek, A.; Chocholska, S.; Hus, M.; Filip, A.A. The Impact of the NOD2/CARD15 Variant (3020insC) and PSMA6 Polymorphism (-8C > G) on the Development and Outcome of Multiple Myeloma. BioMed Res. Int. 2020, 2020, 1–15. [Google Scholar] [CrossRef]
  37. Palumbo, A.; Rajkumar, S.V.; Miguel, J.S.; Larocca, A.; Niesvizky, R.; Morgan, G.; Landgren, O.; Hajek, R.; Einsele, H.; Anderson, K.C.; et al. International Myeloma Working Group Consensus Statement for the Management, Treatment, and Supportive Care of Patients With Myeloma Not Eligible for Standard Autologous Stem-Cell Transplantation. J. Clin. Oncol. 2014, 32, 587–600. [Google Scholar] [CrossRef]
  38. Durie, B.G.M.; Harousseau, J.-L.; Miguel, J.S.; Bladé, J.; Barlogie, B.; Anderson, K.; Gertz, M.; Dimopoulos, M.; Westin, J.; Sonneveld, P.; et al. International uniform response criteria for multiple myeloma. Leukemia 2006, 20, 1467–1473. [Google Scholar] [CrossRef] [Green Version]
  39. Federal Drug Administration. Guidance for Industry: Clinical Trial Endpoints for the Approval of Non-Small Cell Lung Cancer Drugs and Biologics. 2018. Available online: https://www.fda.gov/media/71195/download (accessed on 14 February 2021).
  40. Turgut, S.; Turgut, G.; Atalay, E. Genotype and allele frequency of human multidrug resistance (MDR1) gene C3435T polymorphism in Denizli province of Turkey. Mol. Biol. Rep. 2006, 33, 295–300. [Google Scholar] [CrossRef]
  41. Kumar, V.; Singh, S.; Yadav, C.S.; Ahmed, R.S.; Gupta, S.; Pasha, S.T.; Tripathi, A.K.; Banerjee, B.D. CYP1A1 and CYP3A4 polymorphic variations in Delhi population of Northern India. Environ. Toxicol. Pharmacol. 2010, 29, 126–130. [Google Scholar] [CrossRef]
  42. Drakoulis, N.; Cascorbi, I.; Gross, C.R.; Roots, I. Polymorphisms in the human CYP1A1 gene as susceptibility factors for lung cancer: Exon-7 mutation (4889 A to G), and a T to C mutation in the 3?-flanking region. J. Mol. Med. 1994, 72, 240–248. [Google Scholar] [CrossRef]
  43. Ross, F.M.; Avet-Loiseau, H.; Ameye, G.; Gutiérrez, N.C.; Liebisch, P.; O’Connor, S.; Dalva, K.; Fabris, S.; Testi, A.M.; Jarosova, M.; et al. Report from the European Myeloma Network on interphase FISH in multiple myeloma and related disorders. Haematologica 2012, 97, 1272–1277. [Google Scholar] [CrossRef] [Green Version]
  44. Ahmann, G.J.; Jalal, S.M.; Juneau, A.L.; Christensen, E.R.; Hanson, C.A.; Dewald, G.W.; Greipp, P.R. A novel three-color, clone-specific fluorescence in situ hybridization procedure for monoclonal gammopathies. Cancer Genet. Cytogenet. 1998, 101, 7–11. [Google Scholar] [CrossRef]
  45. Dmoszyńska, A.; Chocholska, S. Molecular Biology Methods in the Diagnosis of Multiple Myeloma. In Molecular Aspects of Hematologic Malignancies; Springer: Berlin/Heidelberg, Germany, 2012; pp. 443–449. [Google Scholar] [CrossRef]
  46. Zmorzynski, S.; Szudy-Szczyrek, A.; Popek-Marciniec, S.; Korszen-Pilecka, I.; Wojcierowska-Litwin, M.; Luterek, M.; Chocholska, S.; Styk, W.; Swiderska-Kołacz, G.; Januszewska, J.; et al. ACE Insertion/Deletion Polymorphism (rs4646994) Is Associated with the Increased Risk of Multiple Myeloma. Front. Oncol. 2019, 9, 44. [Google Scholar] [CrossRef] [PubMed] [Green Version]
  47. Carter, A.; Hocherman, I.; Linn, S.; Cohen, Y.; Tatarsky, I. Prognostic significance of plasma cell morphology in multiple myeloma. Cancer 1987, 60, 1060–1065. [Google Scholar] [CrossRef]
  48. Preacher, K.J. Calculation for the Chi-Square Test: An Interactive Calculation Tool for Chi-Square Tests of Goodness of Fit and Independence. 2019. Available online: http://quantpsy.org/ (accessed on 30 April 2021).
  49. Ashariati, A. Polymorphism C3435T of the MDR-1 gene predict response to preoperative chemotherapy in locally advanced breast cancer with Her2/neu expression. Acta Med. Indones. 2008, 40, 187–191. [Google Scholar]
  50. Razi, B.; Sarab, G.A.; Omidkhoda, A.; Alizadeh, S. Multidrug resistance 1 (MDR1/ABCB1) gene polymorphism (rs1045642 C > T) and susceptibility to multiple myeloma: A systematic review and meta-analysis. Hematology 2018, 23, 456–462. [Google Scholar] [CrossRef] [PubMed] [Green Version]
  51. Ozdemir, S.; Uludag, A.; Silan, F.; Atik, S.Y.; Turgut, B.; Ozdemir, O. Possible roles of the xenobiotic transporter P-glycoproteins encoded by the MDR1 3435 C > T gene polymorphism in differentiated thyroid cancers. Asian Pac. J. Cancer Prev. 2013, 14, 3213–3217. [Google Scholar] [CrossRef] [PubMed] [Green Version]
  52. Drain, S.; Catherwood, M.A.; Orr, N.; Galligan, L.; Rea, I.M.; Hodkinson, C.; Drake, M.B.; Kettle, P.J.; Morris, T.C.M.; Alexander, H.D. ABCB1 (MDR1)rs1045642 is associated with increased overall survival in plasma cell myeloma. Leuk. Lymphoma 2009, 50, 566–570. [Google Scholar] [CrossRef] [PubMed]
  53. Kimchi-Sarfaty, C.; Oh, J.M.; Kim, I.-W.; Sauna, Z.E.; Calcagno, A.M.; Ambudkar, S.V.; Gottesman, M.M. A “Silent” Polymorphism in the MDR 1 Gene Changes Substrate Specificity. Science 2007, 315, 525–528. [Google Scholar] [CrossRef] [PubMed] [Green Version]
  54. Schneider, J.; Gonzalez-Roces, S.; Pollán, M.; Lucas, R.; Tejerina, A.; Martin, M.; Alba, A. Expression of LRP and MDR1 in locally advanced breast cancer predicts axillary node invasion at the time of rescue mastectomy after induction chemotherapy. Breast Cancer Res. 2001, 3, 183–191. [Google Scholar] [CrossRef] [PubMed] [Green Version]
  55. Lincz, L.F.; Kerridge, I.; Scorgie, F.E.; Bailey, M.; Enno, A.; Spencer, A. Xenobiotic gene polymorphisms and susceptibility to multiple myeloma. Haematologica 2004, 89, 628–629. [Google Scholar] [PubMed]
  56. Zhuo, W.-L.; Wang, Y.; Zhuo, X.-L.; Zhu, B.; Zhu, Y.; Chen, Z.-T. Polymorphisms of CYP1A1 and GSTM1 and laryngeal cancer risk: Evidence-based meta-analyses. J. Cancer Res. Clin. Oncol. 2009, 135, 1081–1090. [Google Scholar] [CrossRef]
  57. Shaik, A.P.; Jamil, K.; Das, P. CYP1A1 Polymorphisms and Risk of Prostate Cancer: A Meta-analysis. Urol. J. 2009, 6, 78–86. [Google Scholar] [CrossRef] [PubMed]
  58. Zhan, P.; Wang, Q.; Qian, Q.; Wei, S.-Z.; Yu, L.-K. CYP1A1 MspI and exon7 gene polymorphisms and lung cancer risk: An updated meta-analysis and review. J. Exp. Clin. Cancer Res. 2011, 30, 99. [Google Scholar] [CrossRef] [PubMed] [Green Version]
  59. Sergentanis, T.N.; Economopoulos, K.P.; Choussein, S.; Vlahos, N.F. Cytochrome P450 1A1 (CYP1A1) gene polymorphisms and cervical cancer risk: A meta-analysis. Mol. Biol. Rep. 2012, 39, 6647–6654. [Google Scholar] [CrossRef]
  60. Zhuo, W.-L.; Zhang, Y.-S.; Wang, Y.; Zhuo, X.-L.; Zhu, B.; Cai, L.; Chen, Z.-T. Association Studies of CYP1A1 and GSTM1 Polymorphisms with Esophageal Cancer Risk: Evidence-based Meta-analyses. Arch. Med. Res. 2009, 40, 169–179. [Google Scholar] [CrossRef] [PubMed]
  61. Sergentanis, T.N.; Economopoulos, K.P. Four polymorphisms in cytochrome P450 1A1 (CYP1A1) gene and breast cancer risk: A meta-analysis. Breast Cancer Res. Treat. 2009, 122, 459–469. [Google Scholar] [CrossRef] [Green Version]
  62. Zheng, Y.; Wang, J.-J.; Sun, L.; Li, H.-L. Association between CYP1A1 polymorphism and colorectal cancer risk: A meta-analysis. Mol. Biol. Rep. 2011, 39, 3533–3540. [Google Scholar] [CrossRef]
  63. Guo, R.; Guo, X. Quantitative assessment of the associations between CYP1A1 polymorphisms and gastric cancer risk. Tumor Biol. 2012, 33, 1125–1132. [Google Scholar] [CrossRef]
  64. Krishnan, S.R.; Jaiswal, R.; Brown, R.D.; Luk, F.; Bebawy, M. Multiple myeloma and persistence of drug resistance in the age of novel drugs (Review). Int. J. Oncol. 2016, 49, 33–50. [Google Scholar] [CrossRef] [PubMed] [Green Version]
  65. Nikesitch, N.; Ling, S.C.W. Molecular mechanisms in multiple myeloma drug resistance. J. Clin. Pathol. 2016, 69, 97–101. [Google Scholar] [CrossRef] [PubMed] [Green Version]
  66. Sinha, S.; Boysen, J.; Nelson, M.; Secreto, C.; Warner, S.L.; Bearss, D.; Lesnick, C.; Shanafelt, T.D.; Kay, N.E.; Ghosh, A.K. Targeted Axl Inhibition Primes Chronic Lymphocytic Leukemia B Cells to Apoptosis and Shows Synergistic/Additive Effects in Combination with BTK Inhibitors. Clin. Cancer Res. 2015, 21, 2115–2126. [Google Scholar] [CrossRef] [PubMed] [Green Version]
  67. Hoang, P.H.; Dobbins, S.E.; Cornish, A.J.; Chubb, D.; Law, P.J.; Kaiser, M. Whole-genome sequencing of multiple myeloma reveals oncogenic pathways are targeted somatically through multiple mechanisms. Leukemia 2018, 32, 2459–2470. [Google Scholar] [CrossRef] [Green Version]
  68. Mitchell, J.; Li, N.; Weinhold, N.; Försti, A.; Ali, M.; van Duin, M.; Thorleifsson, G.; Johnson, D.C.; Chen, B.; Halvarsson, B.-M.; et al. Genome-wide association study identifies multiple susceptibility loci for multiple myeloma Title. Nat. Commun. 2016, 7, 12050. [Google Scholar] [CrossRef] [PubMed]
  69. Ziv, E.; Dean, E.; Hu, D.; Martino, A.; Serie, D.; Curtin, K.; Campa, D.; Aftab, B.; Bracci, P.; Buda, G.; et al. Genome-wide association study identifies variants at 16p13 associated with survival in multiple myeloma patients. Nat. Commun. 2015, 6, 7539. [Google Scholar] [CrossRef] [Green Version]
  70. Agrawal, A.; Chou, Y.L.; Carey, C.E.; Baranger, D.A.; Zhang, B.; Sherva, R.; Wetherill, L.; Kapoor, M.; Wang, J.C.; Bertelsen, S.; et al. Genome-Wide Association Study Identifies a Novel Locus for Bortezomib-Induced Peripheral Neuropathy in European Patients with Multiple Myeloma. Clin. Cancer Res. 2016, 22, 4350–4355. [Google Scholar]
  71. Johnson, D.C.; Weinhold, N.; Mitchell, J.S.; Chen, B.; Kaiser, M.; Hillengass, J.; Bertsch, U.; Gregory, W.A.; Cairns, D.; Jackson, G.H.; et al. Genome-wide association study identifies variation at 6q25.1 associated with survival in multiple myeloma. Nat. Commun. 2016, 7, 10290. [Google Scholar] [CrossRef] [Green Version]
Figure 1. Electropherograms of ABCB1 gene 1236C > T (AC) and 2677G > T/A (DF) variants obtained by automated Sanger DNA sequencing. A-CC genotype, B-CT genotype, C-TT genotype, D-GG genotype, E-GT genotype, F-TT genotype.
Jcm 10 05276 g001
Figure 2. Electropherograms of studied polymorphisms obtained by PCR-RFLP method. (A) ABCB1 3435C > T SNP, Lane 1—Ladder (consists of 34, 67, 110, 147, 190, 242, 331, 404, 489 bp bands); Lanes 4 and 8 contain 172 bp and 60 bp bands (CC genotype); Lanes 2, 3, 5 and 6 contain 238 bp, 172 bp and 60 bp (CT genotype); Lane 7 contains 238 bp (TT genotype); (B) CYP1A1 6235T > C variant, Lane 1—Ladder (100 bp); Lanes 2–6, 8 and 10–12 contain 340 bp (wild type allele); Lane 9 shows 340 bp, 200 bp and 140 bp (heterozygote); Lane 7 shows 200 bp and 140 bp (variant allele, m1, CYP1A1*2A); (C) CYP1A1 4889A > G variant, Lane 1—Ladder (100 bp), Lanes 2–4 and 6–8 show wild type alleles; Lane 5 shows heterozygote; Lane 9 shows variant allele, m2 (CYP1A1*2C).
Jcm 10 05276 g002
Figure 3. Kaplan-Meier analysis of OS in MM patients with (a) ABCB1 1236C > T genotypes, log-rank test p = 0.63; (b) ABCB1 2677G > T/A genotypes, log-rank test p = 0.25; (c) ABCB1 3435C > T, log-rank test p = 0.03; (d) CYP1A1 4889A > G genotypes log-rank test p = 0.19; (e) CYP1A1 6235T > C genotypes, log-rank test p = 0.34.
Jcm 10 05276 g003
Figure 4. Kaplan-Meier analysis of PFS in MM patients with (a) ABCB1 1236C > T genotypes, log-rank test p = 0.44; (b) ABCB1 2677G > T/A genotypes, log-rank test p = 0.90; (c) ABCB1 3435C > T, log-rank test p = 0.63; (d) CYP1A1 4889A > G genotypes log-rank test p = 0.06; (e) CYP1A1 6235T > C genotypes, log-rank test p = 0.43.
Jcm 10 05276 g004
Figure 5. Kaplan-Meier analysis of surviving taking into account the type of treatment: (a) CT genotype of ABCB1 1236C > T (OS and treatment), log-rank test p = 0.014; (b) GT genotype of ABCB1 2677G > T/A (OS and treatment), log-rank test p = 0.013; (c) CT genotype of ABCB1 3435C > T (OS and treatment), log-rank test p = 0.005; (d) CT genotype of ABCB1 1236C > T (PFS and treatment), log-rank test p = 0.021; (e) CT genotype of ABCB1 3435C > T (PFS and treatment), log-rank test p = 0.033; (f) wt/wt genotype of CYP1A1 6235T > C (PFS and treatment), log-rank test p = 0.016; (g) wt/wt genotype of CYP1A1 4889A > G (PFS and treatment), log-rank test p = 0.021.
Jcm 10 05276 g005
Figure 6. Bortezomib in vitro study. Number of: (A) apoptotic cells with CYP1A1 4889A > G genotypes; (B) apoptotic cells with ABCB1 3435C > T genotypes; (C) viable cells with CYP1A1 4889A > G genotypes; (D) viable cells with 2677G > T/A genotypes; (E) viable cells with ABCB1 3435C > T genotypes.
Jcm 10 05276 g006
Table 1. The characteristics of MM patients included to the study.
VariablesMM Patients, n = 110
Age (years) *
Median65.36
Range42–83
Sex
Male53 (48.18%)
Female57 (51.82%)
Type of MM *
IgG60 (54.54%)
IgA27 (24.54%)
Light chain23 (20.9%)
Serum M protein (g/dL) *
Median4.96
Range1.06–8.3
Stage according to the International Staging System *
I30 (27.27%)
II33 (30%)
III47 (42.72%)
Smoking
Yes20 (18.18%)
No: Non-smokers77 (70%)
No: Ex-smokers13 (11.81%)
Serum β2-microglobulin *
≤3.5 mg/L34 (30.9%)
>3.5 mg/L33 (30%)
>5.5 mg mg/L43 (39.1%)
Hypercalcemia *
No97 (88.18%)
Yes13 (11.81%)
Renal failure *
No 86 (78.18%)
Yes24 (21.81%)
The stage of chronic kidney disease (grade) *
G131 (28.18%)
G230 (27.27%)
G3A17 (15.45%)
G3B15 (13.63%)
G48 (7.27%)
G59 (8.18%)
Anemia grade before treatment (WHO) *
Absent30 (27.27%)
I—mild36 (32.73%)
II—moderate 32 (29.09%)
III—severe12 (10.9%)
Cytogenetic changes *
del(17p13.1)11 (10%)
del(17p13.1) and t(4;14)4 (3.63%)
del(17p13.1) and t(14;16)1 (0.9%)
t(4;14)12 (10.9%)
t(14;16)1 (0.9%)
Other IgH gene rearrangement13 (11.81%)
First line treatment
CTD52 (47.27%)
VCD33 (30%)
VTD23 (20.9%)
Transplant
ASCT35 (31.81%)
Second line treatment
Rd16 (14.54%)
VCD18 (16.36%)
VD5 (4.54%)
Number of relapses
131 (28.18%)
28 (7.27%)
Follow-up (months)
Median18.5
Range2–138
Deaths
Before chemotherapy2 (1.81%)
Total35 (31.81%)
* at diagnosis, M-mean, SD—standard deviation. Abbreviations: ASCT—autologous stem cell transplant; Rd—Lenalidomide, Dexamethasone; CTD—Cyclophosphamide, Thalidomide, Dexamethasone; VCD—Bortezomib, Cyclophosphamide, Dexamethasone; VTD—Bortezomib, Thalidomide, Dexamethasone.
Table 2. Hardy-Weinberg equilibrium (HWE) for ABCB1 and CYP1A1 variants in case and control groups according to expected (E) and observed (O) values.
GroupsGenotypesHWE
p Value and χ2 *
ABCB1 gene 1236C > T
-CCCTTT-
CONTROL
E32.4949.0218.49p = 0.46, χ2 = 0.54
O305416
CASE
E43.9151.1714.91p = 0.72 χ2 = 0.12
O454916
ABCB1 gene 2677G > T/A
-GGGT + GAAA + TT + AT-
CONTROL
E29.1649.6821.16p = 0.16, χ2 = 1.93
O344026
CASE
E51.8247.3610.82p = 0.08, χ2 = 3.01
O573716
ABCB1 gene 3435C > T
-CCCTTT-
CONTROL
E19.3649.2831.36p = 0.17, χ2 = 0.67
O185230
CASE
E3054.9025.10p = 0.17, χ2 = 1.88
O256520
CYP1A1 gene 6235T > C (m1, CYP1A1*2A)
-WTWT/m1m1/m1-
CONTROL
E79.2119.581.21p = 0.07, χ2 = 3.27
O82144
CASE
E70.435.24.4p = 0.64, χ2 = 0.42
O72326
CYP1A1 gene 4889A > G (m2, CYP1A1*2C)
-WTWT/m2m2/m2-
CONTROL
E90.259.50.25p = 0.55, χ2 = 0.35
O90100
CASE
E76.9430.12.94p = 0.002, χ2 = 9.07
O82208
* if the χ2 ≤ 3.84 and the corresponding p ≥ 0.05 then the population is in HWE.
Table 3. The comparison of allele frequency and distribution of ABCB1 and CYP1A1 variants among MM patients and controls.
Gene Variants and AllelesMM
n (%)
Controls
n (%)
Odds Ratio 95% CIp Values
ABCB1 gene 1236C > T
CC45 (41%)30 (30%)1--
CT49 (44.5%)54 (54%)1.650.90–3.020.10
TT16 (14.5%)16 (16%)1.500.65–3.440.33
Total:110 (100%)100 (100%)
C139 (63%)114 (57%)1--
T81 (37%)86 (43%)1.290.87–1.910.19
Total:220 (100%)200 (100%)
ABCB1 gene 2677G > T/A
GG57 (51.7%)34 (34%)1--
GT33 (30%)36 (36%)1.820.97–3.450.06
TT14 (12.8%)24 (24%)2.871.31–6.290.007
GA4 (3.7%)4 (4%)1.670.39–7.140.74
AT1 (0.9%)2 (2%)3.350.29–38.380.67
AA1 (0.9%)0***
Total:110 (100)100 (100)
G152 (69%)108 (54%)1--
T62 (28%)86 (43%)1.951.29–2.930.001
A6 (3%)6 (3%)1.400.44–4.480.55
Total:220 (100)200 (100)
ABCB1 gene 3435C > T
CC25 (22.7%)18 (18%)1--
CT65 (59.1%)52 (52%)1.110.54–2.250.76
TT20 (18.2%)30 (30%)2.080.90–4.770.08
Total:110 (100)100 (100)
C114 (52%)88 (44%)1--
T106 (48%)112 (56%)1.360.93–2.010.10
Total:220 (100)200 (100)
CYP1A1 gene 6235T > C (m1, CYP1A1*2A)
WT/WT72 (65.5%)82 (82%)1--
WT/m132 (29.1%)14 (14%)0.380.19–0.770.006
m1/m16 (5.4%)4 (4%)0.680.15–2.150.62
Total:110 (100)100 (100)
WT176 (80%)178 (89%)1--
m144 (20%)22 (11%)0.490.28–0.850.011
Total:220 (100)200 (100)
CYP1A1 gene 4889A > G (m2, CYP1A1*2C)
WT/WT82 (74.5%)90 (90%)1--
WT/m220 (18.2%)10 (10%)0.450.20–1.030.054
m2/m28 (7.3%)0**0.011
Total:110 (100)100 (100)
WT185 (84%)190 (95%)1--
m235 (16%)10 (5%)0.270.13–0.570.0003
Total:220 (100)200 (100)
* too small group for analysis.
Table 4. Univariate Cox analysis in survival of MM patients.
VariableUnivariate Cox Analysis
for OS
Univariate Cox Analysis
for PFS
p ValueHR95% CIp ValueHR95% CI
ISS
I + II-R--R-
III0.0013.030.17–0.640.0013.120.18–0.54
Auto-HSCT
yes-R--R-
no<0.0016.052.44–14.970.0013.071.68–5.62
ABCB1 gene 1236C > T
CC-R--R-
CT + TT0.641.170.60–2.300.451.230.72–2.10
ABCB1 gene 2677G > T/A *
GG-R--R-
GT + TT0.260.680.35–1.330.911.030.60–1.76
ABCB1 gene 3435C > T
CC-R--R-
CT + TT0.040.340.12–0.960.640.860.46–1.60
CYP1A1 gene 6235T > C (m1, CYP1A1*2A)
WT/WT-R--R-
WT/m1 + m1/m10.350.730.38–1.410.440.800.46–1.39
CYP1A1 gene 4889A > G (m2, CYP1A1*2C)
WT/WT-R--R-
WT/m2 + m2/m20.200.640.32–1.270.070.600.34–1.05
R-reference; * A alleles were excluded from analysis due to low frequency (<5%).
Table 5. Multivariate Cox analysis in survival of MM patients.
VariableMultivariate Cox Analysis
for OS
Multivariate Cox Analysis
for PFS
p ValueHR95% CIp ValueHR95% CI
ISS
I + II-reference--reference-
III0.050.440.20–0.990.0030.350.18–0.70
Auto-HSCT
yes-reference--reference-
no0.023.641.27–10.500.351.430.67–3.04
ABCB1 gene 1236C > T
CC-R--R-
CT + TT0.740.860.37–2.040.951.020.50–2.05
ABCB1 gene 2677G > T/A *
GG-R--R-
GT + TT0.561.260.56–2.830.331.360.73–2.53
ABCB1 gene 3435C > T
CC-R--R-
CT + TT0.040.290.09–0.930.310.690.34–1.40
CYP1A1 gene 6235T > C (m1, CYP1A1*2A)
WT/WT-R--R-
WT/m1 + m1/m10.170.600.29–1.230.110.610.33–1.13
CYP1A1 gene 4889A > G (m2, CYP1A1*2C)
WT/WT-R--R-
WT/m2 + m2/m20.510.760.33–1.730.290.690.35–1.37
* A alleles were excluded from analysis due to low frequency (<5%).
Table 6. The clinical values of MM patients included to the study taking into account studied polymorphisms.
VariablesMM Patients1236C > T2677G > T/A3435C > T6235T > C (m1, CYP1A1*2A)4889A > G (m2, CYP1A1*2C)
CC vs. CT + TT
p-Value
GG vs. GT + TT
p-Value
CC vs. CT + TT
p-Value
WT/WT vs. WT/m1 and m1/m1
p-Value
WT/WT vs. WT/m and m2/m2
p-Value
Mean age (years) *65.360.110.670.690.700.26
Free light chain ratio *292.640.150.210.170.89<0.001
% of plasma cells in bone marrow *30.850.160.100.780.240.37
Albumins (g/dL) *3.580.880.570.760.710.31
β2-microglobulin * (mg/L)6.180.530.180.710.630.03
Calcium * (mM/L)2.430.220.830.370.190.64
Hemoglobin * (g/dL)10.580.890.620.450.940.31
Creatinine * (mg/dL)1.660.440.610.770.44<0.001
Platelets (K/μL)210.640.540.830.320.010.26
C-reactive protein * (mg/L)15.160.960.600.630.880.08
Estimated glomerular filtration rate * mL/min/1.73 m260.310.500.560.090.200.87
* at diagnosis.
Publisher’s Note: MDPI stays neutral with regard to jurisdictional claims in published maps and institutional affiliations.

