
Serum Uric Acid Is a Weak Independent Predictor of Overall Survival in Older Adults

 ,
,  , ,
, , 
Abstract
:1. Introduction
2. Patients and Methods
2.1. Study Population
2.2. Data Analysis
2.3. Statistical Analysis
3. Results
3.1. Baseline Patient’s Characteristics
3.2. Outcome Data
3.3. Non-Parametric Estimation of Hazard Ratio Curves
4. Discussion
5. Conclusions
Author Contributions
Funding
Institutional Review Board Statement
Informed Consent Statement
Data Availability Statement
Conflicts of Interest
References
- Zitt, E.; Fischer, A.; Lhotta, K.; Concin, H.; Nagel, G. Sex- and age-specific variations, temporal trends and metabolic determinants of serum uric acid concentrations in a large population-based Austrian cohort. Sci. Rep. 2020, 10, 1–8. [Google Scholar] [CrossRef]
- Smith, E.; March, L. Global prevalence of hyperuricemia: A systematic review of population-based epidemiological studies. Arthritis Rheumatol. 2015, 67, 2690–2692. [Google Scholar]
- Maruhashi, T.; Hisatome, I.; Kihara, Y.; Higashi, Y. Hyperuricemia and endothelial function: From molecular background to clinical perspectives. Atherosclerosis 2018, 278, 226–231. [Google Scholar] [CrossRef] [Green Version]
- Kuwabara, M. Hyperuricemia, cardiovascular disease, and hypertension. Pulse 2016, 3, 242–252. [Google Scholar] [CrossRef] [Green Version]
- Ndrepepa, G.; Braun, S.; Haase, H.-U.; Schulz, S.; Ranftl, S.; Hadamitzky, M.; Mehilli, J.; Schömig, A.; Kastrati, A.; Schulz-Schüpke, S. Prognostic value of uric acid in patients with acute coronary syndromes. Am. J. Cardiol. 2012, 109, 1260–1265. [Google Scholar] [CrossRef]
- Wang, J.-G.; Staessen, J.A.; Fagard, R.H.; Birkenhäger, W.H.; Gong, L.; Liu, L. Prognostic significance of serum creatinine and uric acid in older chinese patients with isolated systolic hypertension. Hypertension 2001, 37, 1069–1074. [Google Scholar] [CrossRef] [Green Version]
- Okura, T.; Higaki, J.; Kurata, M.; Irita, J.; Miyoshi, K.-I.; Yamazaki, T.; Hayashi, D.; Kohro, T.; Nagai, R. The JCAD Study Investigators elevated serum uric acid is an independent predictor for cardiovascular events in patients with severe coronary artery stenosis: Subanalysis of the Japanese Coronary Artery Disease (JCAD) study. Circ. J. 2009, 73, 885–891. [Google Scholar] [CrossRef] [PubMed] [Green Version]
- Liu, C.W.; Chen, J.H.; Tseng, G.S.; Chen, K.H.; Hwang, J.J.; Yang, W.S.; Wu, Y.W. Association between low-grade inflammation and left ventricular diastolic dysfunction in patients with metabolic syndrome and hyperuricemia. Acta. Cardiol. Sin. 2020, 36, 483–492. [Google Scholar] [PubMed]
- Liu, C.W.; Chang, W.C.; Pan, R.H. P282 elevated serum uric acid associated with both electrocardiographic and echocardiographic left ventricular hypertrophy independent of blood pressure in healthy individuals. Eur. Heart J. 2020, 41, ehz872-102. [Google Scholar] [CrossRef]
- Odden, M.C.; Amadu, A.-R.; Smit, E.; Lo, L.; Peralta, C.A. Uric acid levels, kidney function, and cardiovascular mortality in US adults: National Health and Nutrition Examination Survey (NHANES) 1988–1994 and 1999–2002. Am. J. Kidney Dis. 2014, 64, 550–557. [Google Scholar] [CrossRef] [PubMed] [Green Version]
- Verdecchia, P.; Schillaci, G.; Reboldi, G.; Santeusanio, F.; Porcellati, C.; Brunetti, P. Relation between serum uric acid and risk of cardiovascular disease in essential hypertension. The PIUMA study. Hypertension 2000, 36, 1072–1078. [Google Scholar] [CrossRef]
- Winder, M.; Owczarek, A.J.; Mossakowska, M.; Broczek, K.; Grodzicki, T.; Wierucki, Ł.; Chudek, J. Prevalence of hyperuricemia and the use of allopurinol in older poles-results from a population-based PolSenior study. Int. J. Environ. Res. Public Health 2021, 18, 387. [Google Scholar] [CrossRef] [PubMed]
- Maiuolo, J.; Oppedisano, F.; Gratteri, S.; Muscoli, C.; Mollace, V. Regulation of uric acid metabolism and excretion. Int. J. Cardiol. 2016, 213, 8–14. [Google Scholar] [CrossRef] [PubMed] [Green Version]
- Dalbeth, N.; Merriman, T.R.; Stamp, L.K. Gout. Lancet 2016, 388, 2039–2052. [Google Scholar] [CrossRef]
- Benn, C.L.; Dua, P.; Gurrell, R.; Loudon, P.; Pike, A.; Storer, R.I.; Vangjeli, C. Physiology of hyperuricemia and urate-lowering treatments. Front. Med. 2018, 5, 160. [Google Scholar] [CrossRef] [PubMed] [Green Version]
- Butler, F.; Alghubayshi, A.; Roman, Y. The epidemiology and genetics of hyperuricemia and gout across major racial groups: A literature review and population genetics secondary database analysis. J. Pers. Med. 2021, 11, 231. [Google Scholar] [CrossRef]
- Piani, F.; Cicero, A.F.G.; Borghi, C. Uric acid and hypertension: Prognostic role and guide for treatment. J. Clin. Med. 2021, 10, 448. [Google Scholar] [CrossRef]
- Kuhns, V.L.H.; Woodward, O.M. Sex differences in urate handling. Int. J. Mol. Sci. 2020, 21, 4269. [Google Scholar] [CrossRef]
- Winder, M.; Chudek, J. Prevalence and factors of hyperuricemia in older adults. Gerontol. Pol. 2020, 28, 38–44. [Google Scholar]
- Hay, C.A.; Prior, J.A.; Belcher, J.; Mallen, C.D.; Roddy, E. Mortality in patients with gout treated with allopurinol: A systematic review and meta-analysis. Arthritis Care Res. 2020, 73, 1049–1054. [Google Scholar] [CrossRef] [Green Version]
- Kaya, M.G.; Uyarel, H.; Akpek, M.; Kalay, N.; Ergelen, M.; Ayhan, E.; Isik, T.; Cicek, G.; Elcik, D.; Sahin, O.; et al. Prognostic value of uric acid in patients with ST-elevated myocardial infarction undergoing primary coronary intervention. Am. J. Cardiol. 2012, 109, 486–491. [Google Scholar] [CrossRef]
- Levantesi, G.; Marfisi, R.M.; Franzosi, M.G.; Maggioni, A.P.; Nicolosi, G.L.; Schweiger, C.; Silletta, M.G.; Tavazzi, L.; Tognoni, G.; Marchioli, R. Uric acid: A cardiovascular risk factor in patients with recent myocardial infarction. Int. J. Cardiol. 2013, 167, 262–269. [Google Scholar] [CrossRef] [PubMed]
- Mandurino-Mirizzi, A.; Cornara, S.; Somaschini, A.; Demarchi, A.; Galazzi, M.; Puccio, S.; Montalto, C.; Crimi, G.; Ferlini, M.; Camporotondo, R.; et al. Elevated serum uric acid is associated with a greater inflammatory response and with short- and long-term mortality in patients with ST-segment elevation myocardial infarction undergoing primary percutaneous coronary intervention. Nutr. Metab. Cardiovasc. Dis. 2021, 31, 608–614. [Google Scholar] [CrossRef]
- Culleton, B.F.; Larson, M.G.; Kannel, W.B.; Levy, D. Serum uric acid and risk for cardiovascular disease and death: The Framingham Heart Study. Ann. Intern. Med. 1999, 131, 7–13. [Google Scholar] [CrossRef] [PubMed]
- Krishnan, E. Reduced glomerular function and prevalence of gout: NHANES 2009-10. PLoS ONE 2012, 7, e50046. [Google Scholar] [CrossRef] [PubMed] [Green Version]
- Hwang, S.-J.; Lin, M.-Y.; Chen, H.-C.; Hwang, S.-C.; Yang, W.-C.; Hsu, C.-C.; Chiu, H.-C.; Mau, L.-W. Increased risk of mortality in the elderly population with late-stage chronic kidney disease: A cohort study in Taiwan. Nephrol. Dial. Transplant. 2008, 23, 3192–3198. [Google Scholar] [CrossRef] [PubMed] [Green Version]
- GBD 2015 Mortality and Causes of Death Collaborators. Global, regional, and national life expectancy, all-cause mortality, and cause-specific mortality for 249 causes of death, 1980–2015: A systematic analysis for the Global Burden of Disease Study 2015 [published correction appears in Lancet. 2017; 389 (10064): e1]. Lancet 2016, 388, 1459–1544. [Google Scholar]
- Ju, S.Y.; Lee, J.Y.; Kim, D.H. Association of metabolic syndrome and its components with all-cause and cardiovascular mortality in the elderly: A meta-analysis of prospective cohort studies. Medicine 2017, 96, e8491. [Google Scholar] [CrossRef]
- Facchini, F.; Chen, Y.D.; Hollenbeck, C.B.; Reaven, G.M. Relationship between resistance to insulin-mediated glucose uptake, urinary uric acid clearance, and plasma uric acid concentration. JAMA 1991, 266, 3008–3011. [Google Scholar] [CrossRef]
- King, C.; Lanaspa, M.A.; Jensen, T.; Tolan, D.R.; Sánchez-Lozada, L.G.; Johnson, R.J. Uric acid as a cause of the metabolic syndrome. Contrib. Nephrol. 2018, 192, 88–102. [Google Scholar]
- Bledowski, P.; Mossakowska, M.; Chudek, J.; Grodzicki, T.; Milewicz, A.; Szybalska, A.; Wieczorowska-Tobis, K.; Wiecek, A.; Bartoszek, A.; Dabrowski, A.; et al. Medical, psychological and socioeconomic aspects of aging in Poland: Assumptions and objectives of the PolSenior project. Exp. Gerontol. 2011, 46, 1003–1009. [Google Scholar] [CrossRef]
- Brucato, A.; Cianci, F.; Carnovale, C. Management of hyperuricemia in asymptomatic patients: A critical appraisal. Eur. J. Intern. Med. 2020, 74, 8–17. [Google Scholar] [CrossRef]
- Chen, Q.; Wang, Z.; Zhou, J.; Chen, Z.; Li, Y.; Li, S.; Zhao, H.; Badve, S.V.; Lv, J. Effect of urate-lowering therapy on cardiovascular and kidney outcomes: A systematic review and meta-analysis. Clin. J. Am. Soc. Nephrol. 2020, 15, 1576–1586. [Google Scholar] [CrossRef]
- Johnson, R.J.; Nakagawa, T.; Jalal, D.; Sánchez-Lozada, L.G.; Kang, D.H.; Ritz, E. Uric acid and chronic kidney disease: Which is chasing which? Nephrol. Dial. Transplant. 2013, 28, 2221–2228. [Google Scholar] [CrossRef] [PubMed] [Green Version]
- Piani, F.; Johnson, R.J. Does gouty nephropathy exist, and is it more common than we think? Kidney Int. 2021, 99, 31–33. [Google Scholar] [CrossRef] [PubMed]
- Foley, R.J.; Weinman, E.J. Urate nephropathy. Am. J. Med. Sci. 1984, 288, 208–211. [Google Scholar] [CrossRef] [PubMed]
- Moe, O.W. Posing the question again: Does chronic uric acid nephropathy exist? J. Am. Soc. Nephrol. 2010, 21, 395–397. [Google Scholar] [CrossRef] [PubMed]
- Owczarek, A.J.; Choręza, P.; Arabzada, H.; Chudek, J.; Wojnicz, R. Kidney function, nutritional status, and the left ventricle dysfunction are associated with serum uric acid levels in patients with heart failure with reduced ejection fraction. Ann. Clin. Lab. Sci. 2018, 48, 608–613. [Google Scholar] [PubMed]
- Jørgensen, P.; Langhammer, A.; Krokstad, S.; Forsmo, S. Mortality in persons with undetected and diagnosed hypertension, type 2 diabetes, and hypothyroidism, compared with persons without corresponding disease—A prospective cohort study; The HUNT Study, Norway. BMC Fam. Pract. 2017, 18, 98. [Google Scholar] [CrossRef] [Green Version]
- Shah, K.S.; Xu, H.; Matsouaka, R.A.; Bhatt, D.L.; Heidenreich, P.A.; Hernandez, A.F.; Devore, A.D.; Yancy, C.W.; Fonarow, G.C. Heart failure with preserved, borderline, and reduced ejection fraction: 5-year outcomes. J. Am. Coll. Cardiol. 2017, 70, 2476–2486. [Google Scholar] [CrossRef]
- Kamei, K.; Konta, T.; Ichikawa, K.; Sato, H.; Suzuki, N.; Kabasawa, A.; Suzuki, K.; Hirayama, A.; Shibata, Y.; Watanabe, T.; et al. Serum uric acid levels and mortality in the Japanese population: The Yamagata (Takahata) study. Clin. Exp. Nephrol. 2016, 20, 904–909. [Google Scholar] [CrossRef] [PubMed]
- Tseng, W.-C.; Chen, Y.-T.; Ou, S.-M.; Shih, C.-J.; Tarng, D.-C. Taiwan Geriatric Kidney Disease (TGKD) Research Group. U-Shaped association between serum uric acid levels with cardiovascular and all-cause mortality in the elderly: The role of malnourishment. J. Am. Heart Assoc. 2018, 7, e007523. [Google Scholar] [CrossRef] [PubMed] [Green Version]
- Browne, L.D.; Jaouimaa, F.-Z.; Walsh, C.; Perez-Ruiz, F.; Richette, P.; Burke, K.; Stack, A.G. Serum uric acid and mortality thresholds among men and women in the Irish health system: A cohort study. Eur. J. Intern. Med. 2021, 84, 46–55. [Google Scholar] [CrossRef] [PubMed]
- Sakata, K.; Hashimoto, T.; Ueshima, H.; Okayama, A. NIPPON DATA 80 Research Group. Absence of an association between serum uric acid and mortality from cardiovascular disease: NIPPON DATA 80, 1980–1994. National integrated projects for prospective observation of non-communicable diseases and its trend in the Aged. Eur. J. Epidemiol. 2001, 17, 461–468. [Google Scholar]
- Levy, G.D.; Rashid, N.; Niu, F.; Cheetham, T.C. Effect of urate-lowering therapies on renal disease progression in patients with hyperuricemia. J. Rheumatol. 2014, 41, 955–962. [Google Scholar] [CrossRef]
- Li, Q.; Li, X.; Wang, J.; Liu, H.; Kwong, J.S.; Chen, H.; Li, L.; Chung, S.C.; Shah, A.; Chen, Y.; et al. Diagnosis and treatment for hyperuricemia and gout: A systematic review of clinical practice guidelines and consensus statements. BMJ Open 2019, 9, e026677. [Google Scholar] [CrossRef] [Green Version]
- Desideri, G.; Castaldo, G.; Lombardi, A.; Mussap, M.; Testa, A.; Pontremoli, R.; Punzi, L.; Borghi, C. Is it time to revise the normal range of serum uric acid levels? Eur. Rev. Med. Pharmacol. Sci. 2014, 18, 1295–1306. [Google Scholar]


| (A) | |||||||
|---|---|---|---|---|---|---|---|
| SUA Level (mg/dL) | <4 | <4;5) | <5;6) | <6;7) | <7;8) | ≥8 | p |
| N (%) | 196 (9.6) | 493 (24.2) | 565 (27.7) | 399 (19.6) | 228 (11.2) | 157 (7.7) | – |
| Death, N (%) | 126 (64.3) | 302 (61.3) | 340 (60.2) | 247 (61.9) | 159 (69.7) * | 118 (75.2) # | <0.01 |
| Age (years) | 80 ± 9 | 79 ± 9 | 79 ± 9 | 78 ± 8 | 80 ± 9 | 81 ± 8 * | <0.05 |
| SUA (mg/dL) | 3.63 (3.29–3.81) | 4.57 (4.29–4.76) | 5.49 (5.22–5.72) | 6.44 (6.19–6.73) | 7.43 (7.21–7.70) | 8.87 (8.24–9.69) | – |
| Smoking, N (%) | 134 (68.4) | 324 (65.7) | 378 (66.9) | 275 (68.9) | 152 (66.7) | 107 (68.2) | 0.94 |
| Alcohol consumption, N (%) | 57 (29.5) # | 119 (24.5) * | 108 (19.3) | 96 (24.3) | 50 (22.1) | 28 (18.2) | <0.05 |
| BMI (kg/m2) | 25.9 ± 4.7 # | 26.0 ± 4.1 # | 27.4 ± 4.3 | 28.2 ± 4.2 * | 28.6 ± 4.4 ** | 28.5 ± 4.7 * | <0.001 |
| BMI > (30 kg/m2), N (%) | 34 (18.7) * | 70 (14.9) # | 138 (25.0) | 113 (29.6) | 79 (36.7) ** | 50 (33.1) | <0.001 |
| Diabetes, N (%) | 43 (21.9) | 107 (21.7) | 103 (18.3) | 77 (19.4) | 58 (25.6) | 35 (22.3) | 0.27 |
| SBP (mm/Hg) | 143 ± 21 | 144 ± 21 | 146 ± 21 | 145 ± 22 | 143 ± 24 | 142 ± 25 | 0.32 |
| DBP (mmHg) | 79 ± 11 * | 81 ± 11 | 82 ± 11 | 82 ± 11 | 81 ± 12 | 80 ± 12 | <0.05 |
| Hypertension, N (%) | 120 (61.2) * | 303 (61.8) # | 394 (70.1) | 290 (72.9) | 167 (73.6) | 122 (77.7) * | <0.001 |
| Past stroke, N (%) | 16 (8.2) | 44 (8.9) | 47 (8.4) | 40 (10.1) | 23 (10.1) | 18 (11.5) | 0.81 |
| Coronary artery disease, N (%) | 35 (17.9) | 77 (15.6) # | 126 (22.3) | 107 (26.8) | 71 (31.1) ** | 54 (34.4) ** | <0.001 |
| Past myocardial infarction, N (%) | 8 (4.1) | 17 (3.4) | 32 (5.7) | 31 (7.8) | 19 (8.3) | 11 (7.0) | <0.05 |
| Heart failure, N (%) | 7 (3.7) | 18 (3.8) | 32 (5.8) | 20 (5.1) | 25 (11.2) ** | 30 (19.6) # | <0.001 |
| Atrial fibrillation, N (%) | 23 (12.2) | 63 (13.3) | 96 (18.0) | 55 (14.7) | 53 (25.4) * | 37 (25.7) | <0.001 |
| Cholesterol (mg/dL) | 184.1 ± 41.8 ** | 191.7 ± 42.5 | 195.9 ± 43.5 | 195.7 ± 44.2 | 187.6 ± 44.7 | 196.4 ± 49.8 | <0.01 |
| Hypercholesterolemia, N (%) | 108 (55.1) # | 310 (62.9) * | 390 (69.0) | 299 (74.9) * | 142 (62.3) | 113 (72.0) | <0.001 |
| Triglycerides (mg/dL) | 90.1 # (69.0–116.1) | 92.5 # (73.7–123.7) | 104.6 (82.0–141.4) | 117.8 ** (90.7–153.9) | 108.8 (80.4–143.0) | 131.7 # (102.3–172.1) | <0.001 |
| Hypertriglyceridemia, N (%) | 14 (7.1) # | 71 (14.4) * | 114 (20.2) | 114 (28.6) ** | 50 (21.9) | 60 (38.2) # | <0.001 |
| eGFR (mL/min/1.73 m2) full | 81.7 ± 16.5 # | 75.2 ± 15.8 # | 69.3 ± 15.4 | 64.3 ± 15.5 # | 57.5 ± 16.8 # | 48.9 ± 17.5 # | <0.001 |
| eGFR < 45 mL/min/1.73 m2, N (%) | 2 (1.0) # | 8 (1.6) # | 25 (4.4) | 44 (11.0) # | 53 (23.2) # | 67 (43.2) # | <0.001 |
| ACR (mg/g) | 5.0 (2.1–16.4) | 5.4 (1.8–16.0) | 4.2 (1.8–17.2) | 4.0 (1.5–12.1) | 5.1 (1.9–23.8) | 7.5 * (2.3–32.2) | <0.05 |
| ACR ≥ 30 mg/g, N (%) | 26 (14.4) | 78 (17.0) | 86 (15.9) | 46 (12.4) | 47 (22.0) | 37 (25.2) * | <0.01 |
| COPD/Asthma, N (%) | 37 (19.1) | 81 (16.5) | 102 (18.1) | 87 (21.9) | 55 (24.3) | 38 (24.4) | 0.06 |
| hs-CRP (mg/dL) | 1.6 (0.8–4.1) | 1.8 (0.8–4.1) | 2.1 (1.0–4.5) | 2.5 (1.3–5.5) | 3.3 # (1.6–6.0) | 2.9 # (1.7–6.7) | <0.001 |
| CRP > 3 mg/dL, N (%) | 65 (33.5) | 178 (36.2) | 207 (36.8) | 176 (44.4) * | 121 (53.8) # | 75 (48.1) * | <0.001 |
| ADL ≤ 4 pts, N (%) | 26 (13.3) ** | 52 (10.6) * | 40 (7.1) | 31 (7.8) | 33 (14.5) ** | 21 (13.5) * | <0.01 |
| MNA 8-11 pts (at risk), N (%) | 79 (44.9) | 176 (38.7) | 209 (38.8) | 118 (32.0) | 79 (37.6) | 56 (38.4) | <0.05 |
| MNA ≤ 7 pts (malnourished), N (%) | 20 (11.4) | 44 (9.7) | 36 (6.7) | 27 (7.3) | 17 (8.1) | 14 (9.6) | |
| MetS, N (%) | 66 (34.2) ** | 168 (34.4) # | 264 (47.1) | 223 (56.3) ** | 132 (58.1) ** | 110 (70.5) # | <0.001 |
| Aspirin, N (%) | 66 (33.7) | 146 (29.6) | 170 (30.1) | 155 (38.8) ** | 102 (44.7) # | 60 (38.2) * | <0.001 |
| Hydrochlorothiazide, N (%) | 2 (1.0) | 15 (3.0) | 24 (4.3) | 18 (4.5) | 30 (13.2) # | 18 (11.5) # | <0.001 |
| Thiazide-like diuretics, N (%) | 9 (4.6) * | 28 (5.7)** | 58 (10.3) | 68 (17.0) ** | 46 (20.2) # | 41 (26.1) # | <0.001 |
| Loop diuretics, N (%) | 5 (2.6) | 18 (3.7) | 30 (5.3) | 32 (8.0) | 40 (17.5) # | 53 (33.8) # | <0.001 |
| Spironolactone, N (%) | 12 (6.1) | 33 (6.7) | 53 (9.4) | 41 (10.3) | 40 (17.5) ** | 38 (24.2) # | <0.001 |
| Diuretics, N (%) | 22 (11.2) # | 73 (14.8) # | 131 (23.2) | 130 (32.6) ** | 121 (53.1) # | 108 (68.8) # | <0.001 |
| Statins, N (%) | 39 (19.9) | 83 (16.8) * | 128 (22.7) | 111 (27.8) | 59 (25.9) | 43 (27.4) | <0.01 |
| Fibrates, N (%) | 1 (0.5) | 8 (1.6) | 2 (0.3) | 7 (1.7) | 2 (0.9) | 1 (0.6) | 0.21 |
| Non-dihydropyridine calcium channel blockers, N (%) | 5 (2.6) | 23 (4.7) | 24 (4.2) | 21 (5.3) | 9 (3.9) | 10 (6.4) | 0.58 |
| Losartan, N (%) | 10 (13.9) | 8 (1.6) | 19 (3.4) | 17 (4.3) | 10 (4.3) | 8 (5.1) | 0.11 |
| Metformin, N (%) | 6 (3.1) | 9 (1.8) | 23 (4.1) | 18 (4.5) | 8 (3.5) | 6 (3.8) | 0.30 |
| (B) | |||||||
| SUA Level | <4 | <4;5) | <5;6) | <6;7) | <7;8) | ≥8 | p |
| N (%) | 386 (20.5) | 544 (28.8) | 445 (23.6) | 272 (14.4) | 142 (7.5) | 99 (5.2) | – |
| Death, N (%) | 188 (48.7) | 243 (44.7) | 194 (43.6) | 137 (50.4) | 90 (63.4) # | 70 (70.7) # | <0.001 |
| Age (years) | 78 ± 9 | 78 ± 9 | 78 ± 8 | 79 ± 9 | 81 ± 9 ** | 84 ± 8 # | <0.001 |
| SUA (mg/dL) | 3.48 (3.11–3.72) | 4.52 (4.29–4.76) | 5.44 (5.23–5.69) | 6.43 (6.19–6.63) | 7.37 (7.16–7.61) | 8.62 (8.23–9.50) | – |
| Smoking, N (%) | 63 (16.3) | 109 (20.0) | 83 (18.7) | 57 (21.0) | 22 (15.5) | 14 (14.1) | 0.38 |
| Alcohol consumption, N (%) | 186 (48.8) | 263 (49.6) | 225 (51.5) | 133 (50.8) | 73 (52.1) | 56 (56.6) | 0.78 |
| BMI (kg/m2) | 26.3 ± 4.9 # | 28.3 ± 4.9 # | 29.8 ± 5.1 | 31 ± 5.6 * | 30.9 ± 6.1 | 30.4 ± 6.2 | <0.001 |
| BMI (kg/m2) > 30, N (%) | 79 (22.6) # | 176 (34.2) ** | 185 (43.5) | 141 (55.3) ** | 68 (51.9) | 45 (49.5) | <0.001 |
| Diabetes, N (%) | 75 (19.4) | 102 (18.8) | 99 (22.2) | 91 (33.6) ** | 51 (35.9) ** | 40 (40.4) # | <0.001 |
| SBP (mm/Hg) | 144 ± 22 | 146 ± 22 | 146 ± 21 | 146 ± 22 | 126 | 142 ± 25 | 0.29 |
| DBP (mmHg) | 83 ± 11 * | 85 ± 11 | 85 ± 11 | 86 ± 11 | 87 ± 11 | 84 ± 12 | <0.05 |
| Hypertension, N (%) | 258 (67.4) # | 425 (78.1) | 353 (80) | 224 (82.7) | 126 (89.4) * | 80 (80.8) | <0.001 |
| Past stroke, N (%) | 25 (6.5) | 33 (6.1) | 33 (7.4) | 18 (6.6) | 19 (13.4) * | 14 (14.3) * | <0.01 |
| Coronary artery disease, N (%) | 56 (14.5) * | 81 (14.9) * | 92 (20.7) | 61 (22.4) | 44 (31.0) * | 30 (30.3) * | <0.001 |
| Past myocardial infarction, N (%) | 8 (2.1) | 16 (2.9) | 8 (1.8) | 8 (2.9) | 8 (5.6) | 8 (8.1) | <0.01 |
| Heart failure, N (%) | 14 (3.7) | 19 (3.6) | 19 (4.4) | 14 (5.2) | 16 (11.7) ** | 18 (18.9) # | <0.001 |
| Atrial fibrillation, N (%) | 62 (17.0) | 88 (17.2) | 83 (20.0) | 56 (21.5) | 37 (28.9) | 24 (27.3) | <0.05 |
| Cholesterol (mg/dL] | 209.3 ± 44.1 | 211.8 ± 44.8 | 212.8 ± 44.3 | 211.2 ± 51.9 | 201 ± 47.3 | 206.6 ± 55.2 | 0.13 |
| Hypercholesterolemia, N (%) | 299 (77.5) | 451 (82.9) | 378 (84.9) | 216 (79.4) | 110 (77.5) | 80 (80.8) | 0.06 |
| Triglycerides (mg/dL) | 98.6 # (80.3–127.5) | 116.3 ** (89.2–148.9) | 126.6 (100.0–162.3) | 136.7 * (106.5–177.4) | 142.9 # (111.3–194.1) | 142.1 # (119.5–193.0) | <0.001 |
| Hypertriglyceridemia, N (%) | 66 (17.1) # | 139 (25.6) ** | 152 (34.2) | 111 (40.8) | 68 (47.9) * | 44 (44.4) * | <0.001 |
| eGFR (mL/min/1.73 m2) | 75.1 ± 16.5 # | 68.4 ± 14.8 # | 63.2 ± 14.1 | 56.4 ± 15.8 # | 48.9 ± 15.3 # | 39.6 ± 14.1 # | <0.001 |
| eGFR < 45 mL/min/1.73 m2, N (%) | 6 (1.6) # | 19 (3.5) # | 40 (9.0) | 64 (23.6) # | 58 (41.4) # | 70 (71.4) # | <0.001 |
| ACR (mg/g) | 6.2 (2.3–15.9) | 5.7 (2.3–14.8) | 5.3 (2.2–15.6) | 5.2 (2.2–16.6) | 5.7 (2.5–21.4) | 7.9 (2.6–38.1) | 0.24 |
| ACR ≥ 30 mg/g, N (%) | 50 (14.5) | 71 (14.4) | 59 (14.1) | 36 (14.2) | 28 (21.5) | 25 (27.5) ** | <0.01 |
| COPD/Astma, N (%) | 60 (15.5) | 76 (14) | 70 (15.8) | 49 (18.1) | 22 (15.5) | 26 (26.3) | 0.07 |
| hs-CRP (mg/dL) | 2.0 * (0.9–3.9) | 2.1 (1.1–4.3) | 2.5 (1.3–4.5) | 3.3 # (1.7–7.1) | 3.7 # (1.7–6.7) | 3.6 ** (1.7–7.9) | <0.001 |
| hs-CRP > 3 mg/dL, N (%) | 133 (34.5) | 196 (36.2) | 177 (40.0) | 151 (56.1) # | 79 (55.6) # | 55 (56.7) ** | <0.001 |
| ADL ≤ 4 pts, N (%) | 60 (15.6) ** | 55 (10.2) | 40 (9.0) | 38 (14.0) * | 26 (18.3) ** | 22 (22.4) # | <0.001 |
| MNA 8–11 pts, N (%) | 165 (48.4) | 226 (45) | 183 (43.9) | 110 (43.5) | 63 (49.2) | 47 (54.0) | <0.001 |
| MNA ≤ 7 pts, N (%) | 72 (21.1) | 66 (13.1) | 45 (10.8) | 29 (11.5) | 16 (12.5) | 16 (18.4) | |
| MetS, N (%) | 160 (42.1) # | 307 (56.6) ** | 289 (65.7) | 207 (76.4) ** | 116 (82.3) # | 78 (79.6) ** | <0.001 |
| Aspirin, N (%) | 109 (28.2) * | 176 (32.4) | 159 (35.7) | 83 (30.5) | 54 (38.0) | 43 (43.4) | <0.05 |
| Hydrochlorothiazide, N (%) | 9 (2.3) # | 29 (5.3) | 34 (7.6) | 26 (9.6) | 29 (12.7) # | 15 (15.2) * | <0.001 |
| Thiazide-like diuretics, N (%) | 31 (8.0) # | 90 (14.7) | 95 (21.3) | 81 (29.8) * | 45 (31.7) # | 26 (26.3) | <0.001 |
| Loop diuretics, N (%) | 9 (2.3) ** | 23 (4.2) | 31 (7.0) | 36 (13.2) ** | 29 (20.4) # | 44 (44.4) # | <0.001 |
| Spironolactone, N (%) | 21 (5.4) ** | 52 (9.6) | 50 (11.2) | 51 (18.8) ** | 29 (20.4) ** | 33 (33.3) # | <0.001 |
| Diuretics, N (%) | 62 (16.1) # | 151 (27.8) # | 174 (39.1) | 152 (55.9) # | 97 (68.3) # | 83 (83.8) # | <0.001 |
| Statins, N (%) | 71 (18.4) ** | 136 (25.0) | 122 (27.4) | 70 (25.7) | 46 (32.4) | 27 (27.3) | <0.05 |
| Fibrates, N (%) | 9 (2.3) | 7 (1.3) | 3 (0.7) | 2 (0.7) | 1 (0.7) | 0 | 0.19 |
| Non-dihydropyridine calcium channel blockers, N (%) | 16 (4.1) | 34 (6.2) | 19 (4.3) | 14 (5.1) | 11 (7.7) | 3 (3.0) | 0.33 |
| Losartan, N (%) | 19 (4.9) | 32 (5.9) | 32 (7.2) | 21 (7.7) | 6 (4.2) | 3 (3.0) | 0.34 |
| Metformin, N (%) | 14 (3.6) | 17 (3.1) | 26 (5.8) | 25 (9.2) | 12 (8.4) | 7 (7.1) | <0.01 |
| Men | Women | |||
|---|---|---|---|---|
| Factor | HR | ±95% CI | HR | ±95% CI |
| SUA (mg/dL) | 1.05 * | 1.01–1.09 | 1.12 # | 1.07–1.17 |
| Age (per 10 years) | 2.49 # | 2.32–2.67 | 3.44 # | 3.16–3.74 |
| Smoking | 1.13 | 0.99–1.27 | 1.55 # | 1.30–1.89 |
| Past stroke | 1.81 # | 1.52–2.15 | 1.89 # | 1.52–2.33 |
| Heart failure | 3.43 # | 2.82–4.16 | 4.24 # | 3.37–5.32 |
| COPD/Asthma | 1.63 # | 1.19–1.56 | 1.11 | 0.93–1.32 |
| Diabetes | 1.08 | 0.95–1.24 | 1.20 * | 1.03–1.39 |
| hs-CRP > 3 mg/dL | 1.87 # | 1.68–2.09 | 1.30 # | 1.14–1.48 |
| eGFR < 45 mL/min/1.73 m2 | 2.06 # | 1.74–2.43 | 2.54 # | 2.16–2.99 |
| ADL ≤ 4 pts | 4.25 # | 3.63–4.97 | 5.41 # | 4.62–6.32 |
| MNA ≤ 7 pts | 2.56 # | 2.14–3.06 | 2.55 # | 2.15–3.03 |
| Statins | 0.81 ** | 0.70–0.92 | 0.60 # | 0.51–0.71 |
| Loop diuretics | 1.20 ** | 1.06–1.35 | 1.24 ** | 1.09–1.42 |
| Men | Women | |||
|---|---|---|---|---|
| Factor | HR | ±95% CI | HR | ±95% CI |
| Age (per 10 years) | 2.40 # | 2.20–2.57 | 2.91 # | 2.64–3.25 |
| Smoking | 1.42 # | 1.25–1.61 | - | - |
| Past stroke | 1.37 ** | 1.14–1.65 | - | - |
| Heart failure | 1.97 # | 1.60–2.43 | 2.23 # | 1.71–2.92 |
| COPD/Asthma | 1.15 * | 1.00–1.32 | - | - |
| Diabetes | 1.32 # | 1.14–1.52 | 1.22 * | 1.03–1.45 |
| hs-CRP > 3 mg/dL | 1.63 # | 1.45–1.83 | - | - |
| eGFR < 45 mL/min/1.73 m2 | - | - | 1.32 * | 1.06–1.64 |
| ADL ≤ 4 pts | 2.04 # | 1.70–2.44 | 1.60 # | 1.29–1.99 |
| MNA ≤ 7 pts | - | - | 1.38 ** | 1.14–1.66 |
| Statins | - | - | 0.81 * | 0.67–0.98 |
| Loop diuretics | - | - | 1.43 ** | 1.14–1.80 |
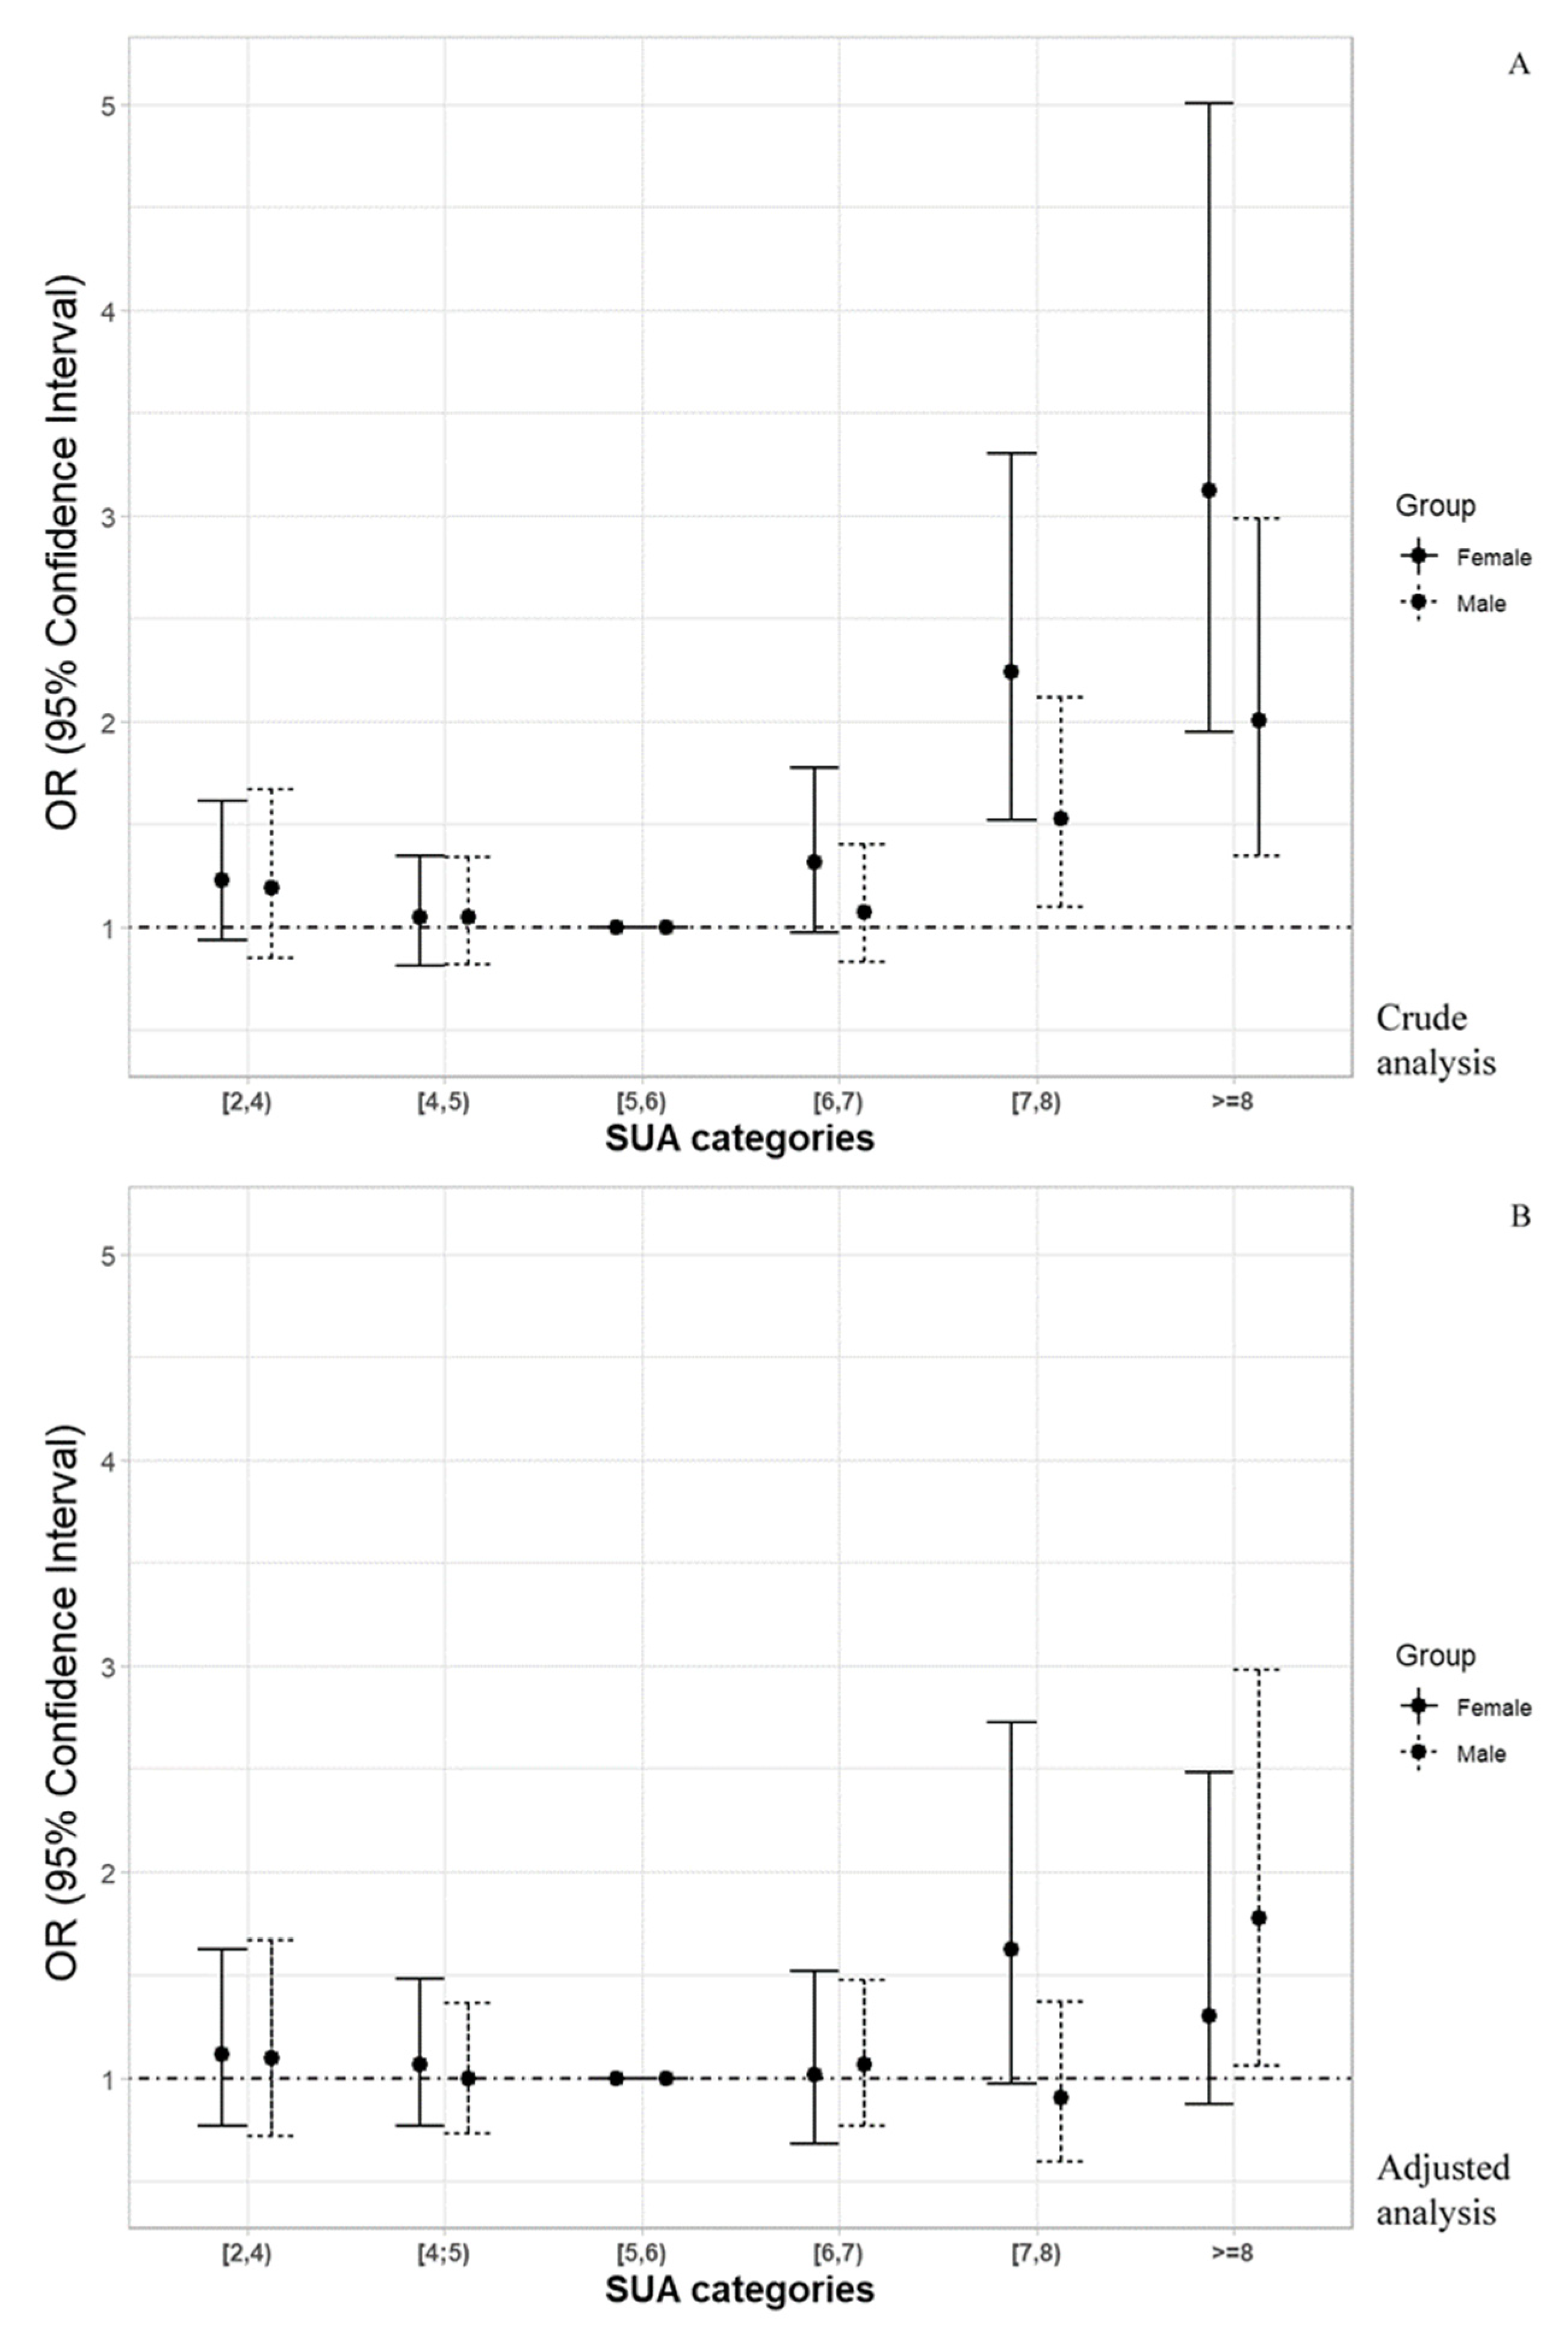
| SUA Level | <4 | <4;5) | <5;6) | <6;7) | <7;8) | ≥8 | p |
|---|---|---|---|---|---|---|---|
| Men | |||||||
| Death risk (OR (±95% CI)) | 1.191 (0.850–1.669) | 1.046 (0.817–1.340) | Ref. | 1.075 (0.827–1.399) | 1.525 * (1.097–2.119) | 2.002 ** (1.343–2.985) | - |
| Adjusted Death risk (OR (±95% CI)) a | 1.098 (0.721–1.672) | 0.997 (0.728–1.366) | Ref. | 1.064 (0.766–1.477) | 0.905 (0.596–1.372) | 1.777 * (1.060–2.980) | - |
| Women | |||||||
| Death risk (OR (±95% CI)) | 1.228 (0.934–1.615) | 1.045 (0.811–1.344) | Ref. | 1.313 (0.970–1.777) | 2.239 # (1.517–3.306) | 3.123 # (1.949–5.005) | - |
| Adjusted Death risk (OR (±95% CI)) b | 1.118 (0.768–1.625) | 1.066 (0.766–1.485) | Ref. | 1.019 (0.683–1.520) | 1.627 (0.972–2.725) | 1.304 (0.840–2.484) | - |
Publisher’s Note: MDPI stays neutral with regard to jurisdictional claims in published maps and institutional affiliations. |
© 2021 by the authors. Licensee MDPI, Basel, Switzerland. This article is an open access article distributed under the terms and conditions of the Creative Commons Attribution (CC BY) license (https://creativecommons.org/licenses/by/4.0/).
Share and Cite
Winder, M.; Owczarek, A.J.; Mossakowska, M.; Holecki, M.; Broczek, K.; Grodzicki, T.; Zdrojewski, T.; Chudek, J. Serum Uric Acid Is a Weak Independent Predictor of Overall Survival in Older Adults. J. Clin. Med. 2021, 10, 4505. https://doi.org/10.3390/jcm10194505
Winder M, Owczarek AJ, Mossakowska M, Holecki M, Broczek K, Grodzicki T, Zdrojewski T, Chudek J. Serum Uric Acid Is a Weak Independent Predictor of Overall Survival in Older Adults. Journal of Clinical Medicine. 2021; 10(19):4505. https://doi.org/10.3390/jcm10194505
Chicago/Turabian StyleWinder, Mateusz, Aleksander J. Owczarek, Małgorzata Mossakowska, Michał Holecki, Katarzyna Broczek, Tomasz Grodzicki, Tomasz Zdrojewski, and Jerzy Chudek. 2021. "Serum Uric Acid Is a Weak Independent Predictor of Overall Survival in Older Adults" Journal of Clinical Medicine 10, no. 19: 4505. https://doi.org/10.3390/jcm10194505
APA StyleWinder, M., Owczarek, A. J., Mossakowska, M., Holecki, M., Broczek, K., Grodzicki, T., Zdrojewski, T., & Chudek, J. (2021). Serum Uric Acid Is a Weak Independent Predictor of Overall Survival in Older Adults. Journal of Clinical Medicine, 10(19), 4505. https://doi.org/10.3390/jcm10194505