
The Paradoxical Effect Hypothesis of Abused Drugs in a Rat Model of Chronic Morphine Administration


Abstract
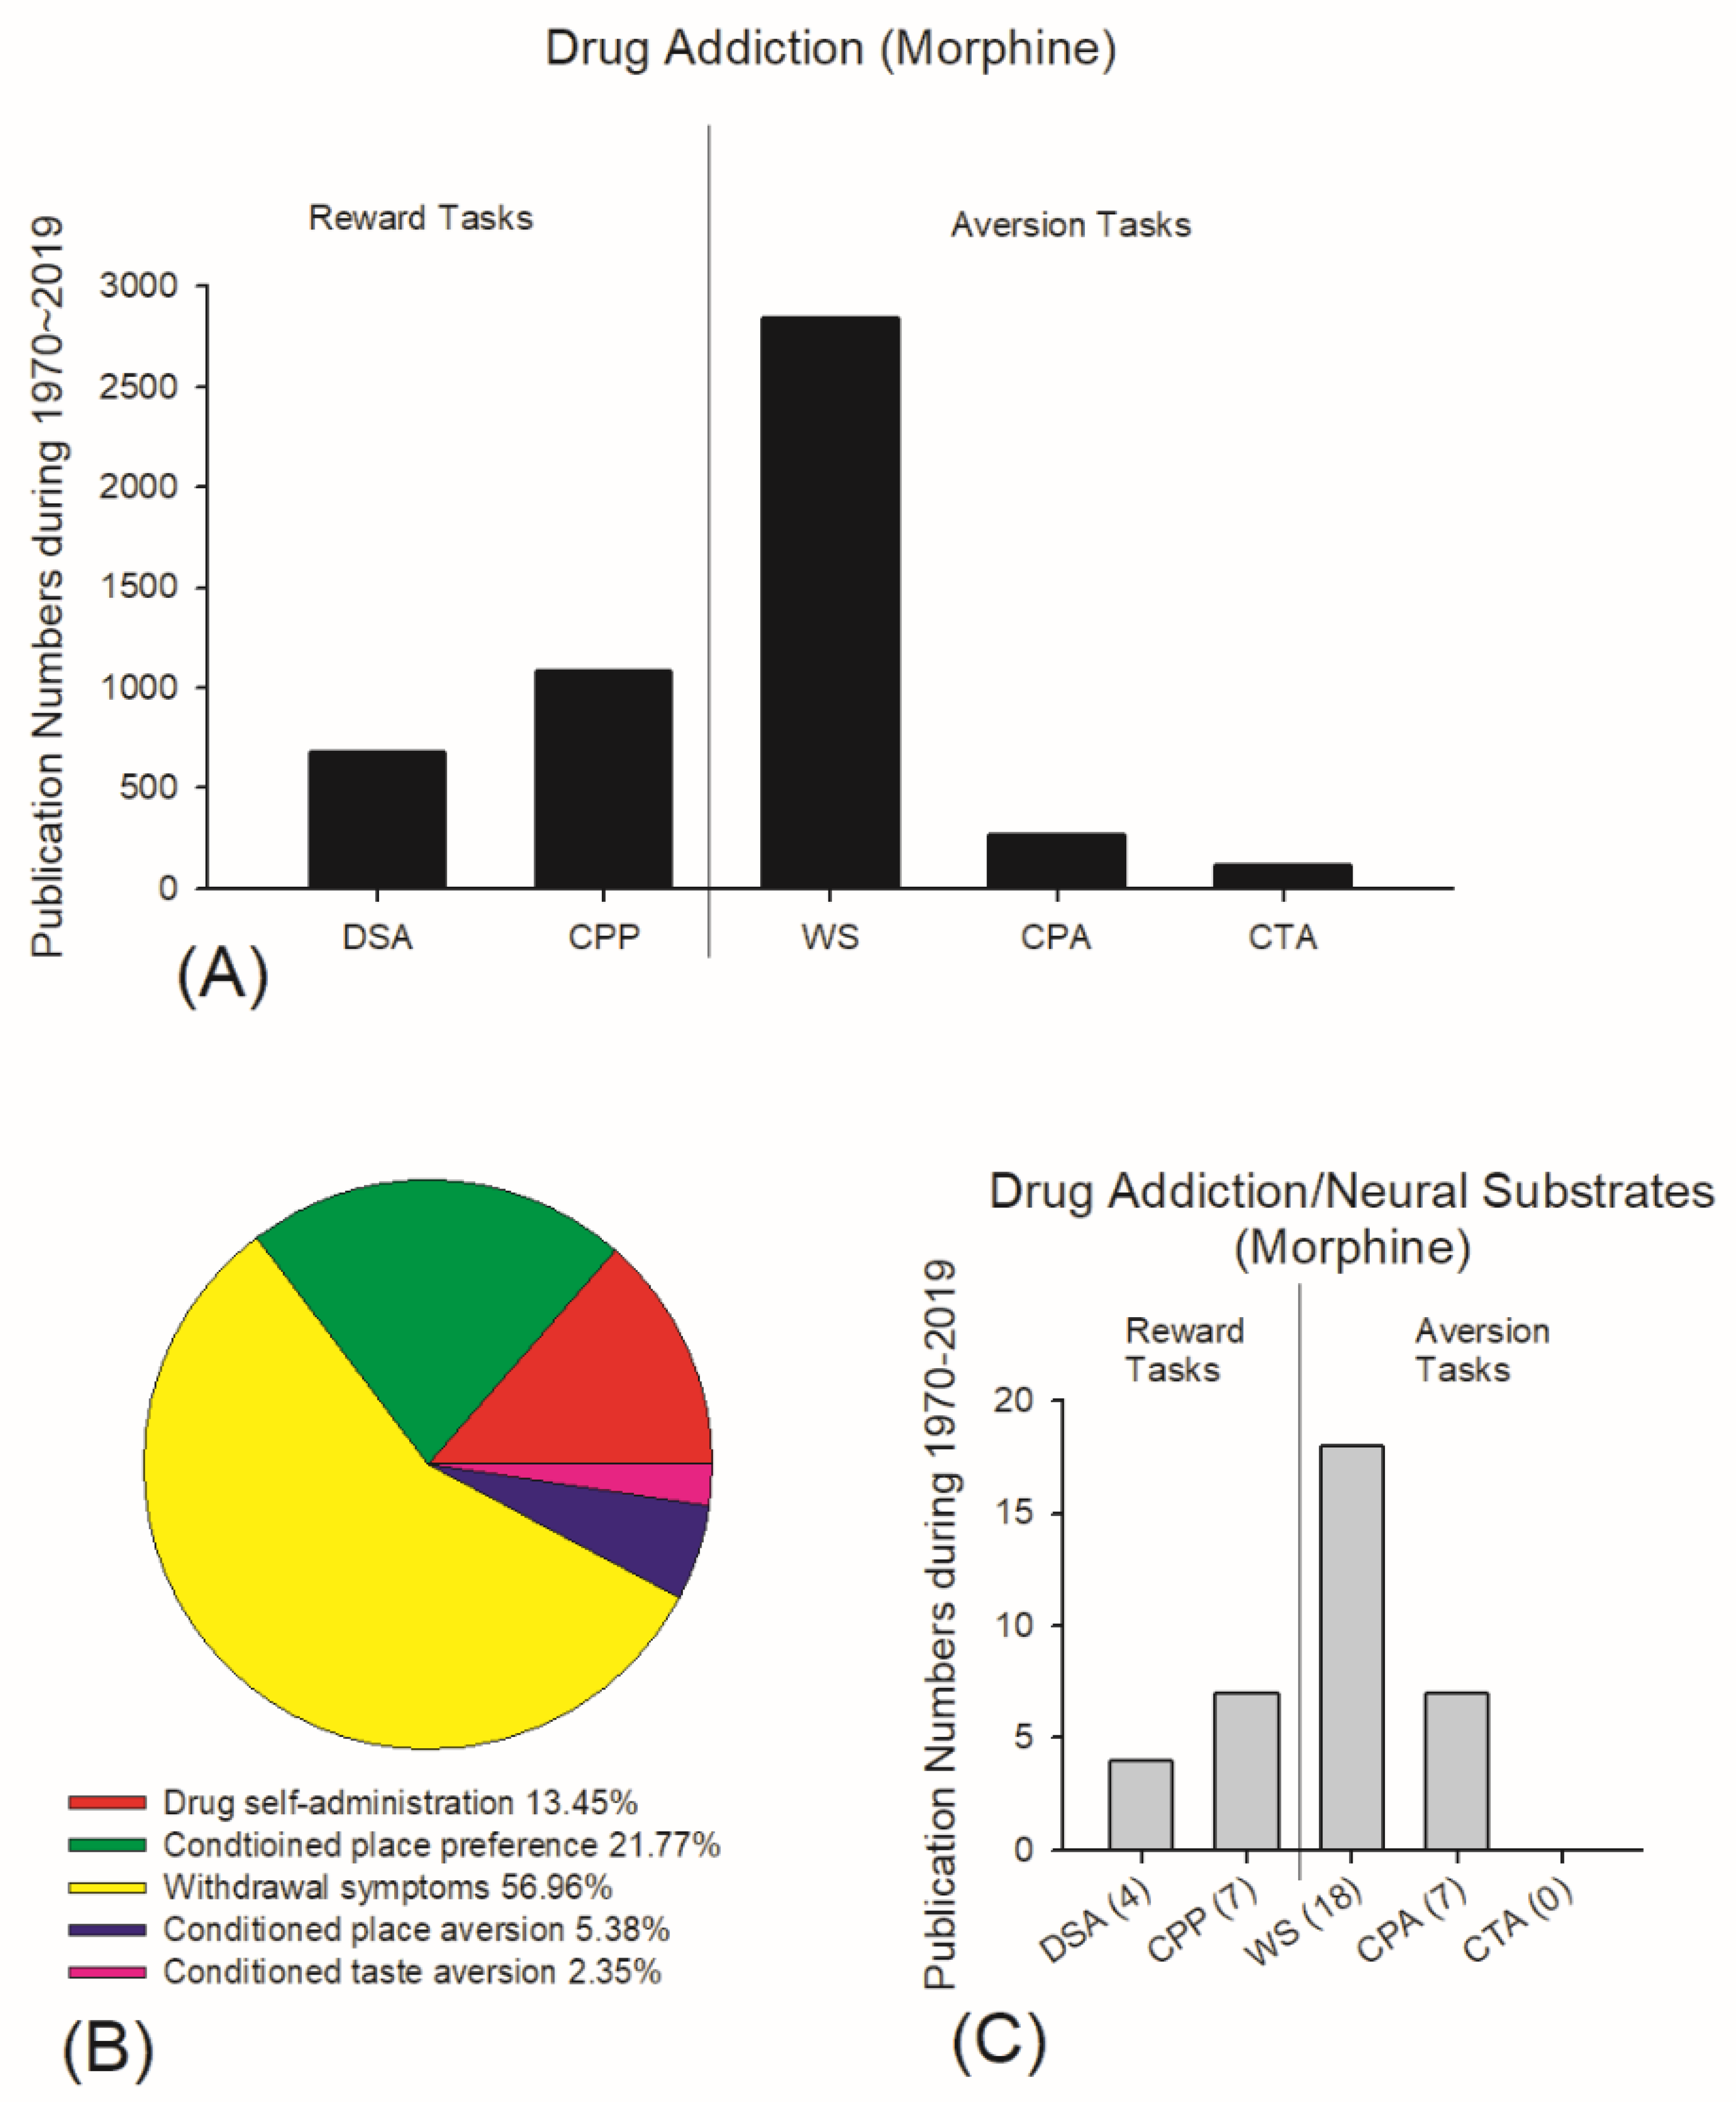
1. Introduction
2. Material and Methods
2.1. Behavioral Procedure
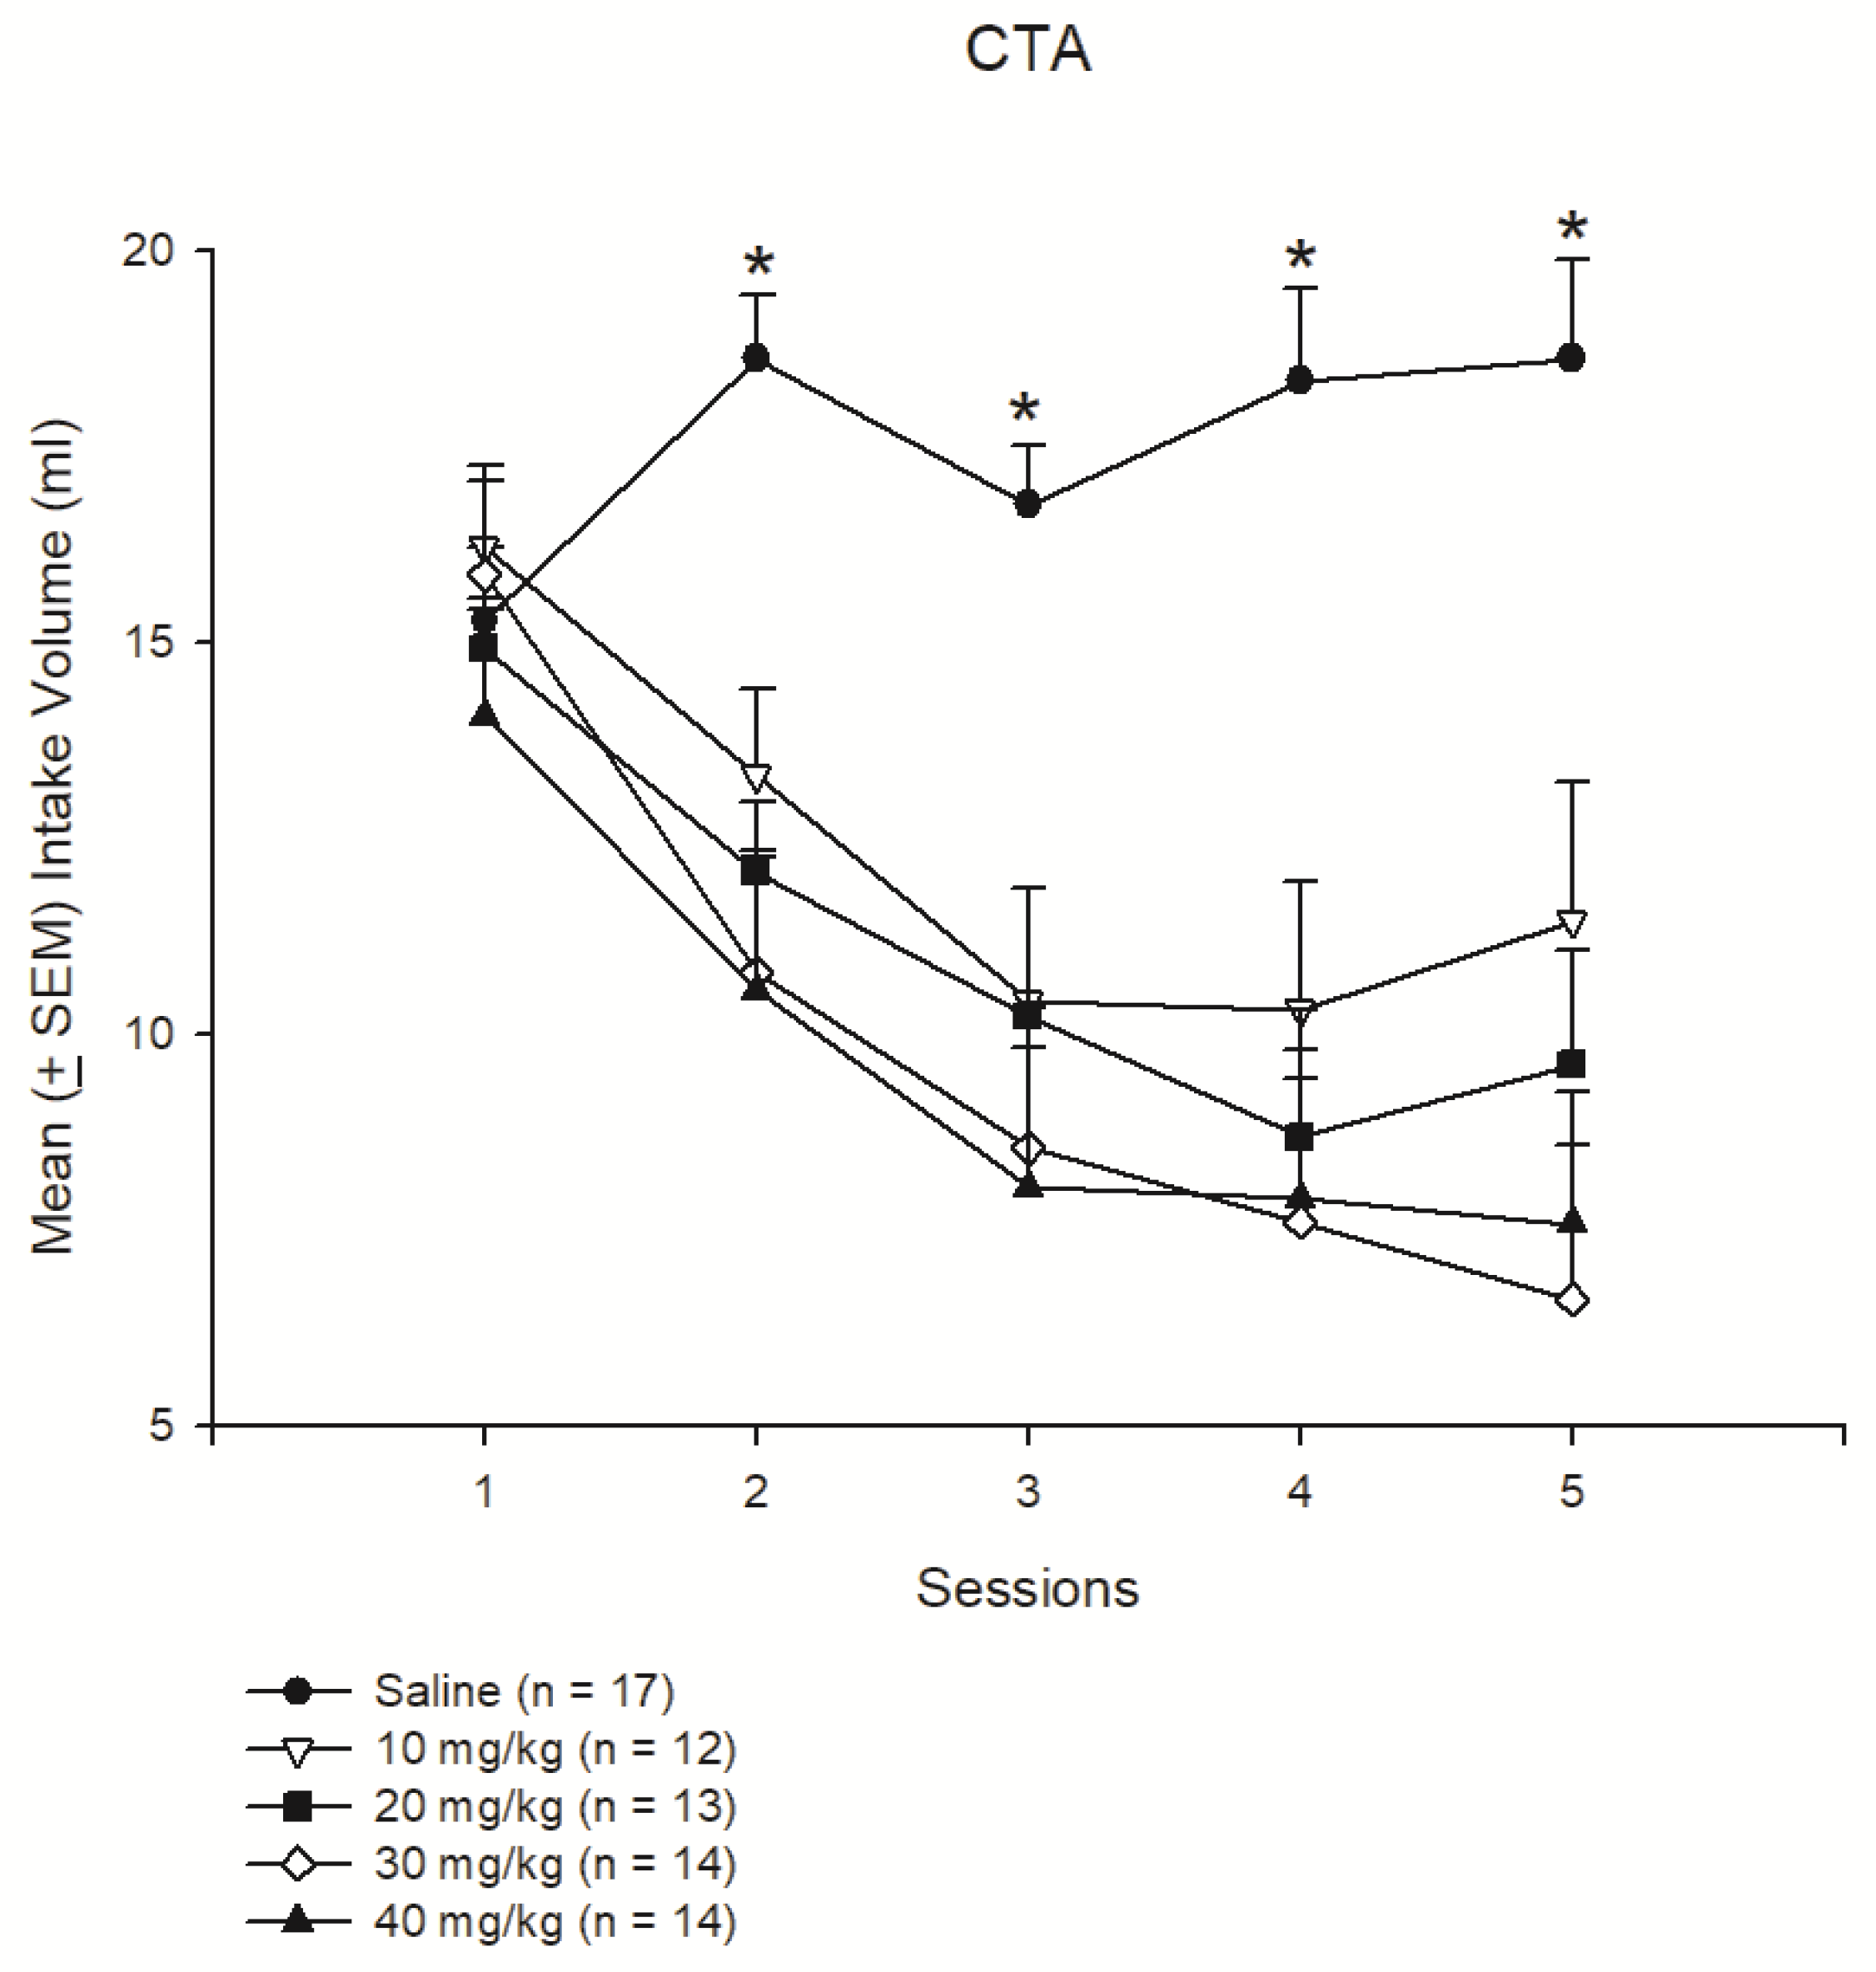
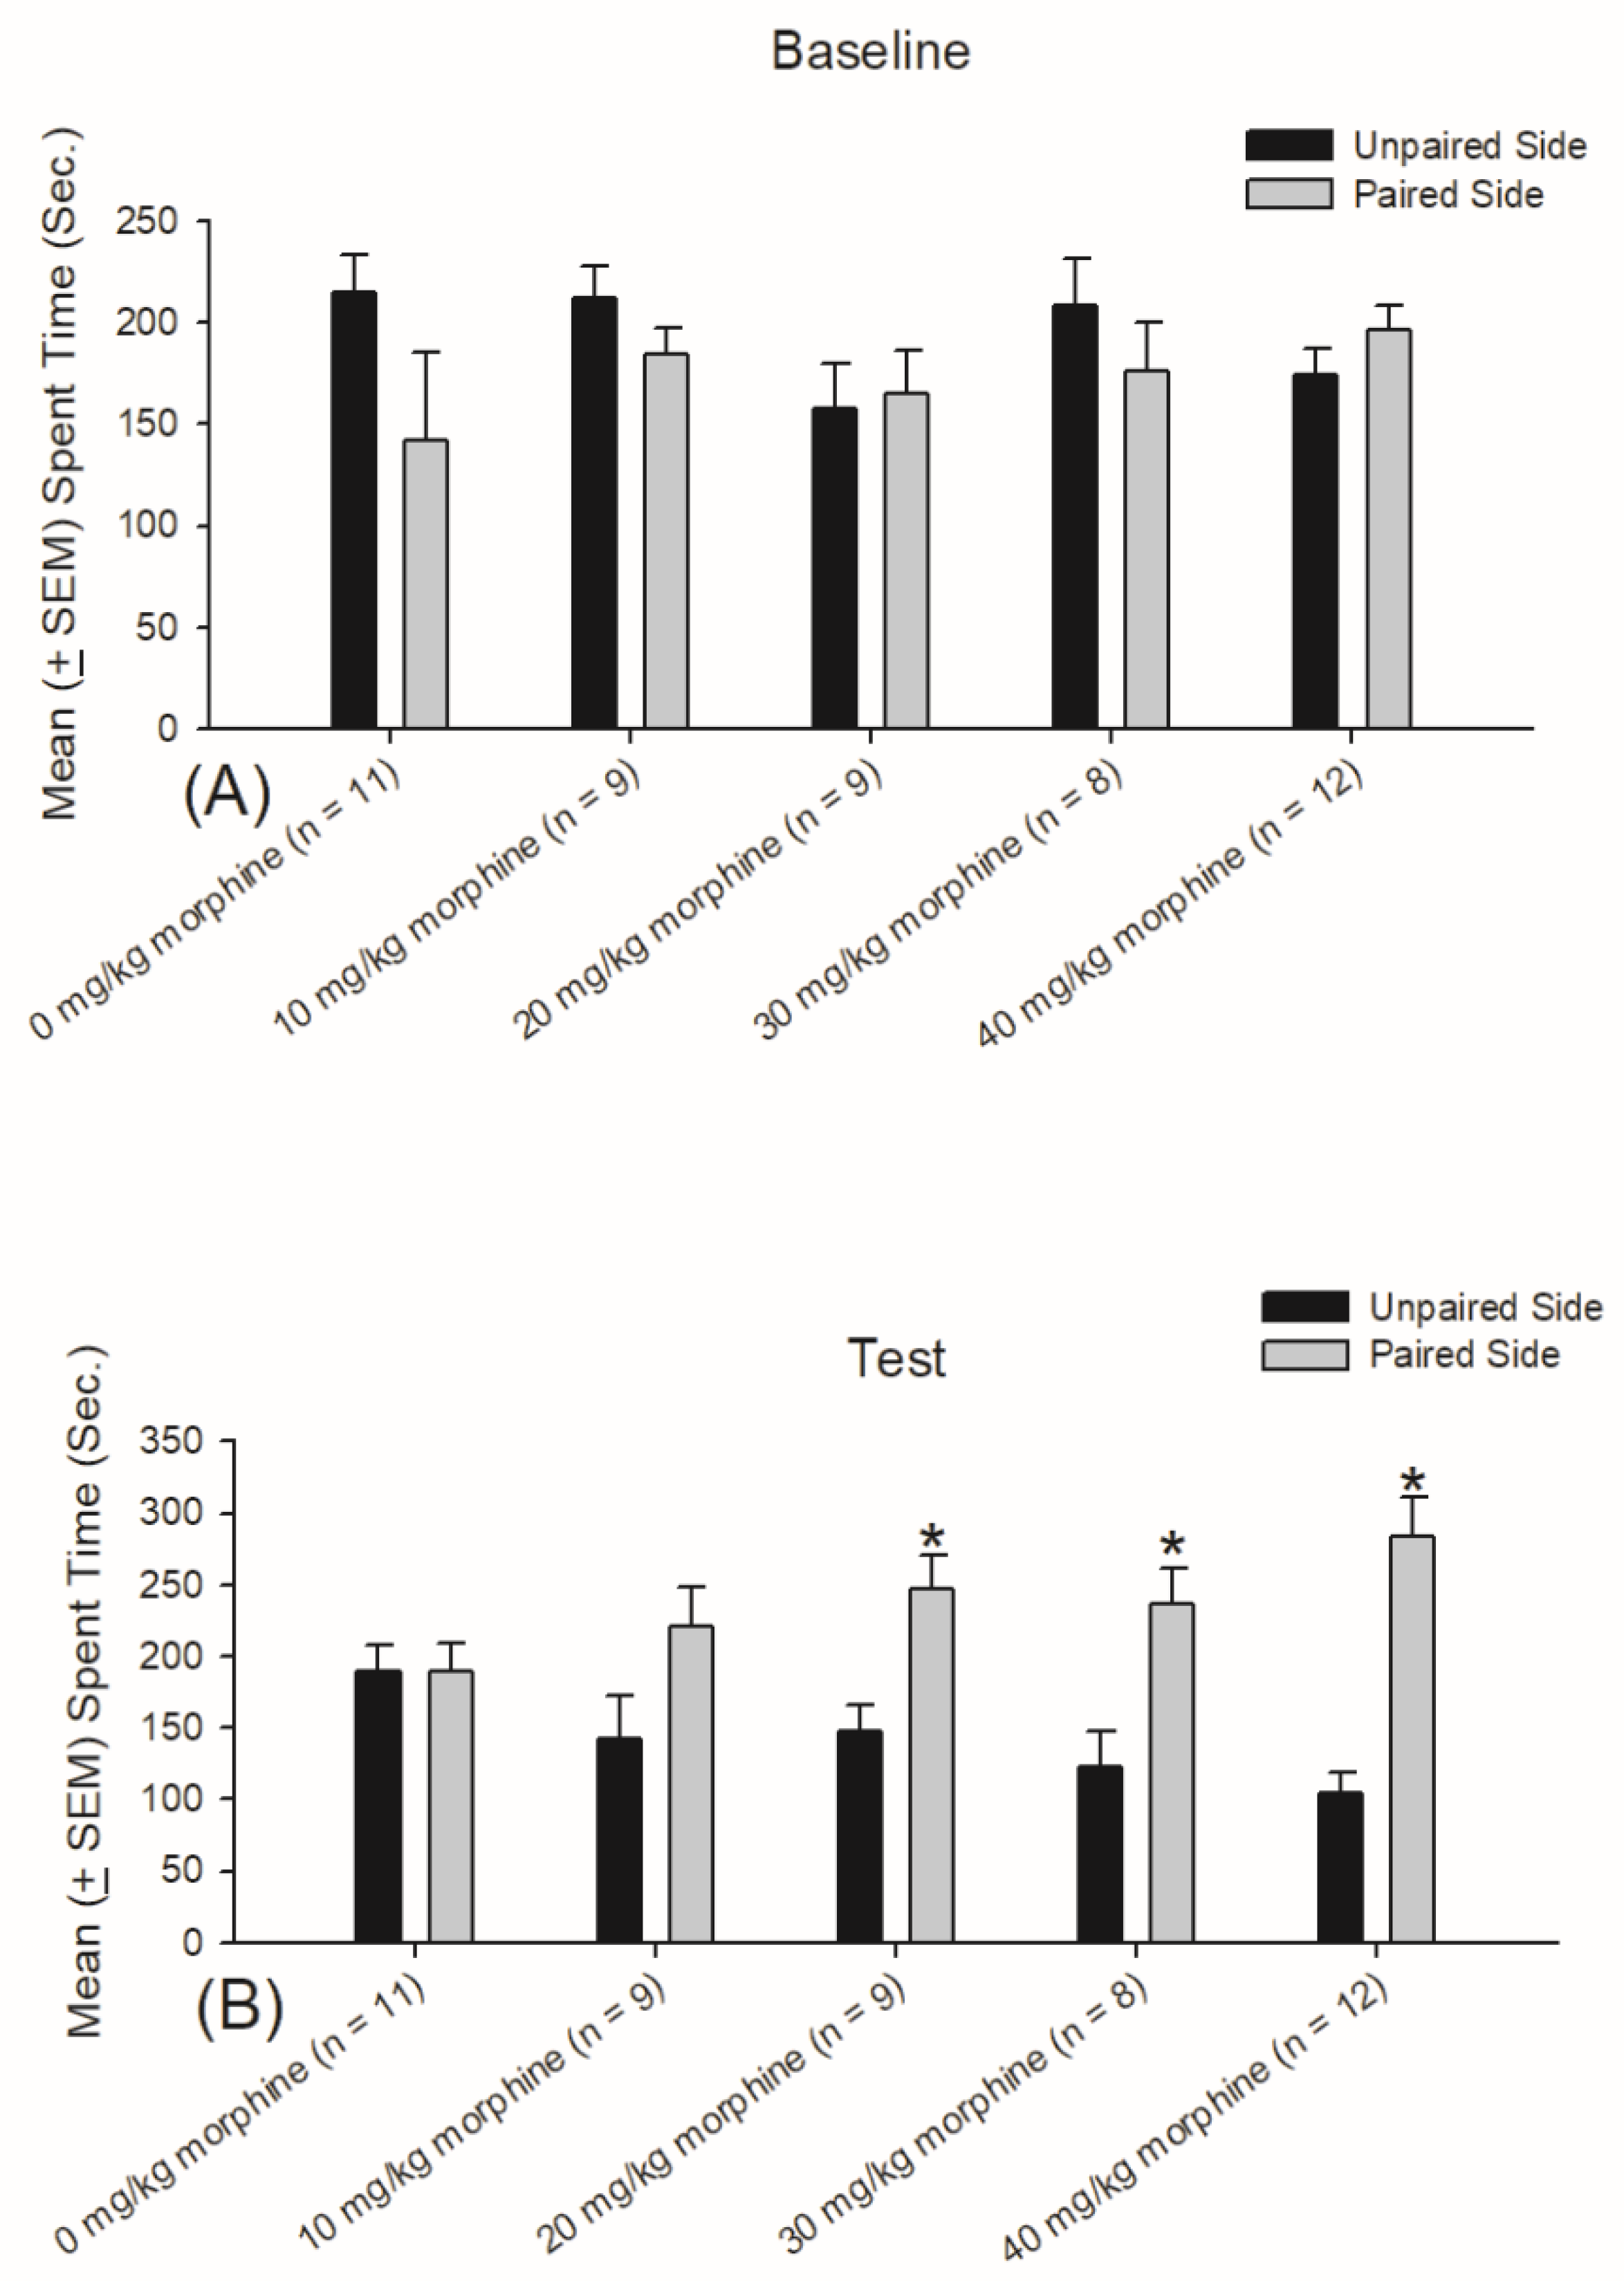
2.1.1. Experiment 1: Testing Different Doses of Morphine for Reward and Aversion
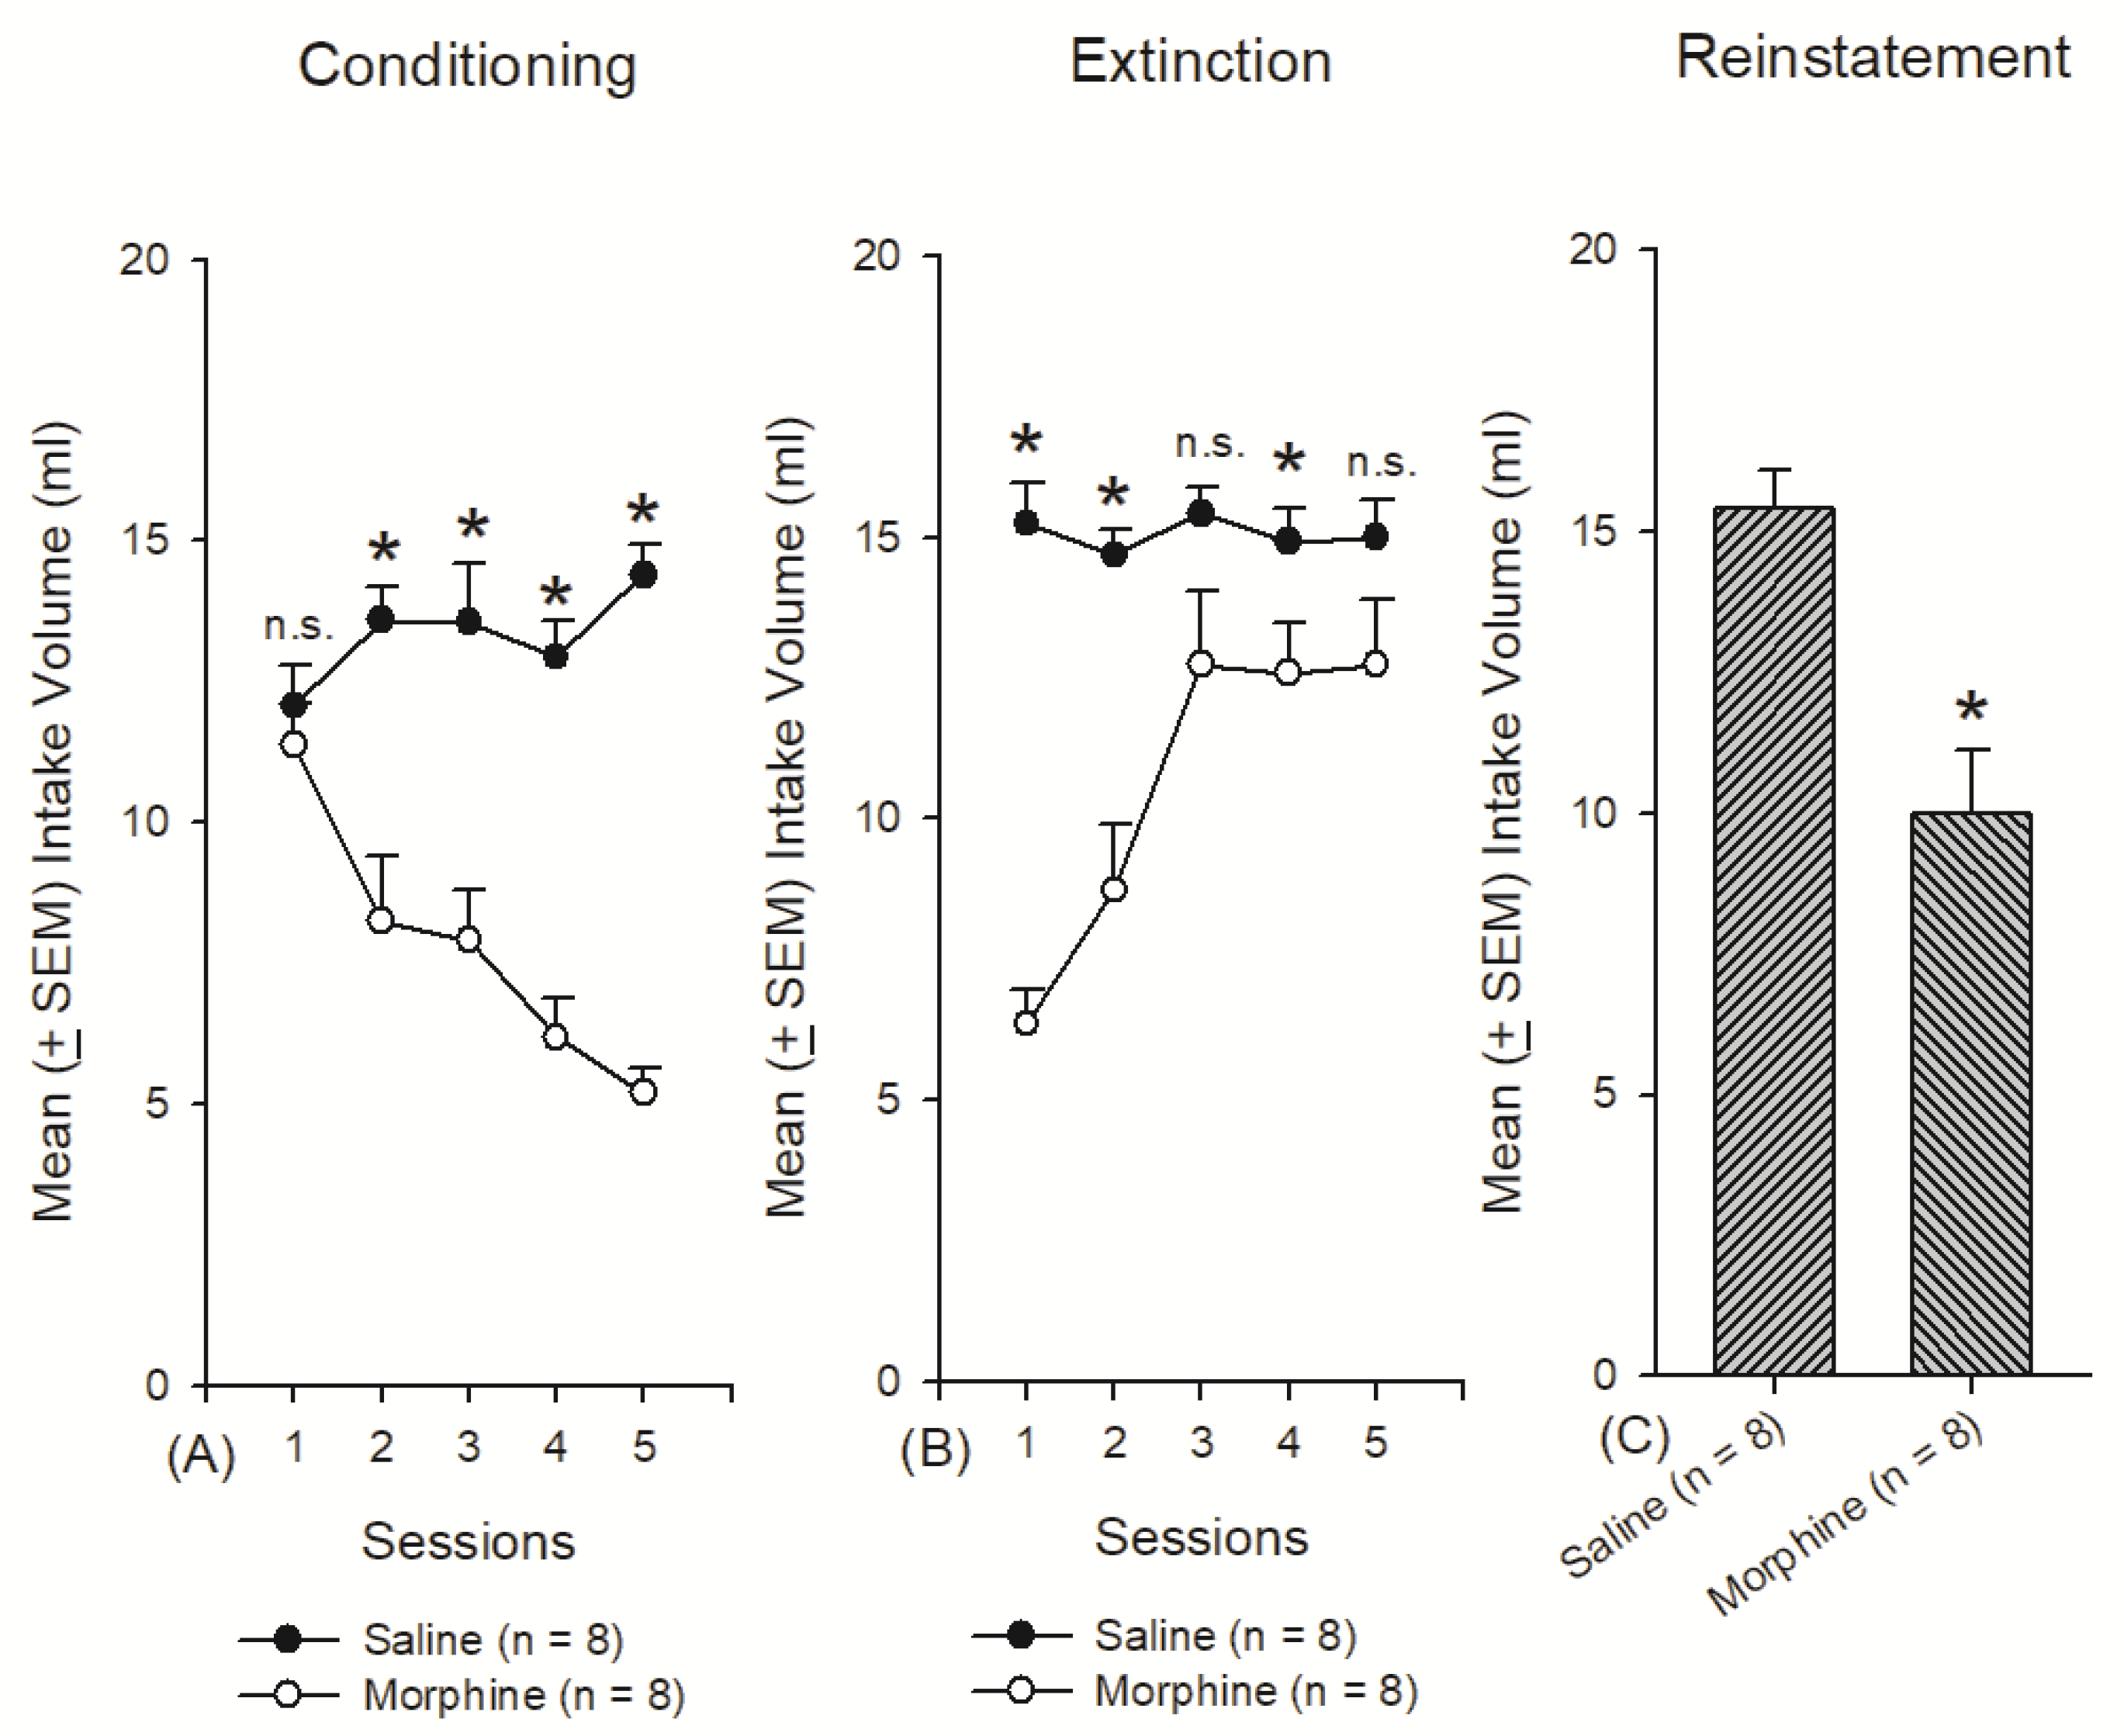
2.1.2. Experiment 2: Which Neural Substrates Were Involved in the Reward, Aversion, or Even Both Effects Induced CTA by Morphine
2.2. ELISA: Corticosterone Assessments
2.3. Immunohistochemical Staining: c-Fos and p-ERK
2.4. Drugs
3. Results
3.1. Experiment 1: Different Doses of Morphine Testing for Reward and Aversion
3.2. Experiment 2: Assessments of Conditioning, Extinction, and Reinstatement Behavior
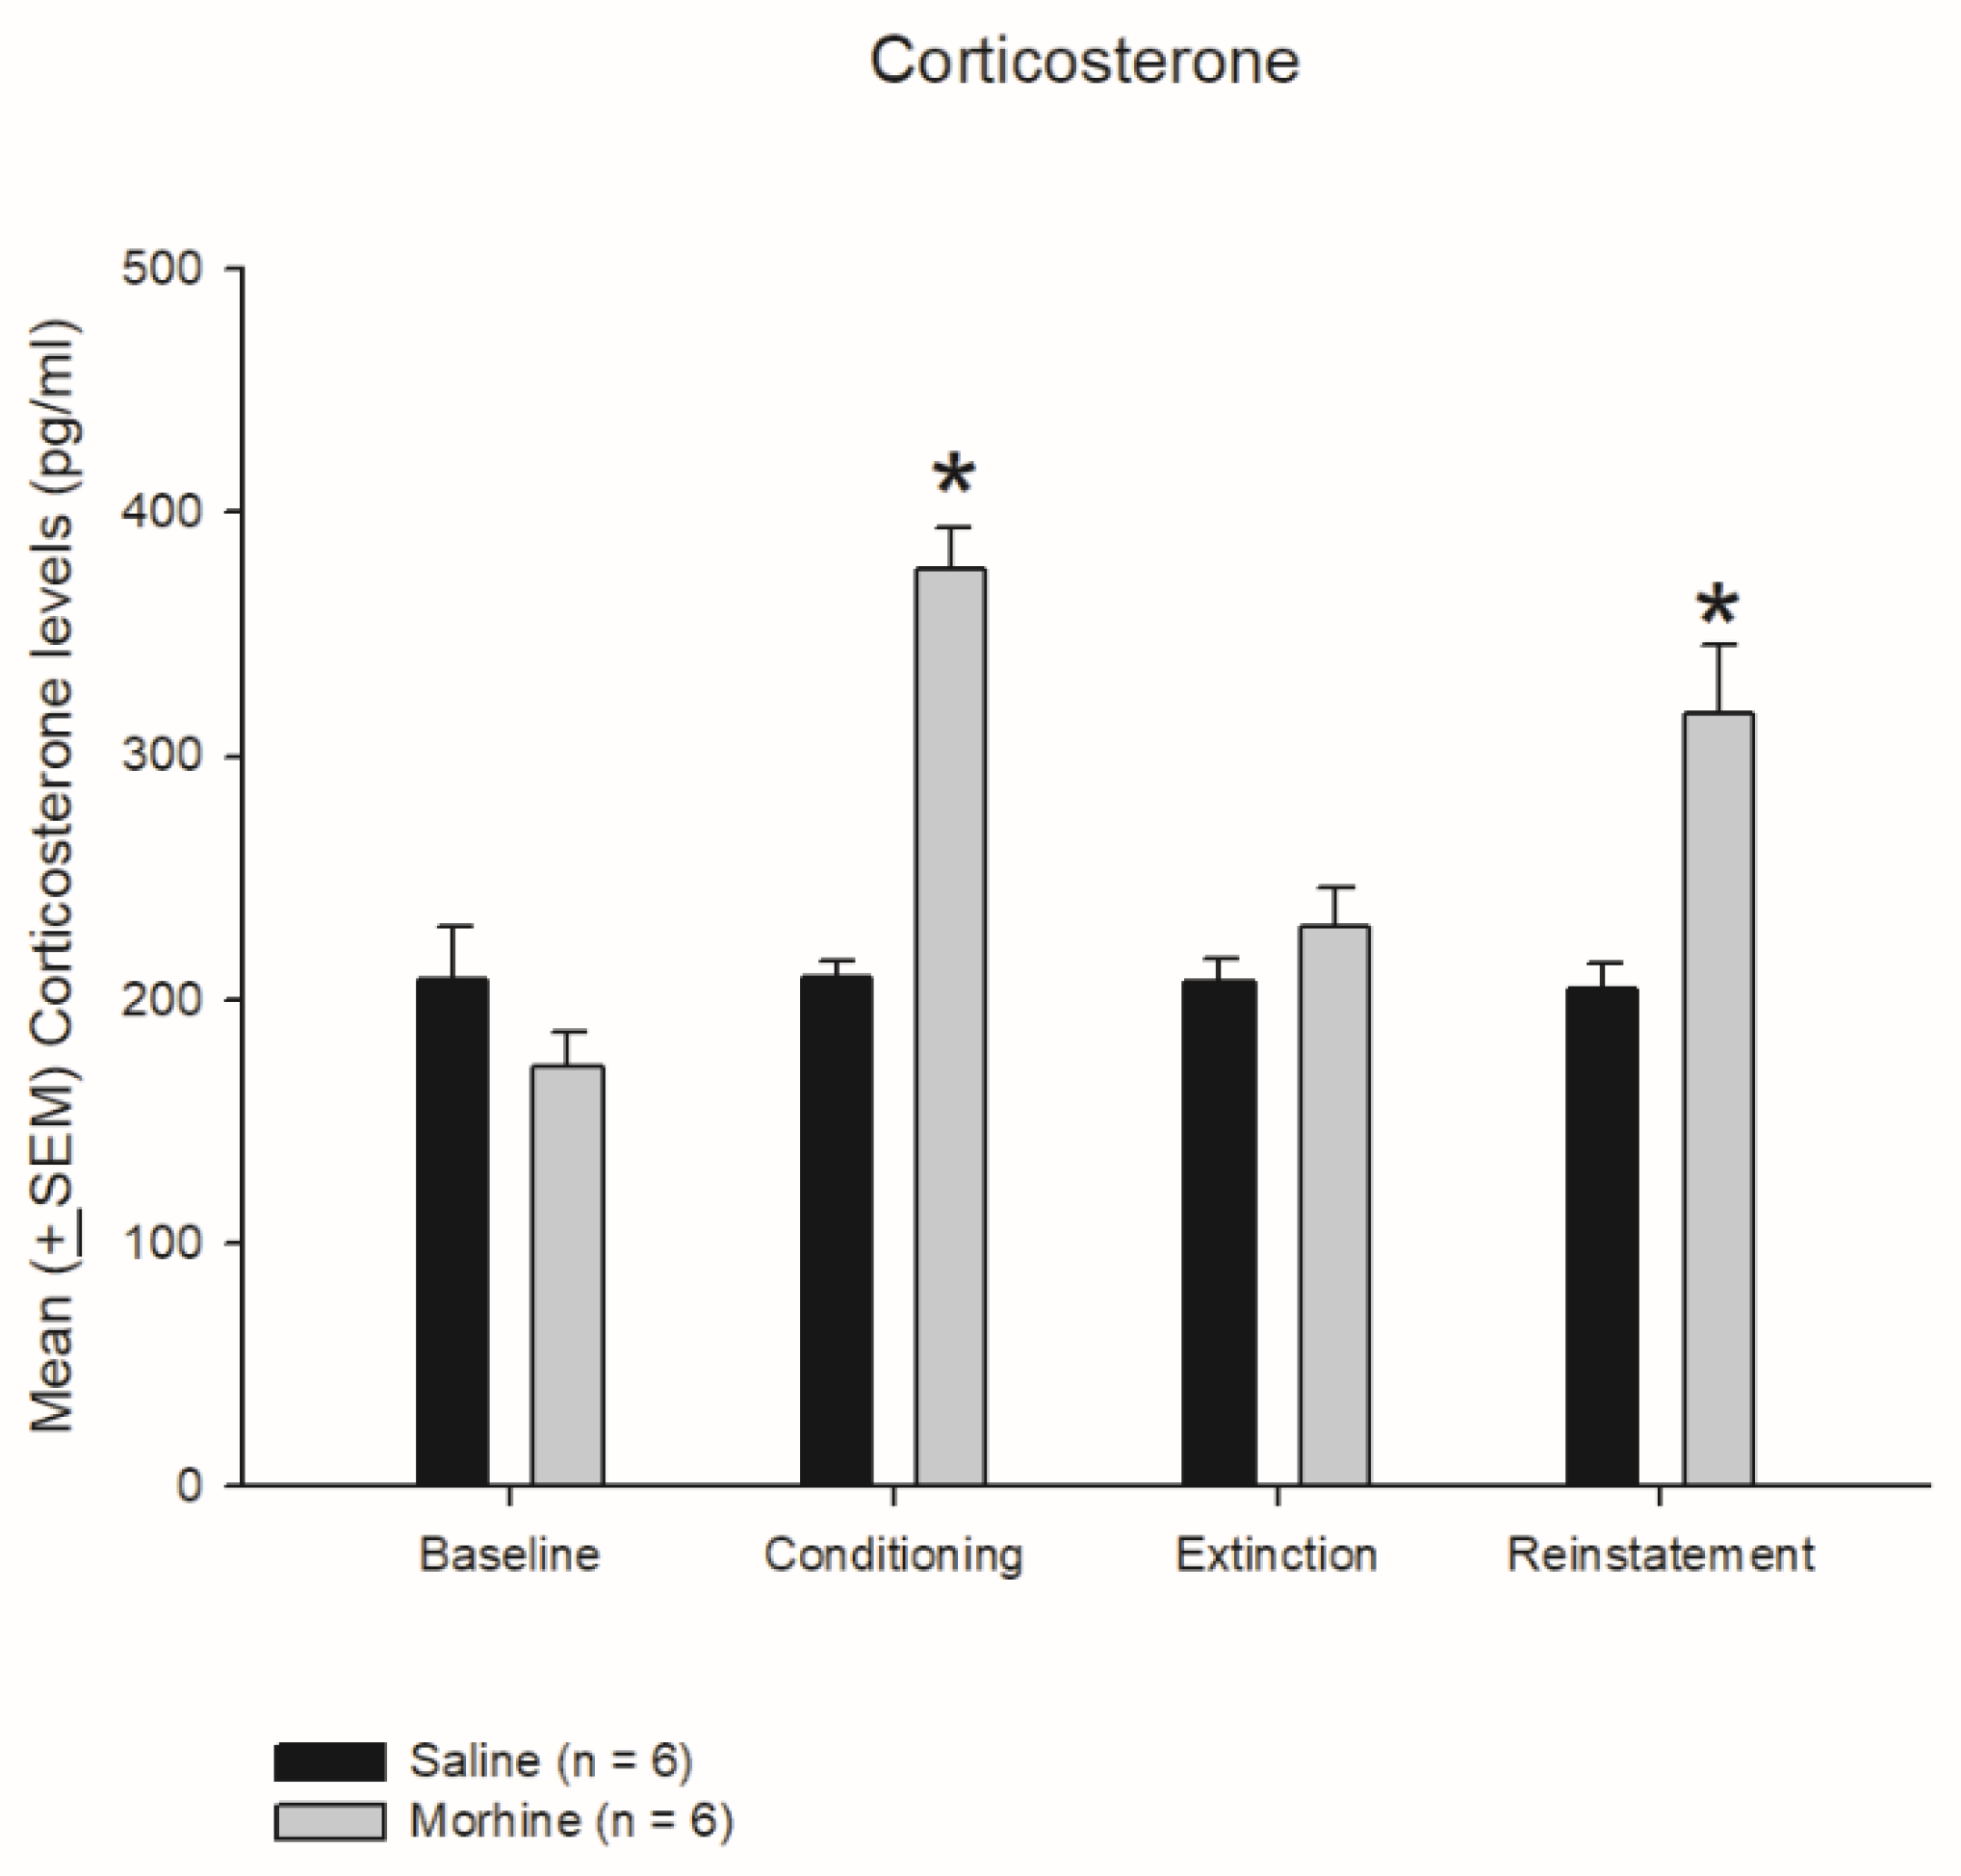
3.3. Plasma Corticosterone Levels on Conditioning, Extinction, and Reinstatement
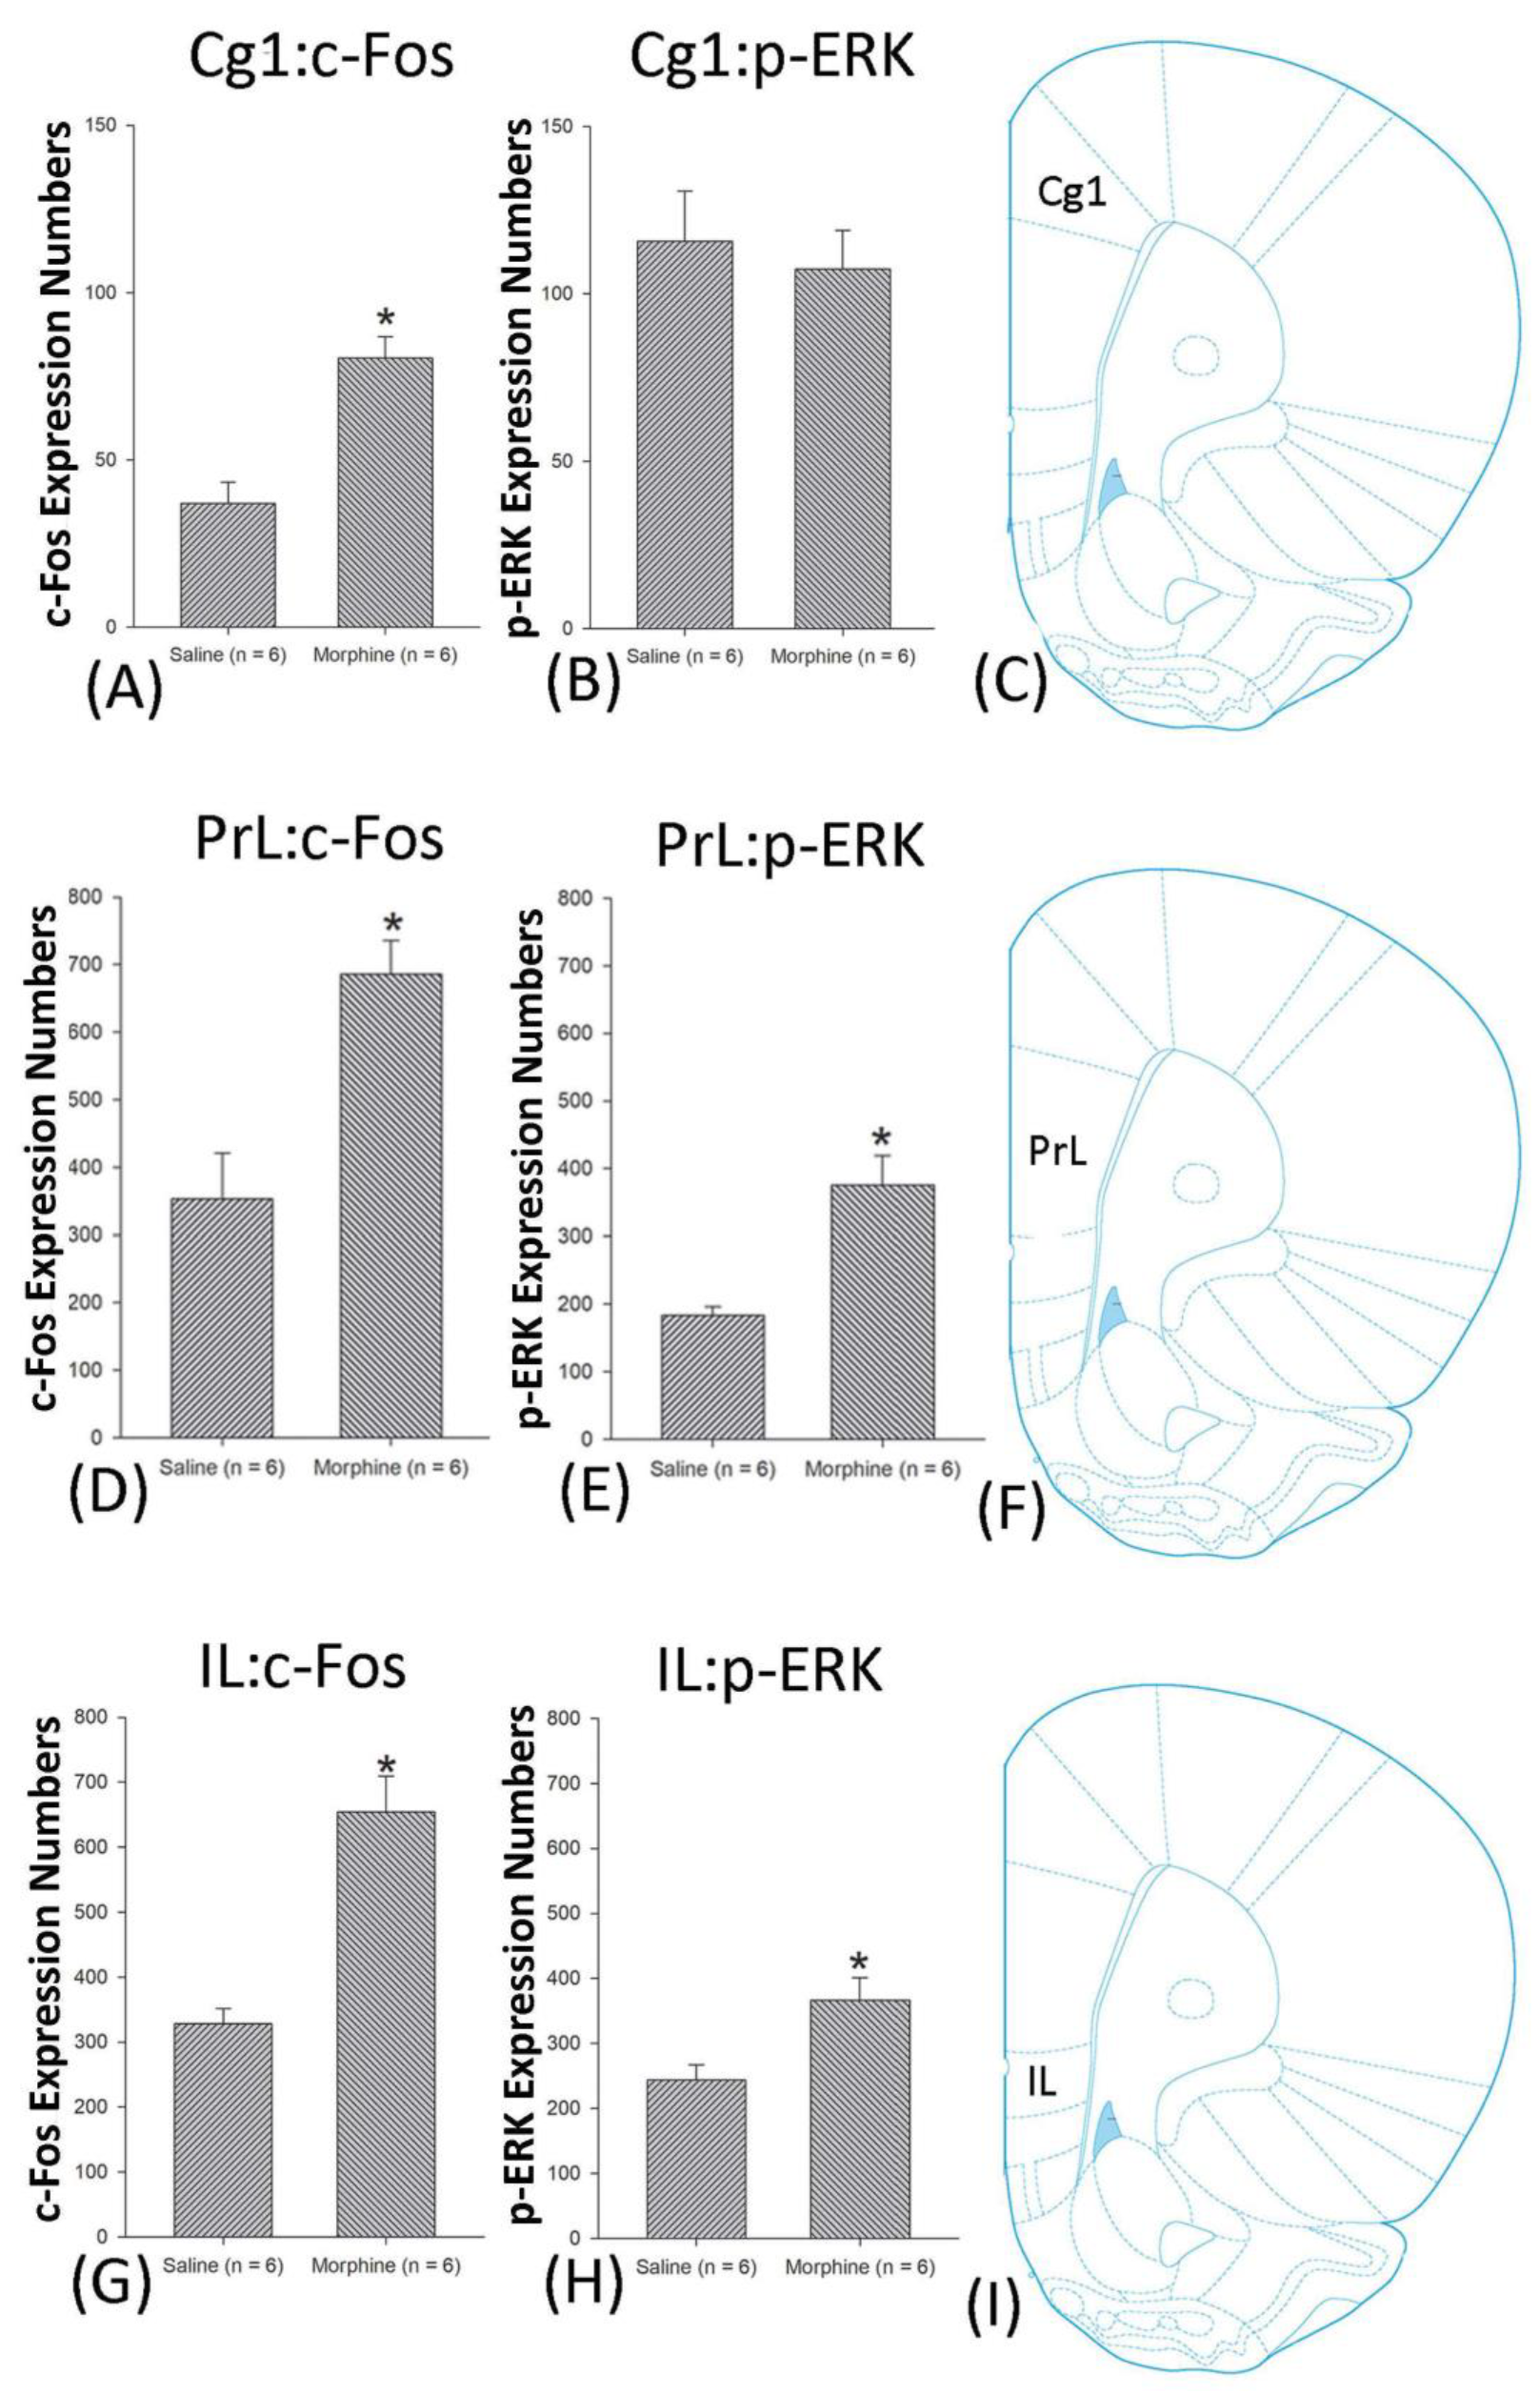
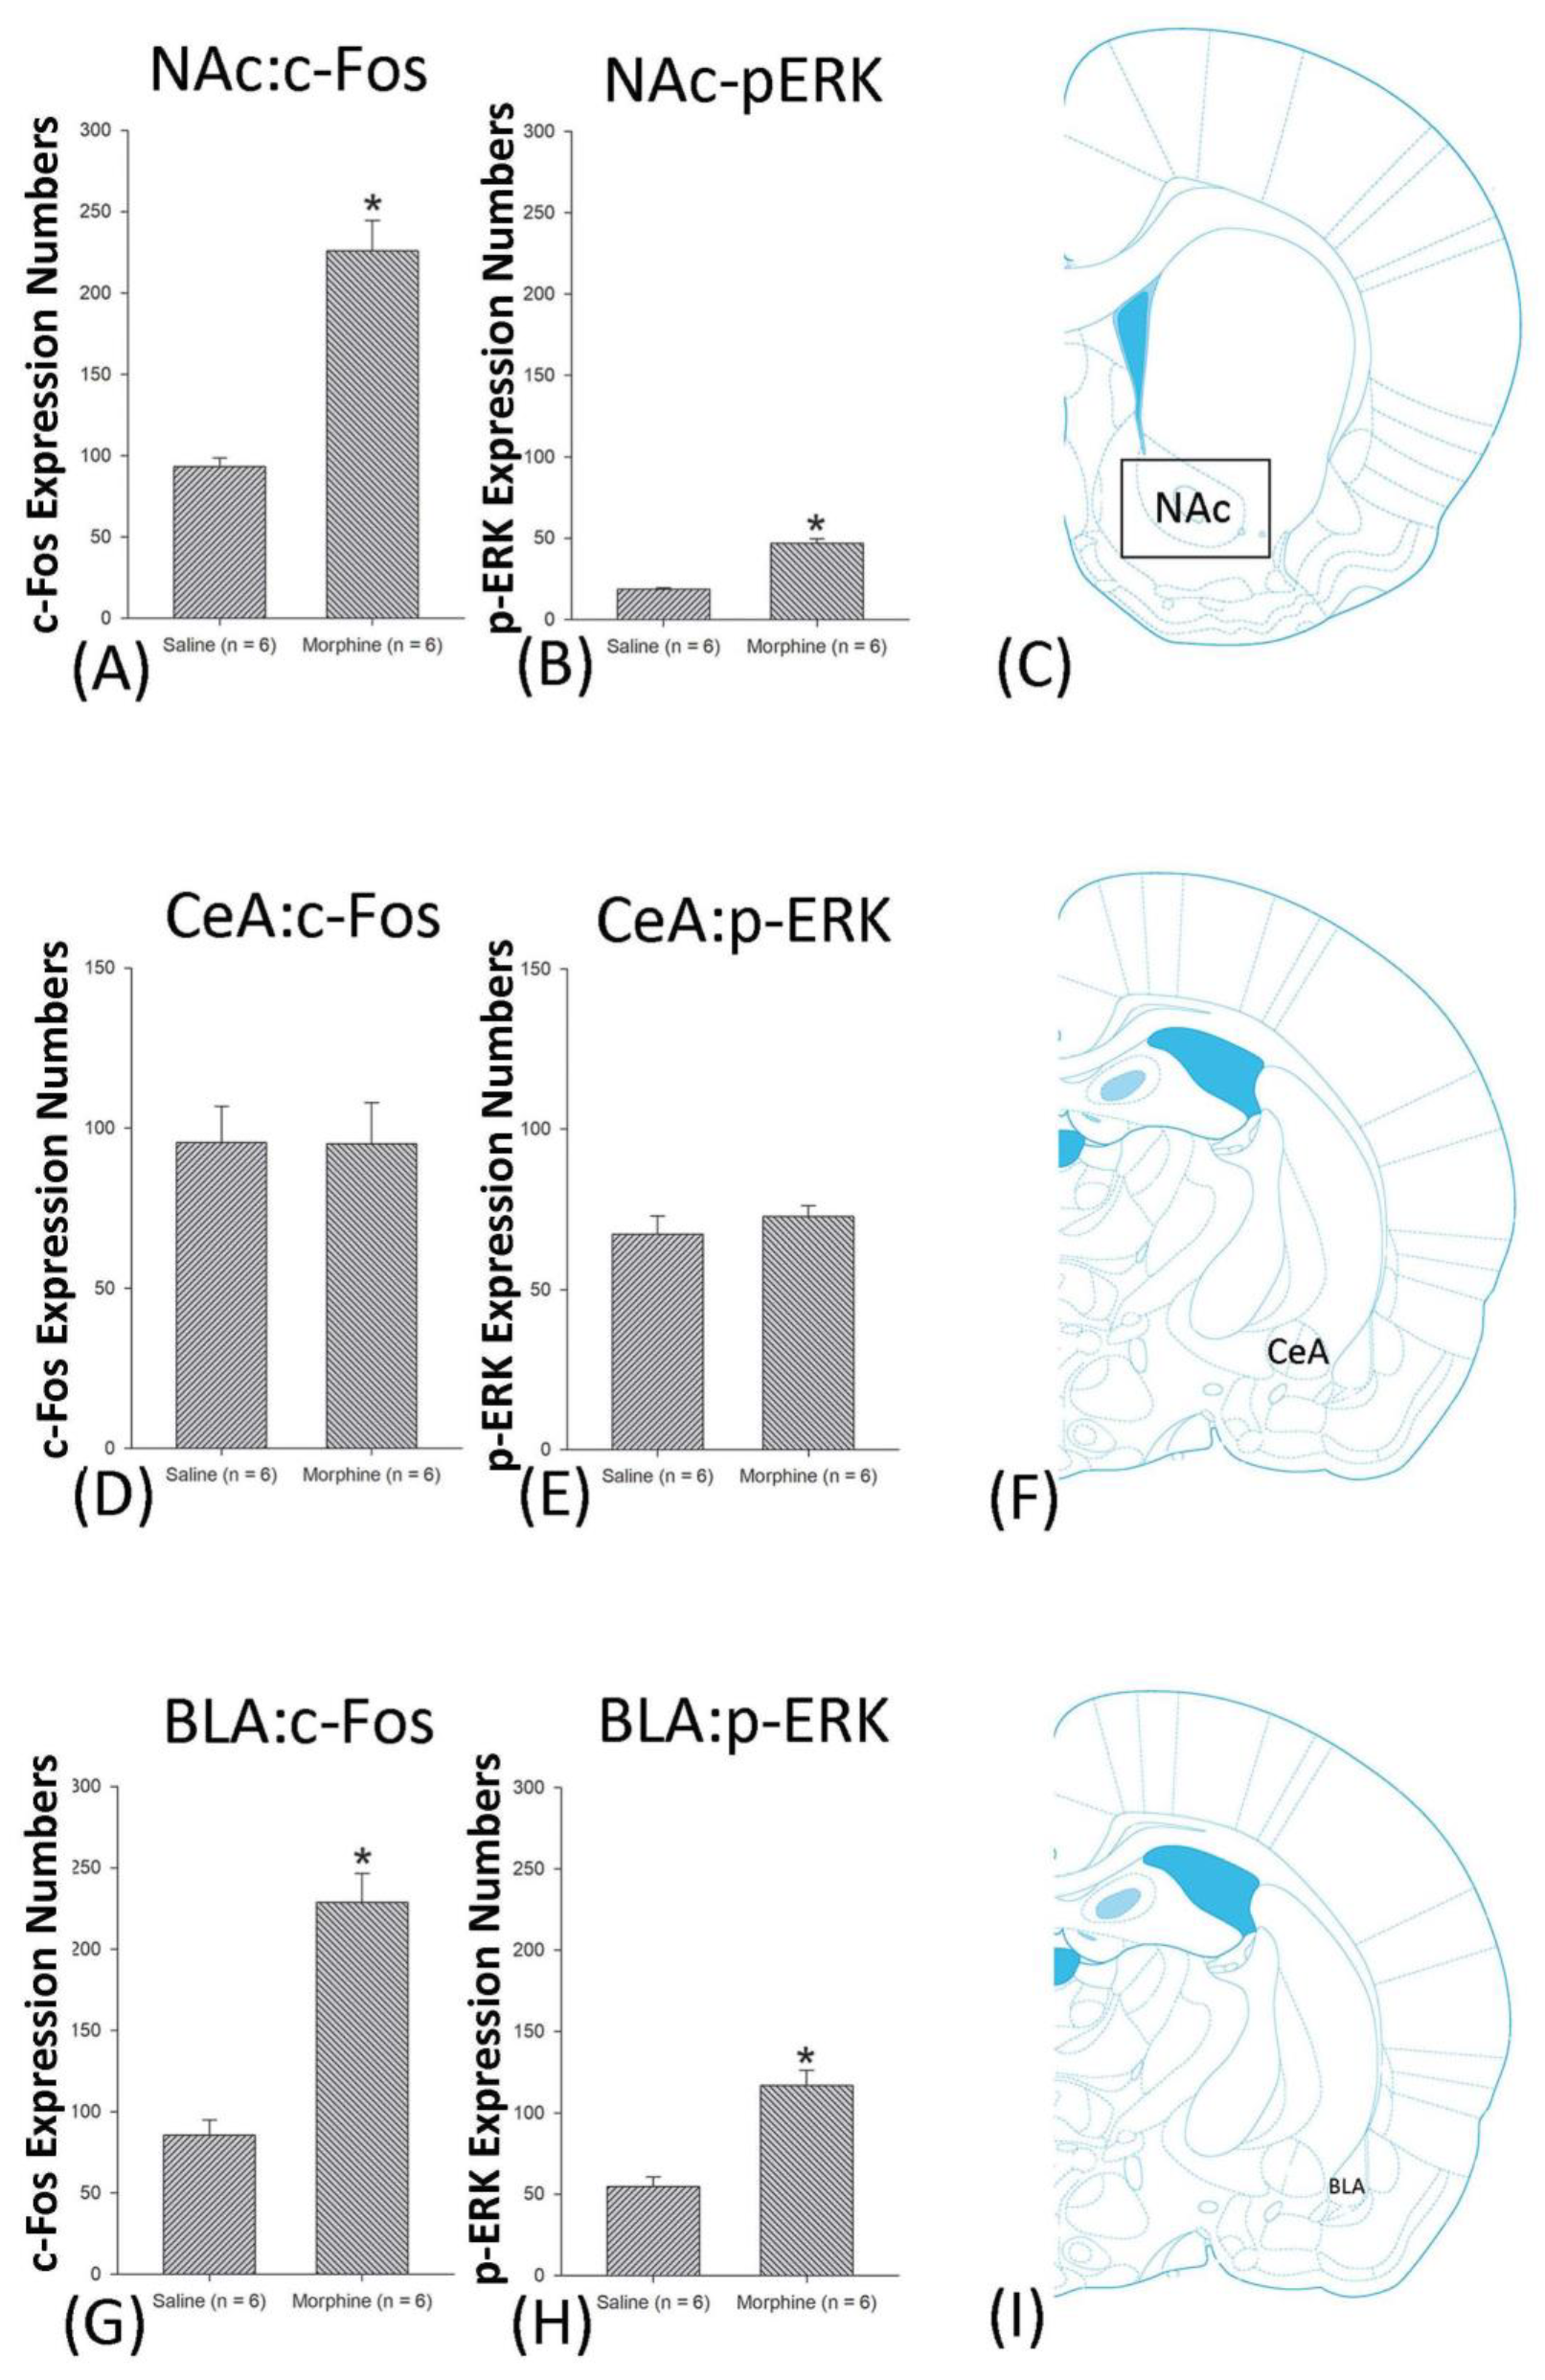
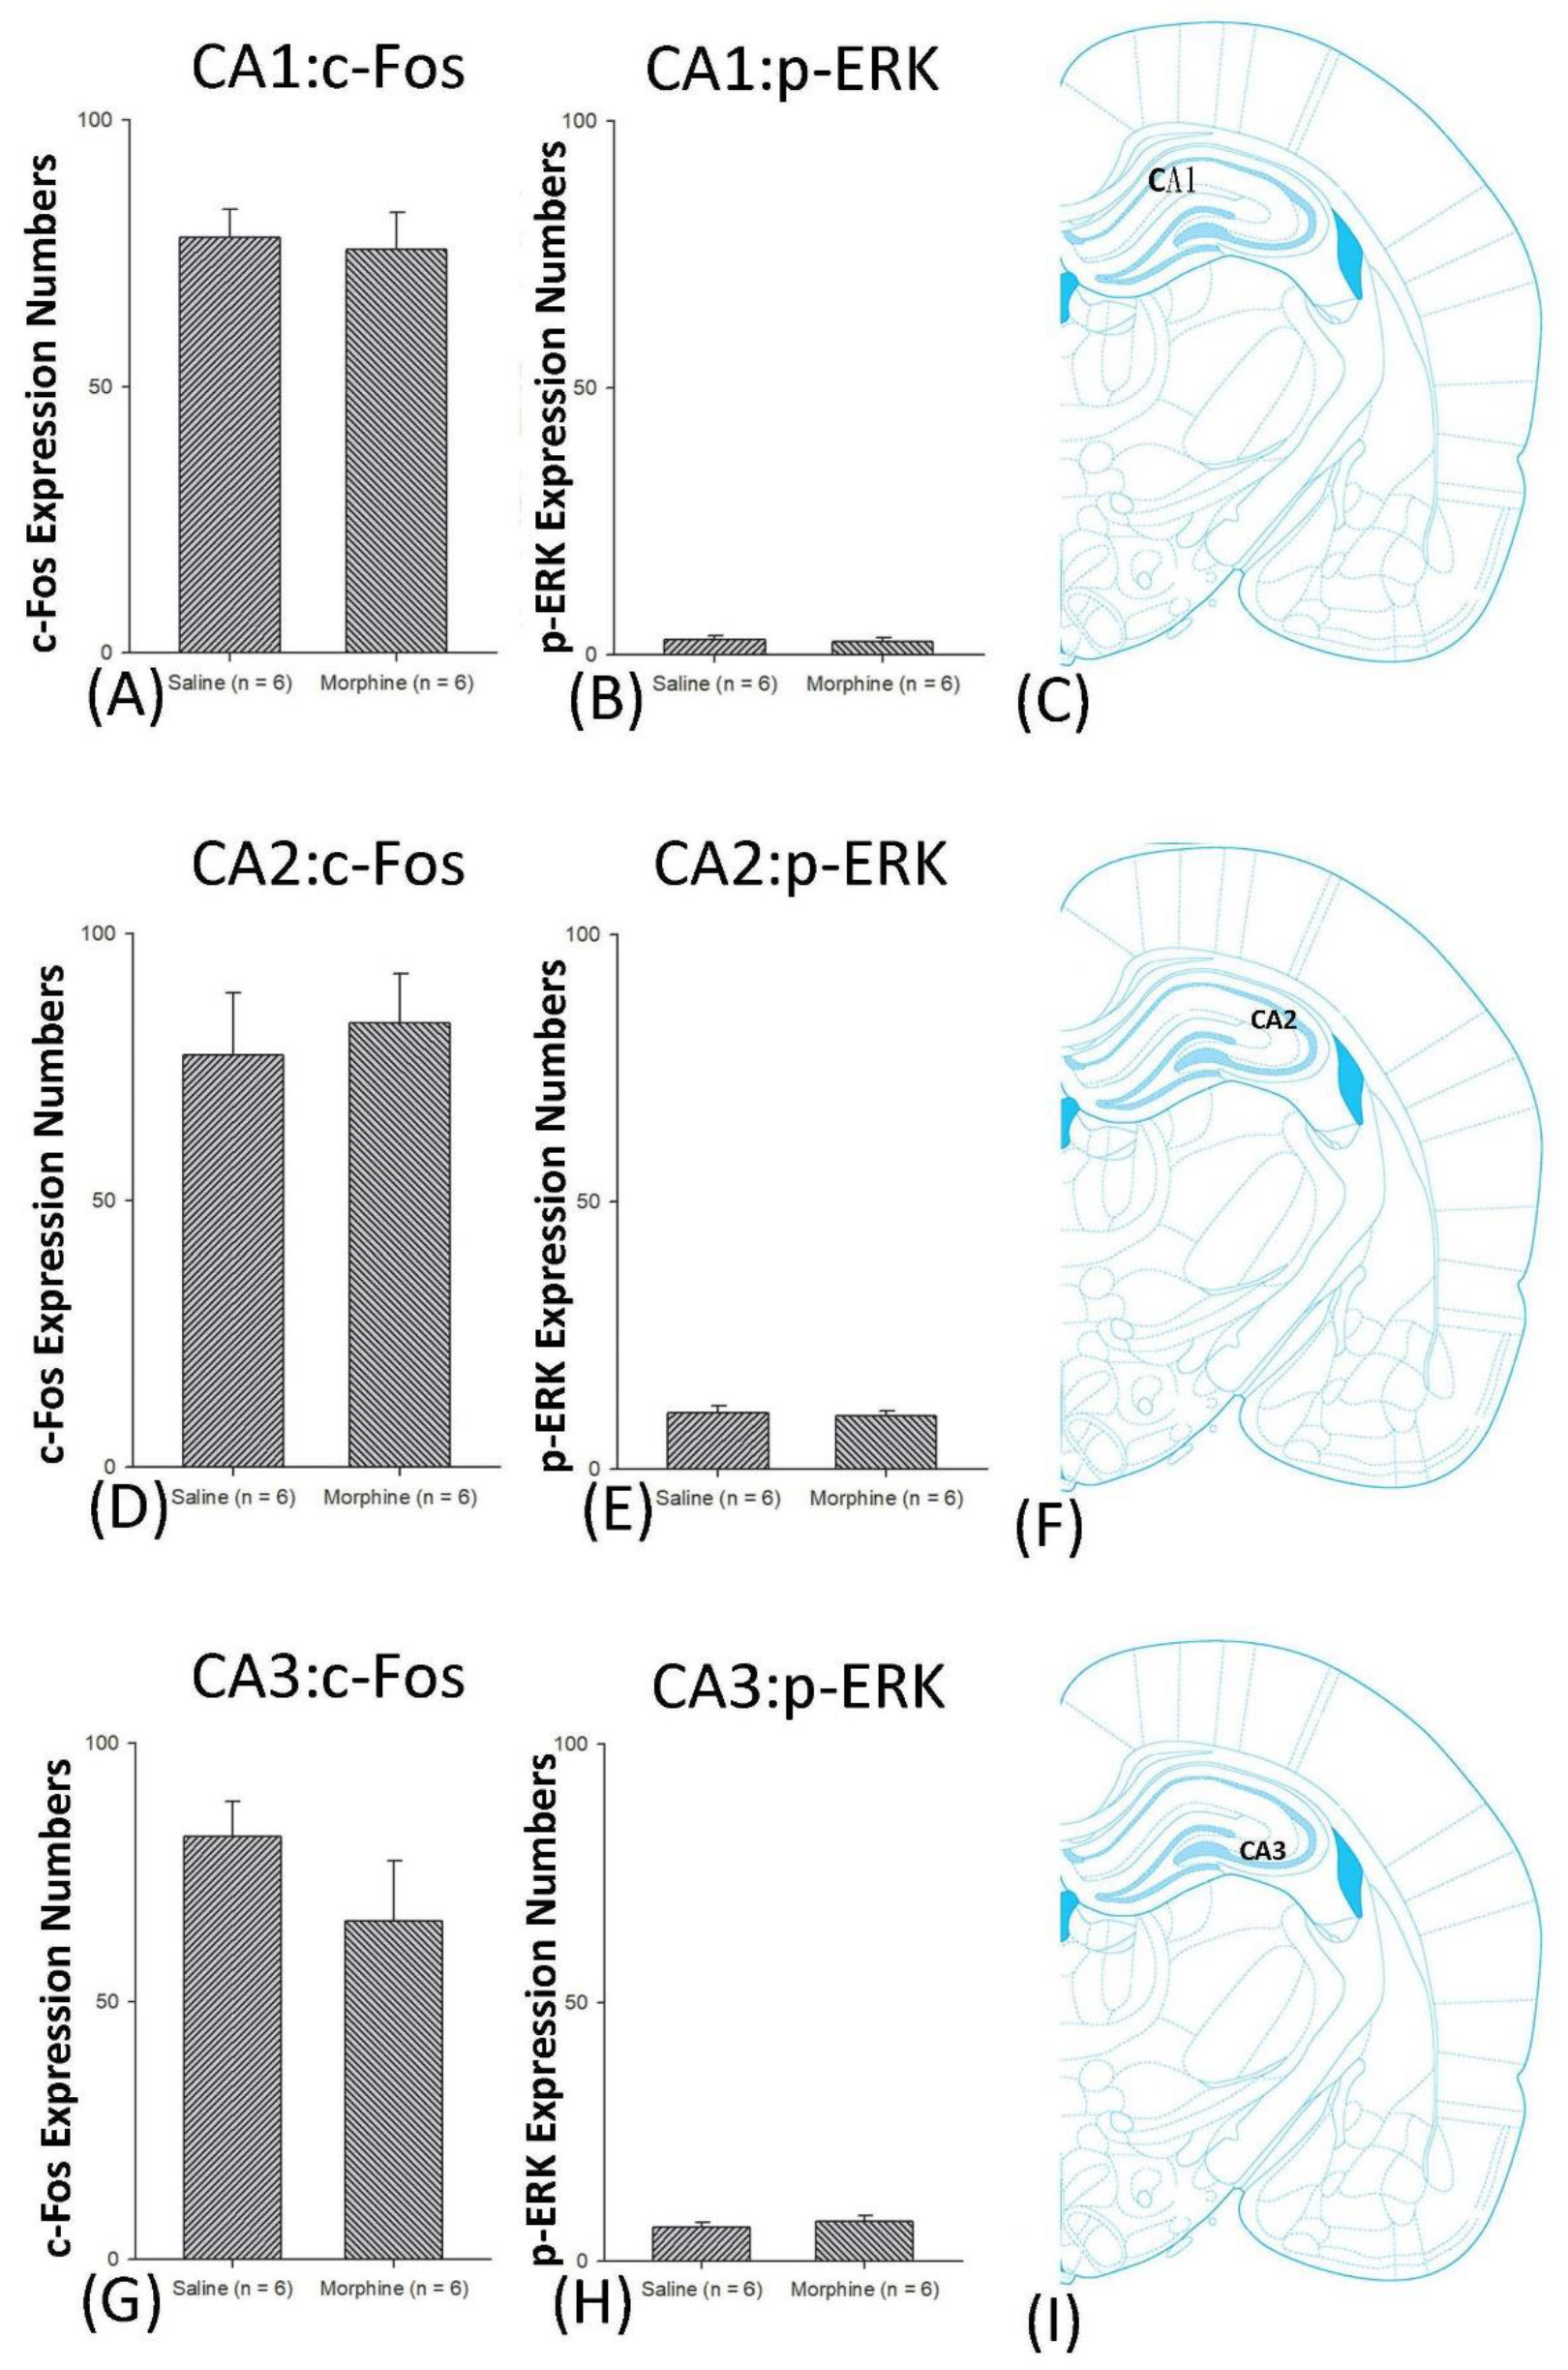
3.4. Which Neural Substrates Mediate CTA by Morphinein Conditioning, Extinction, and Reinstatement?
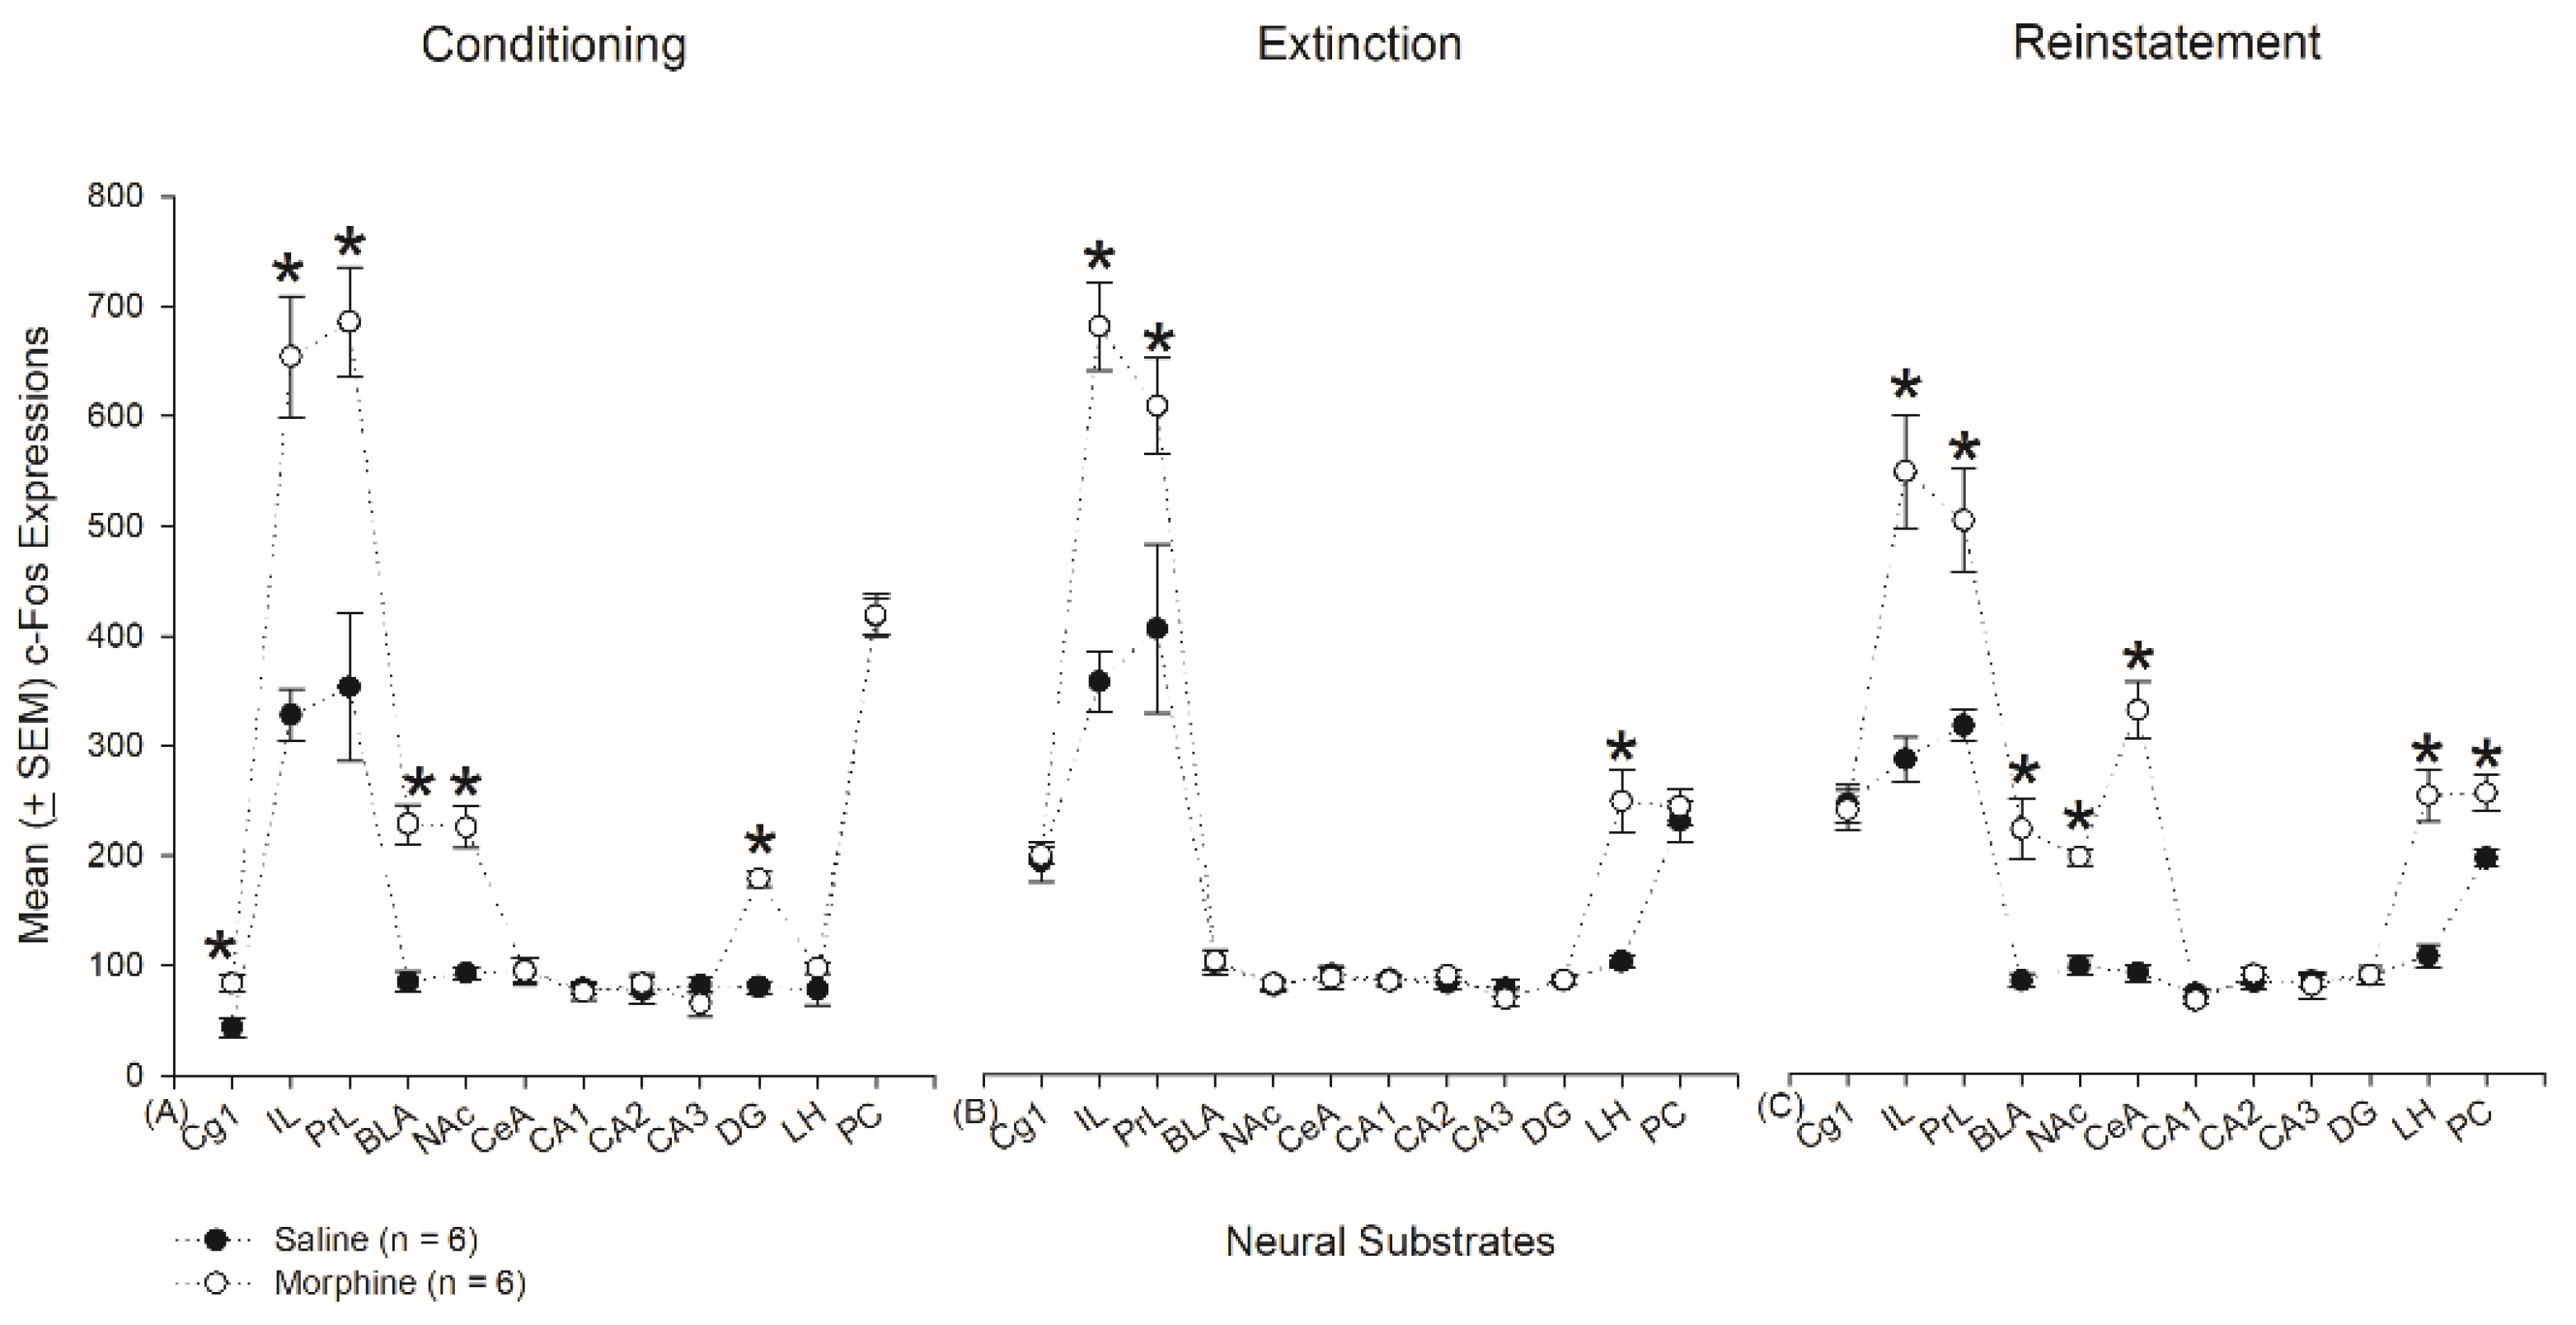
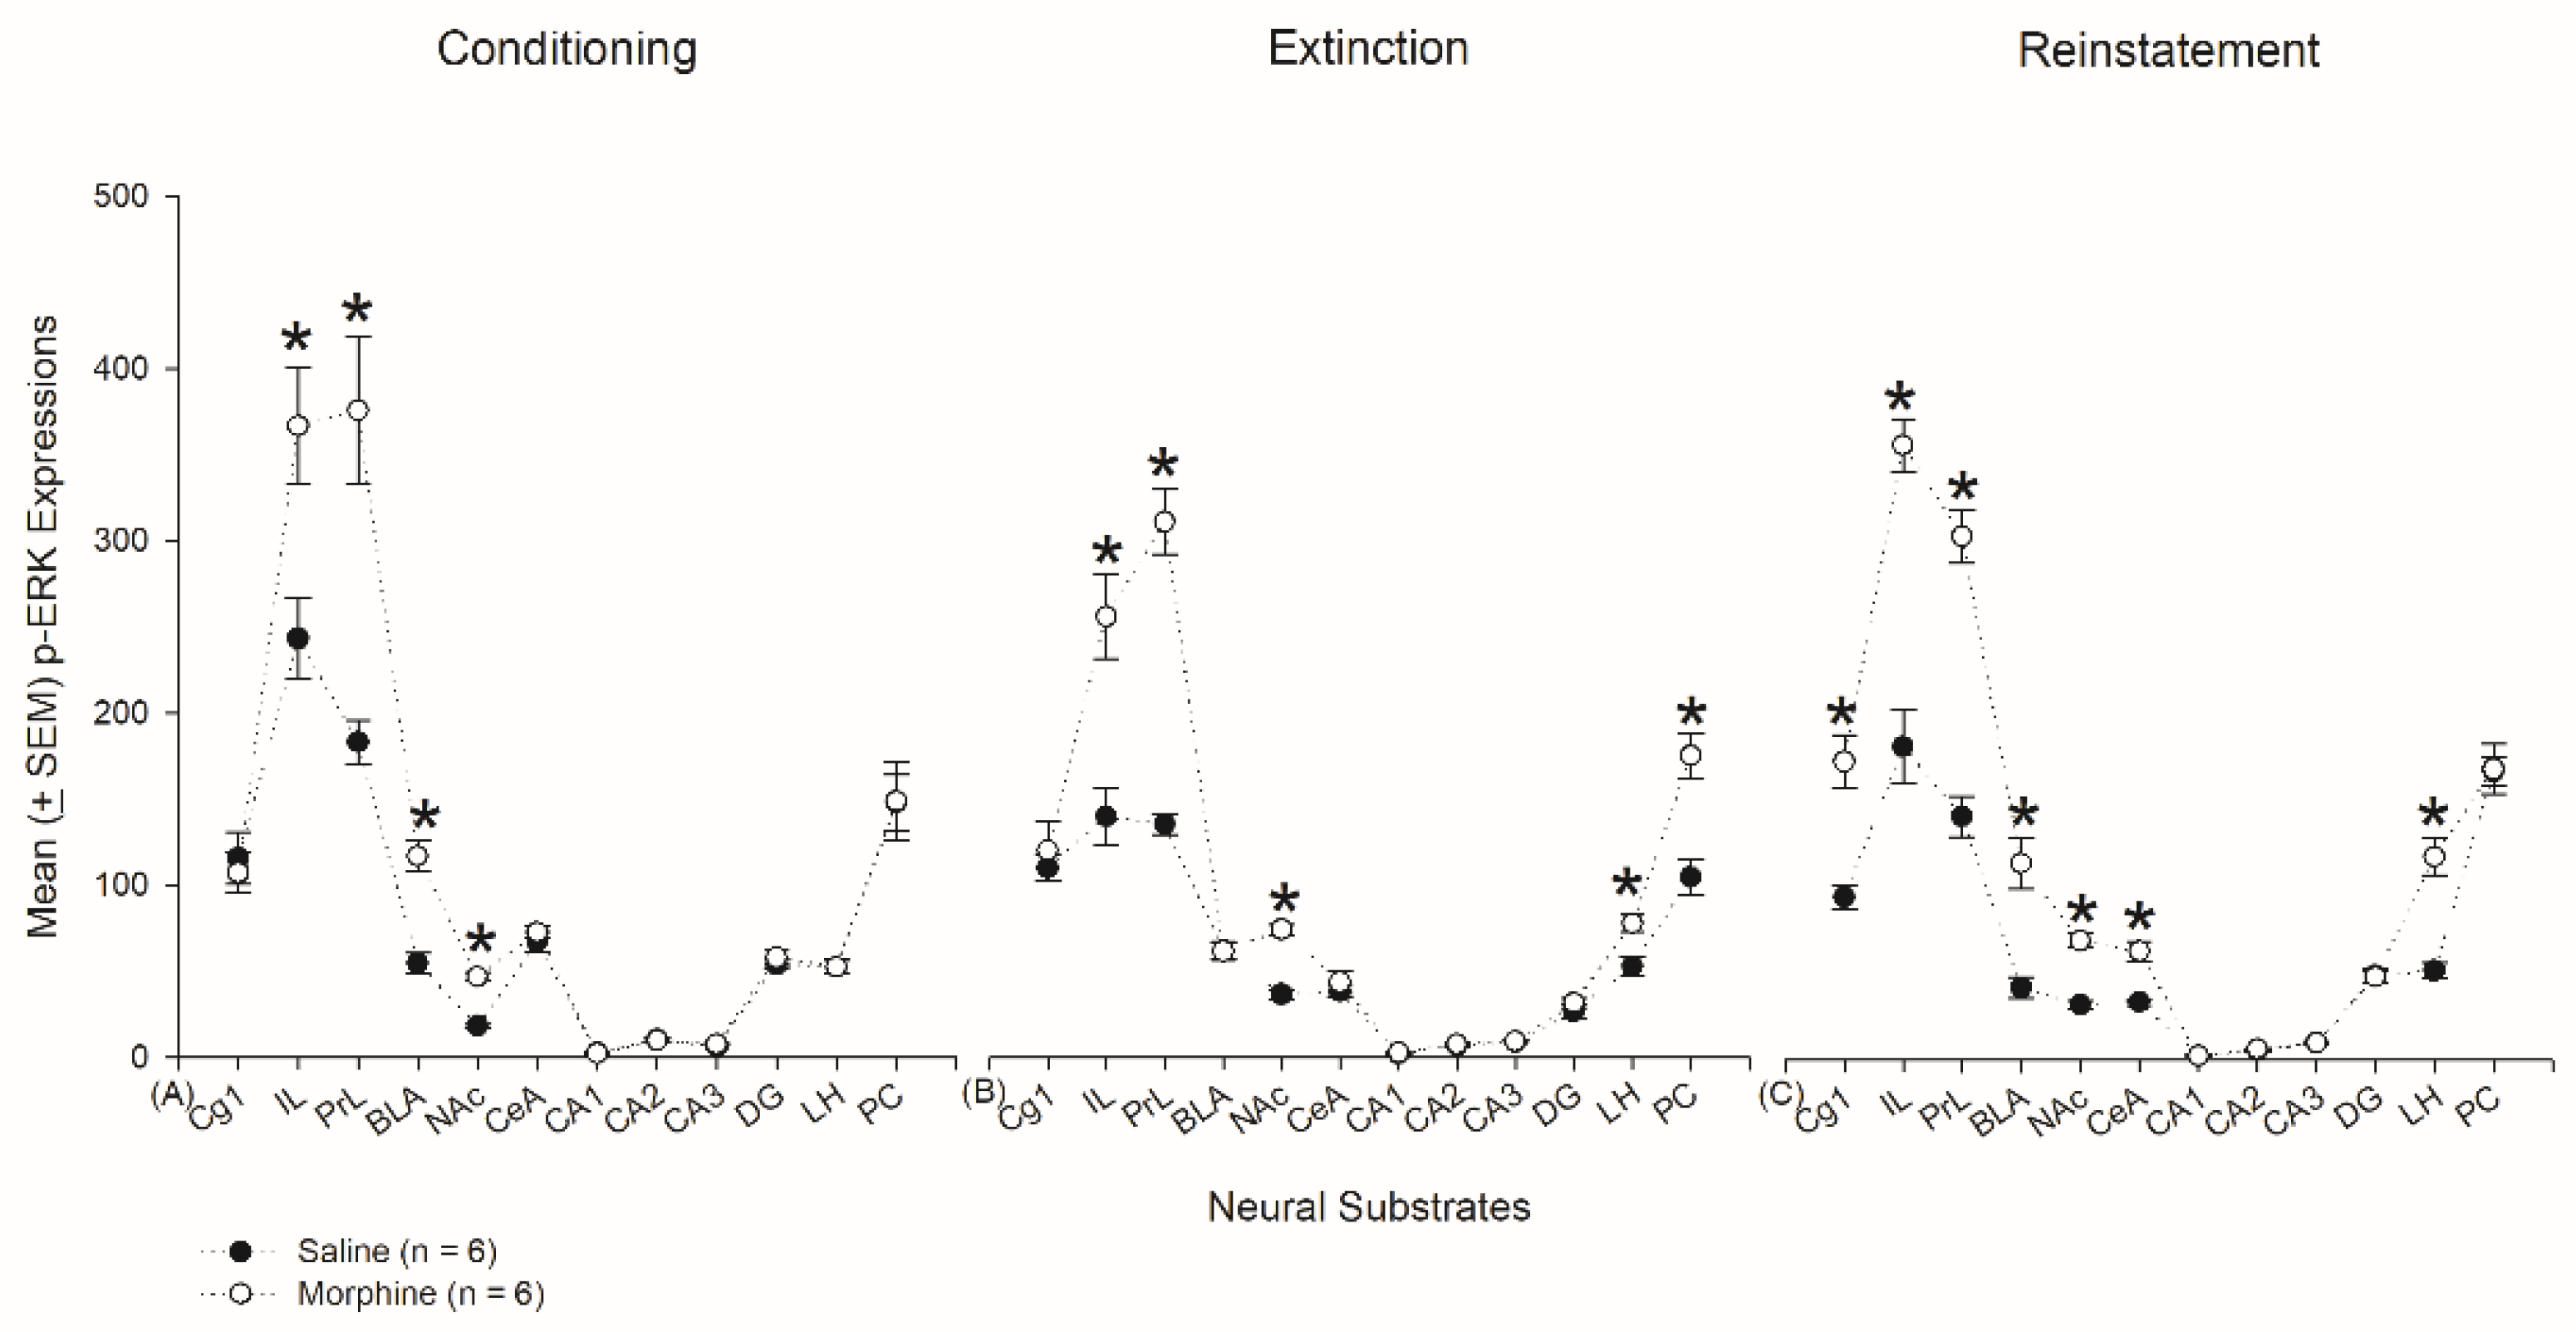
3.4.1. Conditioning Phase
3.4.2. Extinction Phase
3.4.3. Reinstatement Phase
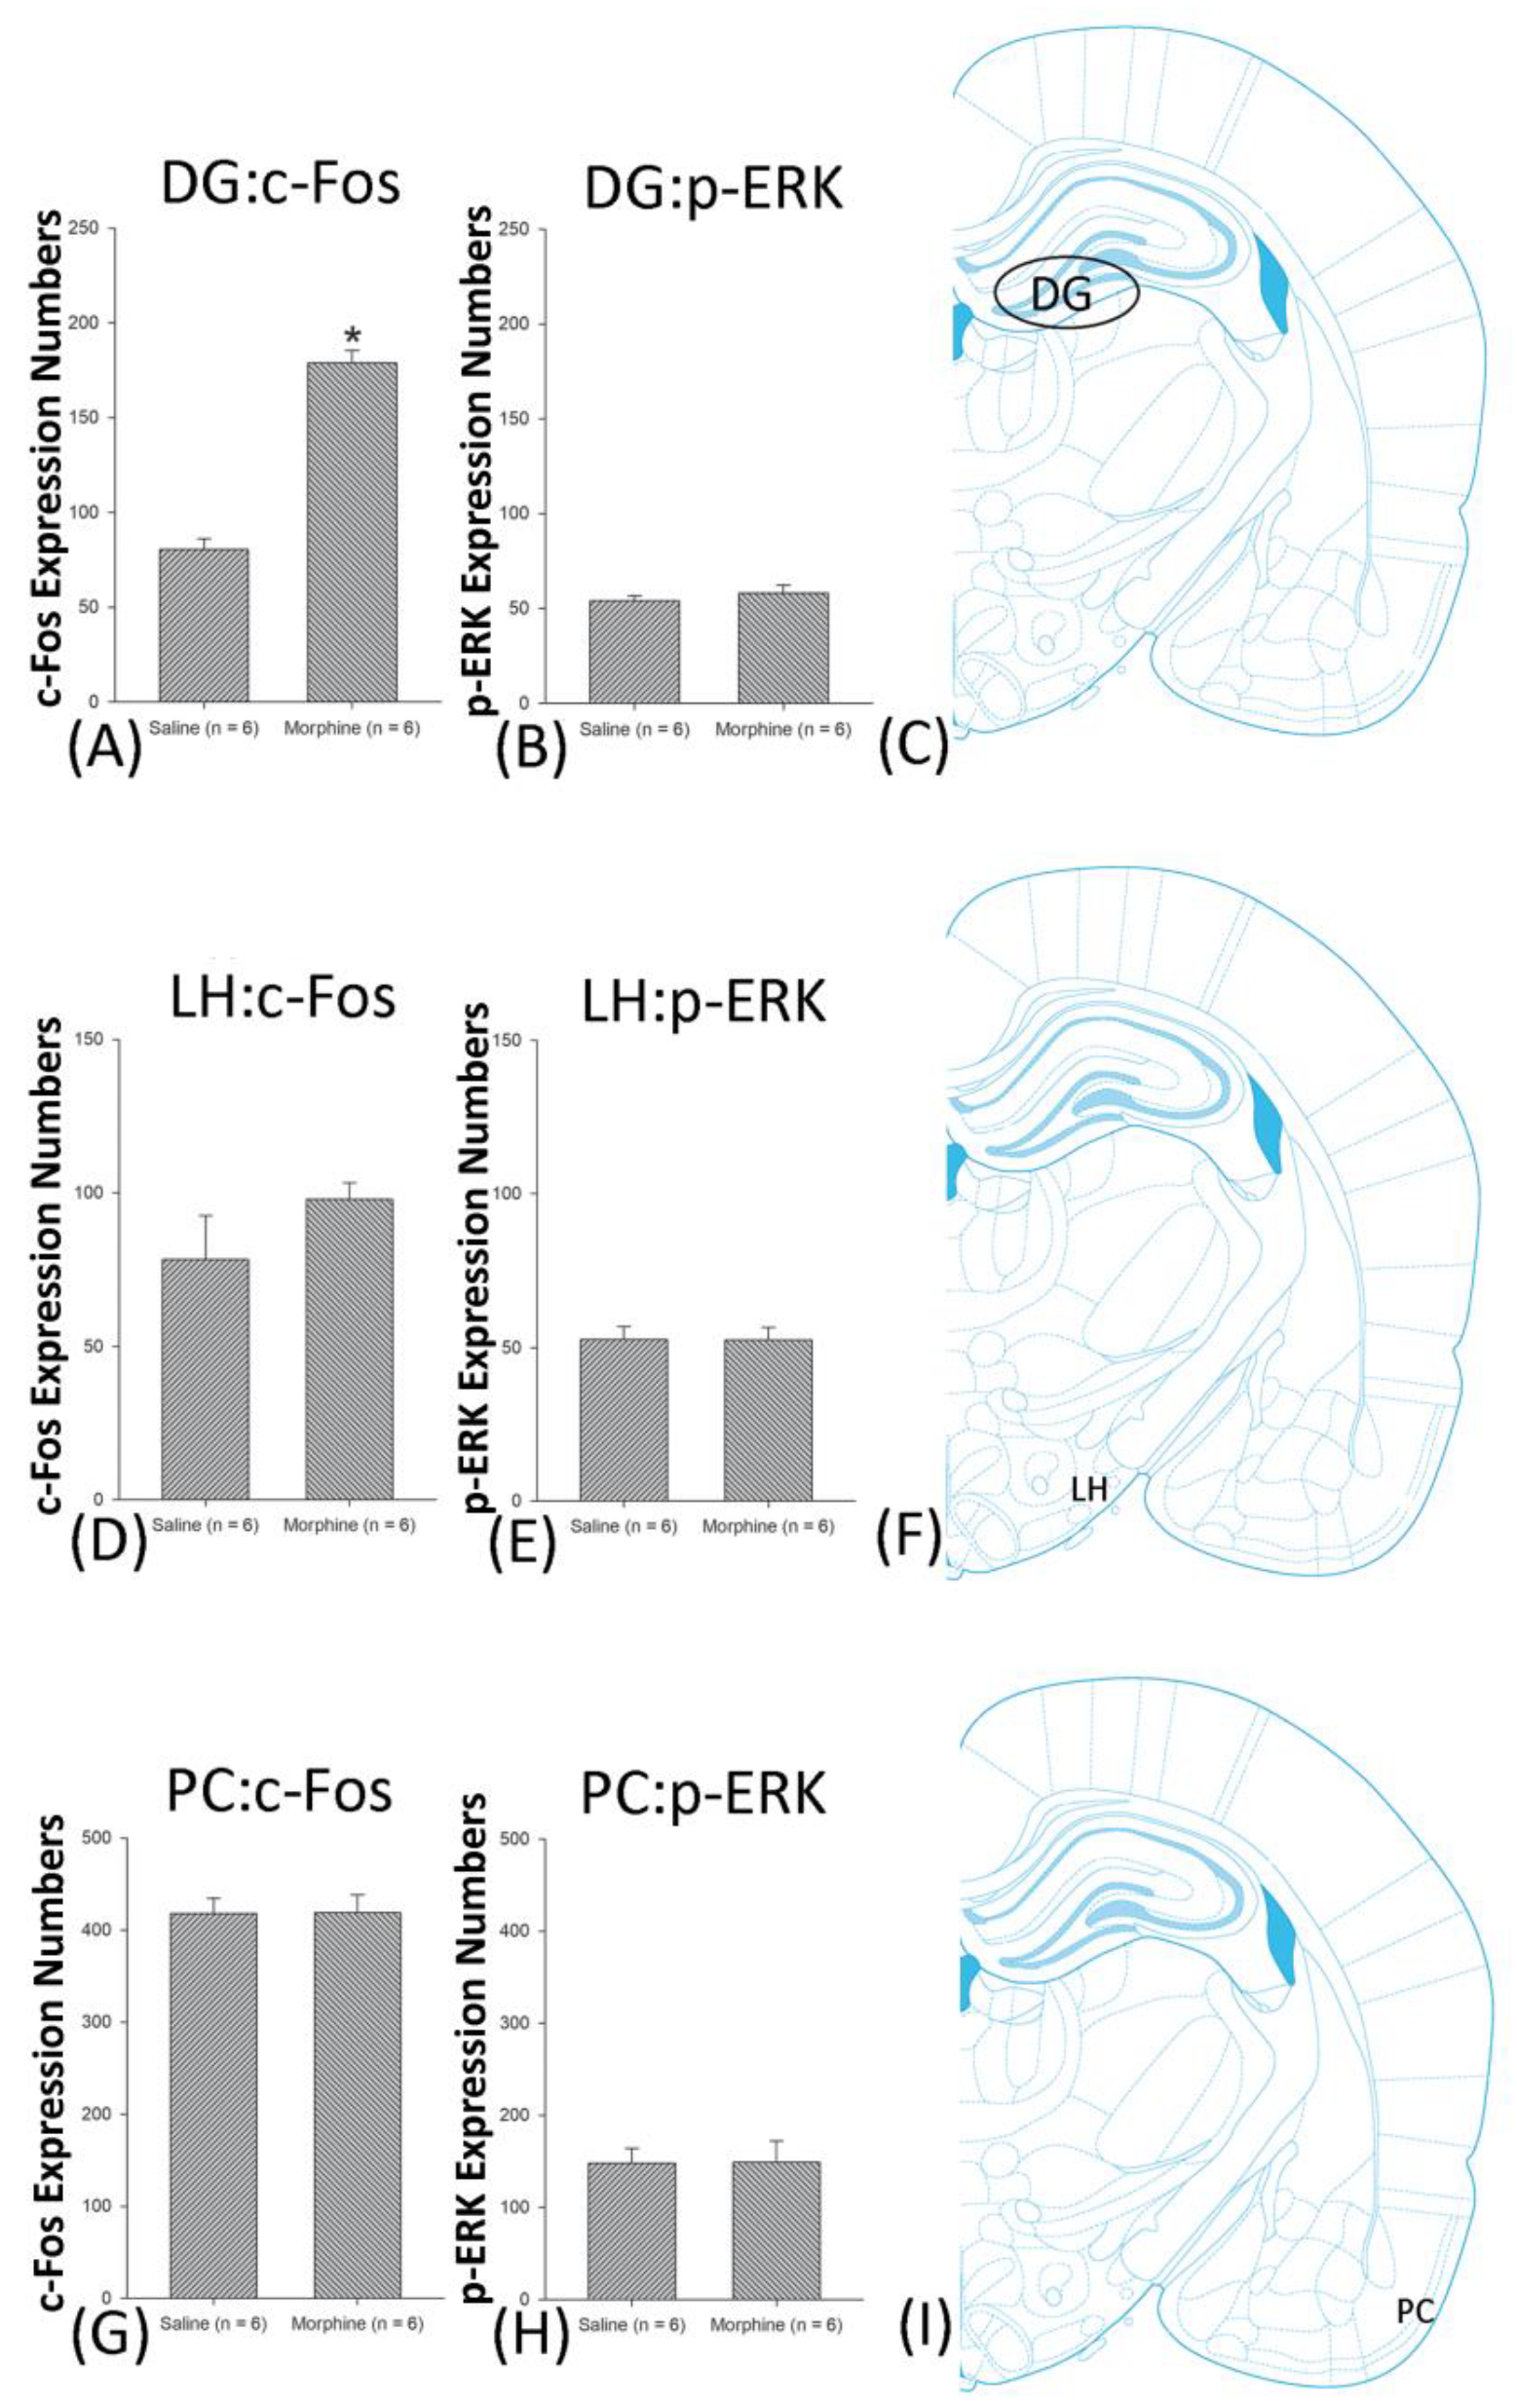
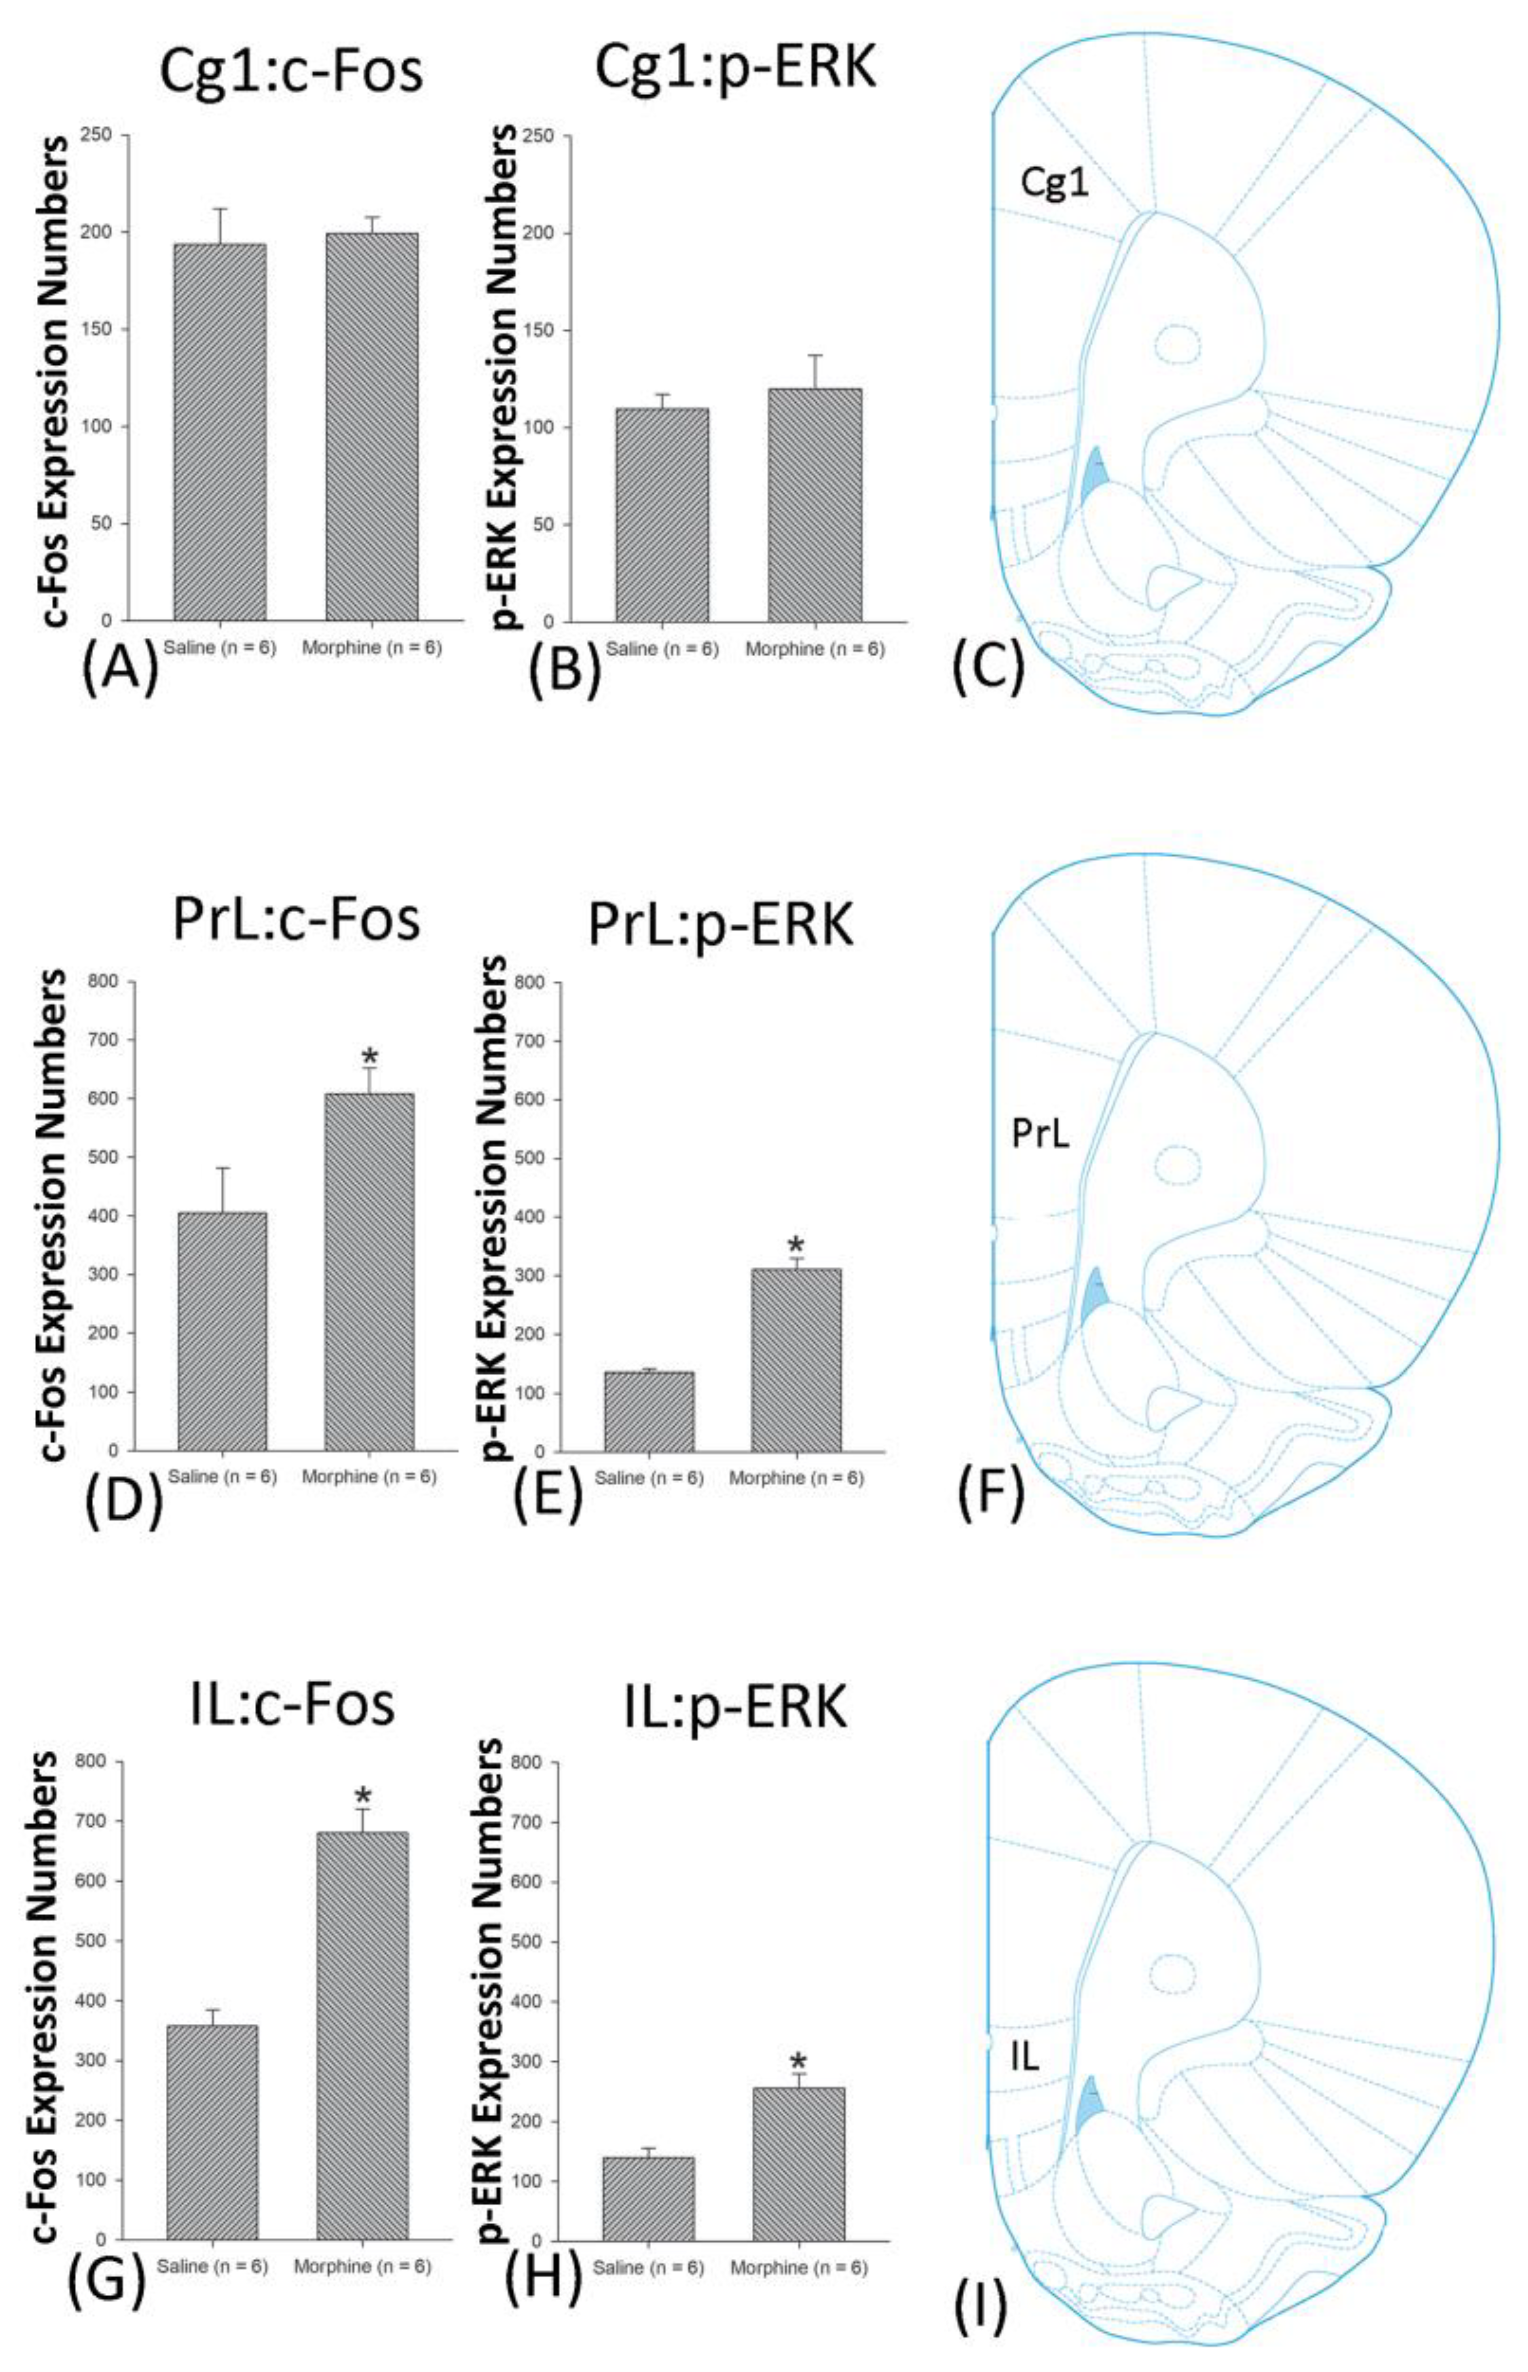
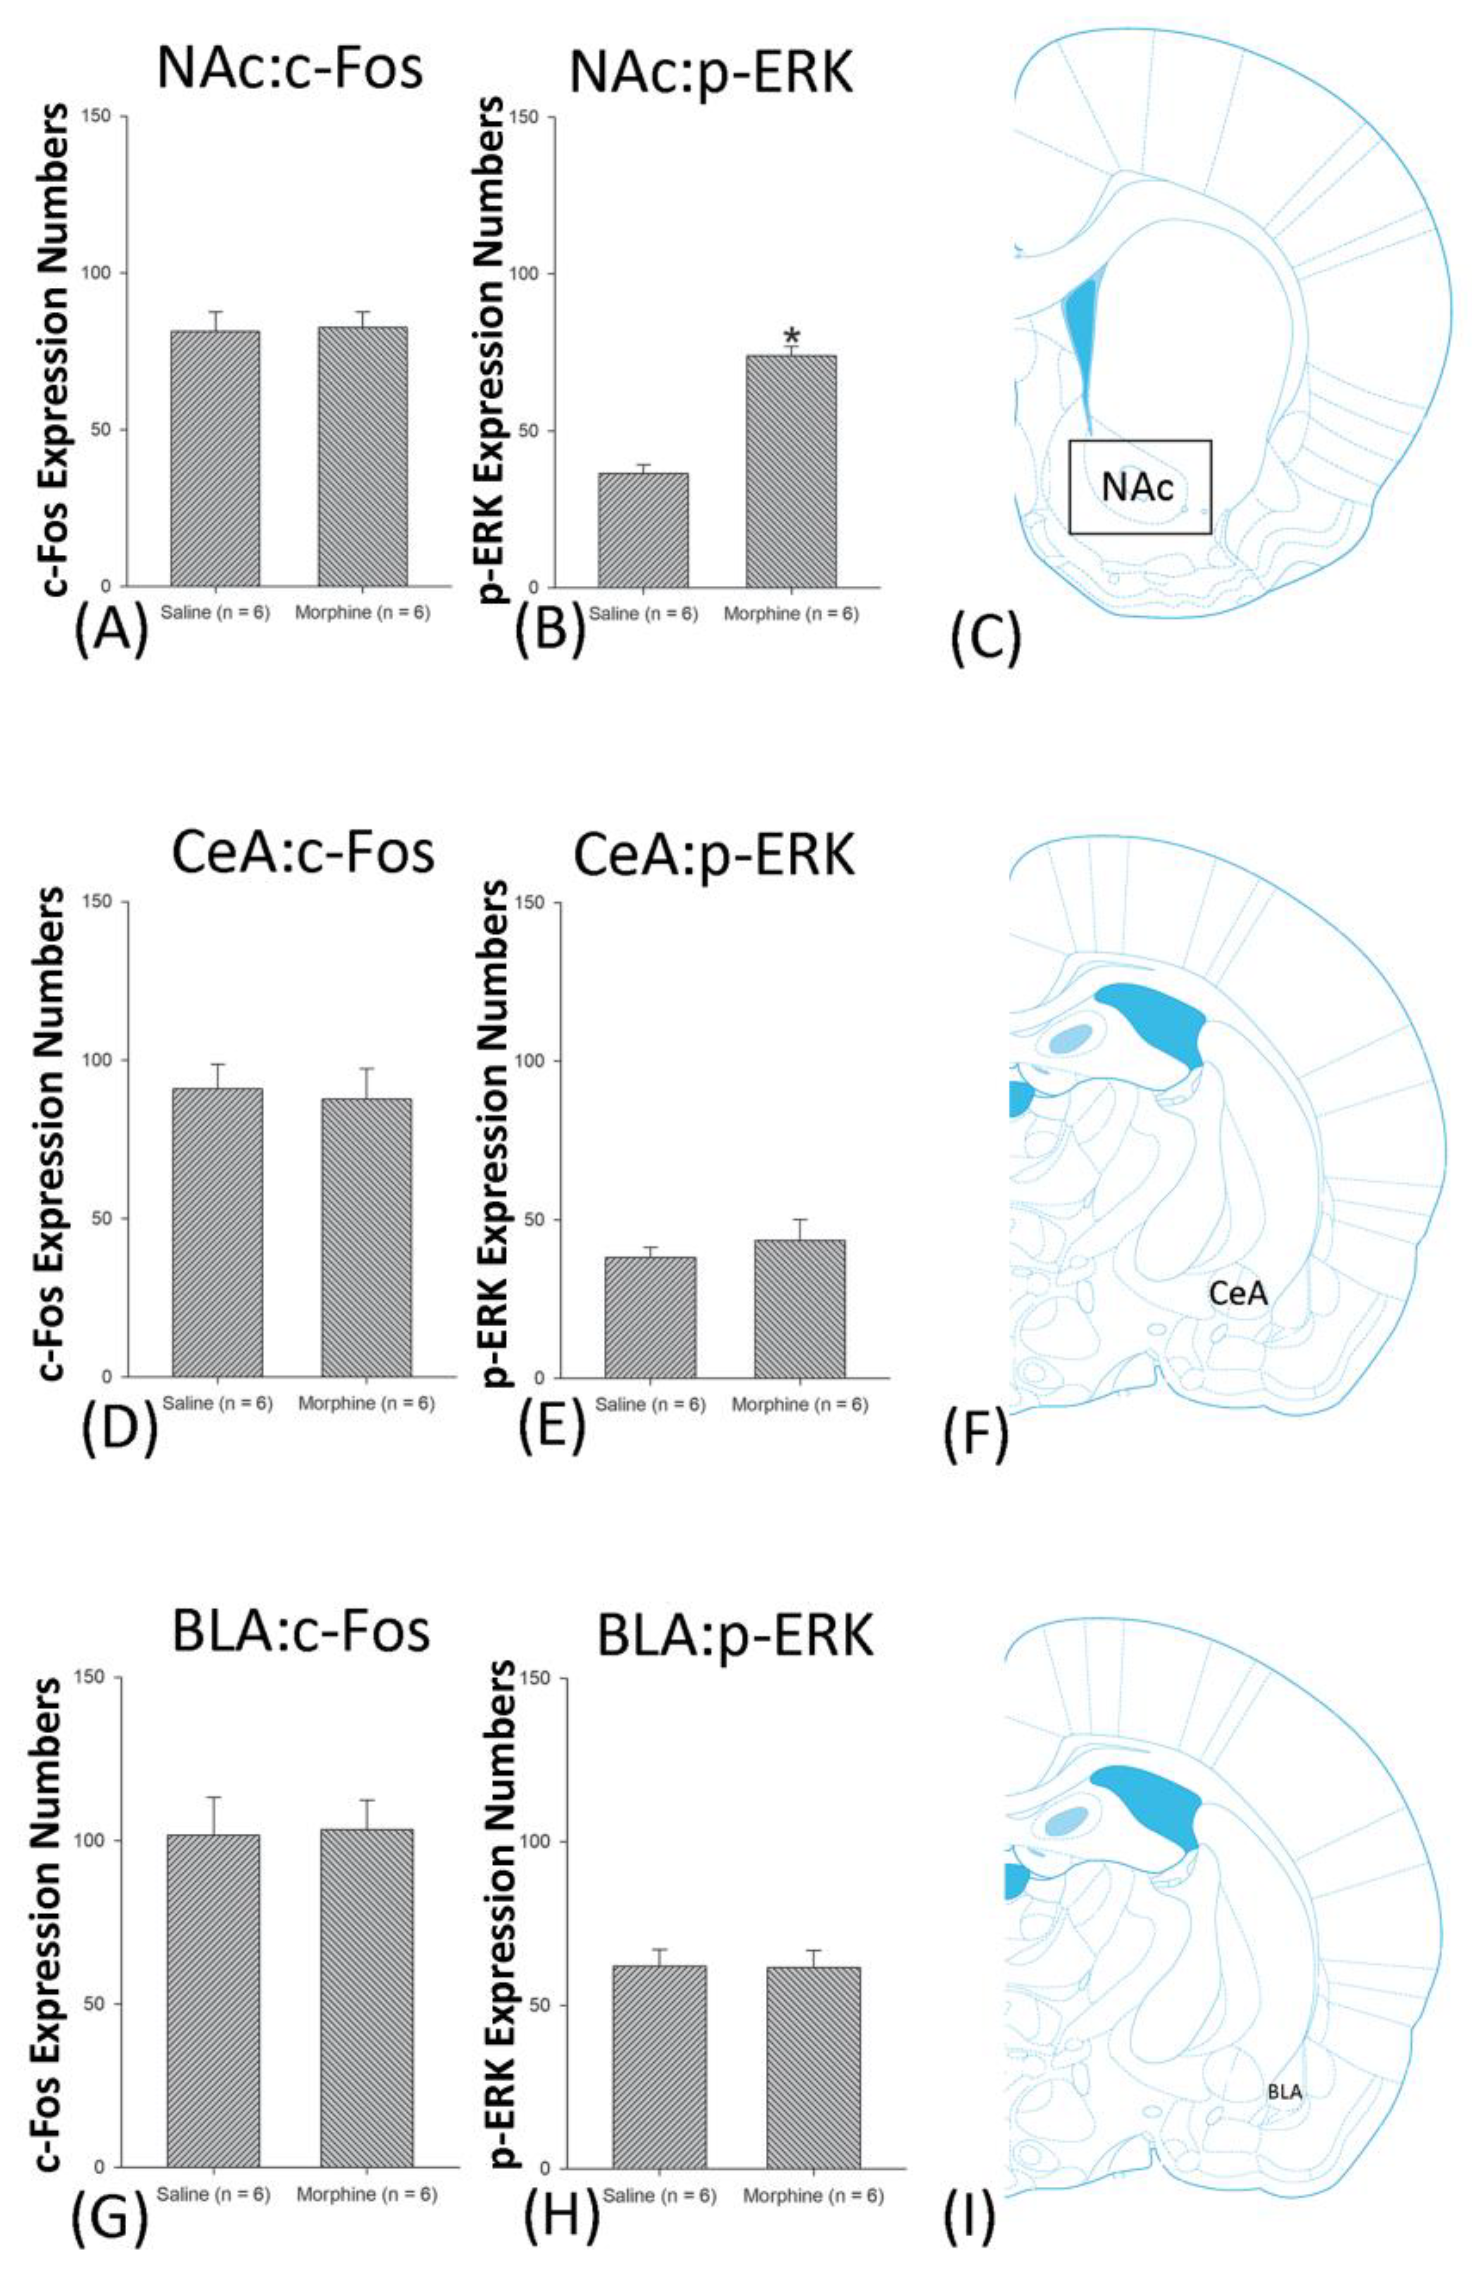
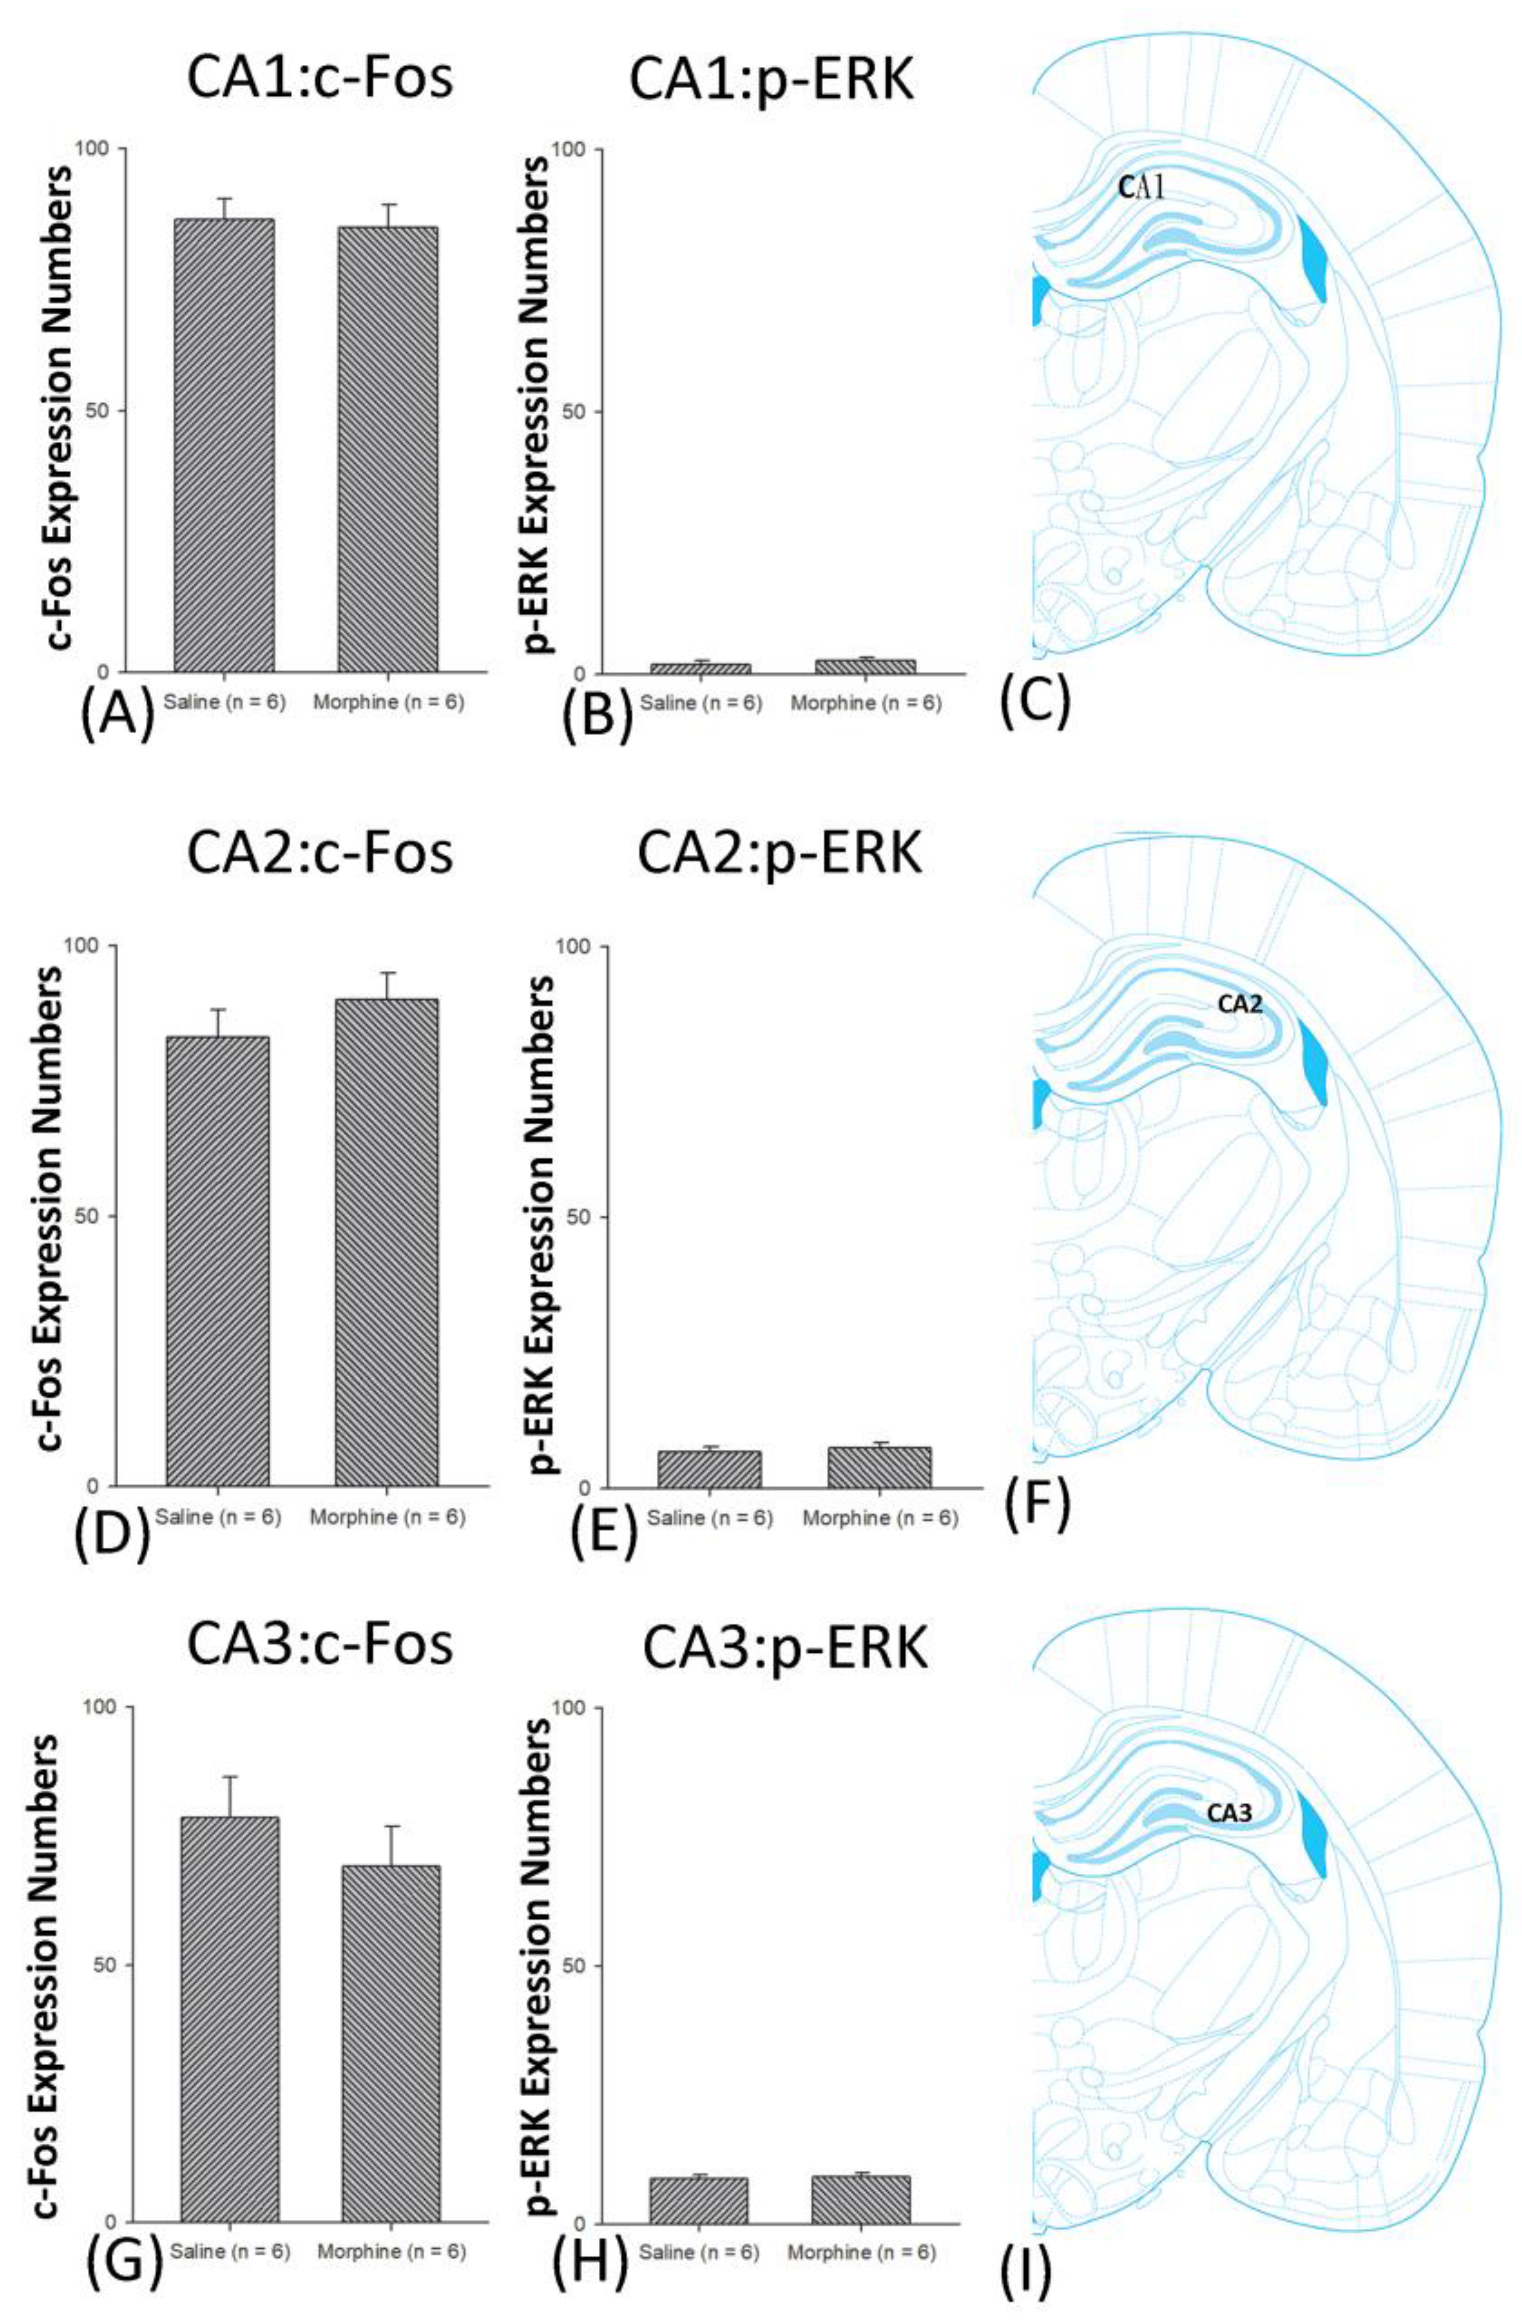
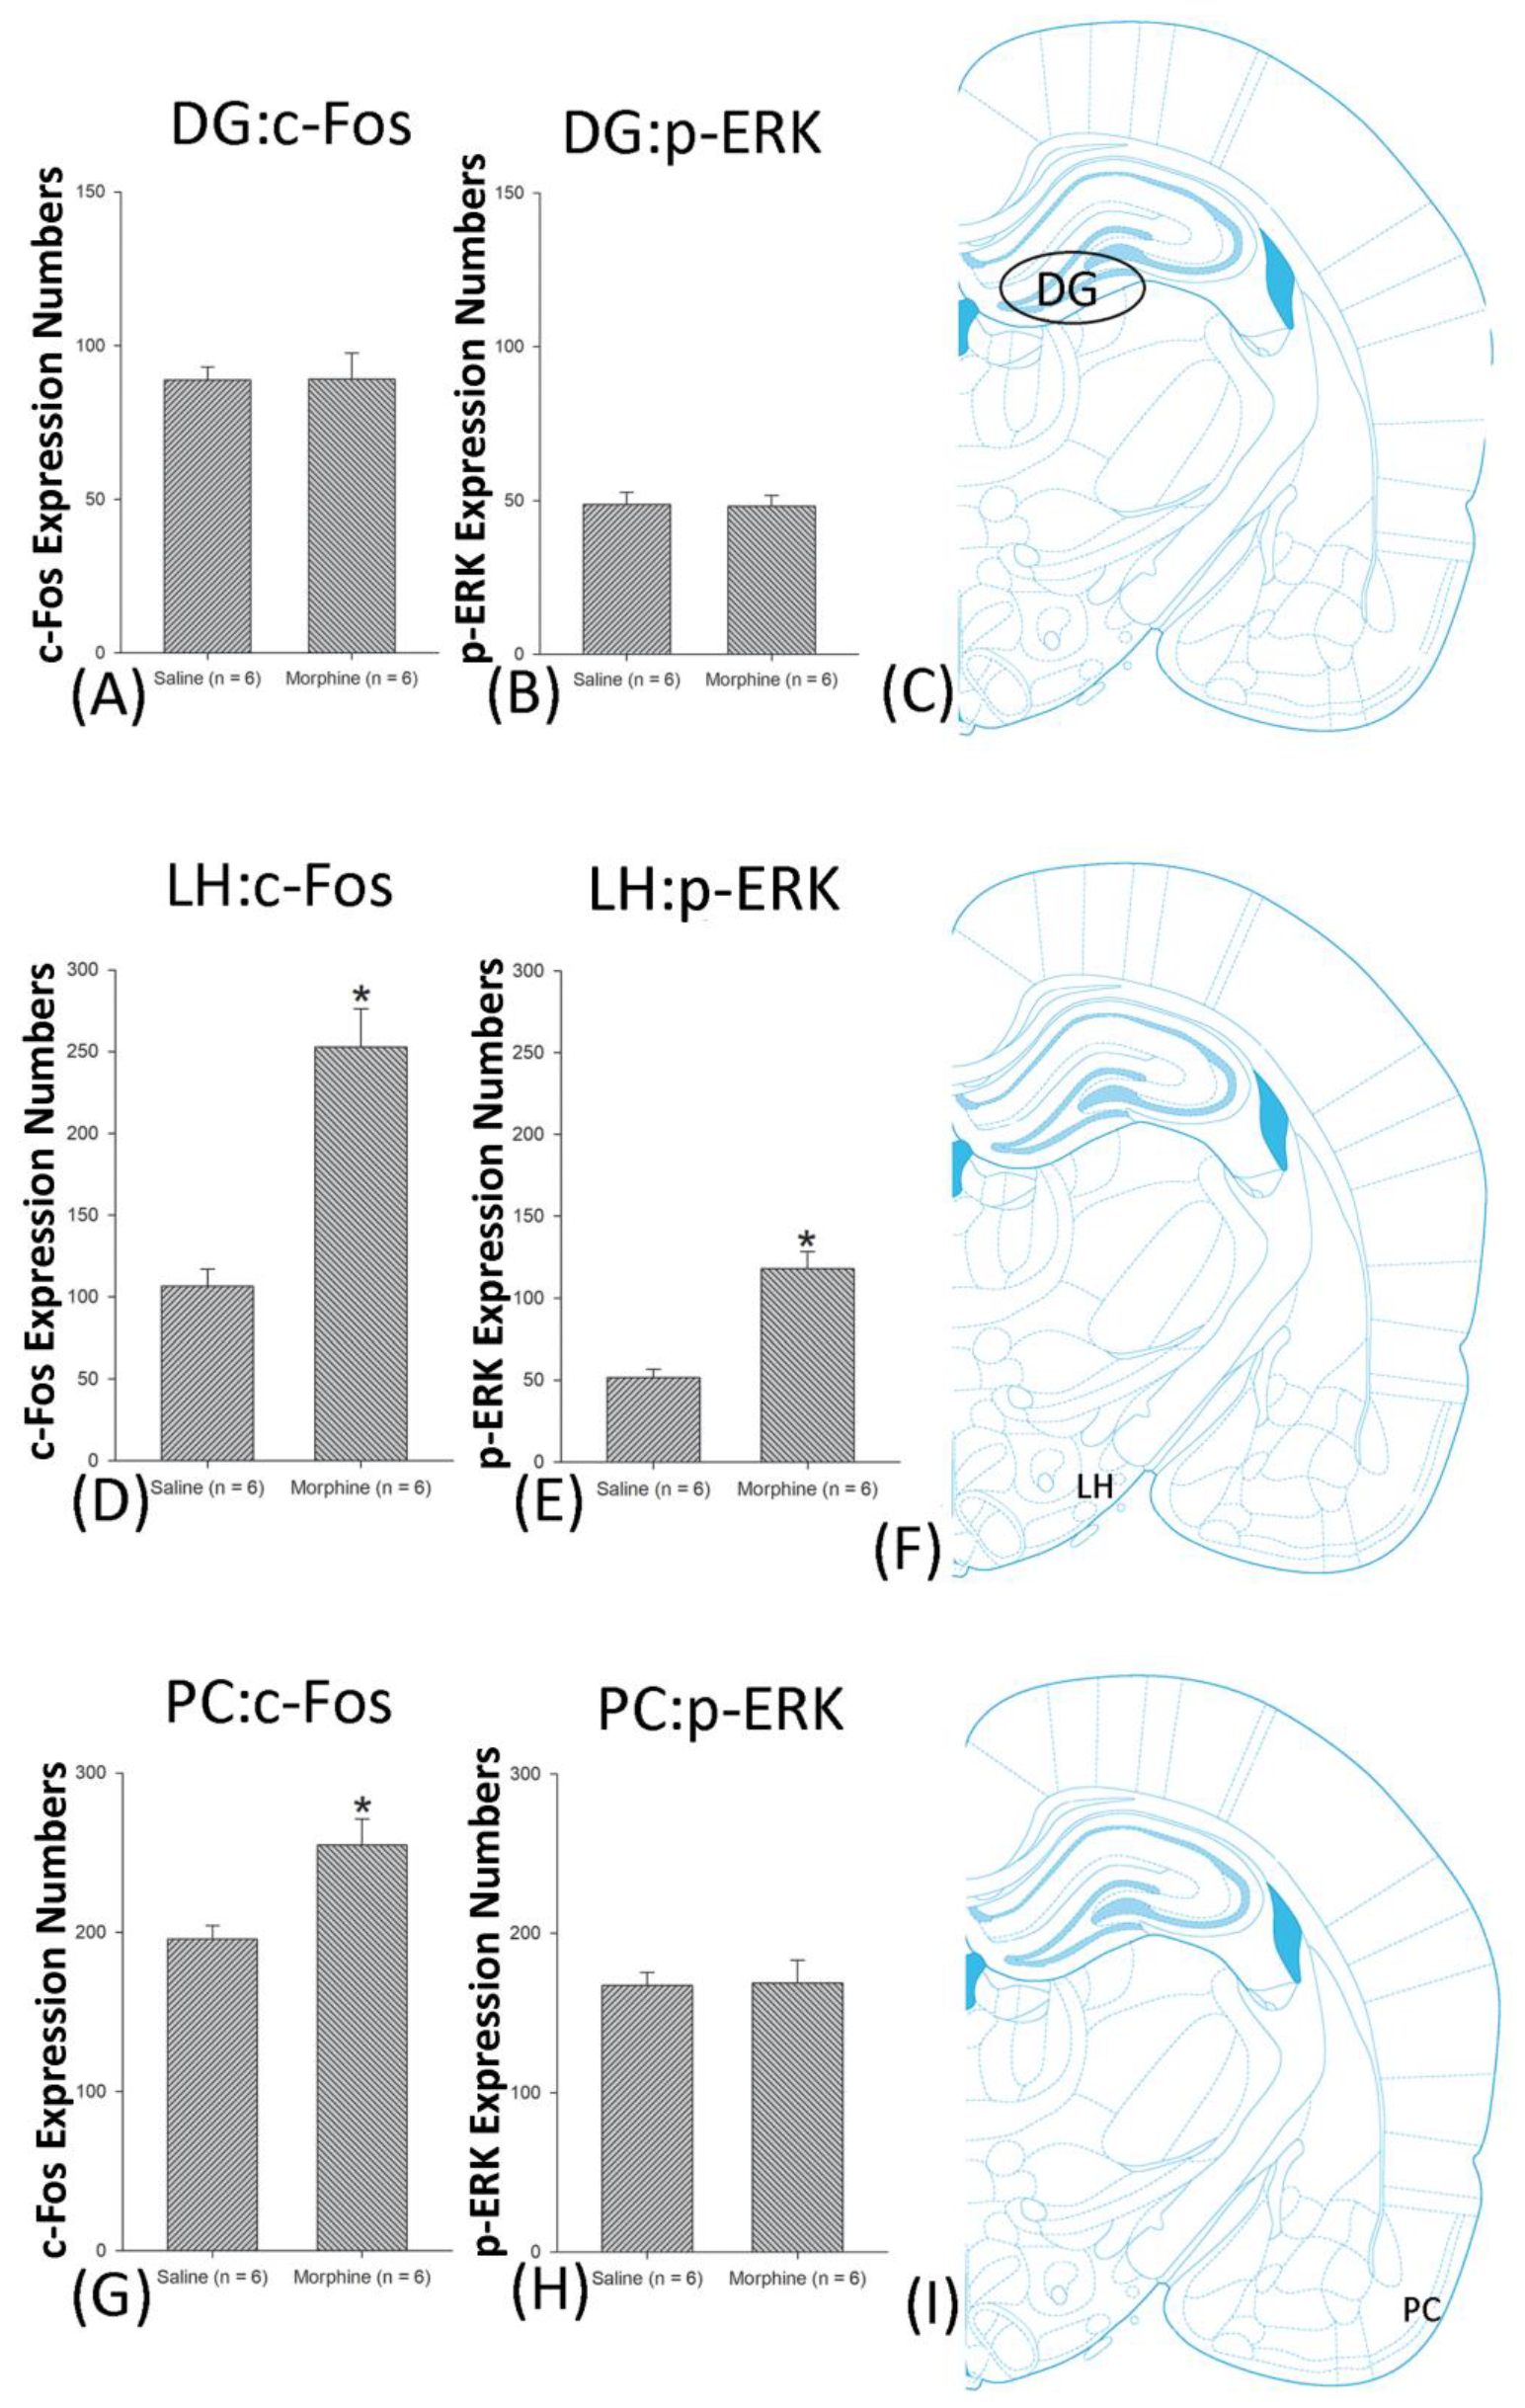
3.5. Homeostasis: Assessing c-Fos Expressions on Conditioning, Extinction, and Reinstatement
3.6. Homeostasis: Assessing p-ERKExpressions on Conditioning, Extinction, and Reinstatement
4. Discussion
4.1. Debate Issue: Challenging the Reward Comparison Hypothesis
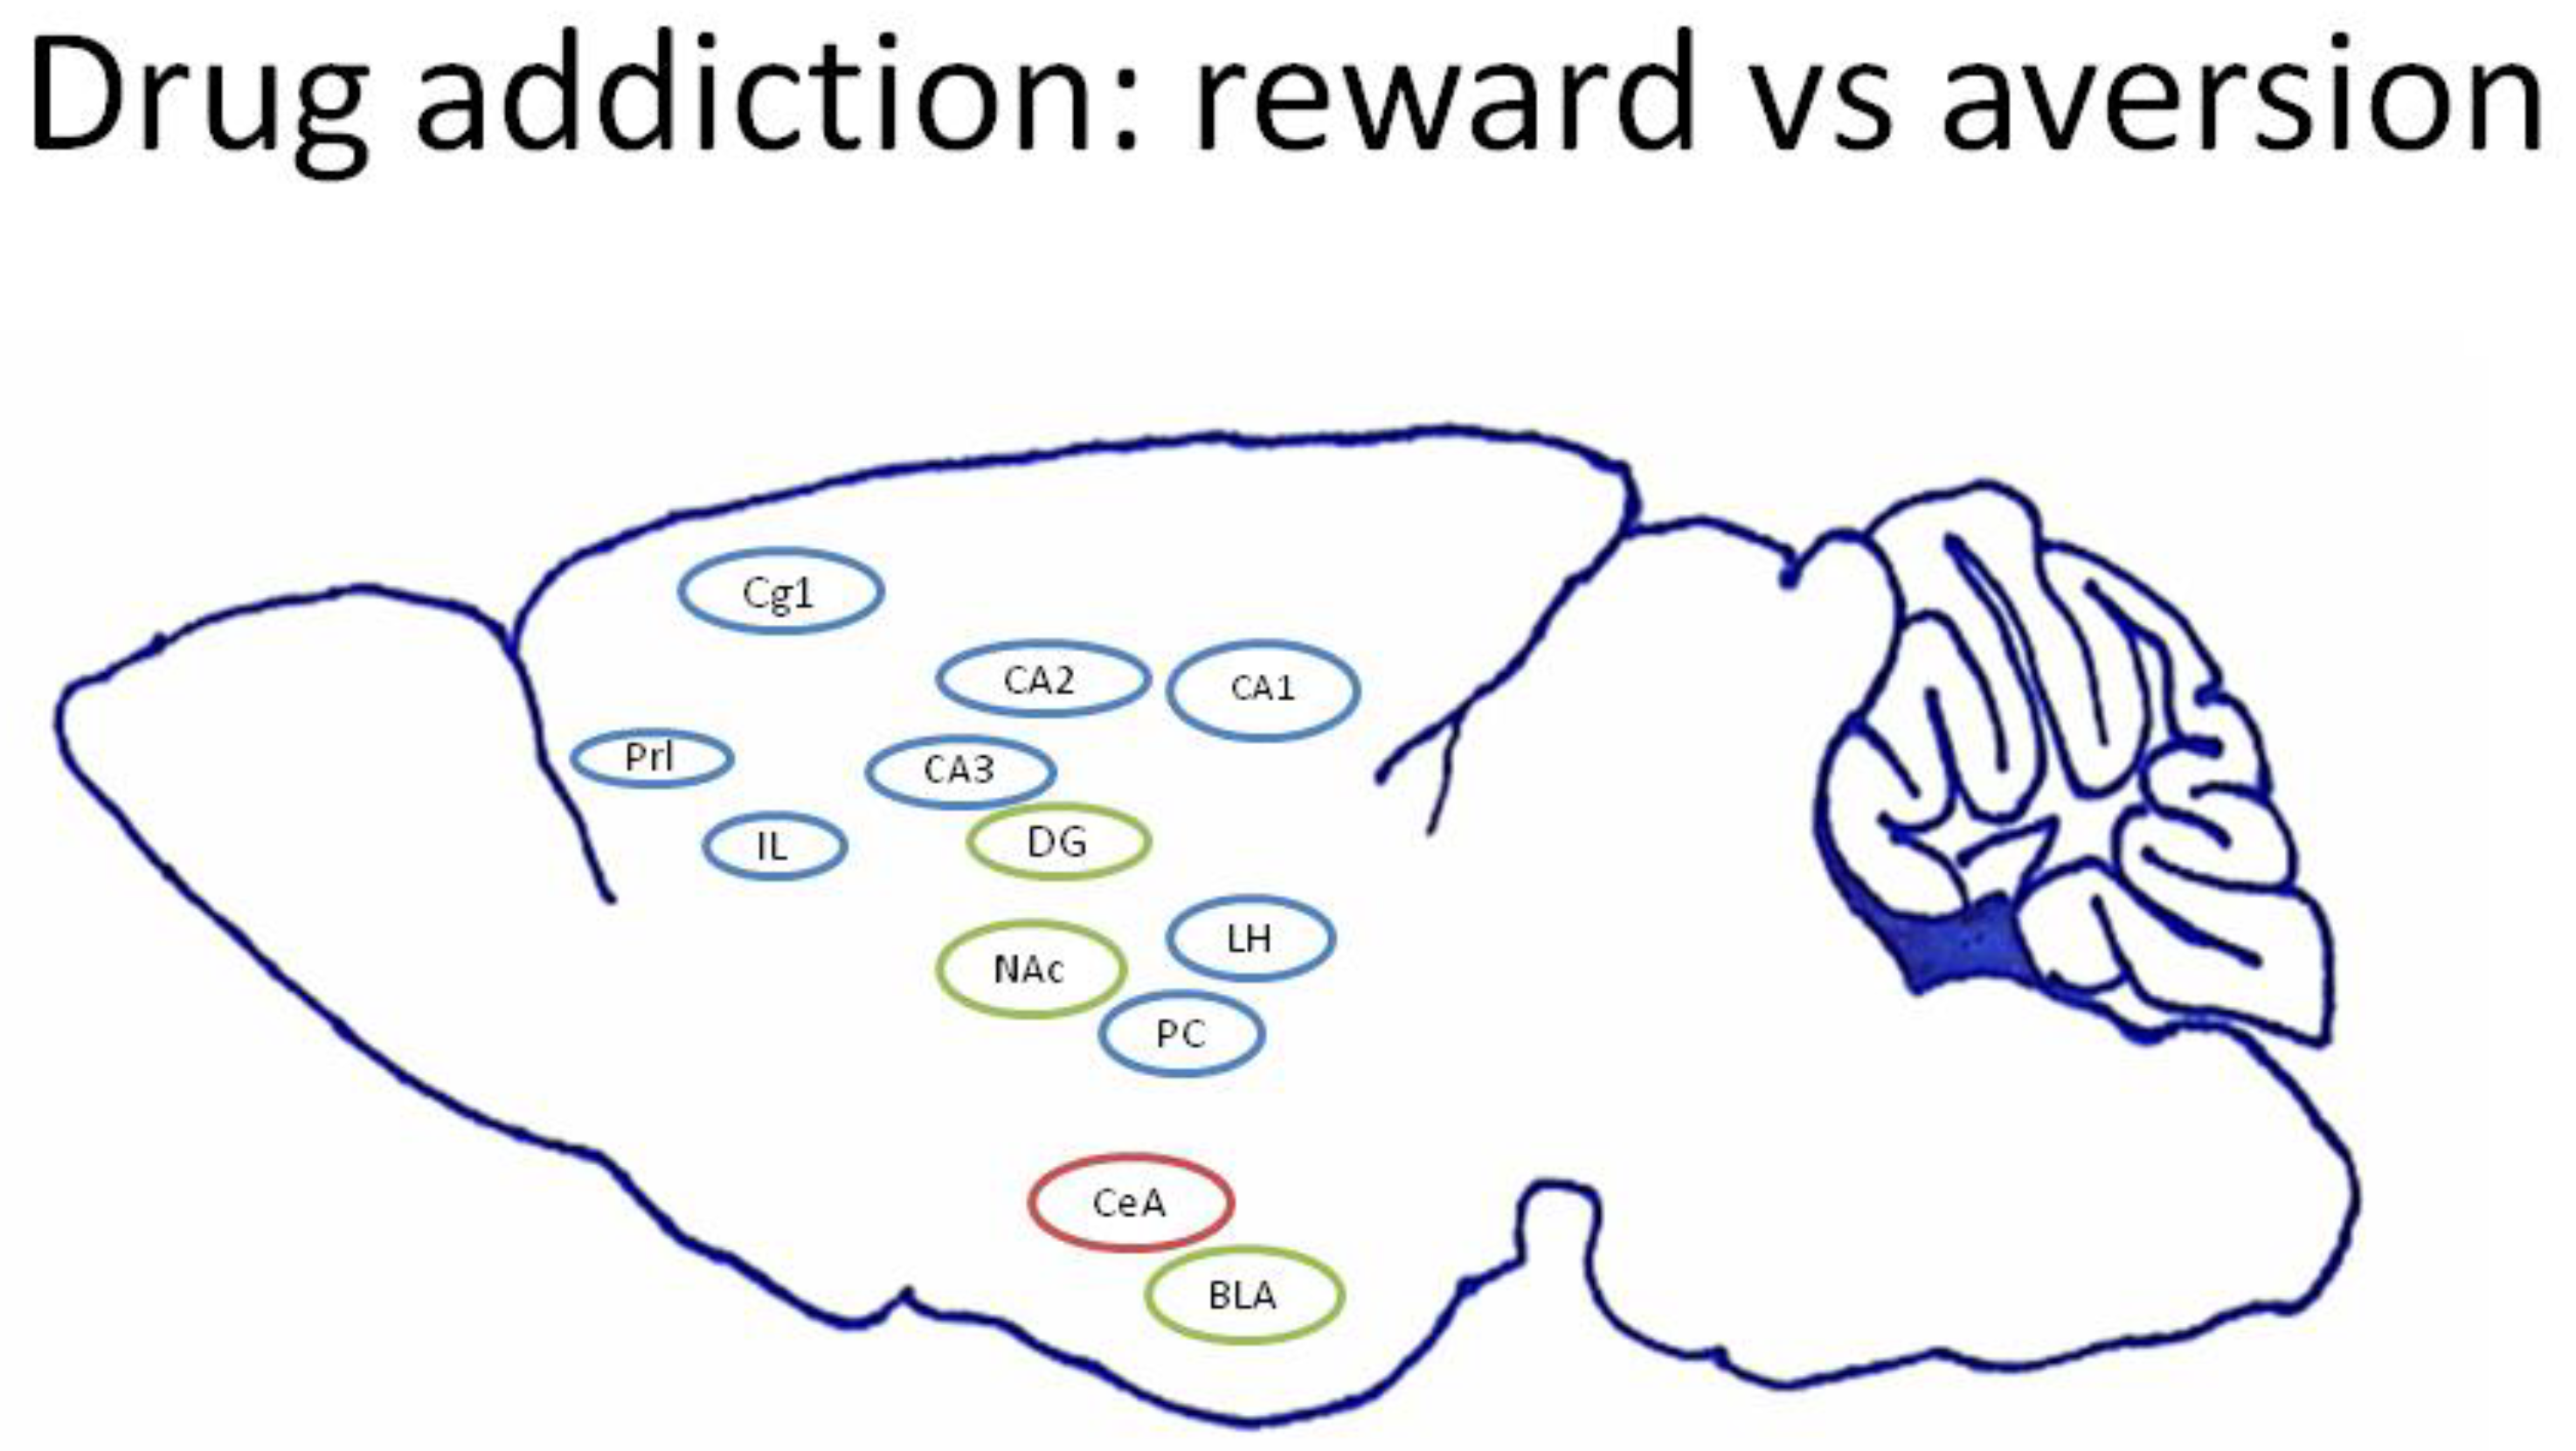
4.2. Current Viewpoints of Neural Substrates in Drug Addiction for Reward and Aversion
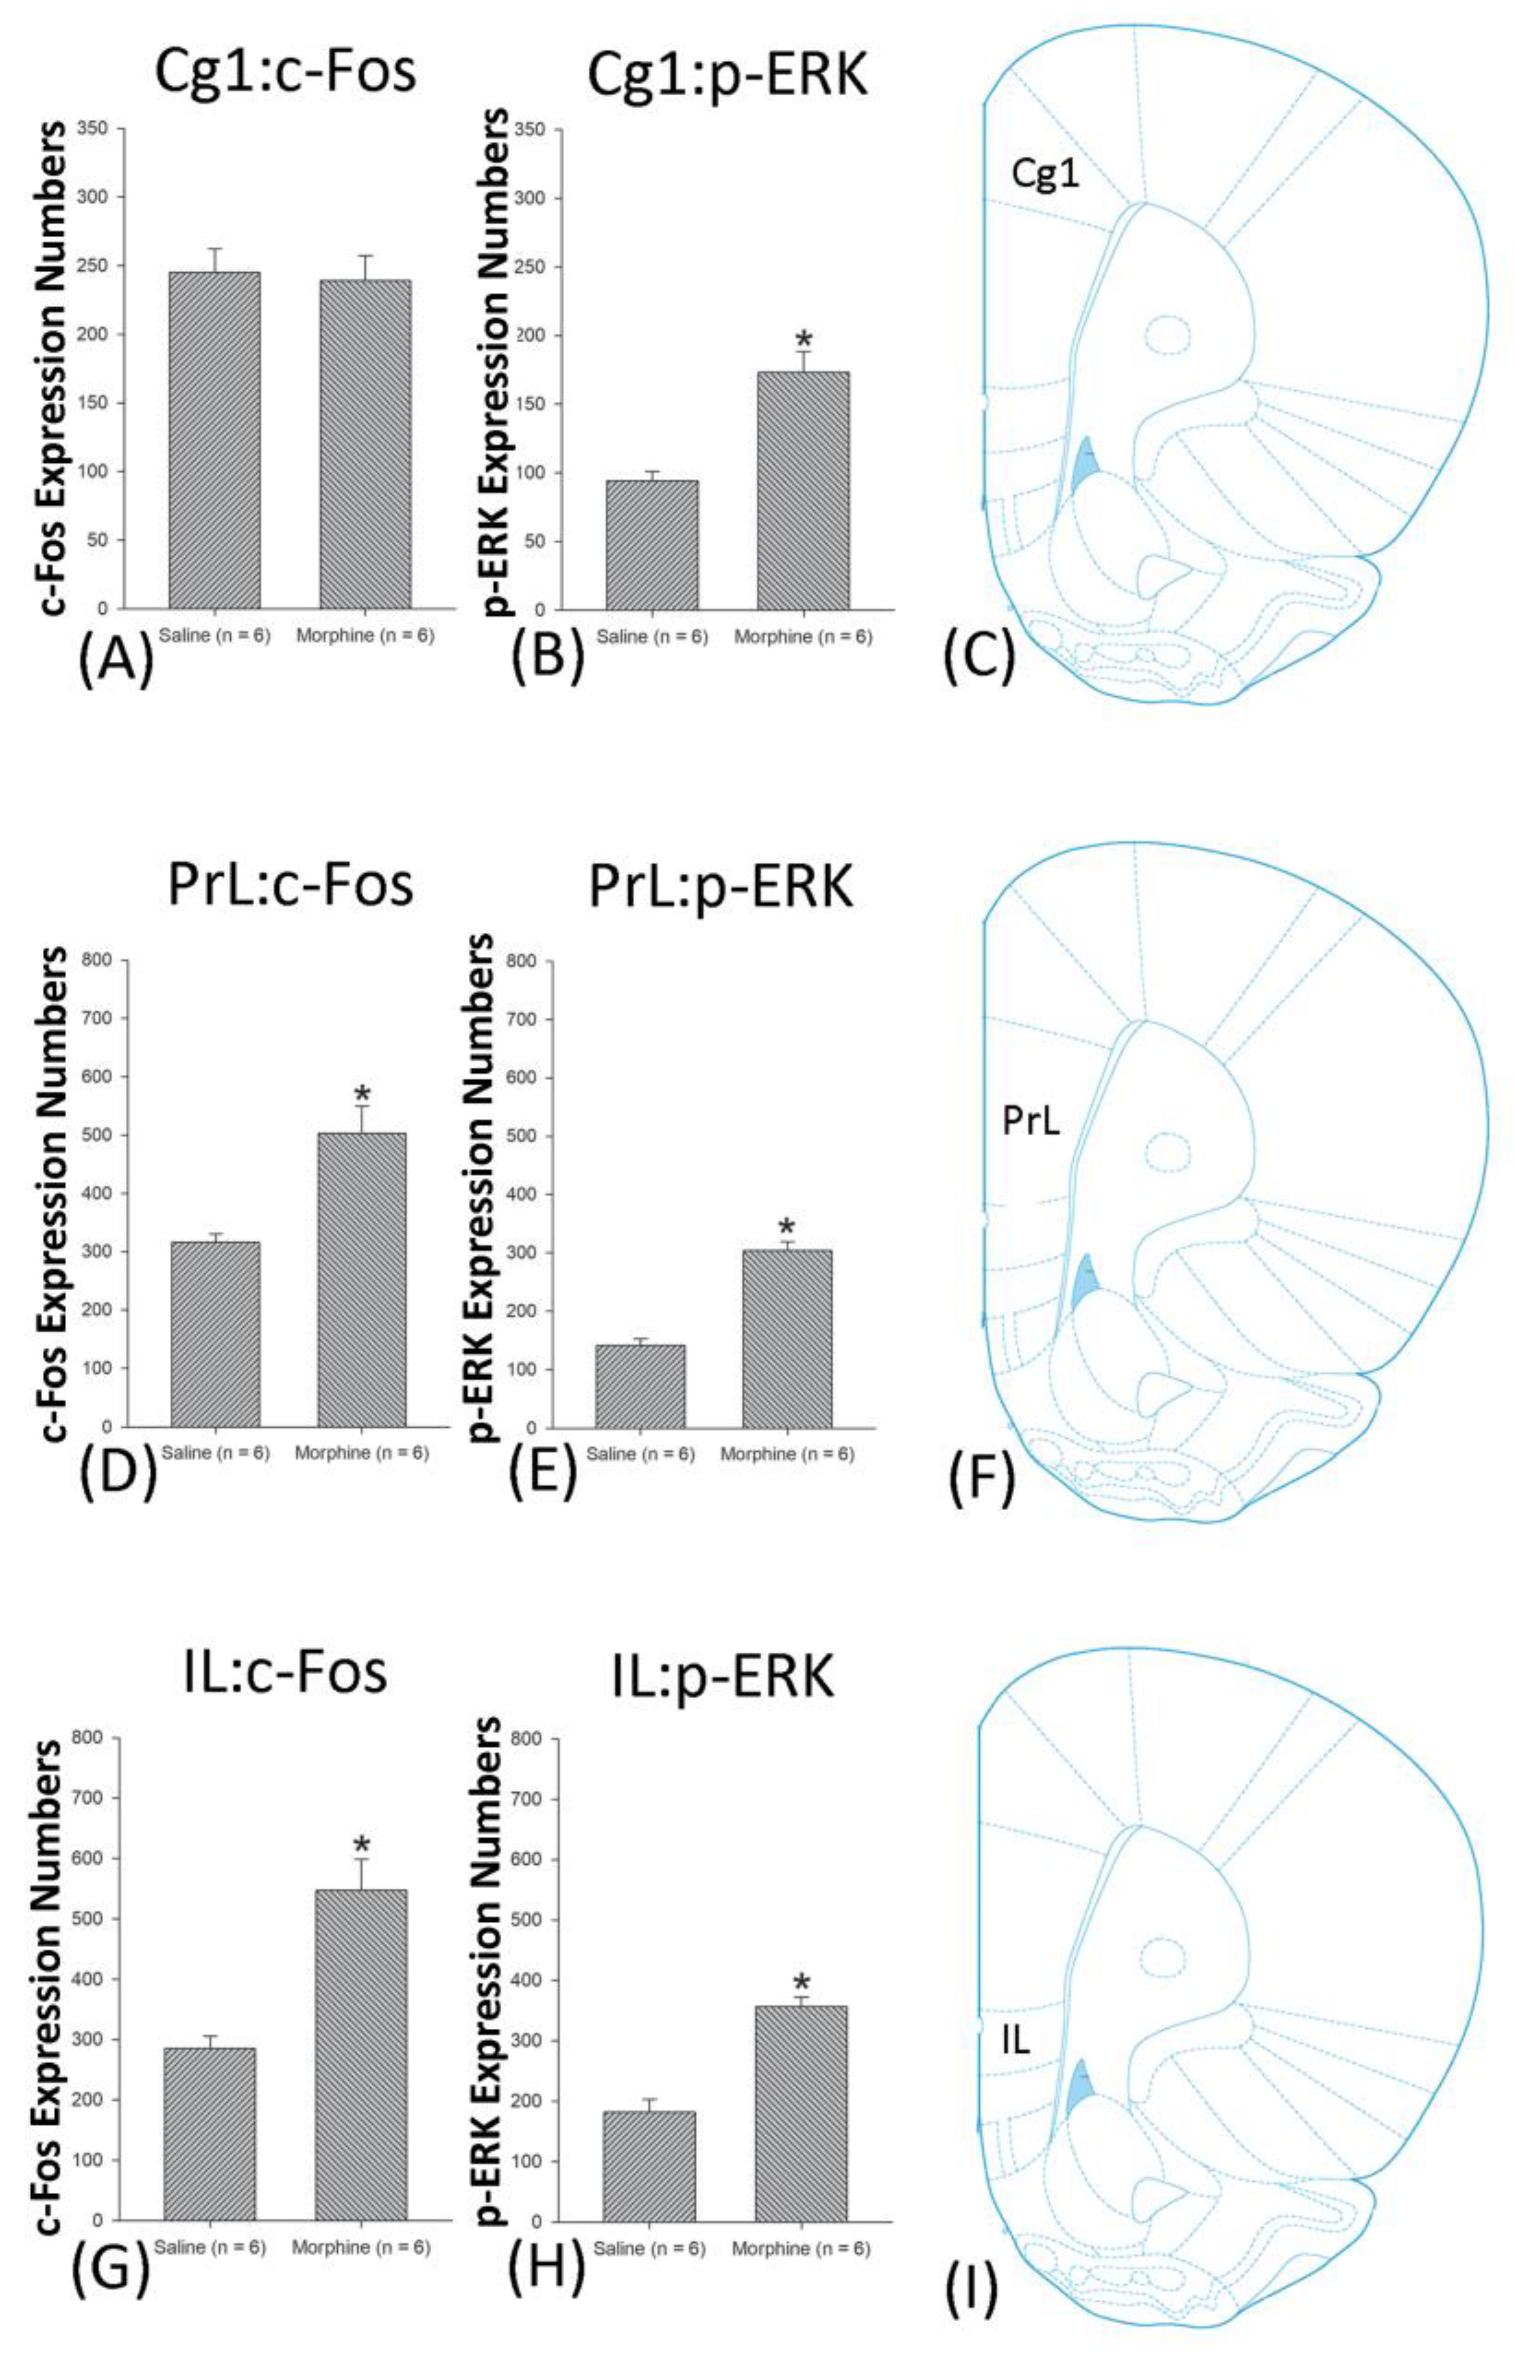
4.3. mPFC: Cg1, PrL, and IL
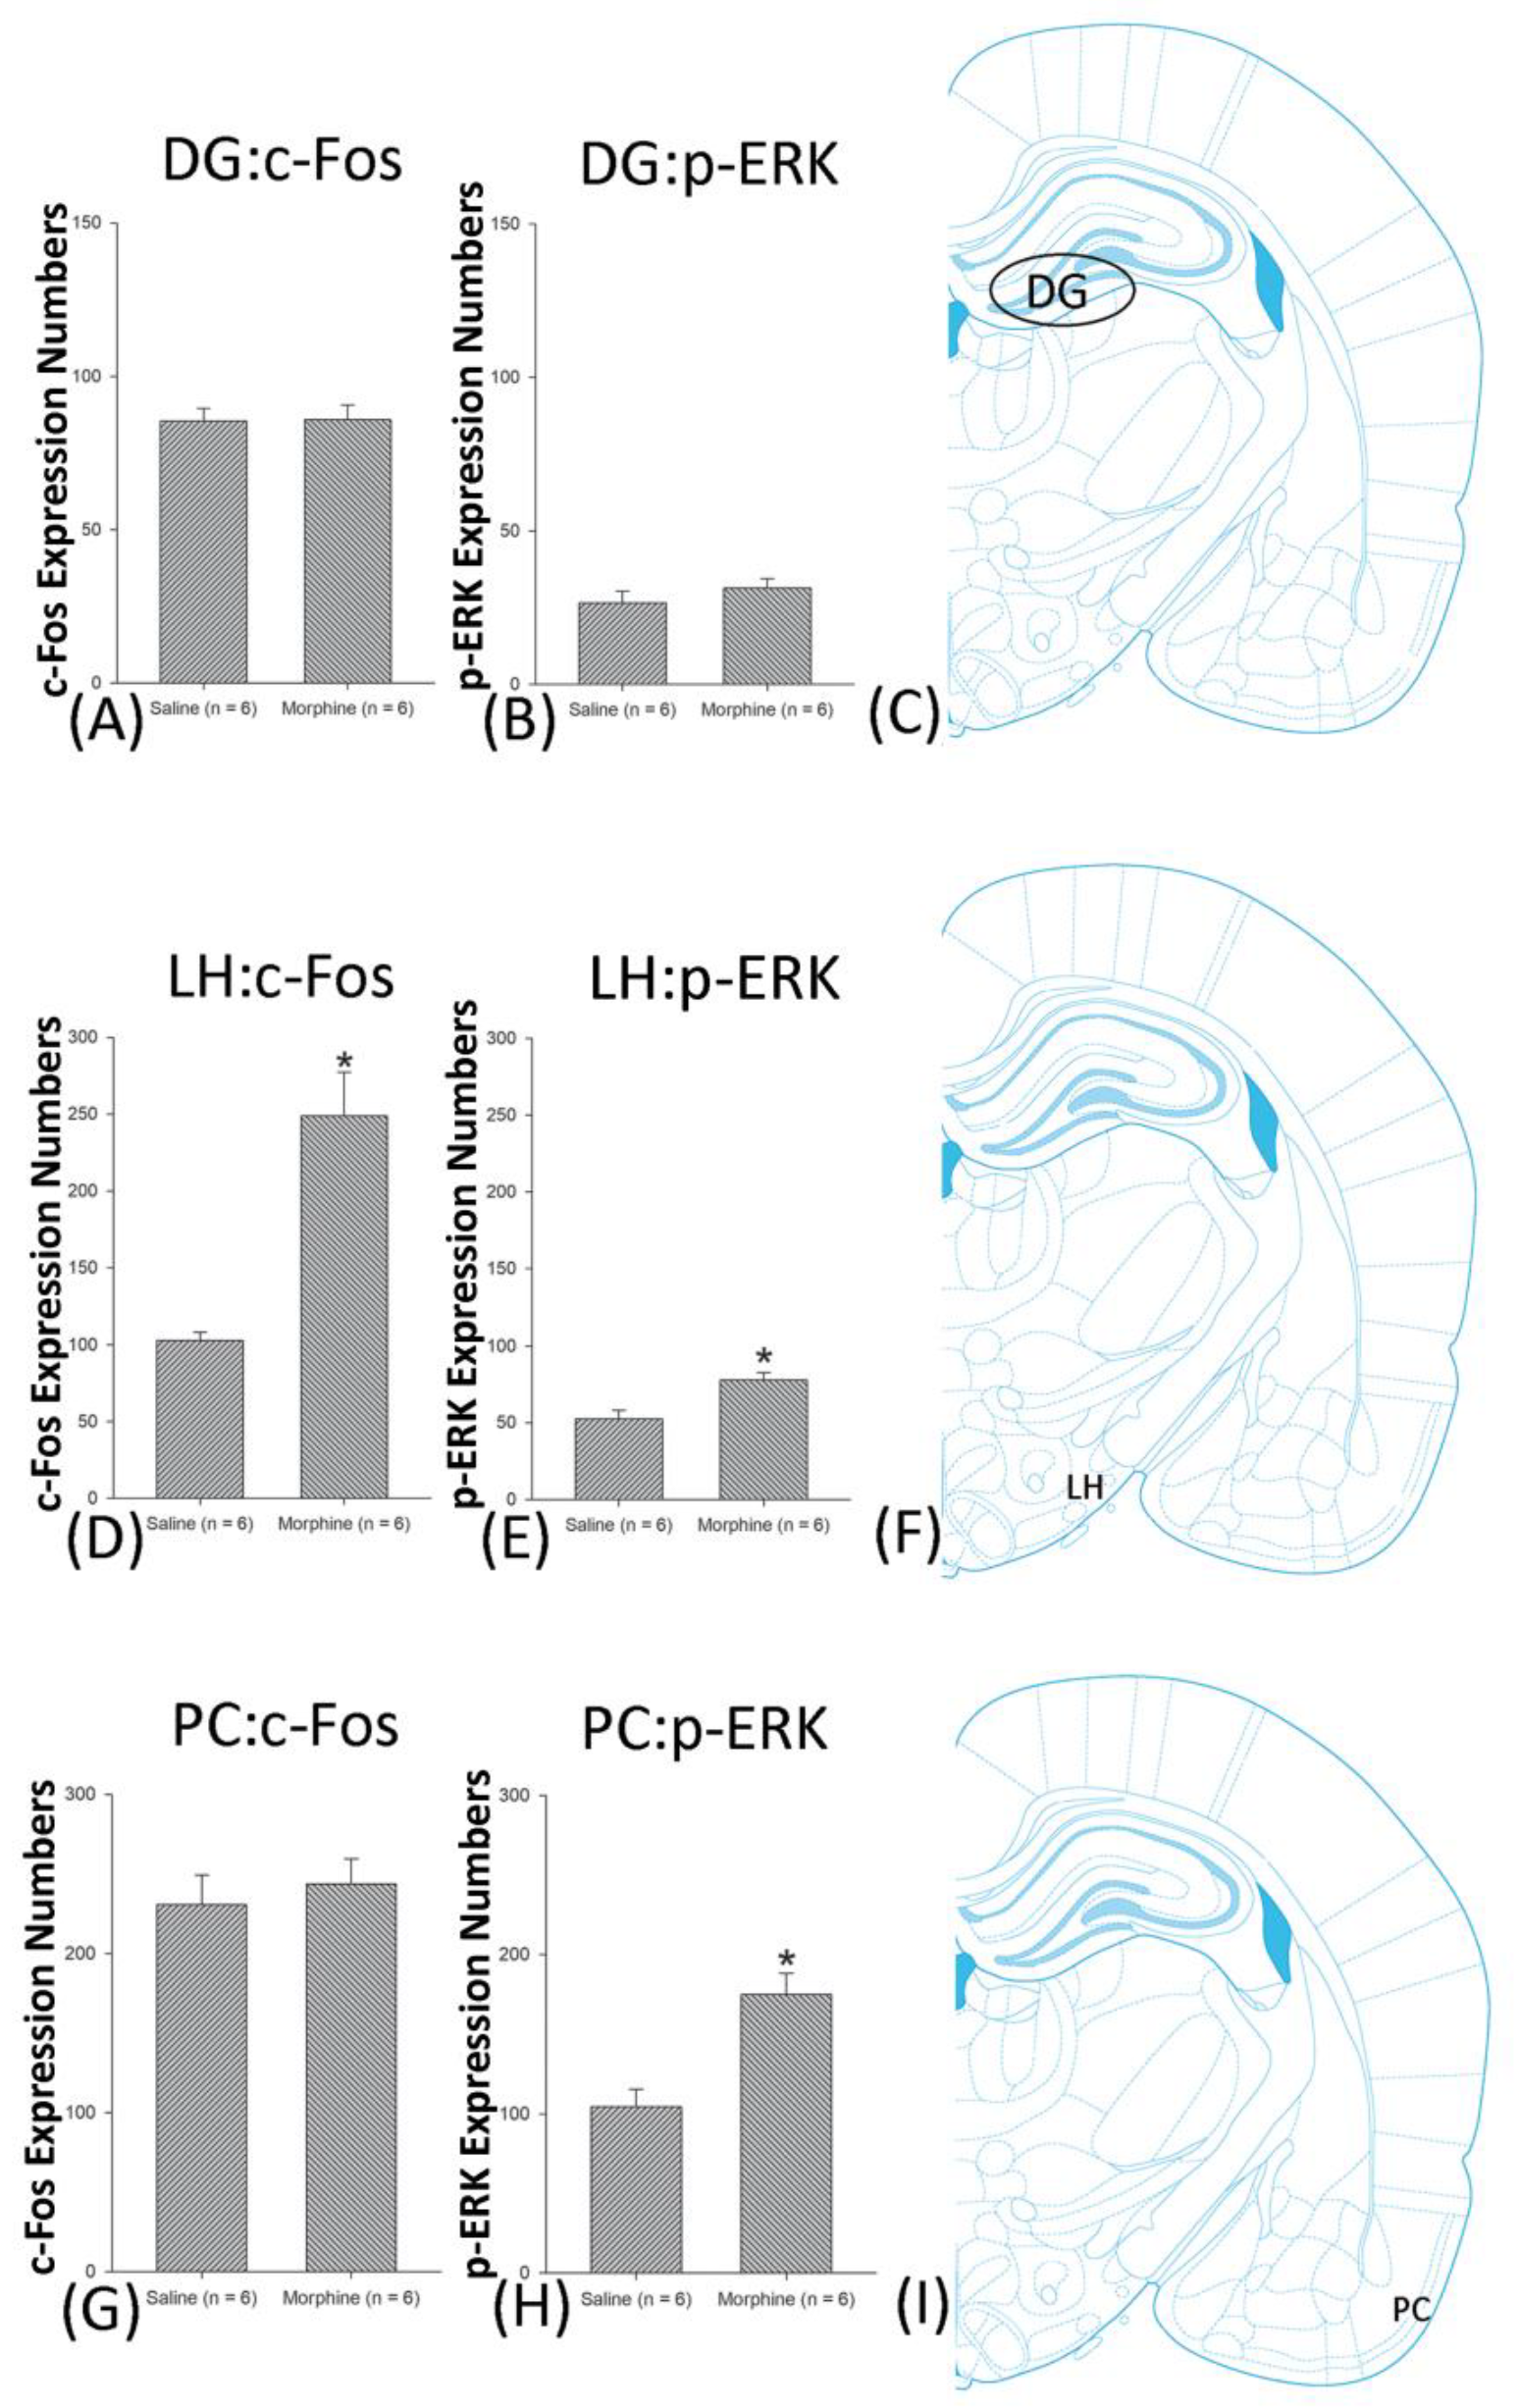
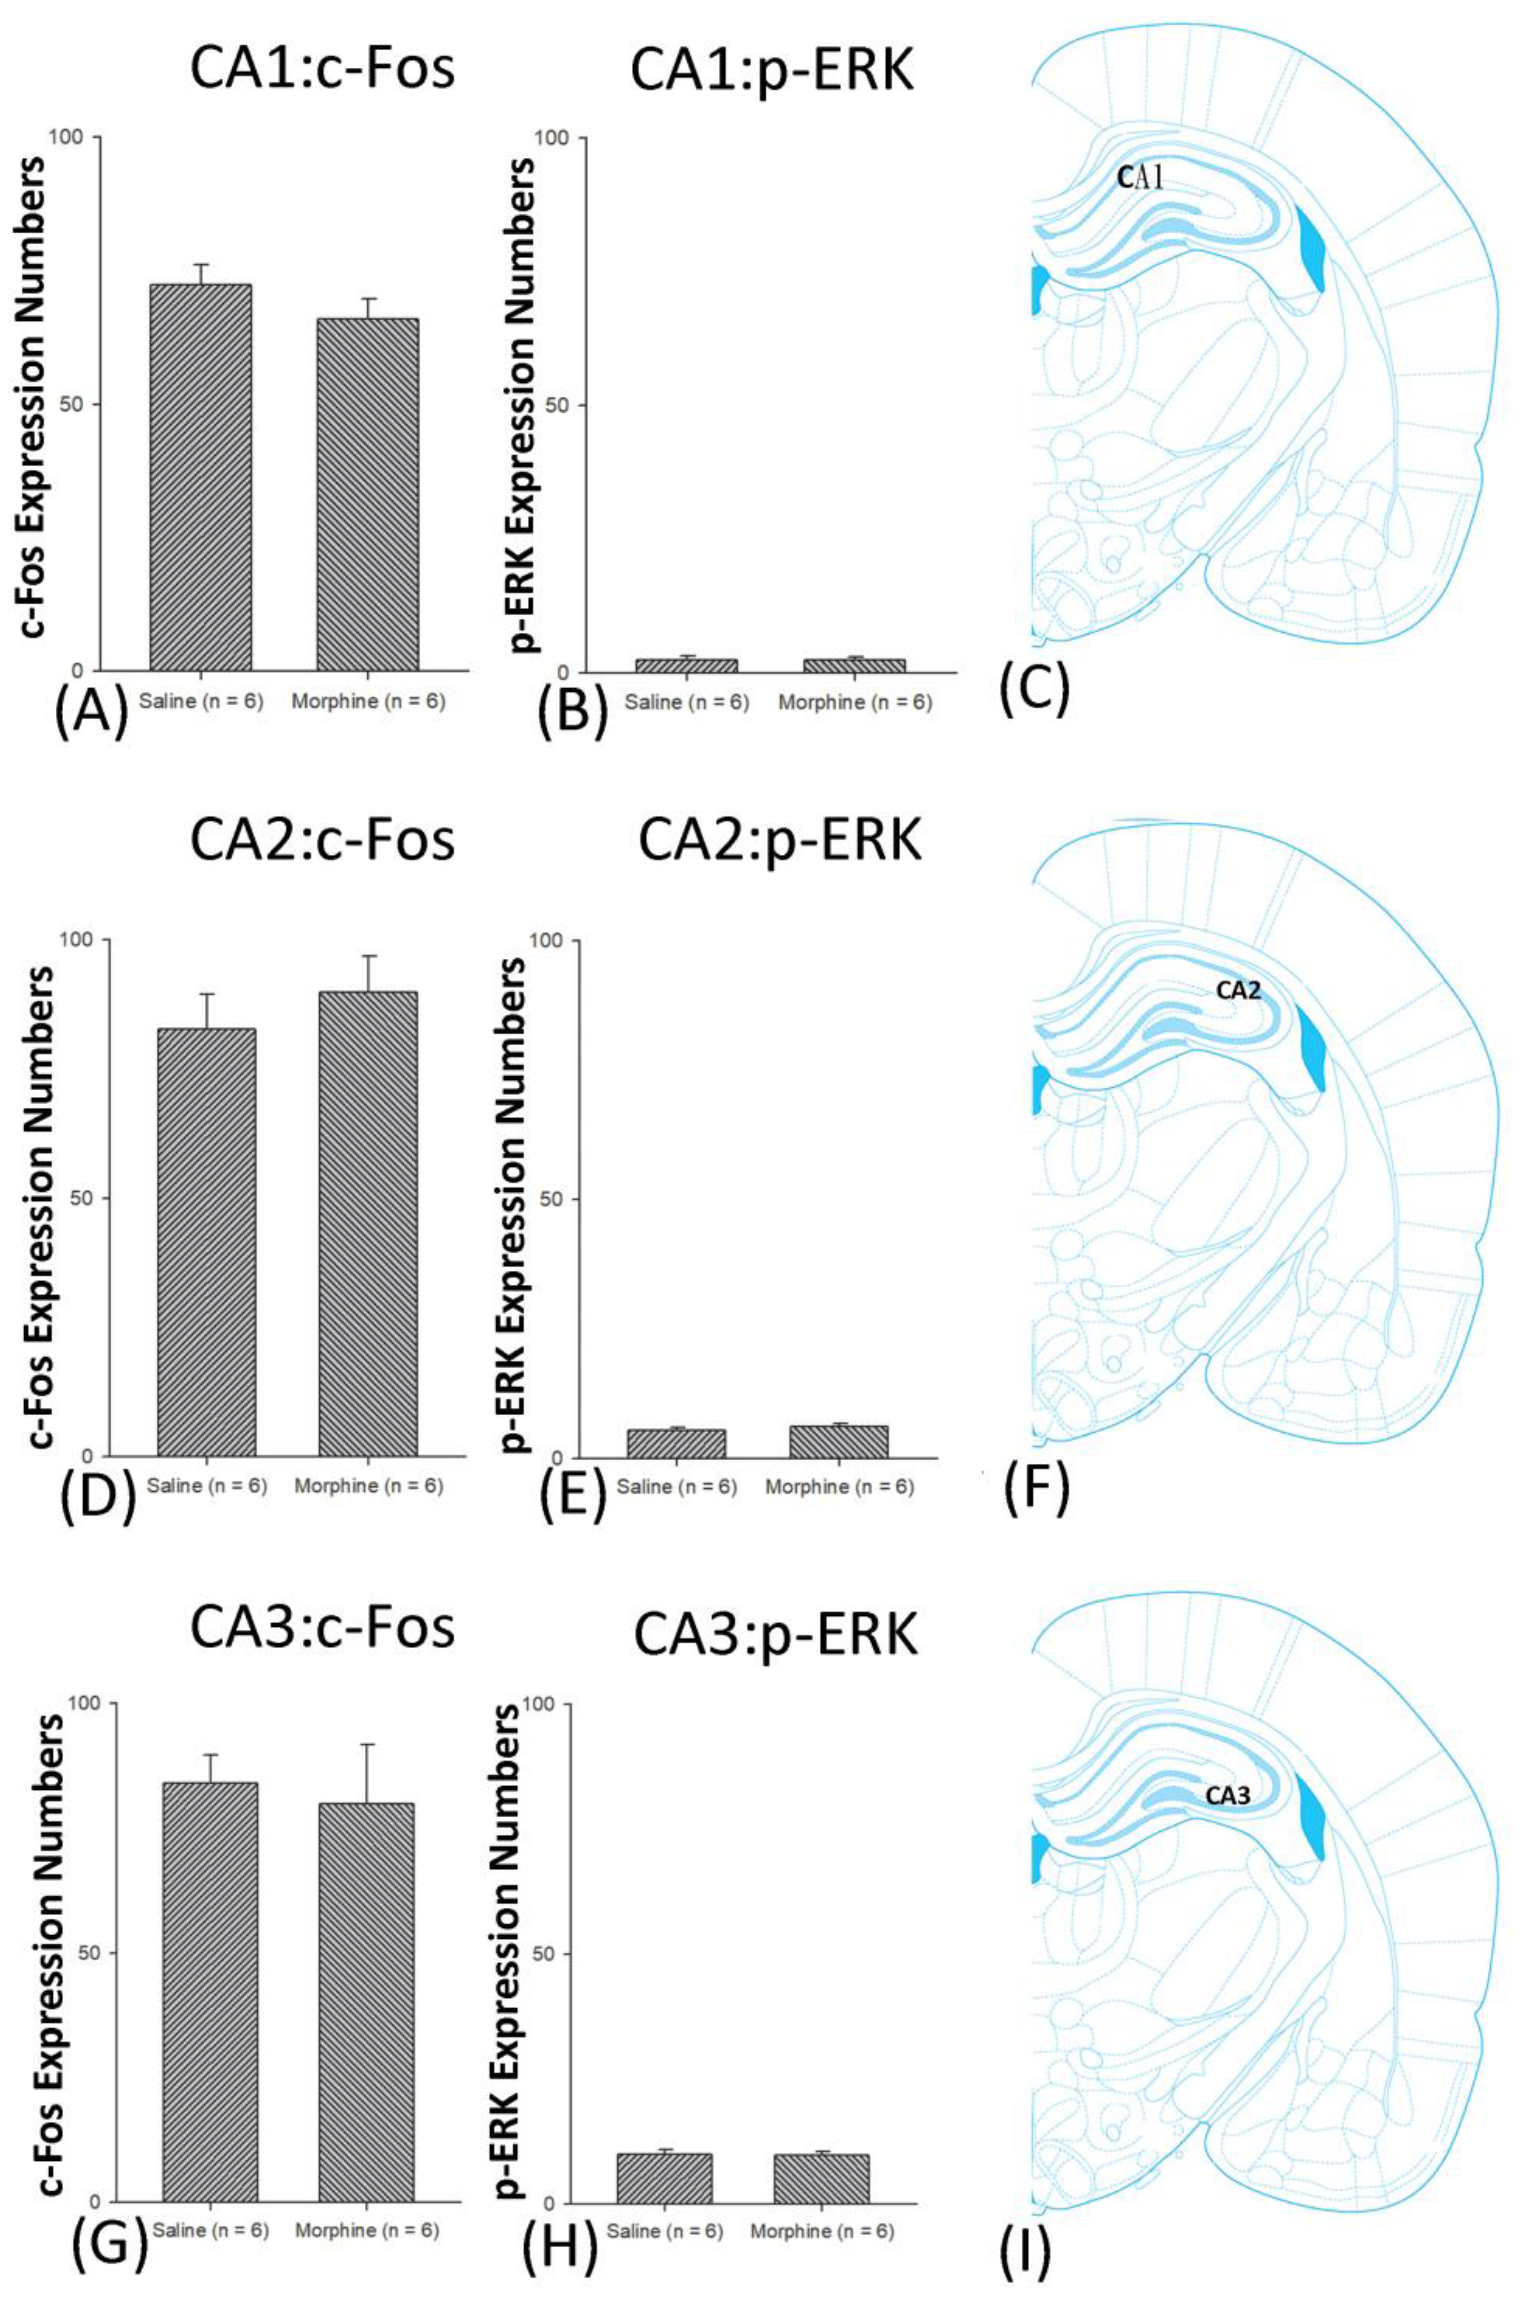
4.4. Hippocampus: CA1, CA2, CA3, and DG
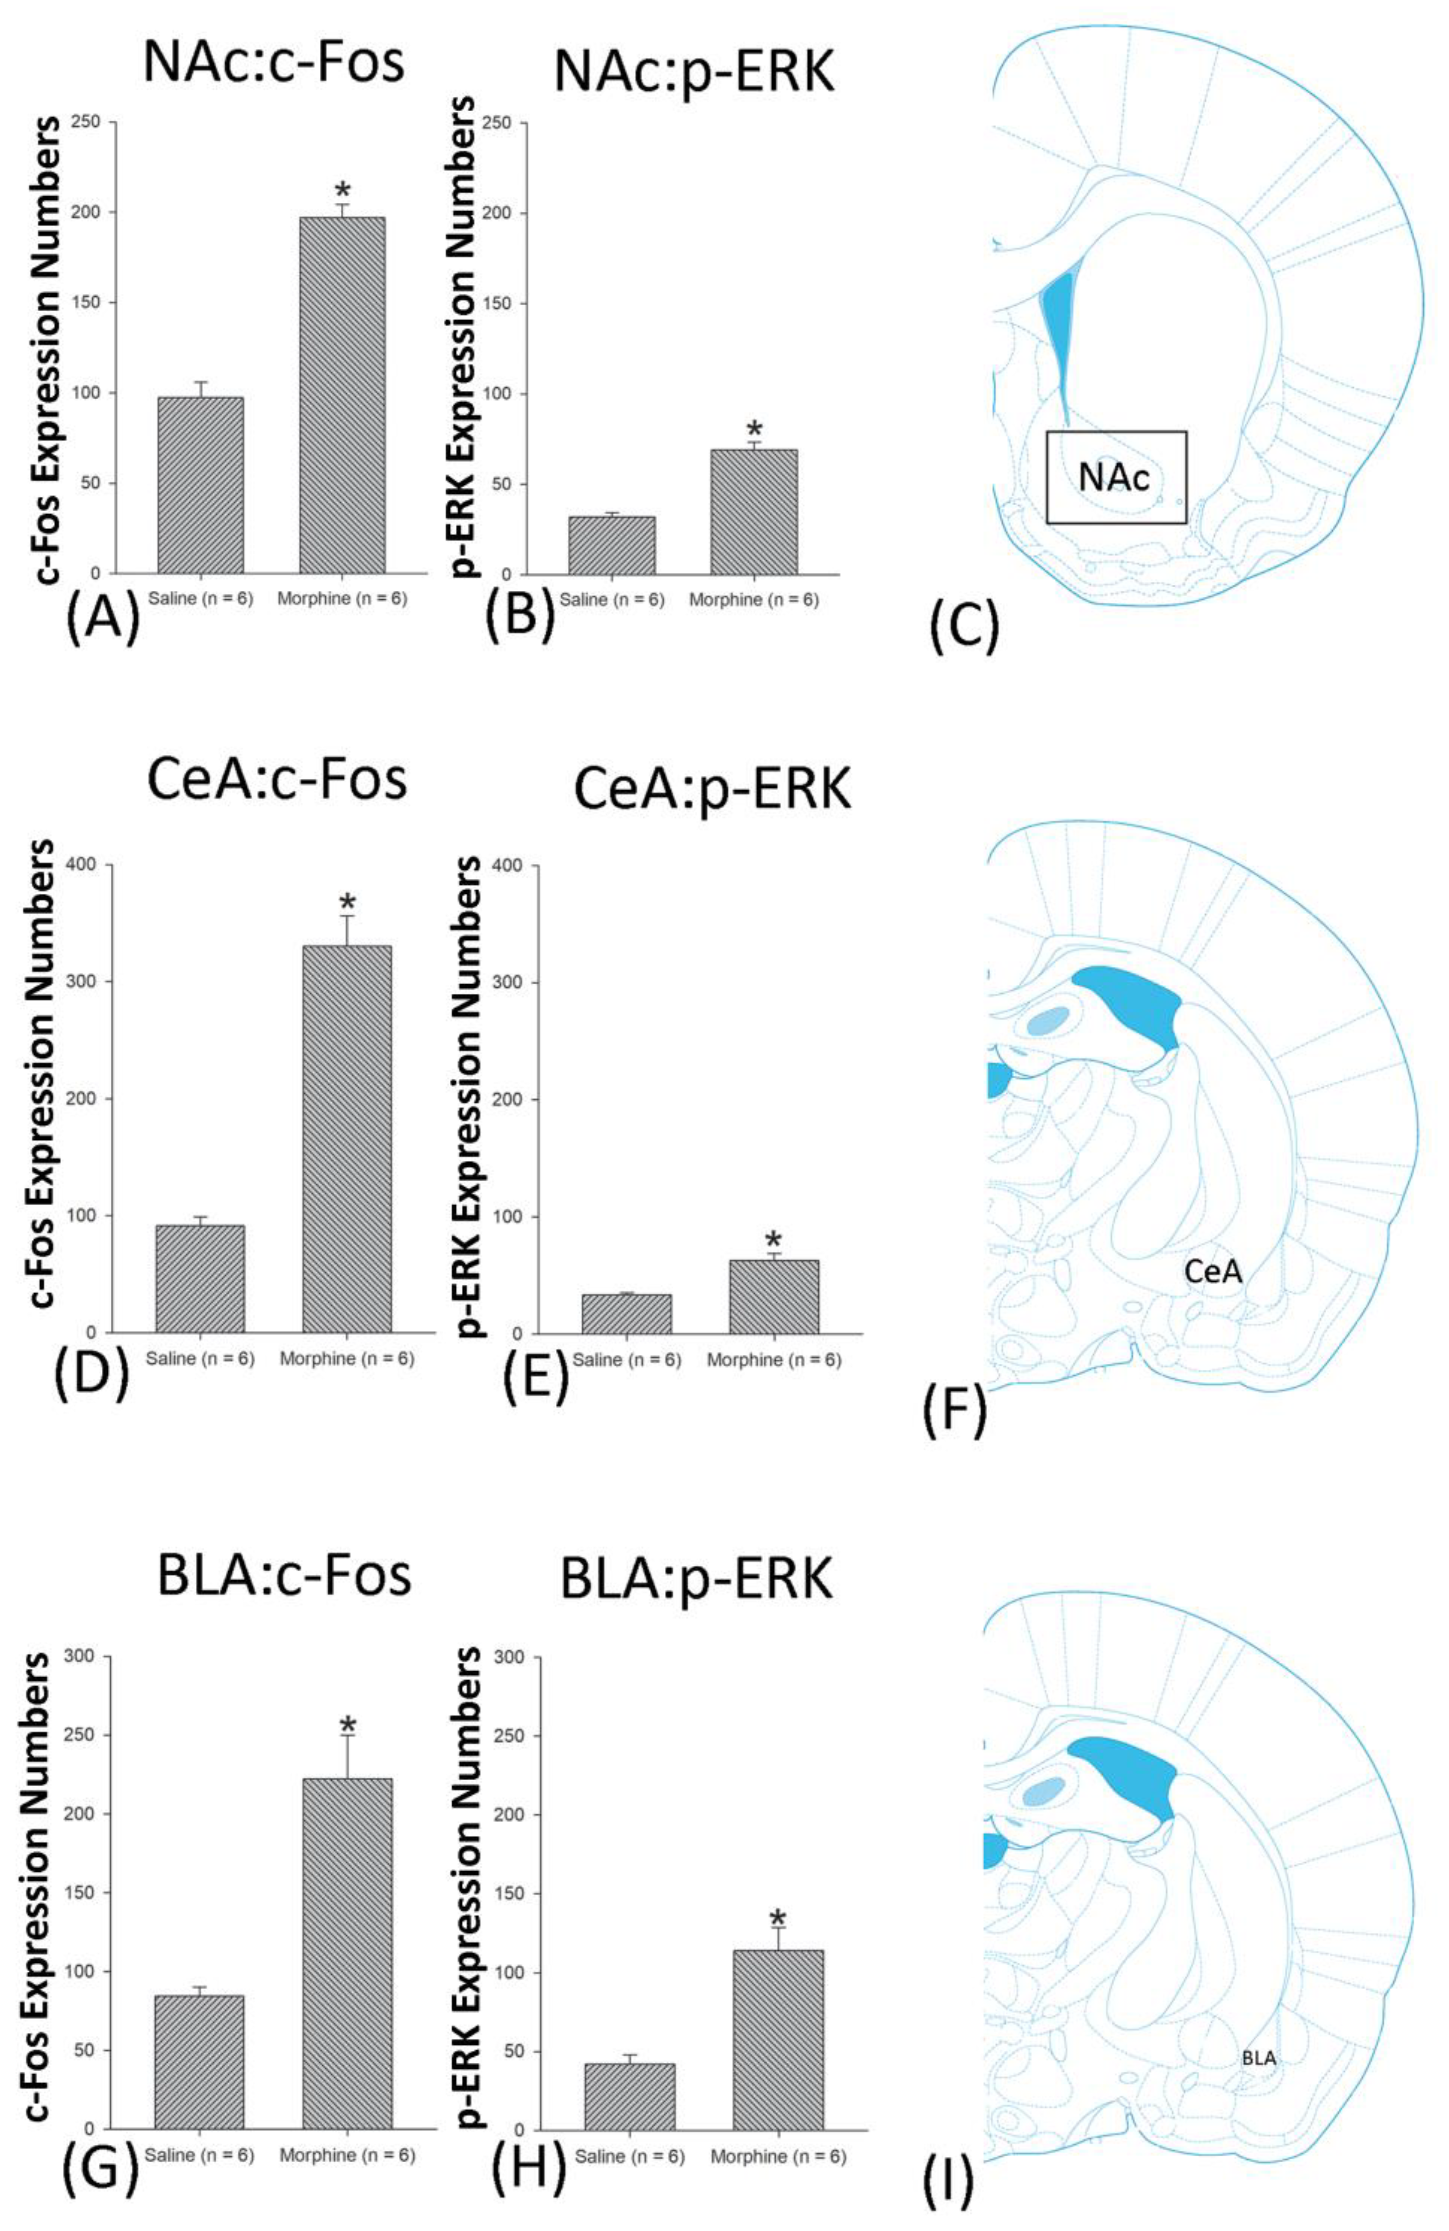
4.5. Amygdala: CeA and BLA
4.6. NAc
4.7. LH
4.8. PC
4.9. The Paradoxical Effect Hypothesis of Abused Drugs: Nonhomeostasis and Disturbance in the Brain
4.10. Further Studies
4.11. Clinical Implication
5. Conclusions
Supplementary Materials
Author Contributions
Funding
Institutional Review Board Statement
Data Availability Statement
Conflicts of Interest
References
- Verendeev, A.; Riley, A.L. The role of the aversive effects of drugs in self-administration: Assessing the balance of reward and aversion in drug-taking behavior. Behav. Pharmacol. 2013, 24, 363–374. [Google Scholar] [CrossRef]
- Cooper, S.; Robison, A.J.; Mazei-Robison, M.S. Reward Circuitry in Addiction. Neurotherapeutics 2017, 14, 687–697. [Google Scholar] [CrossRef]
- Kim, J.; Ham, S.; Hong, H.; Moon, C.; Im, H.I. Brain Reward Circuits in Morphine Addiction. Mol. Cells 2016, 39, 645–653. [Google Scholar] [CrossRef]
- Deroche-Gamonet, V.; Revest, J.M.; Fiancette, J.F.; Balado, E.; Koehl, M.; Grosjean, N.; Abrous, D.N.; Piazza, P.V. Depleting adult dentate gyrus neurogenesis increases cocaine-seeking behavior. Mol. Psychiatry 2019, 24, 312–320. [Google Scholar] [CrossRef]
- Milekic, M.H.; Brown, S.D.; Castellini, C.; Alberini, C.M. Persistent disruption of an established morphine conditioned place preference. J. Neurosci. 2006, 26, 3010–3020. [Google Scholar] [CrossRef] [PubMed][Green Version]
- Huang, A.C.W.; Yu, Y.H.; He, A.B.H.; Ou, C.Y. Interactions between prelimbic cortex and basolateral amygdala contribute to morphine-induced conditioned taste aversion in conditioning and extinction. Neurobiol. Learn. Mem. 2020, 172, 107248. [Google Scholar] [CrossRef] [PubMed]
- Song, J.; Shao, D.; Guo, X.; Zhao, Y.; Cui, D.; Ma, Q.; Sheng, H.; Ma, L.; Lai, B.; Chen, M.; et al. Crucial role of feedback signals from prelimbic cortex to basolateral amygdala in the retrieval of morphine withdrawal memory. Sci. Adv. 2019, 5, eaat3210. [Google Scholar] [CrossRef] [PubMed]
- Grigson, P.S. Conditioned taste aversions and drugs of abuse: A reinterpretation. Behav. Neurosci. 1997, 111, 129–136. [Google Scholar] [CrossRef] [PubMed]
- Huang, A.C.; Hsiao, S. Re-examination of amphetamine-induced conditioned suppression of tastant intake in rats: The task-dependent drug effects hypothesis. Behav. Neurosci. 2008, 122, 1207–1216. [Google Scholar] [CrossRef] [PubMed]
- Wang, Y.C.; Huang, A.C.; Hsiao, S. Paradoxical simultaneous occurrence of amphetamine-induced conditioned taste aversion and conditioned place preference with the same single drug injection: A new “pre- and post-association” experimental paradigm. Pharmacol. Biochem. Behav. 2010, 95, 80–87. [Google Scholar] [CrossRef]
- He, A.B.; Chang, Y.C.; Meng, A.W.Y.; Huang, A.C.W. Re-evaluation of the reward comparison hypothesis for alcohol abuse. Behav. Brain Res. 2017, 332, 218–222. [Google Scholar] [CrossRef] [PubMed]
- He, A.B.H.; Huang, C.L.; Kozlowska, A.; Chen, J.C.; Wu, C.W.; Huang, A.C.W.; Liu, Y.Q. Involvement of neural substrates in reward and aversion to methamphetamine addiction: Testing the reward comparison hypothesis and the paradoxical effect hypothesis of abused drugs. Neurobiol. Learn. Mem. 2019, 166, 107090. [Google Scholar] [CrossRef]
- Alvandi, M.S.; Bourmpoula, M.; Homberg, J.R.; Fathollahi, Y. Association of contextual cues with morphine reward increases neural and synaptic plasticity in the ventral hippocampus of rats. Addict. Biol. 2017, 22, 1883–1894. [Google Scholar] [CrossRef]
- Meredith, G.E.; Callen, S.; Scheuer, D.A. Brain-derived neurotrophic factor expression is increased in the rat amygdala, piriform cortex and hypothalamus following repeated amphetamine administration. Brain Res. 2002, 949, 218–227. [Google Scholar] [CrossRef]
- Thompson, M.D.; Sakurai, T.; Rainero, I.; Maj, M.C.; Kukkonen, J.P. Orexin Receptor Multimerization versus Functional Interactions: Neuropharmacological Implications for Opioid and Cannabinoid Signalling and Pharmacogenetics. Pharmaceuticals 2017, 10, 79. [Google Scholar] [CrossRef] [PubMed]
- Baimel, C.; Bartlett, S.E.; Chiou, L.C.; Lawrence, A.J.; Muschamp, J.W.; Patkar, O.; Tung, L.W.; Borgland, S.L. Orexin/hypocretin role in reward: Implications for opioid and other addictions. Br. J. Pharmacol. 2015, 172, 334–348. [Google Scholar] [CrossRef] [PubMed]
- Gutman, A.L.; Ewald, V.A.; Cosme, C.V.; Worth, W.R.; LaLumiere, R.T. The infralimbic and prelimbic cortices contribute to the inhibitory control of cocaine-seeking behavior during a discriminative stimulus task in rats. Addict. Biol. 2017, 22, 1719–1730. [Google Scholar] [CrossRef]
- Limpens, J.H.; Damsteegt, R.; Broekhoven, M.H.; Voorn, P.; Vanderschuren, L.J. Pharmacological inactivation of the prelimbic cortex emulates compulsive reward seeking in rats. Brain Res. 2015, 1628, 210–218. [Google Scholar] [CrossRef] [PubMed]
- Umemoto, A.; HajiHosseini, A.; Yates, M.E.; Holroyd, C.B. Reward-based contextual learning supported by anterior cingulate cortex. Cogn. Affect. Behav. Neurosci. 2017, 17, 642–651. [Google Scholar] [CrossRef] [PubMed]
- Volkow, N.D.; Wang, G.J.; Fowler, J.S.; Tomasi, D.; Telang, F. Addiction: Beyond dopamine reward circuitry. Proc. Natl. Acad. Sci. USA 2011, 108, 15037–15042. [Google Scholar] [CrossRef]
- Weiss, F.; Ciccocioppo, R.; Parsons, L.H.; Katner, S.; Liu, X.; Zorrilla, E.P.; Valdez, G.R.; Ben-Shahar, O.; Angeletti, S.; Richter, R.R. Compulsive drug-seeking behavior and relapse. Neuroadaptation, stress, and conditioning factors. Ann. N. Y. Acad. Sci. 2001, 937, 1–26. [Google Scholar] [CrossRef] [PubMed]
- Lintas, A.; Chi, N.; Lauzon, N.M.; Bishop, S.F.; Gholizadeh, S.; Sun, N.; Tan, H.; Laviolette, S.R. Identification of a dopamine receptor-mediated opiate reward memory switch in the basolateral amygdala-nucleus accumbens circuit. J. Neurosci. 2011, 31, 11172–11183. [Google Scholar] [CrossRef] [PubMed]
- Lintas, A.; Chi, N.; Lauzon, N.M.; Bishop, S.F.; Sun, N.; Tan, H.; Laviolette, S.R. Inputs from the basolateral amygdala to the nucleus accumbens shell control opiate reward magnitude via differential dopamine D1 or D2 receptor transmission. Eur. J. Neurosci. 2012, 35, 279–290. [Google Scholar] [CrossRef] [PubMed]
- Zarrindast, M.R.; Azami, B.N.; Rostami, P.; Rezayof, A. Repeated administration of dopaminergic agents in the nucleus accumbens and morphine-induced place preference. Behav. Brain Res. 2006, 169, 248–255. [Google Scholar] [CrossRef] [PubMed]
- Fenu, S.; Di Chiara, G. Facilitation of conditioned taste aversion learning by systemic amphetamine: Role of nucleus accumbens shell dopamine D1 receptors. Eur. J. Neurosci. 2003, 18, 2025–2030. [Google Scholar] [CrossRef]
- Garcia-Perez, D.; Ferenczi, S.; Kovacs, K.J.; Laorden, M.L.; Milanes, M.V.; Nunez, C. Glucocorticoid Homeostasis in the Dentate Gyrus Is Essential for Opiate Withdrawal-Associated Memories. Mol. Neurobiol. 2017, 54, 6523–6541. [Google Scholar] [CrossRef] [PubMed]
- Moorman, D.E.; James, M.H.; McGlinchey, E.M.; Aston-Jones, G. Differential roles of medial prefrontal subregions in the regulation of drug seeking. Brain Res. 2015, 1628, 130–146. [Google Scholar] [CrossRef]
- Rademacher, D.J.; Kovacs, B.; Shen, F.; Napier, T.C.; Meredith, G.E. The neural substrates of amphetamine conditioned place preference: Implications for the formation of conditioned stimulus-reward associations. Eur. J. Neurosci. 2006, 24, 2089–2097. [Google Scholar] [CrossRef] [PubMed]
- Zarrabian, S.; Riahi, E.; Karimi, S.; Razavi, Y.; Haghparast, A. The potential role of the orexin reward system in future treatments for opioid drug abuse. Brain Res. 2018, 1731, 146028. [Google Scholar] [CrossRef]
- Salling, M.C.; Hodge, C.J.; Psilos, K.E.; Eastman, V.R.; Faccidomo, S.P.; Hodge, C.W. Cue-induced reinstatement of alcohol-seeking behavior is associated with increased CaMKII T286 phosphorylation in the reward pathway of mice. Pharmacol. Biochem. Behav. 2017, 163, 20–29. [Google Scholar] [CrossRef]
- Laviolette, S.R.; Lauzon, N.M.; Bishop, S.F.; Sun, N.; Tan, H. Dopamine signaling through D1-like versus D2-like receptors in the nucleus accumbens core versus shell differentially modulates nicotine reward sensitivity. J. Neurosci. 2008, 28, 8025–8033. [Google Scholar] [CrossRef]
- Ahmad, T.; Sun, N.; Lyons, D.; Laviolette, S.R. Bi-directional cannabinoid signalling in the basolateral amygdala controls rewarding and aversive emotional processing via functional regulation of the nucleus accumbens. Addict. Biol. 2017, 22, 1218–1231. [Google Scholar] [CrossRef] [PubMed]
- Jin, C.; Araki, H.; Nagata, M.; Shimosaka, R.; Shibata, K.; Suemaru, K.; Kawasaki, H.; Gomita, Y. Expression of c-Fos in the rat central amygdala accompanies the acquisition but not expression of conditioned place aversion induced by withdrawal from acute morphine dependence. Behav. Brain Res. 2005, 161, 107–112. [Google Scholar] [CrossRef]
- Wang, L.; Shen, M.; Jiang, C.; Ma, L.; Wang, F. Parvalbumin Interneurons of Central Amygdala Regulate the Negative Affective States and the Expression of Corticotrophin-Releasing Hormone During Morphine Withdrawal. Int. J. Neuropsychopharmacol. 2016, 19, pyw060. [Google Scholar] [CrossRef] [PubMed]
- Riley, A.L. The paradox of drug taking: The role of the aversive effects of drugs. Physiol. Behav. 2011, 103, 69–78. [Google Scholar] [CrossRef]
- Verendeev, A.; Riley, A.L. Conditioned taste aversion and drugs of abuse: History and interpretation. Neurosci. Biobehav. Rev. 2012, 36, 2193–2205. [Google Scholar] [CrossRef] [PubMed]
- Koob, G.F.; Volkow, N.D. Neurobiology of addiction: A neurocircuitry analysis. Lancet Psychiatry 2016, 3, 760–773. [Google Scholar] [CrossRef]
- Finn, D.P.; Jhaveri, M.D.; Beckett, S.R.; Madjd, A.; Kendall, D.A.; Marsden, C.A.; Chapman, V. Behavioral, central monoaminergic and hypothalamo-pituitary-adrenal axis correlates of fear-conditioned analgesia in rats. Neuroscience 2006, 138, 1309–1317. [Google Scholar] [CrossRef]
- Paxinos, G.; Watson, C. The Rat Brain in Stereotaxic Coordinates, 6th ed.; Academic Press: Burlington, MA, USA, 2007. [Google Scholar]
- Abramoff, M.D.; Magalhaes, P.J.; Ram, S.J. Image Processing with ImageJ, 11th ed.; Laurin Publishing: Pittsfield, MA, USA, 2004; pp. 36–42. [Google Scholar]
- Carr, G.D.; White, N.M. Anatomical disassociation of amphetamine’s rewarding and aversive effects: An intracranial microinjection study. Psychopharmacology 1986, 89, 340–346. [Google Scholar] [CrossRef]
- White, N.; Sklar, L.; Amit, Z. The reinforcing action of morphine and its paradoxical side effect. Psychopharmacology 1977, 52, 63–66. [Google Scholar] [CrossRef]
- Adinoff, B. Neurobiologic processes in drug reward and addiction. Harv. Rev. Psychiatry 2004, 12, 305–320. [Google Scholar] [CrossRef]
- Gutman, A.L.; Nett, K.E.; Cosme, C.V.; Worth, W.R.; Gupta, S.C.; Wemmie, J.A.; LaLumiere, R.T. Extinction of Cocaine Seeking Requires a Window of Infralimbic Pyramidal Neuron Activity after Unreinforced Lever Presses. J. Neurosci. 2017, 37, 6075–6086. [Google Scholar] [CrossRef]
- Li, Y.; Ge, S.; Li, N.; Chen, L.; Zhang, S.; Wang, J.; Wu, H.; Wang, X.; Wang, X. NMDA and dopamine D1 receptors within NAc-shell regulate IEG proteins expression in reward circuit during cocaine memory reconsolidation. Neuroscience 2016, 315, 45–69. [Google Scholar] [CrossRef]
- Valero, E.; Gomez-Milanes, I.; Almela, P.; Ribeiro Do, C.B.; Laorden, M.L.; Milanes, M.V.; Nunez, C. The involvement of CRF1 receptor within the basolateral amygdala and dentate gyrus in the naloxone-induced conditioned place aversion in morphine-dependent mice. Prog. Neuropsychopharmacol. Biol. Psychiatry 2018, 84, 102–114. [Google Scholar] [CrossRef] [PubMed]
- Wang, W.S.; Chen, Z.G.; Liu, W.T.; Chi, Z.Q.; He, L.; Liu, J.G. Dorsal hippocampal NMDA receptor blockade impairs extinction of naloxone-precipitated conditioned place aversion in acute morphine-treated rats by suppressing ERK and CREB phosphorylation in the basolateral amygdala. Br. J. Pharmacol. 2015, 172, 482–491. [Google Scholar] [CrossRef]
- Rosen, L.G.; Rushlow, W.J.; Laviolette, S.R. Opiate exposure state controls dopamine D3 receptor and cdk5/calcineurin signaling in the basolateral amygdala during reward and withdrawal aversion memory formation. Prog. Neuropsychopharmacol. Biol. Psychiatry 2017, 79, 59–66. [Google Scholar] [CrossRef] [PubMed]
- Wise, R.A.; Bozarth, M.A. Brain reward circuitry: Four circuit elements “wired” in apparent series. Brain Res. Bull. 1984, 12, 203–208. [Google Scholar] [CrossRef]
- Koob, G.F.; Stinus, L.; Le, M.M.; Bloom, F.E. Opponent process theory of motivation: Neurobiological evidence from studies of opiate dependence. Neurosci. Biobehav. Rev. 1989, 13, 135–140. [Google Scholar] [CrossRef]
- Carr, F. Addiction: Road to aversion. Nat. Rev. Neurosci. 2016, 17, 200. [Google Scholar]
- Valverde, O.; Tzavara, E.; Hanoune, J.; Roques, B.P.; Maldonado, R. Protein kinases in the rat nucleus accumbens are involved in the aversive component of opiate withdrawal. Eur. J. Neurosci. 1996, 8, 2671–2678. [Google Scholar] [CrossRef]
- Zhu, Y.; Wienecke, C.F.; Nachtrab, G.; Chen, X. A thalamic input to the nucleus accumbens mediates opiate dependence. Nature 2016, 530, 219–222. [Google Scholar] [CrossRef] [PubMed]
- Wang, X.; Zhang, B.; Zhang, L.; Liu, S. Electroacupuncture suppresses morphine reward-seeking behavior: Lateral hypothalamic orexin neurons implicated. Neurosci. Lett. 2017, 661, 84–89. [Google Scholar] [CrossRef]
- Davis, C.M.; Riley, A.L. Conditioned taste aversion learning: Implications for animal models of drug abuse. Ann. N. Y. Acad. Sci. 2010, 1187, 247–275. [Google Scholar] [CrossRef]
- Ahmad, T.; Lauzon, N.M.; de Jaeger, X.; Laviolette, S.R. Cannabinoid transmission in the prelimbic cortex bidirectionally controls opiate reward and aversion signaling through dissociable kappa versus mu-opiate receptor dependent mechanisms. J. Neurosci. 2013, 33, 15642–15651. [Google Scholar] [CrossRef]
- He, Y.Y.; Xue, Y.X.; Wang, J.S.; Fang, Q.; Liu, J.F.; Xue, L.F.; Lu, L. PKMzeta maintains drug reward and aversion memory in the basolateral amygdala and extinction memory in the infralimbic cortex. Neuropsychopharmacology 2011, 36, 1972–1981. [Google Scholar] [CrossRef]
- Warlow, S.M.; Robinson, M.J.F.; Berridge, K.C. Optogenetic Central Amygdala Stimulation Intensifies and Narrows Motivation for Cocaine. J. Neurosci. 2017, 37, 8330–8348. [Google Scholar] [CrossRef] [PubMed]
- Venniro, M.; Caprioli, D.; Zhang, M.; Whitaker, L.R.; Zhang, S.; Warren, B.L.; Cifani, C.; Marchant, N.J.; Yizhar, O.; Bossert, J.M.; et al. The Anterior Insular Cortex→Central Amygdala Glutamatergic Pathway Is Critical to Relapse after Contingency Management. Neuron 2017, 96, 414–427.e8. [Google Scholar] [CrossRef] [PubMed]
- Blair, R.; Amit, Z. Morphine conditioned taste aversion reversed by periaqueductal gray lesions. Pharmacol. Biochem. Behav. 1981, 15, 651–653. [Google Scholar] [CrossRef]
- Sante, A.B.; Nobre, M.J.; Brandao, M.L. Place aversion induced by blockade of mu or activation of kappa opioid receptors in the dorsal periaqueductal gray matter. Behav. Pharmacol. 2000, 11, 583–589. [Google Scholar] [CrossRef] [PubMed]
- Motta, V.; Brandao, M.L. Aversive and antiaversive effects of morphine in the dorsal periaqueductal gray of rats submitted to the elevated plus-maze test. Pharmacol. Biochem. Behav. 1993, 44, 119–125. [Google Scholar] [CrossRef]


| Morphine Doses (mg/kg) | |||||
|---|---|---|---|---|---|
| 0 | 10 | 20 | 30 | 40 | |
| CTA: Aversion | -- | + | + | + | + |
| CPP: Reward | -- | -- | + | + | + |
| Conditioning | Extinction | Reinstatement | ||||
|---|---|---|---|---|---|---|
| Numbers | % | Numbers | % | Numbers | % | |
| c-Fos hyperexpression | 5 | 41.67 | 3 | 25.00 | 7 | 58.33 |
| p-ERK hyperexpression | 4 | 33.33 | 5 | 41.67 | 7 | 58.33 |
Publisher’s Note: MDPI stays neutral with regard to jurisdictional claims in published maps and institutional affiliations. |
© 2021 by the authors. Licensee MDPI, Basel, Switzerland. This article is an open access article distributed under the terms and conditions of the Creative Commons Attribution (CC BY) license (https://creativecommons.org/licenses/by/4.0/).
Share and Cite
Yu, Y.; He, A.B.; Liou, M.; Ou, C.; Kozłowska, A.; Chen, P.; Huang, A.C. The Paradoxical Effect Hypothesis of Abused Drugs in a Rat Model of Chronic Morphine Administration. J. Clin. Med. 2021, 10, 3197. https://doi.org/10.3390/jcm10153197
Yu Y, He AB, Liou M, Ou C, Kozłowska A, Chen P, Huang AC. The Paradoxical Effect Hypothesis of Abused Drugs in a Rat Model of Chronic Morphine Administration. Journal of Clinical Medicine. 2021; 10(15):3197. https://doi.org/10.3390/jcm10153197
Chicago/Turabian StyleYu, Yinghao, Alan Bohan He, Michelle Liou, Chenyin Ou, Anna Kozłowska, Pingwen Chen, and Andrew Chihwei Huang. 2021. "The Paradoxical Effect Hypothesis of Abused Drugs in a Rat Model of Chronic Morphine Administration" Journal of Clinical Medicine 10, no. 15: 3197. https://doi.org/10.3390/jcm10153197
APA StyleYu, Y., He, A. B., Liou, M., Ou, C., Kozłowska, A., Chen, P., & Huang, A. C. (2021). The Paradoxical Effect Hypothesis of Abused Drugs in a Rat Model of Chronic Morphine Administration. Journal of Clinical Medicine, 10(15), 3197. https://doi.org/10.3390/jcm10153197