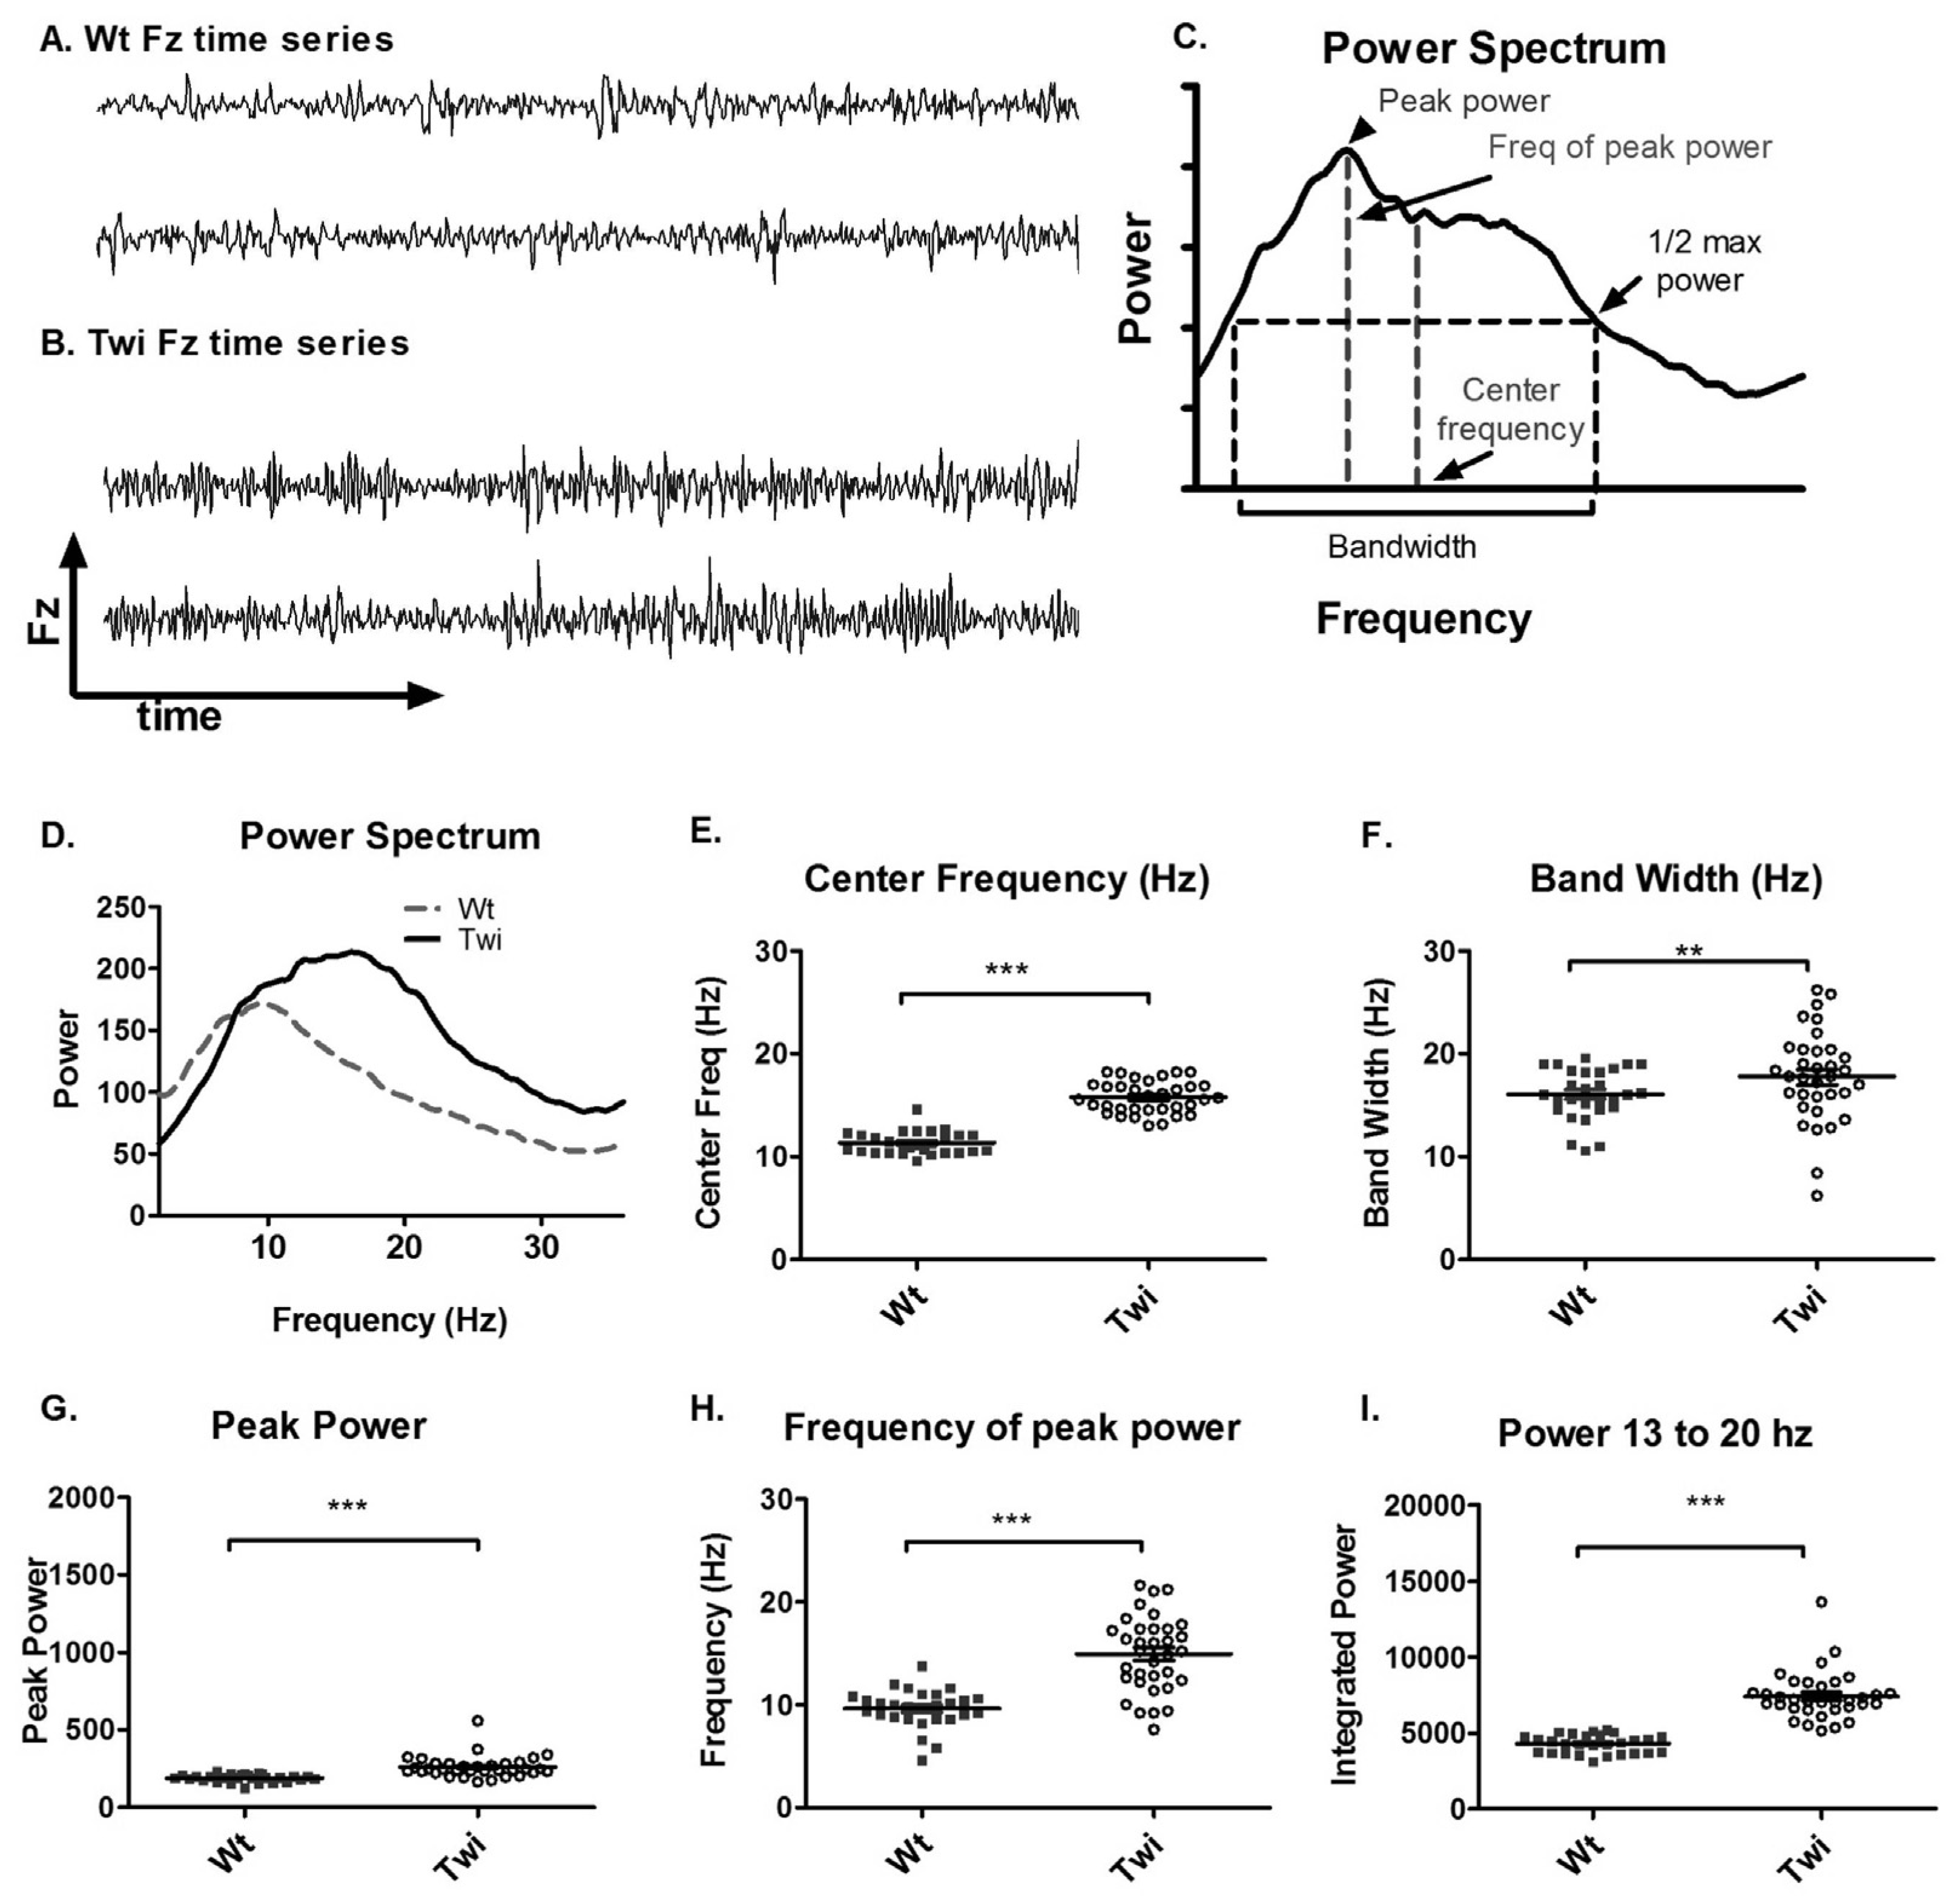
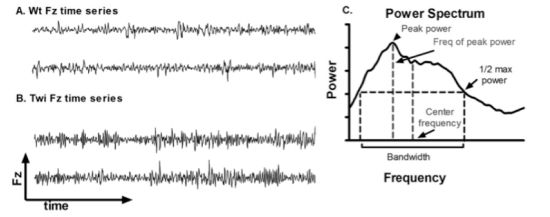
3.1. Tremor and Locomotion in Twitcher Mice
The qualitative differences in the Fz time series between the Wt and Twi mice are shown in
Figure 1A and B. A Fourier transform was applied to the Fz time series to obtain a power spectrum (
Figure 1C). The power spectra of different animals were further analyzed to obtain the peak power, frequency of peak power, center frequency, and bandwidth (
Figure 1C). The averaged power spectra (
Figure 1D) showed that the Twi mice had substantially higher power at higher frequencies compared to the Wt mice. The center frequency and the bandwidth in the Twi group were significantly higher than these variables for the Wt group (
Figure 1E and F). The peak power (
Figure 1G), frequency of peak power (
Figure 1H), and the integrated power between 13 and 20 Hz (
Figure 1I) were significantly increased in the Twi group compared to the Wt group (p < 0.001 for all three comparisons; t-test). The data for the Wt group are indicative of normal movements without any visible tremor, whereas the Twi mice exhibited the obvious tremor for which they are named. This analysis shows that the tremor of the twitcher mice manifests itself as relatively broad band, high-frequency force oscillations while on the force-plate.
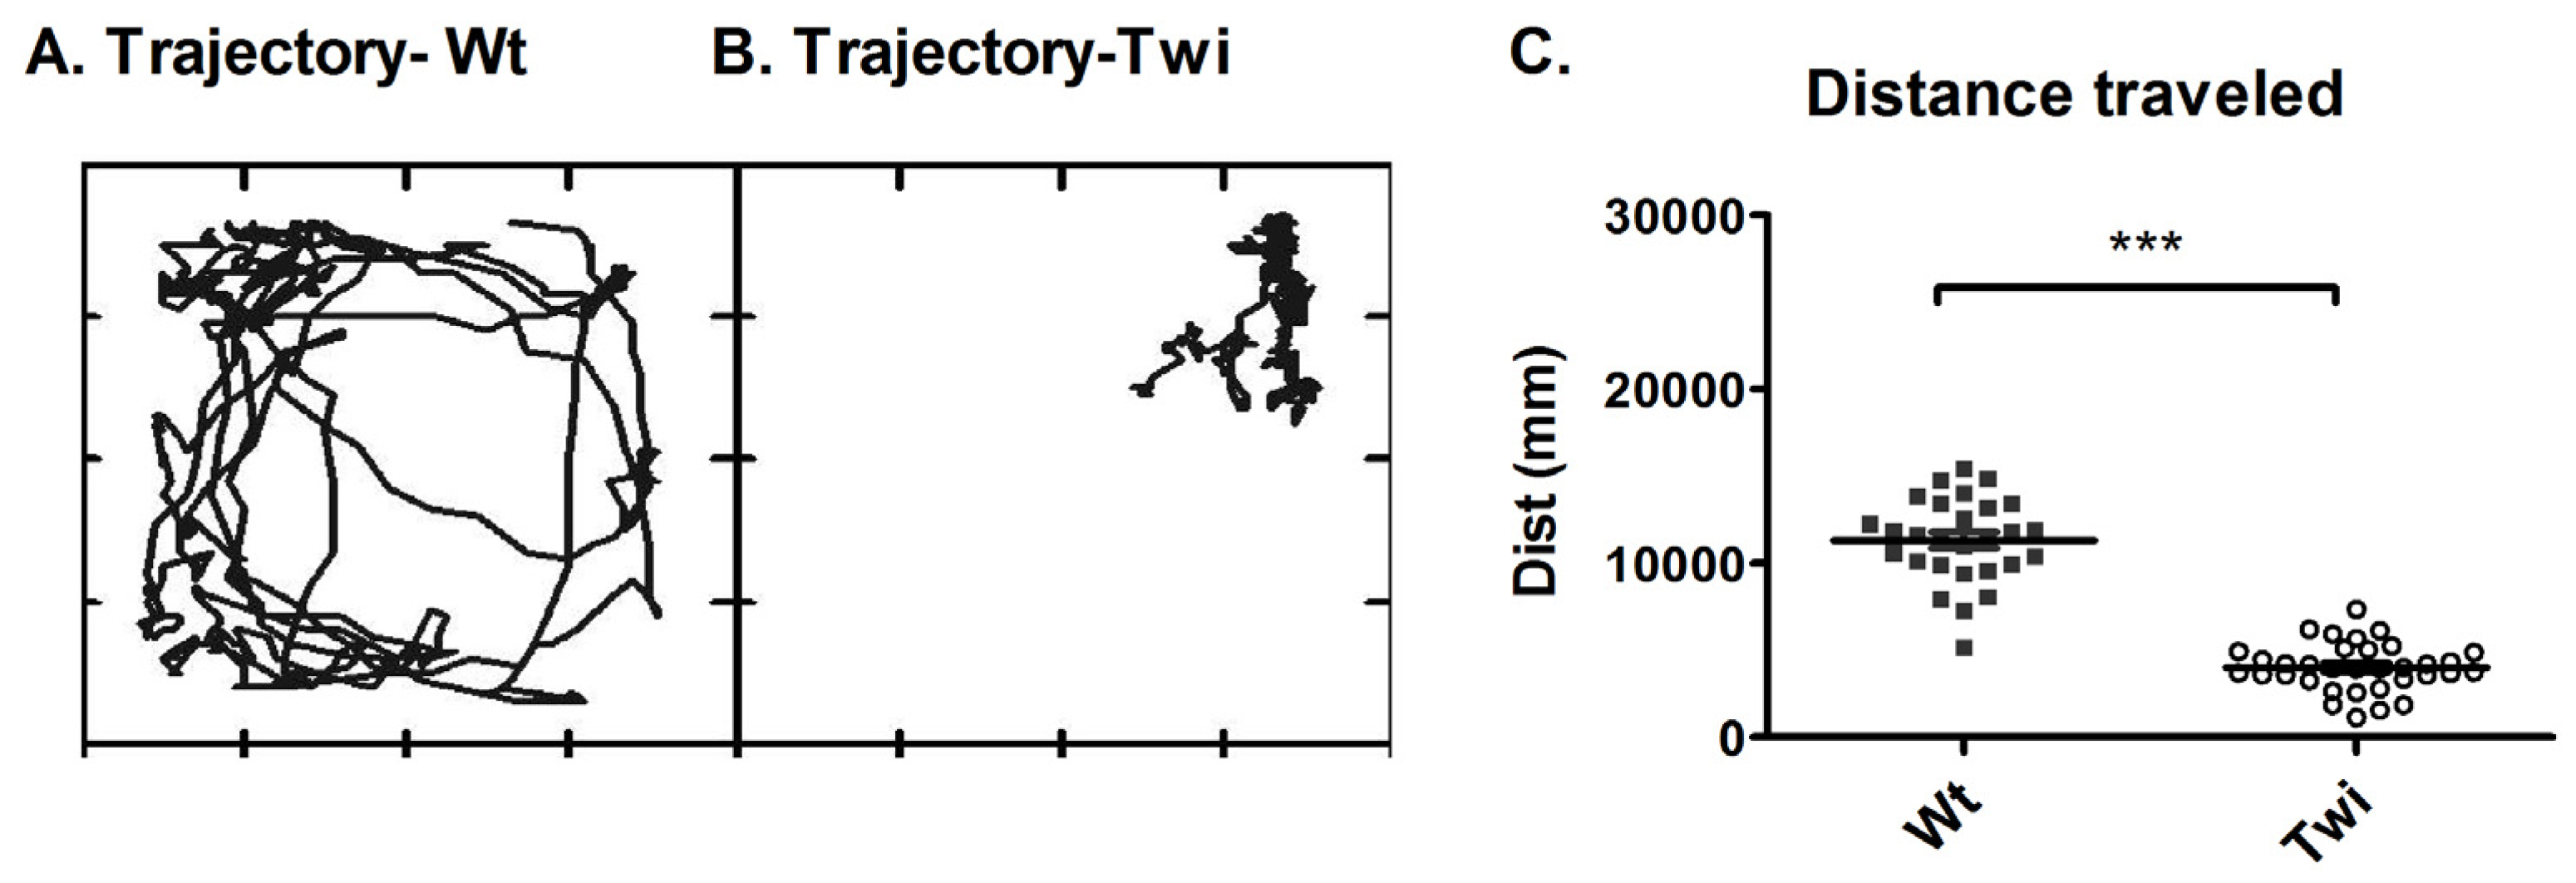
Figure 2.
Characterization of locomotor activity in the twitcher mouse. The movement trajectory of representative Wt and Twi mice are shown in (A) and (B), respectively. Each panel represents the movement of the mouse for duration of 1 minute. The box in which each movement trajectory is plotted represents the inside wall of the 20 cm × 20 cm cage that confined the mouse to the load plate. Each point in the panel represents the XY location of the mouse at a certain point of time. The total distance traveled during 6 minutes is shown in (C). The total distance traveled by the Wt mice (filled squares) is significantly higher than that of the Twi mice (open circles). The horizontal bars represent the mean and the error bars represent the SEM (***p < 0.001).
The Twi group had decreased locomotion compared to that of the Wt group. Representative trajectories of these two groups are shown in
Figure 2A and B. The total distance traveled was significantly lower in the Twi group compared to the Wt group (p < 0.001, t-test;
Figure 2C).
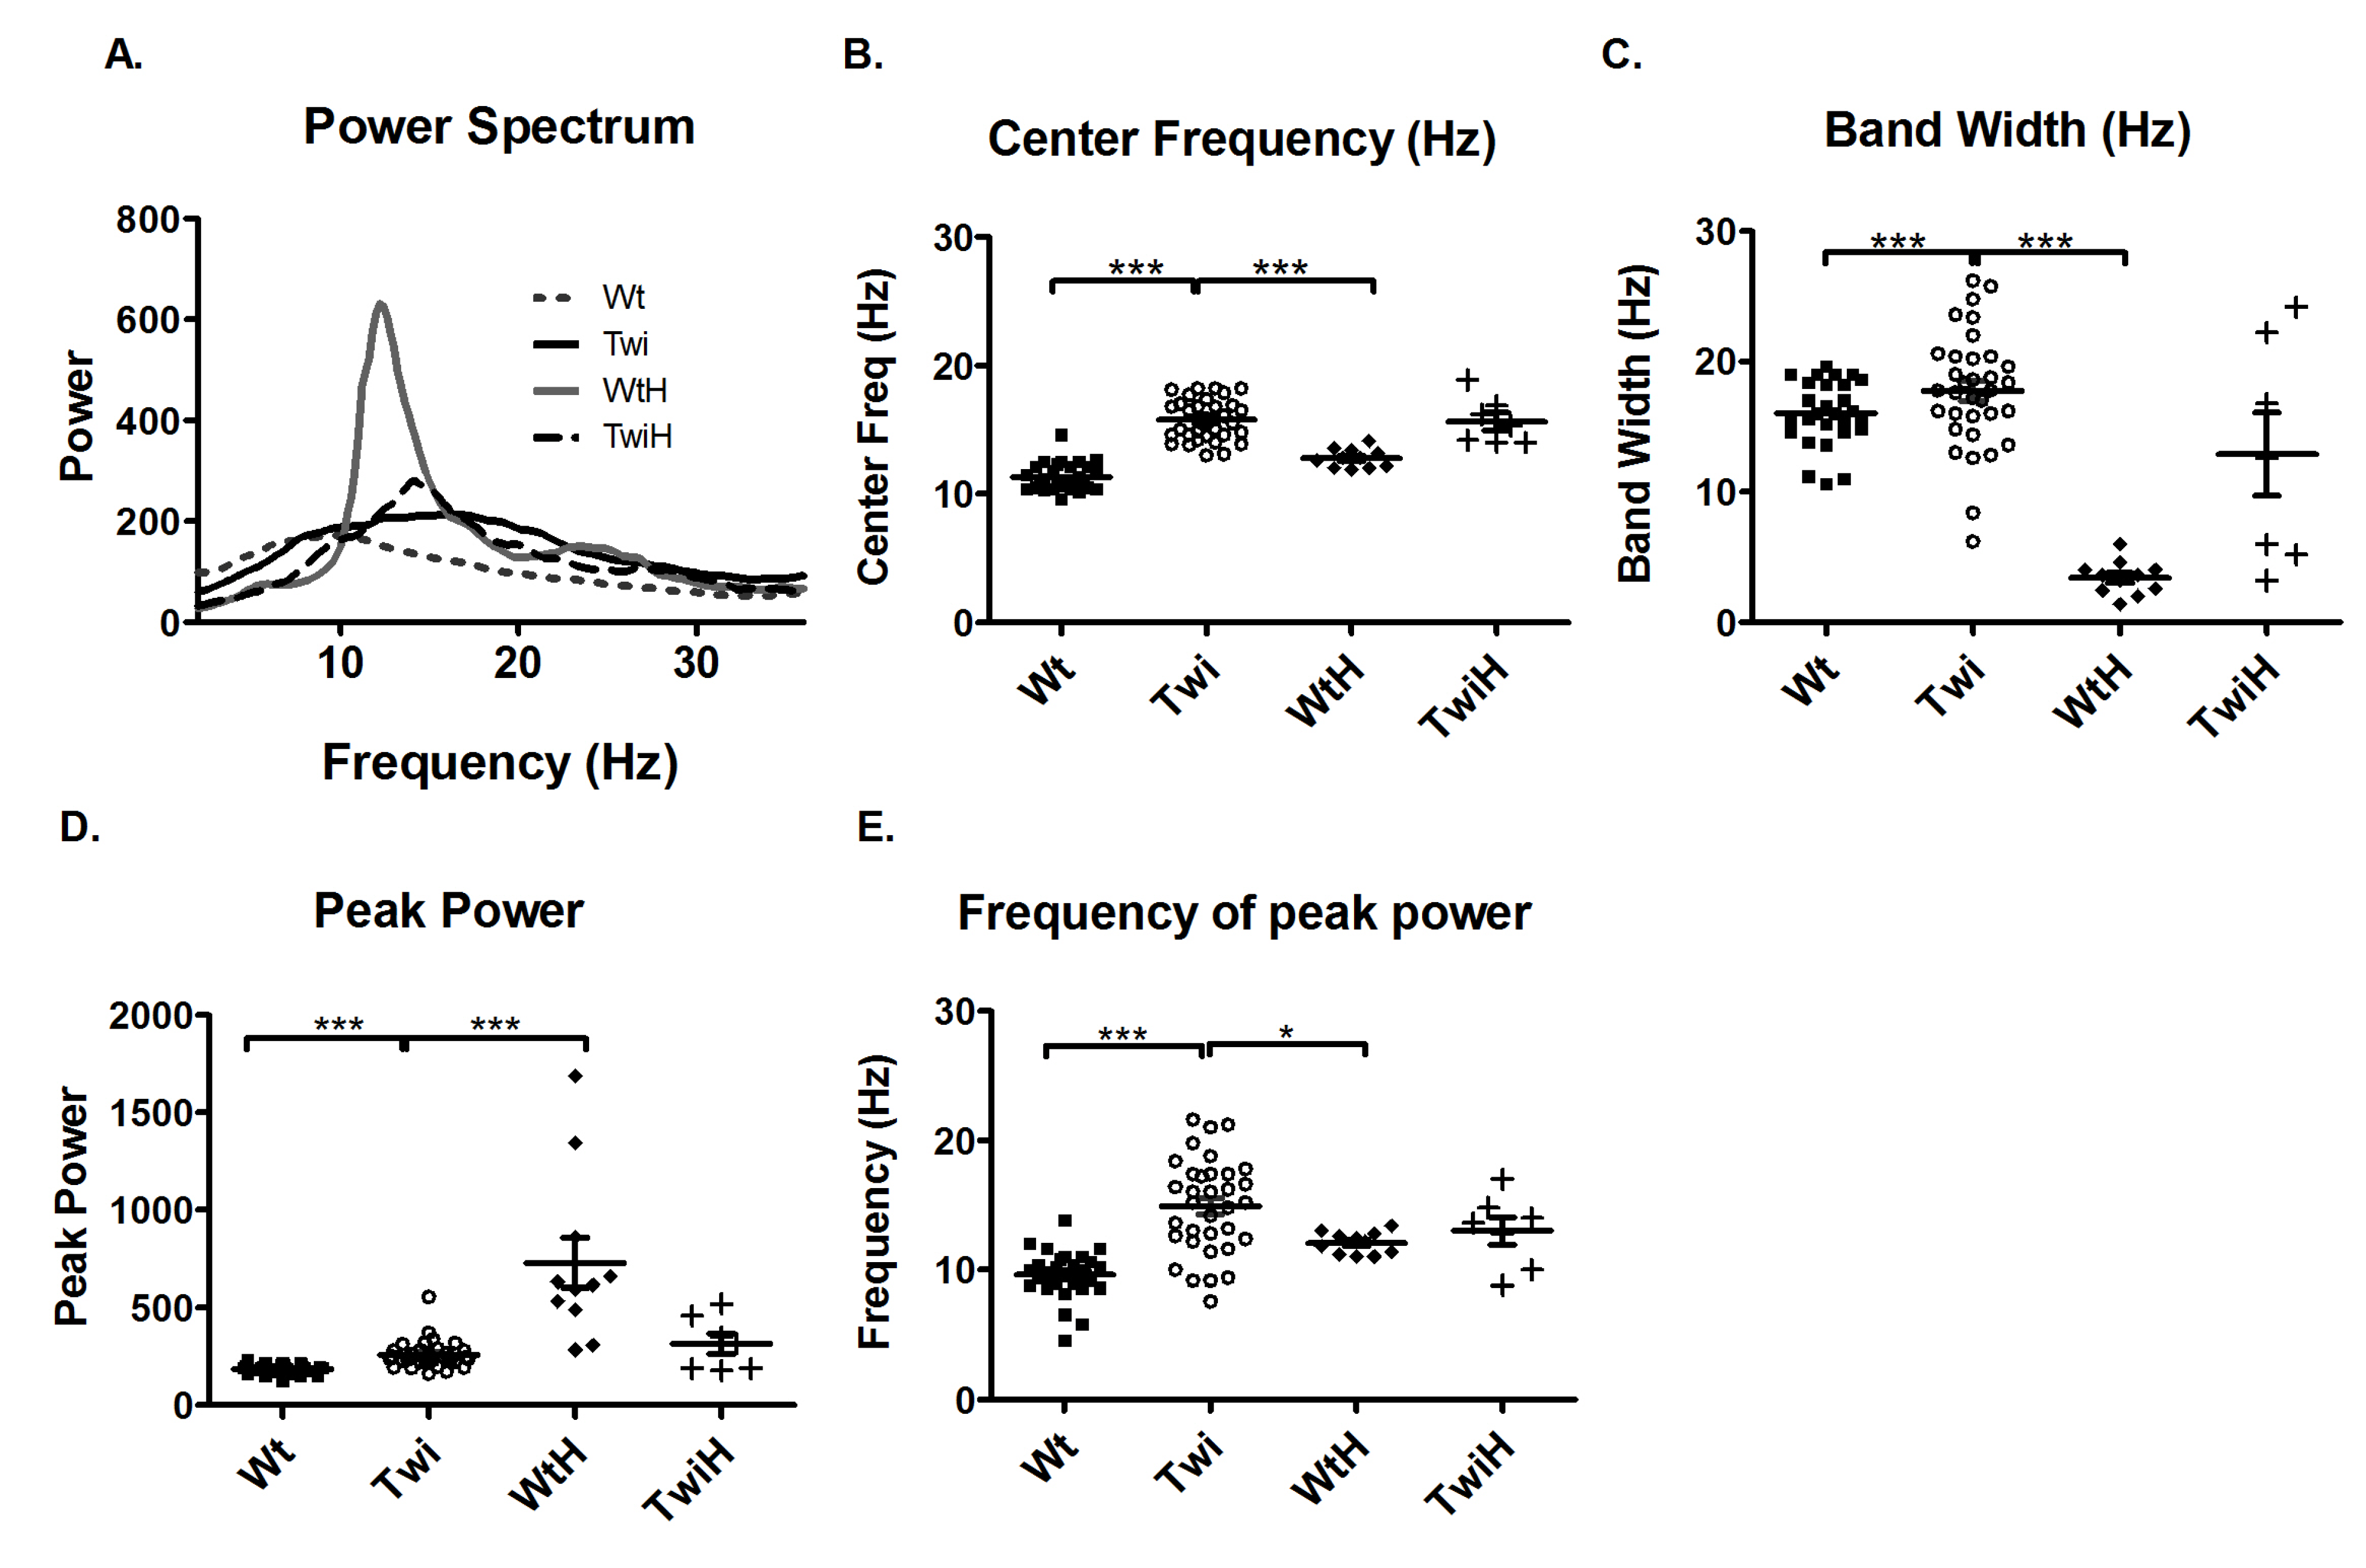
One way to validate the tremor recorded by this newly developed actometer is by comparing it to a relatively well accepted pharmacological tremor model (harmaline treatment) [
10]. Therefore, the tremor in the Twi mouse was compared to the tremor in the wildtype mice injected with harmaline (WtH). Harmaline induces a characteristic narrow-band, near 12-Hz tremor. Comparison of the Twi and the WtH animals revealed a robust between-group difference in the averaged power spectra (
Figure 3A). As quantified in terms of the mean of the center frequencies, the Twi mice (15.8 Hz) had significantly higher values than the WtH group (12.2 Hz) (p < 0.001; Bonferroni test,
Figure 3B). The WtH group had a near-12.2 Hz narrow peak, and the bandwidth was significantly less than that of the Twi group (p < 0.001; Bonferroni test,
Figure 3C). There was no statistically significant difference between the distance traveled and the number of low mobility bouts between the WtH and the Twigroups (data not shown), probably because tremor-inducing doses of harmaline in intact animals suppresses locomotion [
10].
Interestingly, when twitcher mice were injected with harmaline (TwiH), there was a blunted response with no statistically significant change in center frequency or bandwidth compared to the Twi group (
Figure 3B and C). In the WtH group, the peak power was significantly higher (p < 0.001; Bonferroni test;
Figure 3D) while frequency of peak power was significantly lower (p < 0.05; Bonferroni test;
Figure 3E) compared to the Twi group. There was no significant difference between the TwiH and WtH groups with respect to the distance traveled or the number of low mobility bouts (data not shown).
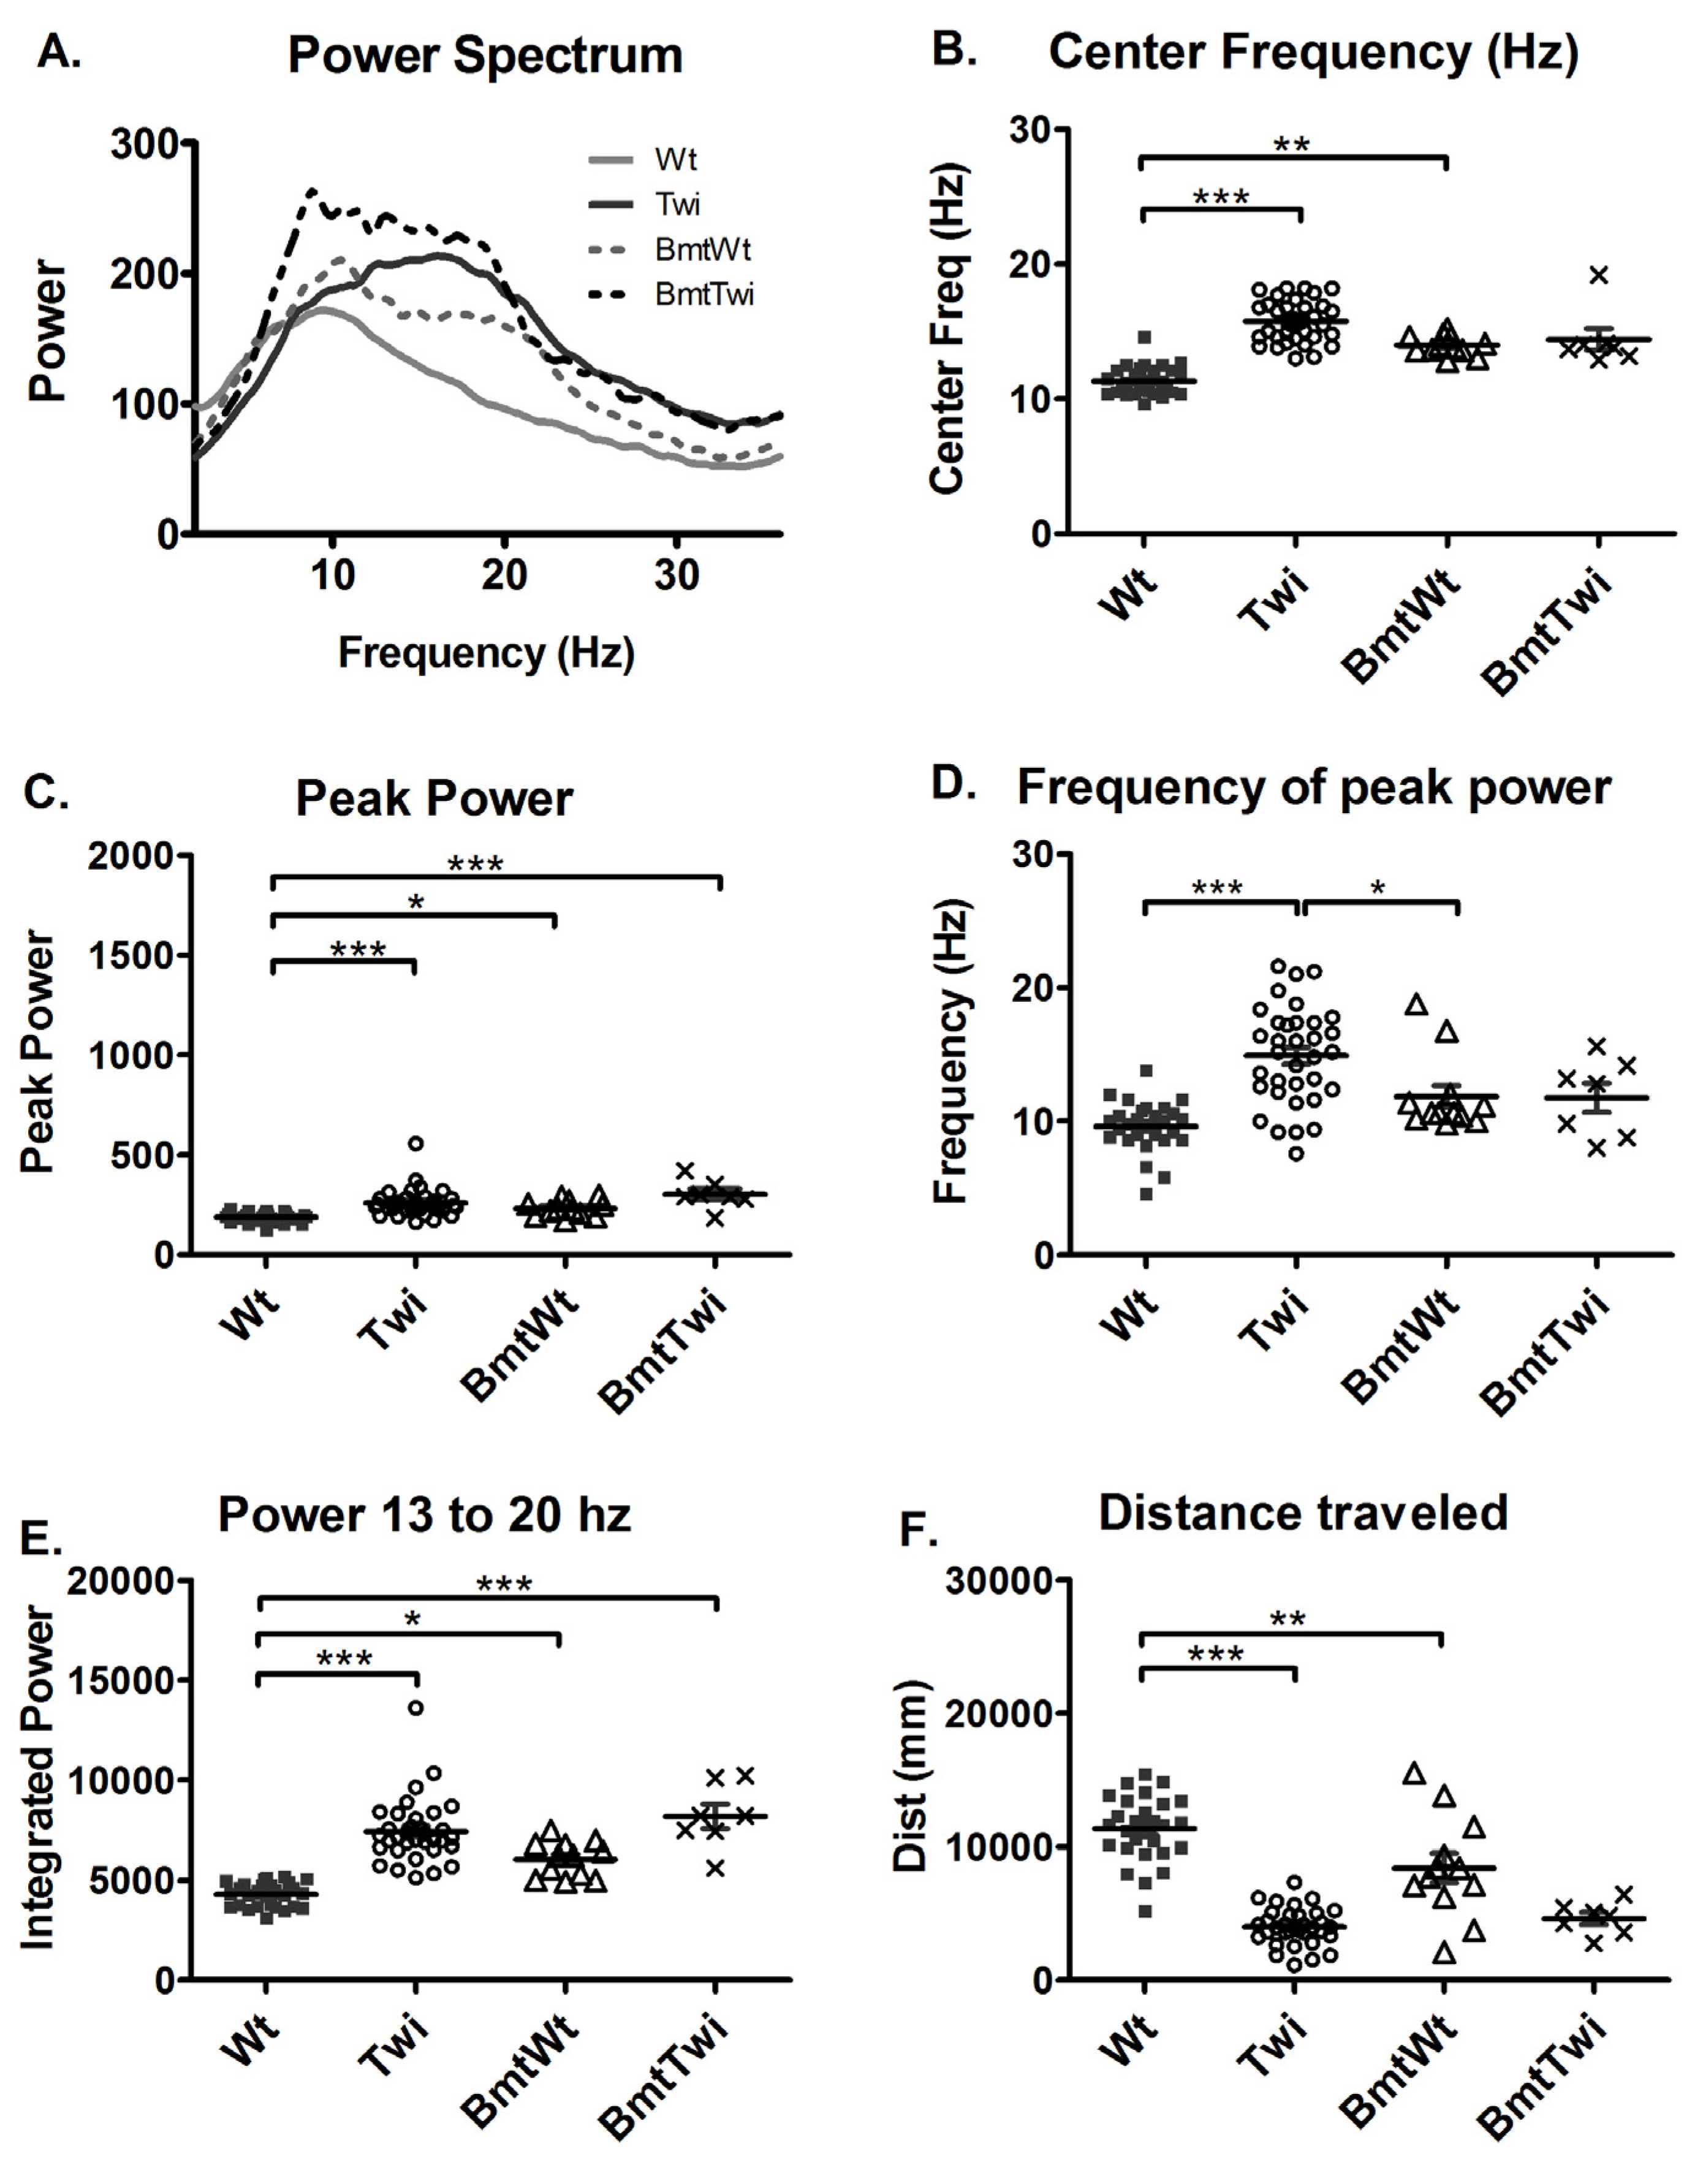
3.2. Effect of Treatment on Tremor
In order to directly assess the effect of myeloreductive conditioning and BMT on the power spectra, tremor quantification was performed on both wildtype and twitcher mice that received BMT (BmtWt versus BmtTwi). The engraftment in various groups is essentially as reported in the study by Reddy et al., 2011. BmtWt group had a mean +/– standard error engraftment of 20.52 +/– 3.077, BmtTwi group was at 12.1 +/– 1.9 and the AAVBMT group was 16.09 +/– 4.0. The engraftment level in the untransplanted animals was less than 1%.
The BmtWt group had greater power in both the frequencies around 10–12 Hz and in the higher frequencies in the 13–20 Hz range compared to the Wt group (
Figure 4A). The BmtTwi group had greater power in the near 10 Hz lower frequency range compared to the Twi group. The center frequency of the BmtWt group was significantly increased compared to the Wt group (p < 0.01; Bonferroni test;
Figure 4B). The bandwidth variable (data not shown) did not indicate any significant between-group effects. The peak power (
Figure 4C) and the power between 13 and 20 Hz (
Figure 4E) was significantly increased in the BmtWt group compared to the Wt group but not in the BmtTwi group compared to the Twi group. The frequency of peak power was not significantly different in the BmtWt group compared to the Wt group (
Figure 4D). There was no significant difference in the frequency of peak power between the BmtTwi group and the Twi group (
Figure 4D). The total distance traveled was significantly decreased (decrement in normal function) in the BmtWt group compared to the Wt group (
Figure 4F).
Figure 3.
Comparison of the tremor of the Twi mice with that of the tremor induced by harmaline. The average power spectrum (A) of the Twi mice (solid black line) reflected a broadband tremor and that of the WtH mice (solid gray line) showed a characteristic narrow band 12 Hz tremor. The response to harmaline was blunted in the TwiH mice (dashed black line). The center frequency (B) and bandwidth (C) were significantly increased in the Twi group (open circles) compared to the WtH group (filled diamonds), which exhibited the expected characteristic narrow band tremor typically induced by harmaline in mice. The peak power (D) was significantly increased in the WtH group compared to the Twi group. The frequency at peak power was significantly decreased in the WtH group compared to the Twi group. There was no significant difference in the center frequency, bandwidth, peak power and the frequency of peak power between the Twi and TwiH groups (plus symbols). Horizontal bars represent the mean and the error bars represent the SEM (***p < 0.001, **p < 0.01 and *p < 0.05).
![Jcm 01 00001 g003]()
Figure 4.
Effect of BMT on power spectra. The averaged power spectrum (A) of the BmtWt group (dashed gray line) is shifted upward and rightward compared to the Wt group (solid gray line). Similarly, the averaged power spectrum in the BmtTwi group (dashed black line) is shifted upward across a broad frequency band compared to the Twi group (solid black line). The center frequency (B) was significantly increased in the BmtWt group (open triangles) compared to the Wt group (filled squares). There was no significant difference between the untreated mut (open circles) and BmtTwi groups (cross marks) in the center frequency. The peak power (C), frequency of peak power (D) and the power between 13 and 20 Hz (E) was significantly increased in the BmtWt group compared to the Wt group. Compared to the Twi group, the BmtTwi group showed no significant difference in the center frequency (B), peak power (C), frequency of peak power (D) and power between 13 and 20 Hz (E). The distance traveled by the BmtWt group was significantly decreased compared to the Wt group (F). The horizontal bars represent the mean and the error bars represent SEM (***p < 0.001, **p < 0.01 and *p < 0.05).
![Jcm 01 00001 g004]()
3.3. Harmaline Response in BMT Animals
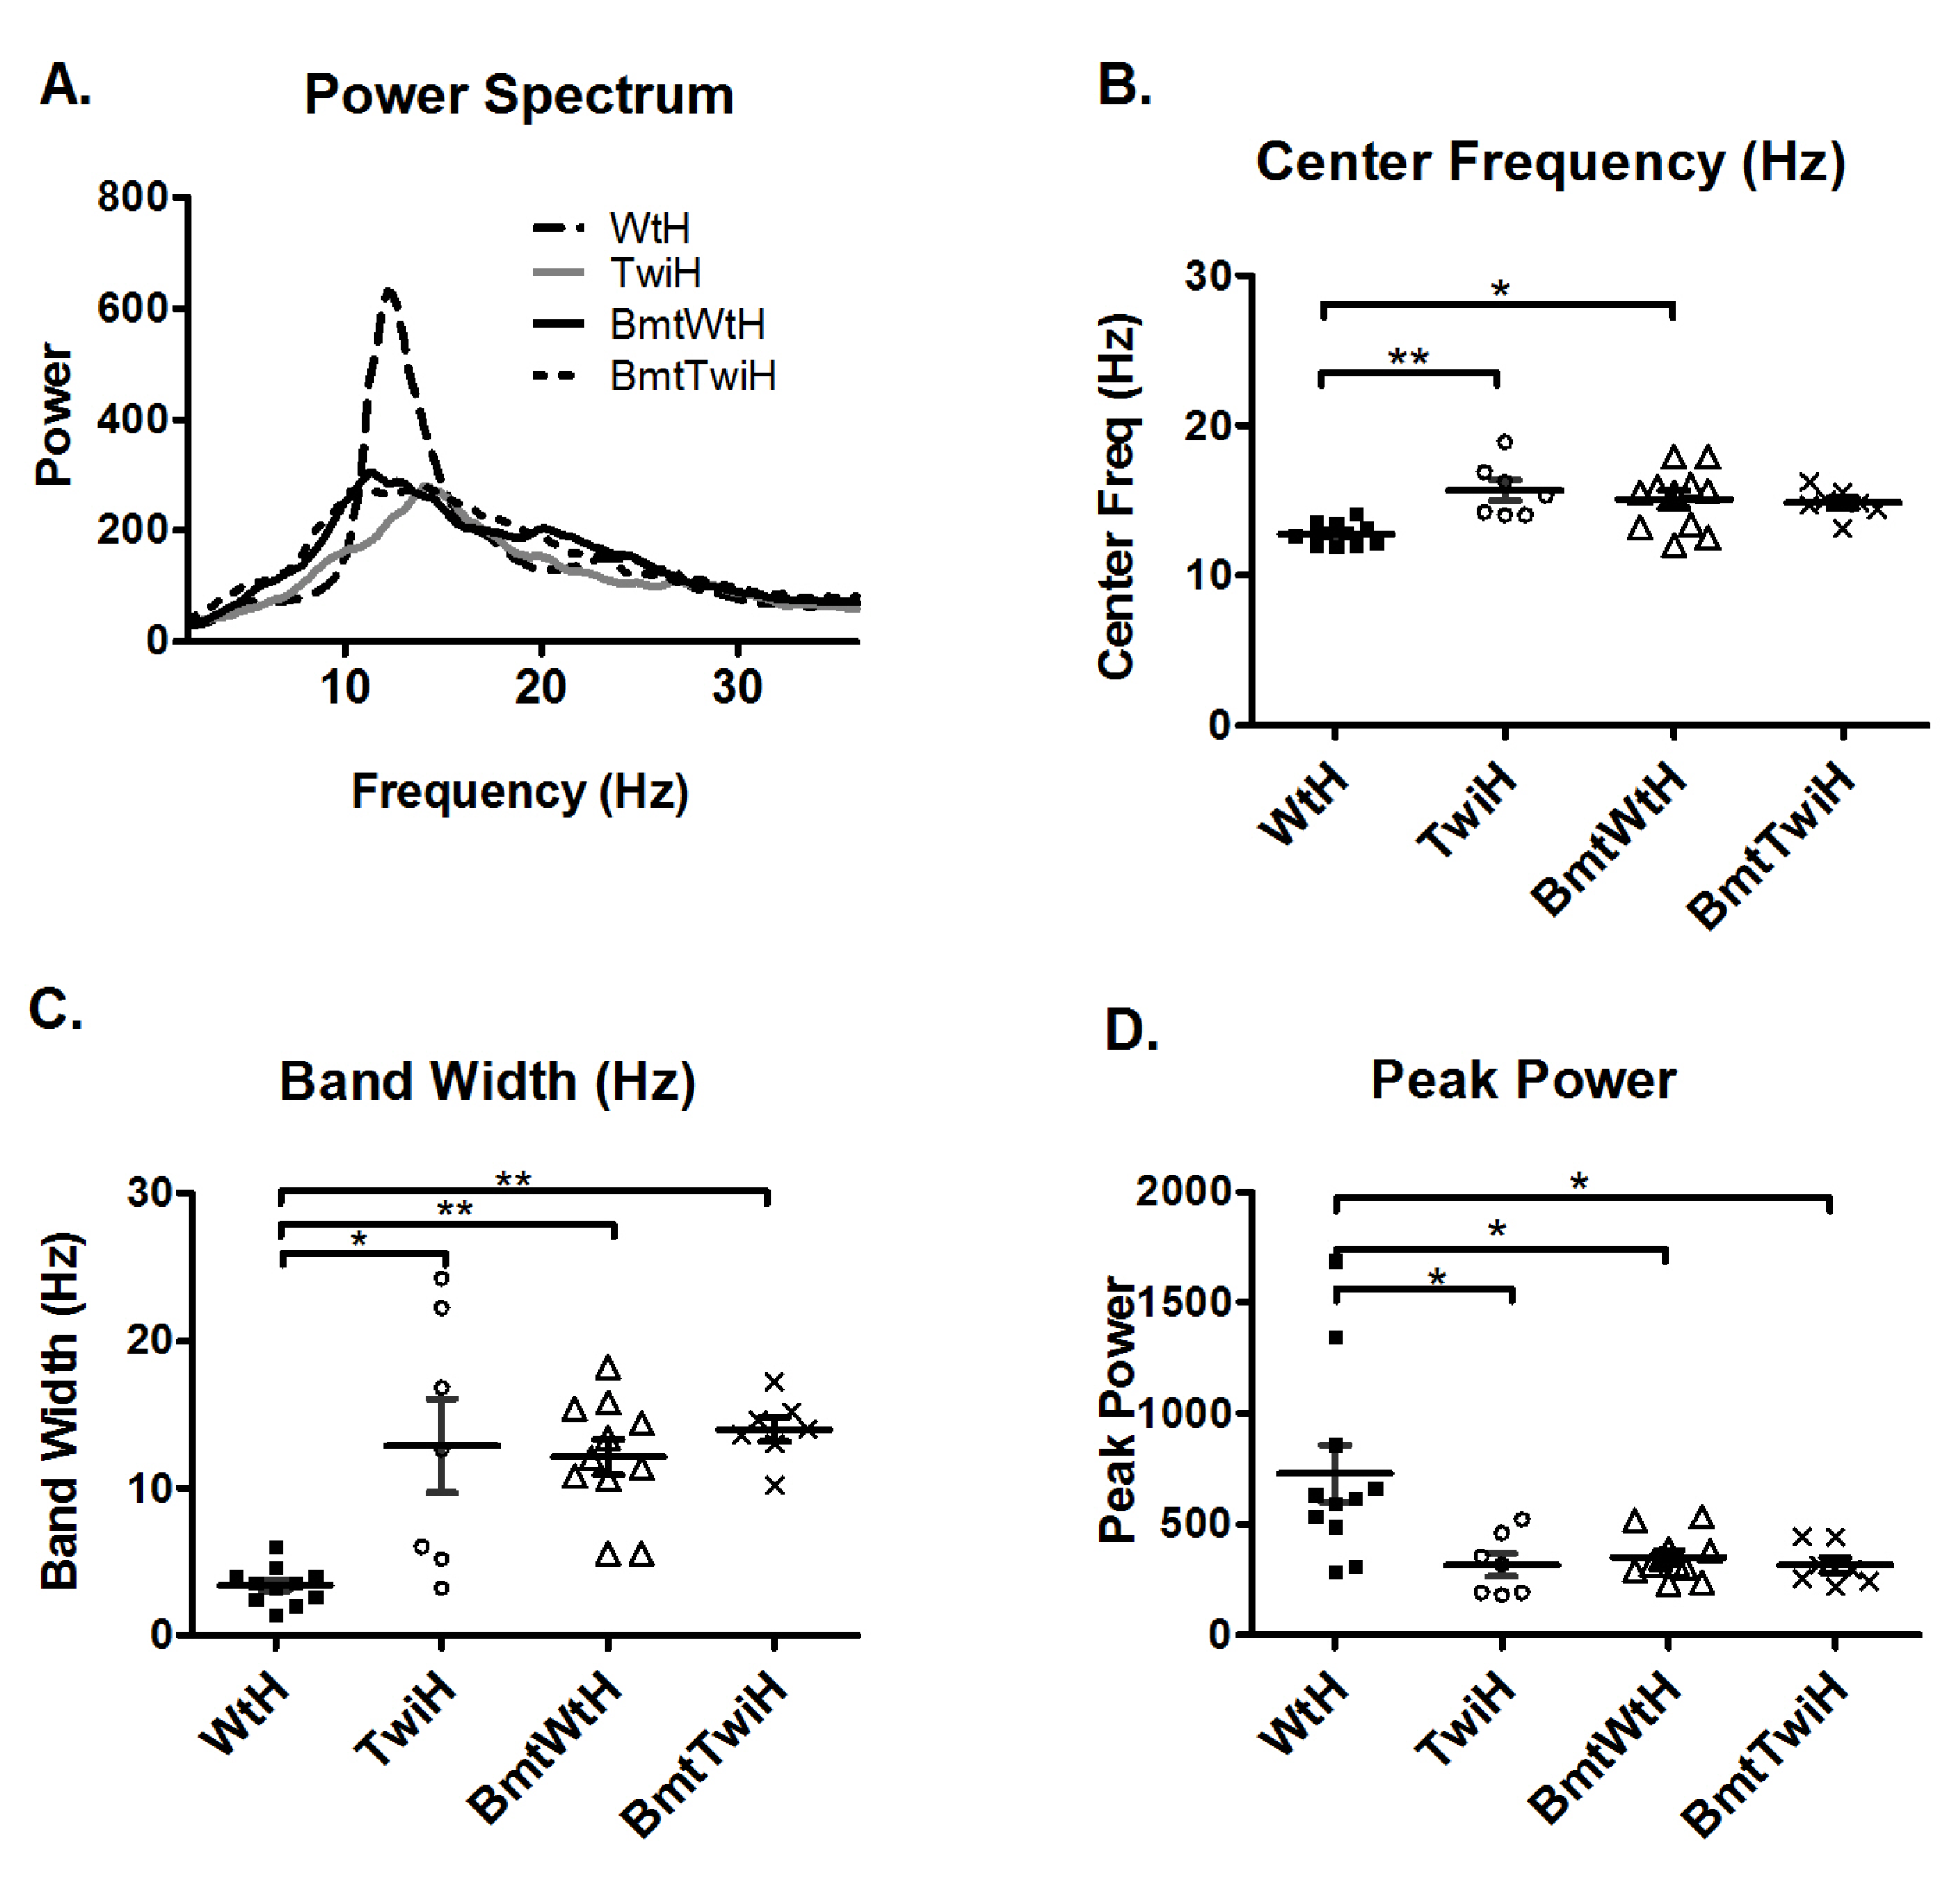
The BMT-treated animals that had additional higher frequencies in the averaged power spectra were compared to mice that received harmaline after BMT (BmtWtH and BmtTwiH). Interestingly, the mice in the BmtWtH group were more resistant to harmaline-induced tremors than the WtH group (
Figure 5A). The response to harmaline in the BmtTwiH group was similar to the TwiH group (
Figure 5A). The center frequency was higher and the bandwidth was broader in the BmtWtH group compared to the WtH group (
Figure 5B and C). The peak power was significantly lower in the BmtWtH group compared to the WtH group (
Figure 5D). There was no significant difference in the center frequency, bandwidth and peak power between the TwiH and BmtTwiH groups (
Figure 5B, C and D). There was no significant difference in the distance traveled or in the number of low mobility bouts in the groups compared in
Figure 5 (data not shown).
Figure 5.
Harmaline tremor response in the BMT-treated animals. Averaged power spectra of various groups treated with harmaline (A). The averaged power spectrum of WtH group (solid gray line) appears different compared to the averaged power spectrum of the other groups in (A). The averaged power spectra of the BmtWtH (solid black line), TwiH (dashed black line), and BmtTwiH (solid gray line) appear very similar to each other. The center frequency (B) and the bandwidth (C) were significantly increased in the BmtWtH group (open triangles) compared to the WtH group (filled squares). The peak power (D) was significantly decreased in the BmtWtH group compared to the WtH group. There was no significant difference in center frequency, bandwidth or peak power between the TwiH (open circles) and BmtTwiH groups (cross marks). Horizontal bars represent the mean and the error bars represent the SEM (***p < 0.001, **p < 0.01 and *p < 0.05).
3.4. Cerebellar Pathology
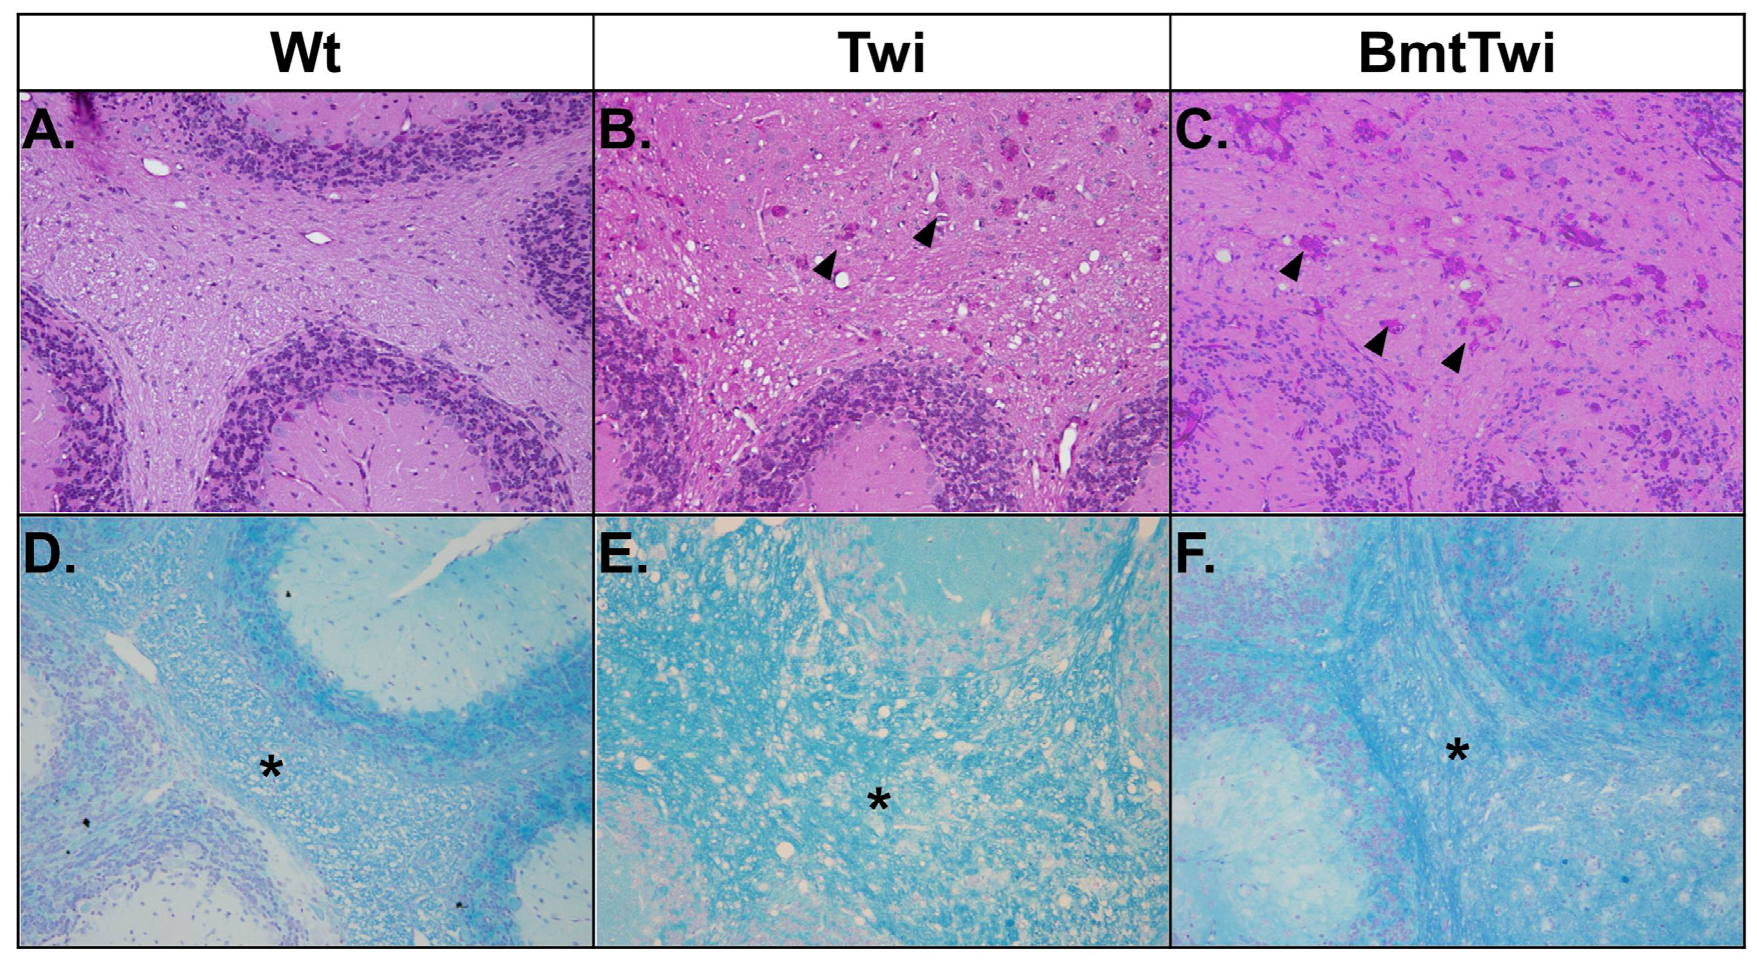
The brains of the various treatment groups were evaluated for the presence of globoid cells (multinucleated macrophages with storage material) and myelination using Periodic acid-Schiff (PAS) and Luxol fast blue (LFB) staining, respectively (
Figure 6). When stained for PAS, the cerebellar white matter from a Wt mouse shows no globoid cells (
Figure 6A), in contrast the brain from a Twi mouse contains a large number of multinucleate cells with pink staining cytoplasm (
Figure 6B, arrowheads). There is no apparent decrease in the number of globoid cells in the BmtTwi mouse compared to the Twi mouse (
Figure 6C). When the brains are stained for LFB, the Wt group shows uniform myelination in the cerebellar white matter (asterisk in
Figure 6D). In contrast, the architecture of the myelin in the Twi group appears less well organized, probably secondary to inflammatory edema (
Figure 6E). In the BmtTwi group, the myelin remains disorganized, similar to that observed in the Twi group (
Figure 6F).
Figure 6.
Histology- PAS and LFB staining. There are no identifiable PAS-positive cells in the cerebellum of the Wt animal (A). In the Twi (B), there are numerous pink multinucleated globoid cells (arrowheads). There is no obvious decrease in the number of PAS-positive cells in the BmtTwi group (C). Comparison of LFB staining in the cerebellar white matter (asterisk in D–F) and cerebellar folia shows a disruption of myelin architecture (blue staining) in the Twi (E) mouse compared to the Wt (D) animal. In the BmtTwi group (F), the myelin architecture remains disrupted, similar to the Twi group.


