1. Introduction
Gas–liquid hollow fiber membrane (HFM) contactors have attracted the attention of many researchers due to their high interfacial area per unit volume compared to conventional absorption processes. In HFM contactors, mass transfer occurs without dispersion of phases. Shell and tube HFM contactors are employed for the capture of gas impurities, such as CO
2 and H
2S, from natural gas and flue gas. The drawbacks of conventional absorption processes, such as the dispersion of phases, can be avoided in HFM contactors. The disadvantages of packed and tray contactor columns, such as emulsion formation, flooding at high gas flow rates, and weeping at low gas flow rates, can also be avoided in HFM contactors [
1,
2,
3,
4,
5]. The solvents used in CO
2 absorption and employed by both conventional packed bed columns and membrane contactors are aqueous alkanolamine absorbents. These are the most commonly used absorbents in CO
2 absorption processes, such as CO
2 detention from natural gas, flue gas, and biofuels. Despite the advantages of high absorption performance of alkanolamines, they can cause membrane degradation if used in HFM contactors, corrosion problems if used in industrial gas absorbers, and high-energy consumption during solvent regeneration and circulation. Consequently, researchers have continued to look for better absorbents. Ionic liquid is one of the choices proposed and has been used for CO
2 capture in HFM contactors [
6,
7,
8]. Another alternative is solid nanoparticles dispersed in water (nanofluids), which also makes for an environmentally friendly substitute absorbent. Distilled water has been found to be enhanced by solid nanoparticles, such as carbon nanotubes (CNTs) and silicon oxide (SiO
2) nanoparticles [
9,
10,
11,
12]. In [
13], the process of using water-based nanoparticles as solvents was modeled considering diffusion in the radial and axial directions under dry-mode conditions (nonwetting). In [
14], CO
2 was found to be absorbed by water that had been enhanced by nanoparticles, such as aluminum oxide, titanium oxide, and silica, in the concentration range of 0.05–0.2 wt%. In the study, the removal of CO
2 from a gas mixture of CO
2/N
2 using nanofluids (metal oxide in distilled water) in a membrane liquid–gas contacting module was examined. Metal oxide nanoparticles, namely, aluminum oxide (Al
2O
3), titanium dioxide (TiO
2), and silicon dioxide (SiO
2), in the concentration range of 0.01–0.2 wt% were experimentally investigated. In [
15], a numerical model was established to represent the process of capturing CO
2 from a gas mixture using HMC in distilled water enhanced by carbon nanotubes and nanosilica, mainly at high nanofluid absorbent flow rate. Another study on CO
2 absorption mechanisms for advancements in the use of nanofluids as absorbent in gas–liquid HFM contactors indicated that absorption of CO
2 using nanofluids as absorbent was a challenging method for acid gas removal from gas mixtures [
16]. CO
2 absorption from gas mixtures in nanofluids (silica in distilled water) in bubble column absorption has also been investigated [
17].
In the area of modeling and simulation of nanofluids, a 2D numerical model was developed for the study of CO
2 gas capture from a gas mixture in a HFM contactor, with water-based nanofluids used as the liquid absorbent [
13,
18]. The nanofluids that were composed of 0.05 wt% silica nanoparticles were found to enhance separation by around 15%, while a 30% increase was shown using nanofluids composed of distilled water-based CNTs [
18]. In [
19], a model describing the absorption of CO
2 from a gas mixture in a water-based CNT inside a HFM contactor revealed that absorption of CO
2 was enhanced using solid nanoparticles in water-based solvent. In [
20], nanoparticles, such as SiO
2, Al
2O
3, CNT, and Fe
3O
4, were dispersed in distilled water at different concentrations (0.02, 0.05, and 0.1 wt%) and in methyldiethanolamine (MDEA) and diethanolamine (DEA) at concentration of 0.02 wt% to form nanofluids. The prepared nanofluids were used in direct contact with pure CO
2 in a closed vessel at high operating pressures (20, 30, and 40 bar) and a fixed operating temperature of 308 K. In [
21], the absorption mechanism of CO
2 in the presence of nanoparticles compared to fresh water were clarified. In [
22], holdups of solid nanoparticles, such as CNT, Fe
3O
4, Al
2O
3, and SiO
2, in purified water were used as absorbents for CO
2 in a pilot HFM contactor. In [
23], the effect of nanofluids composed of solid nanoparticles on the mass diffusion rate of CO
2 absorption were considered. Experiments and modeling of the process performance of CO
2 capture from gas mixtures using flat sheet membrane contactors were investigated in [
24]. In [
25], a model of CO
2 removal from natural gas in HFM contactors was developed and solved using COMSOL software package version 5.4 (Comsol AB, Stockholm, Sweden). The model was comprehensive, taking into account momentum, energy, and mass transport, and the model predictions were within the range of the experimental data. An earlier review looked at the absorption of CO
2 in membrane contactors [
26]. Absorption of CO
2 from the gas mixture of air/CO
2 in gas–liquid HFM contactors via nanofluids comprising silica nanoparticles and carbon nanotubes were experimental investigated in [
27]. Experimental and theoretical studies have also been performed for the absorption of CO
2 in a lab-scale reactor using nanofluids composed of carbon nanotubes. Nanosize Al
2O
3 particles were used, with water and methanol acting as the base fluids [
10,
28].
In the present work, a comprehensive 2D mathematical model was developed and solved to study the chemical absorption of CO
2 from CO
2/N
2 gas mixture in aqueous MDEA-based CNT inside a HFM contactor, with the model considering partial wetting. As resistance is mainly located in the liquid phase around solid nanoparticles [
18], the membrane module was modeled as five subdivisions: two in the tube side (solid-free region and dense phase), two in the membrane (wetted and dry), and one in the shell side (gas phase). The system governing the material balance equations were numerically solved using the finite element method in COMSOL Multiphysics version 5.4. The model predictions were validated with experimental data available in the literature. CO
2 concentration profile was investigated in dry and wetted membrane modes. The effect of operating conditions, such as gas flow rate, liquid flow rate, absorbent size, and concentration, on percentage removal of CO
2 was studied.
2. Mass Transfer Resistance in HFM Contactor
The overall mass transfer resistance (
) in a gas–liquid HFM contactor based on the film theory involves three main resistances in series: liquid phase resistance (
), membrane resistance (
), and resistance of the gas phase boundary layer (
). Accordingly, the overall mass transfer resistance in a HFM contactor is expressed as follows:
where
is the mass transfer coefficient in the gas side (m/s);
is the mass transfer coefficient in the membrane side (m/s);
is the mass transfer coefficient of the liquid phase;
,
, and
are the HFM’s inner, outer, and logarithmic mean diameters, respectively; and
is the dimensionless distribution coefficient at the gas–liquid interface. The mass transfer coefficients
and
are based on flow conditions and geometry of the HFM contactor [
29].
The mass transfer resistance of membrane (
) consists of two resistances: dry membrane resistance (
) and wetted membrane resistance (
), calculated as follows:
where
is the fraction length of membrane pores filled with solvents;
and
are the mass transfer coefficient in gas- and liquid-filled pores, respectively; and
,
, and
τ are the membrane porosity, membrane thickness, and membrane tortuosity, respectively. The liquid mass transfer coefficient is determined using the following relationship:
where
is the Sherwood number, and
is the Gratz number determined as follows:
The diffusion coefficient of CO
2 in the liquid phase is determined by the following relationship [
30]:
The diffusion coefficient of CO
2 in the dense liquid film around the nanoparticles is expressed as per Equation (9) [
31]:
where
is the solid volume fraction, and
Re is the Reynolds number of the nanosized particles (Brownian motion):
where
is the Boltzmann constant (
),
is the temperature in K,
is the liquid density,
is the particle diameter,
is the particle density, and
is the viscosity of the liquid.
The Schmidt number
is
The mass transfer coefficient in the gas phase, i.e., the gas stream flowing in the shell side, is determined by [
32]:
where
,
, and
are the Sherwood number, Reynolds number, and Schmidt number in the shell side, respectively:
,
,
.
The diffusivity in the gas phase () is determined using the Chapman–Enskog equation for gas mixture: . The density of the CO2/N2 gas mixture was 343 , and the viscosity was Pa·s. The resistances in series were therefore found to be , , , and 165 s/m for the resistances of liquid in the tube side, dry membrane, wetted membrane, and the gas stream in the shell side, respectively. The membrane resistance of the wetted pores was the highest, followed by the liquid phase in the tube side.
3. Mathematical Model
The mathematical model developed in the present work describes the CO
2 concentration profile in a partially wetted HFM contactor, where CO
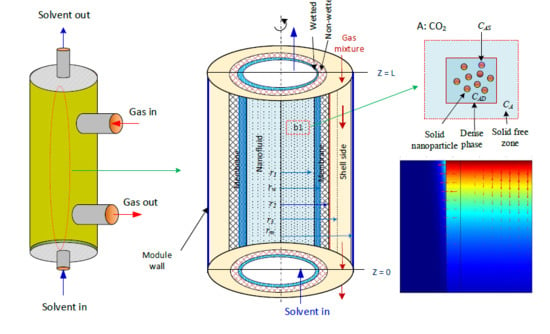
2 is absorbed in aqueous MDEA-based CNT. The membrane contactor comprises three fragments: tube, membrane, and shell section. The tube side, where the absorbent nanofluid passes through, is divided into two subregions: solid-free zone and dense phase. The gas mixture is transported in the shell side counter-currently with the solvent flow direction (
Figure 1a).
Figure 1b is the subdivision of the membrane module used to develop the mathematical model equations [
28]. CO
2 in the gas phase diffuses through the membrane pores to the nanofluids in the tube side. The ability of N
2 to dissolve in aqueous MDEA solvents is insignificant relative to CO
2; subsequently, part of the CO
2 dissolved in the liquid nanofluid is adsorbed on the surface of the solid nanoparticles, and the other portion reacts with MDEA (
Figure 1c). The model considers two main mechanisms that generally take place in the presence of nanofluids: the Brownian motion (random motion of particles suspended in a fluid) and the grazing effect [
33,
34,
35]. The presence of solid nanoparticles in nanofluid enhances the gas absorption due to the adsorption of diffusing gas in the dispersed solid particles. Hence, the gas concentration in the liquid phase near the interface decreases, leading to an increase in the concentration gradient and therefore the absorption rate [
16]. Brownian movement increases the velocity near the solid nanoparticle. Microconvection is formed and mass flux dissemination develops, hence altering the diffusion constant [
5]. The grazing effect takes place in CO
2 adsorption at the gas–liquid interface in the presence of solid nanoparticles [
36].
The reaction between acid gases (CO
2) and MDEA has been cited in many articles [
3,
11,
12,
37]. There is no hydrogen atom attached to the nitrogen atom in the tertiary amine (MDEA). Hence, CO
2 first dissolves in the water available with the aqueous alkanolamine to form a bicarbonate ion. It can then react with the amine [
38]:
The reaction rate of CO
2 is
Based on Happel’s free surface [
39], laminar gas flow surrounds the membrane tubes. At the Happel’s fictional radius (
), symmetry is considered. The following assumptions were considered in the model development: steady state operation, constant solvent properties, ideal gas, and nanoparticles as homogeneous. The mathematical equations that describe the system behavior were developed for the tube side (solid nanoparticles and liquid), microporous membrane (wetted and dry), and shell side (flow of gas stream). Accordingly, the model equations for the CO
2 diffusion path in the tube, membrane, and shell regions are described in the following subsections.
3.1. Tube Lumen
The flow of nanofluids (CNT, water, MDEA) in the tube lumen side and the depletion of CO
2 in the lumen side of the membrane take place by absorption of CO
2 in water and by the adsorption of CO
2 on the surface of the nanoparticles and the reaction with aqueous MDEA. Considering the membrane’s partly moisturized section, Equation (15) represents the CO
2 concentration profile in the solid-free zone (
) with dimensionless radius and length:
The concentration of CO
2 in the dense phase (
) is
The dimensionless parameters are symbolized by , .
In Equation (15),
is the diffusion coefficient of the CO
2 in the solid-free zone in the tube lumen,
is the diffusion coefficient of CO
2 in the dense solid phase,
is the CO
2 concentration in the dense phase,
L is the length of the membrane, and
R is the radius of the hollow fiber. The adsorption rate,
, is as follows:
where
is the solid–liquid mass transfer coefficient (
,
is the solid–liquid interfacial area (
,
is the solute concentration in the suspension (
),
is the solute concentration at the interface of the particles (
).
The adsorbed amount of CO
2 on the solid nanoparticles per unit mass of particles,
can be given by
where
is the velocity in the tube side. The
value is estimated from Equation (19). The following correlation is used for mass transfer for flow past single spheres [
32]:
The value of
was found to be 2.08, hence
Then, the
value is determined as follows:
where
is the CO
2 diffusivity in the solid-free zone. The adsorption of the CO
2 onto the surface of nanoparticles (
) is described by the Langmuir isotherm equation as follows:
where
is the adsorbed amount of CO
2 on solid surface per unit mass of particle,
is the highest quantity of adsorbed gas solute, and
is the Langmuir coefficient. The velocity distribution inside the tube (
) is assumed to follow Newtonian laminar flow as per Equation (23).
The appropriate boundary conditions are as follows:
3.2. Membrane
3.2.1. Wetted Membrane Section (
The steady-state material balance for the transport of CO
2 is inside the wetted portion of the membrane (there is reaction but no convective term), and diffusion takes place in the wetted membrane. The CO
2 transport in the wetted membrane portion is described by Equation (28):
where
is the concentration of CO
2 in the wetted portion of the membrane segment. The diffusivity of CO
2 in the wetted membrane section is determined as follows:
.
The appropriate boundary conditions in wetted membrane (wm) zone are as follows:
3.2.2. Dry Section of the Membrane (
The CO
2 concentration in the dry part of the membrane, where there is no reaction and no convective term and only diffusion takes place, is calculated as follows:
The arbitrary boundary conditions are as follows:
The diffusivity of CO2 in the nonwetted membrane section is , where and are the porosity and tortuosity of the membrane, respectively.
3.3. Shell Side
The material balance of the CO
2 in the shell side (
), bounded between the membrane’s outer skin layer and Happel’s free surface model at steady state, is as follows:
The arbitrary boundary conditions are
The axial velocity in the shell side is expressed by Happel’s free surface model [
39]:
Table 1 lists the parameters used in the numerical solution of the model equations. COSMOL Multiphysics 5.4 was employed to solve the set of partial differential equations.
The properties of the solid CNT are listed in
Table 2.
4. Results and Discussion
Analysis of the mass transfer resistance in the HFM contactor (liquid, membrane, and gas phases) revealed that wetting of membrane pores by the absorbent liquid led to a high increase in the total membrane resistance and hence decreased the percentage removal of CO
2. This can be attributed to the presence of stationary liquid in the wetted piece of the membrane pores, which consequently caused a delay in the CO
2 transport in the membrane holes. Accordingly, the concentration of the CO
2 at the membrane–liquid interface decreased, and the CO
2 removal efficiency also decreased [
44]. In the absorbent liquid nanofluid stream in the tube lumen, the liquid–solid mass transfer resistance was low due to the nanosize of the solid nanoparticle; hence, the mass transfer resistance was concentrated in the solid-free liquid region [
22].
In order to check the accuracy of the developed mathematical model, the model was validated with our published experimental data obtained for CO
2 absorption from a gas mixture consisting of CO
2/N
2 in aqueous alkanolamine solution with and without solid nanoparticles of carbon nanotubes dispersed in the aqueous MDEA [
40]. The model predictions (solid line) for both amine-free aqueous solution (5 wt% MDEA, with the balance being water) and aqueous amine solution with carbon nanotubes (5 wt% MDEA, 0.5 wt% CNT, with the balance being water) are depicted in
Figure 2. There was an excellent match between the experimental and simulation results, confirming the promising predictions of the developed model. The deviation of the predicted results from the experimental data was measured using the root mean square error (RMSE) as follows:
where
is the sum of the investigated data points, and
is the square of the error between predicted results from the model and experimental data point. The relative error (
was measured as per Equation (45):
where
and
are the experimental and model prediction data points, respectively. The value of the RMSE for the system of aqueous 5 wt% MDEA/water was around 0.01, while it was 0.007 for CNT/MDEA/water. Results revealed that the CO
2 removal rate increased when liquid flow rate increased. This can be attributed to the fact that the thickness of the liquid boundary layer decreased with the increase in liquid flow rate, and the decrease in the liquid boundary layer in the hollow fiber increased the CO
2 diffusion rate into the absorbents. Consequently, the liquid–gas border was kept at low CO
2 concentration (high concentration gradient), which improved the percentage removal of CO
2.
At constant liquid flow rate, the effect of flow rate of gas (GFR) on the percentage removal of CO
2 is depicted in
Figure 3. It can be seen that the percentage removal at a fixed liquid flow rate was not evenly spaced; rather, as expected, the percentage removal of carbon dioxide decreased at high gas flow rates. With the increase in gas volumetric flow rate from 10 to 20 mL/min, a sharp decrease in percentage removal of CO
2 from 45 to 25% occurred. This can be attributed to the decrease in the residence time of the gas stream in the shell side of the hollow fiber membrane, which negatively influenced the effectiveness of CO
2 separation in the membrane contactor. The percentage removal of CO
2 (
) can be obtained as per Equation (46):
The influence of feed flow rate of gas on CO
2 removal flux is shown in
Figure 4. Increasing gas velocity improved the gas mass transfer coefficient and hence increased the CO
2 withdrawal flux [
24]. This can be attributed to the fact that the gas mass transfer coefficient is directly related to the gas velocity [
18]. The CO
2 removal flux, which is used to indicate the process efficiency, can be estimated by the following equation:
where
is the CO
2 removal flux;
and
are the inlet and exit CO
2 mole fraction, respectively;
and
(m
3/s) represent the inlet and exit volumetric flow rate of gas in the gas phase, respectively;
is the real gas temperature; and
represents the membrane area at the liquid–gas interface.
As can be seen from the figure, there was a significant increase in CO
2 removal flux when the liquid flow rate increased from 10 to 20 mol/min, with the removal flux increasing from
to
mol/m
2·s. By contrast, the increase in molar flux was insignificant when the liquid flow rate increased from 20 to 40 mL/min. This can be attributed to the drop in the CO
2 concentration gradient with increasing liquid flow rate. The crosswise contour of CO
2 concentration in the HFM contactor is predicted in
Figure 5. The inlet liquid and gas flow rates were both fixed at 10 ml/min. The feed stream contained 20 vol% CO
2 in the CO
2/N
2 gas mixture. The inlet nanofluid contained dispersed CNT in aqueous MDEA solution (5 wt% MDEA, 0.5 wt% CNT, with the balance being water). The diagram reveals that there was a drop in the CO
2 volume in the inlet gas stream. It dropped downward in the shell side of the membrane from 20 to around 5 vol%.
Figure 6 is the surface plot of the CO
2 volume at high gas flow rate (30 mL/min) and fixed liquid flow rate (10 mL/min). As expected, the higher the gas velocity, the lower was the CO
2 removal rate [
36]. In this case, the percentage removal of CO
2 dropped from 90% (GFR = 10 mL/min) to around 60% (GFR = 30 mol/min).
Figure 7 displays the effect of membrane wetting on the percentage removal of CO
2 at variable gas volumetric flow rates and fixed liquid flow rate (10 mL/min). The diagram reveals that the percentage wetting of membrane had a significant impact on the percentage removal of CO
2. As the wetted membrane portion increased, the percentage removal of CO
2 decreased. This can be attributed to the fact that the membrane resistance increased with membrane wetting because the diffusion coefficient of gas in the wetted membrane (liquid-filled pores) was much lower than the CO
2 diffusion in the dry membrane (gas-filled pores). At fixed membrane wetting, as the gas flow rate increased, the percentage removal of CO
2 decreased. This can be attributed to the fact that, as the gas flow rate increased, the gas residence time in the membrane shell side decreased, thereby reducing the chance of gas molecules to come into direct contact with liquid at the gas-liquid interface.
The effect of nanoparticle volume fraction on the solvent is depicted in
Figure 8. The diagram reveals that the percentage removal of CO
2 increased with solid nanoparticles, which can be attributed to the grazing effect (increase in the amount of CO
2 adsorbed into the surface of the CNT). The increase would be limited by obtaining a homogeneous solvent, but this is not achievable for high CNT concentration [
36].


