Structure of a Sialo-Oligosaccharide from Glycophorin in Carp Red Blood Cell Membranes

Abstract
:1. Introduction
2. Materials and Methods
2.1. Materials
2.2. Preparation and Isolation of Glycophorin from the Red Blood Cell Membranes
2.3. Preparation of the Carp Glycophorin Carbohydrate Fraction
2.4. High-Performance Liquid Chromatography (HPLC)
2.5. Desalting of Oligosaccharide Fractions
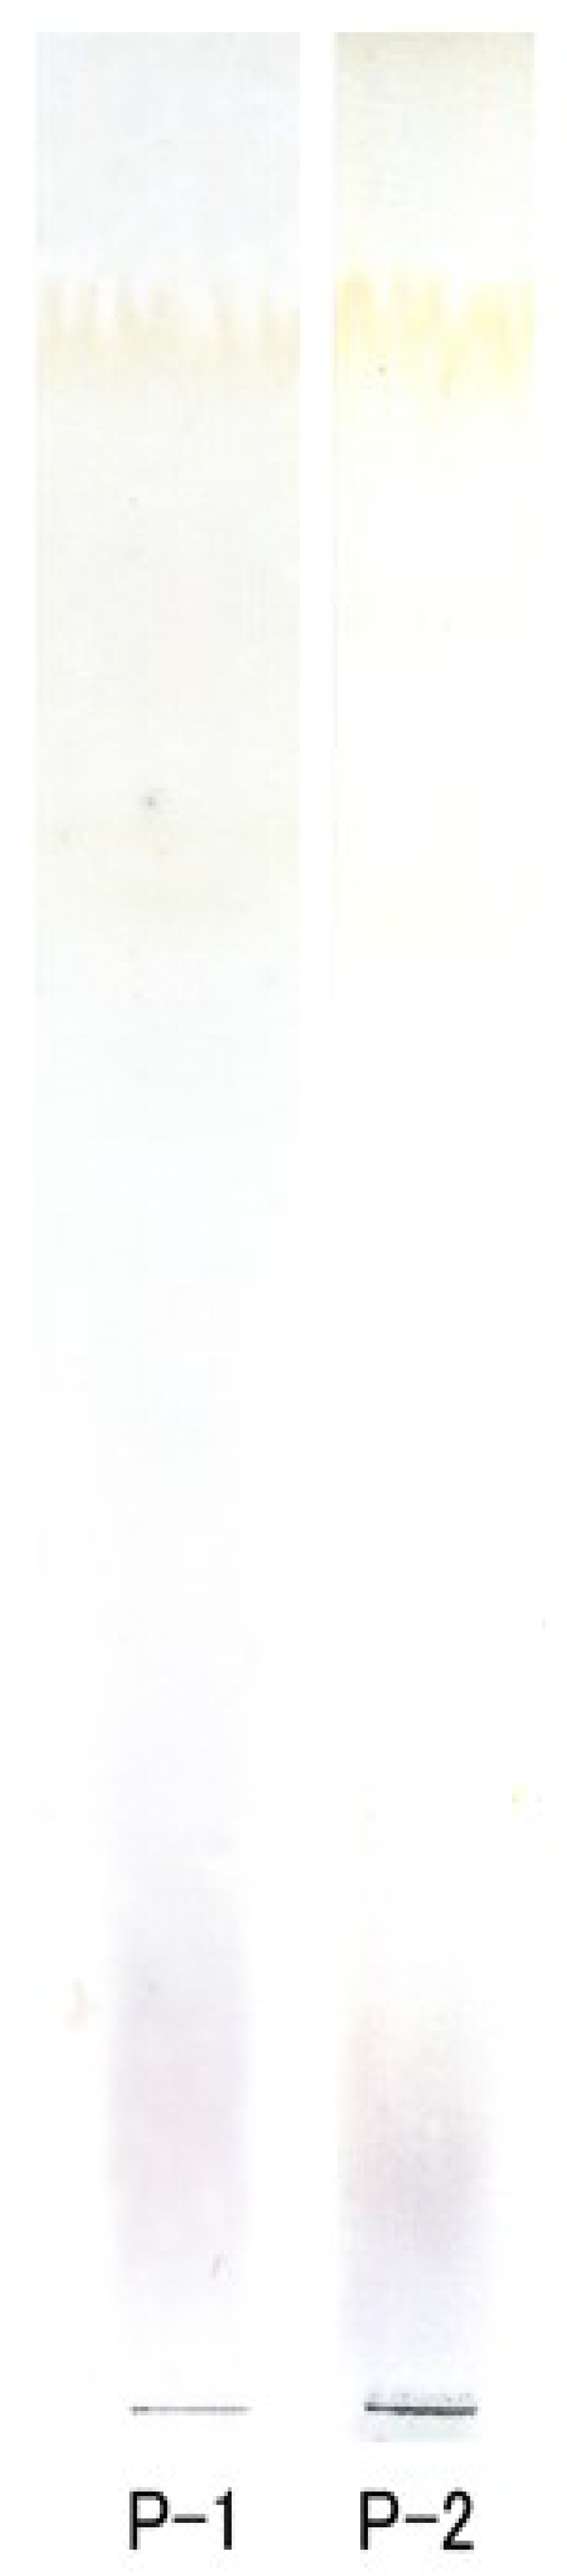
2.6. Thin-Layer Chromatography (TLC)
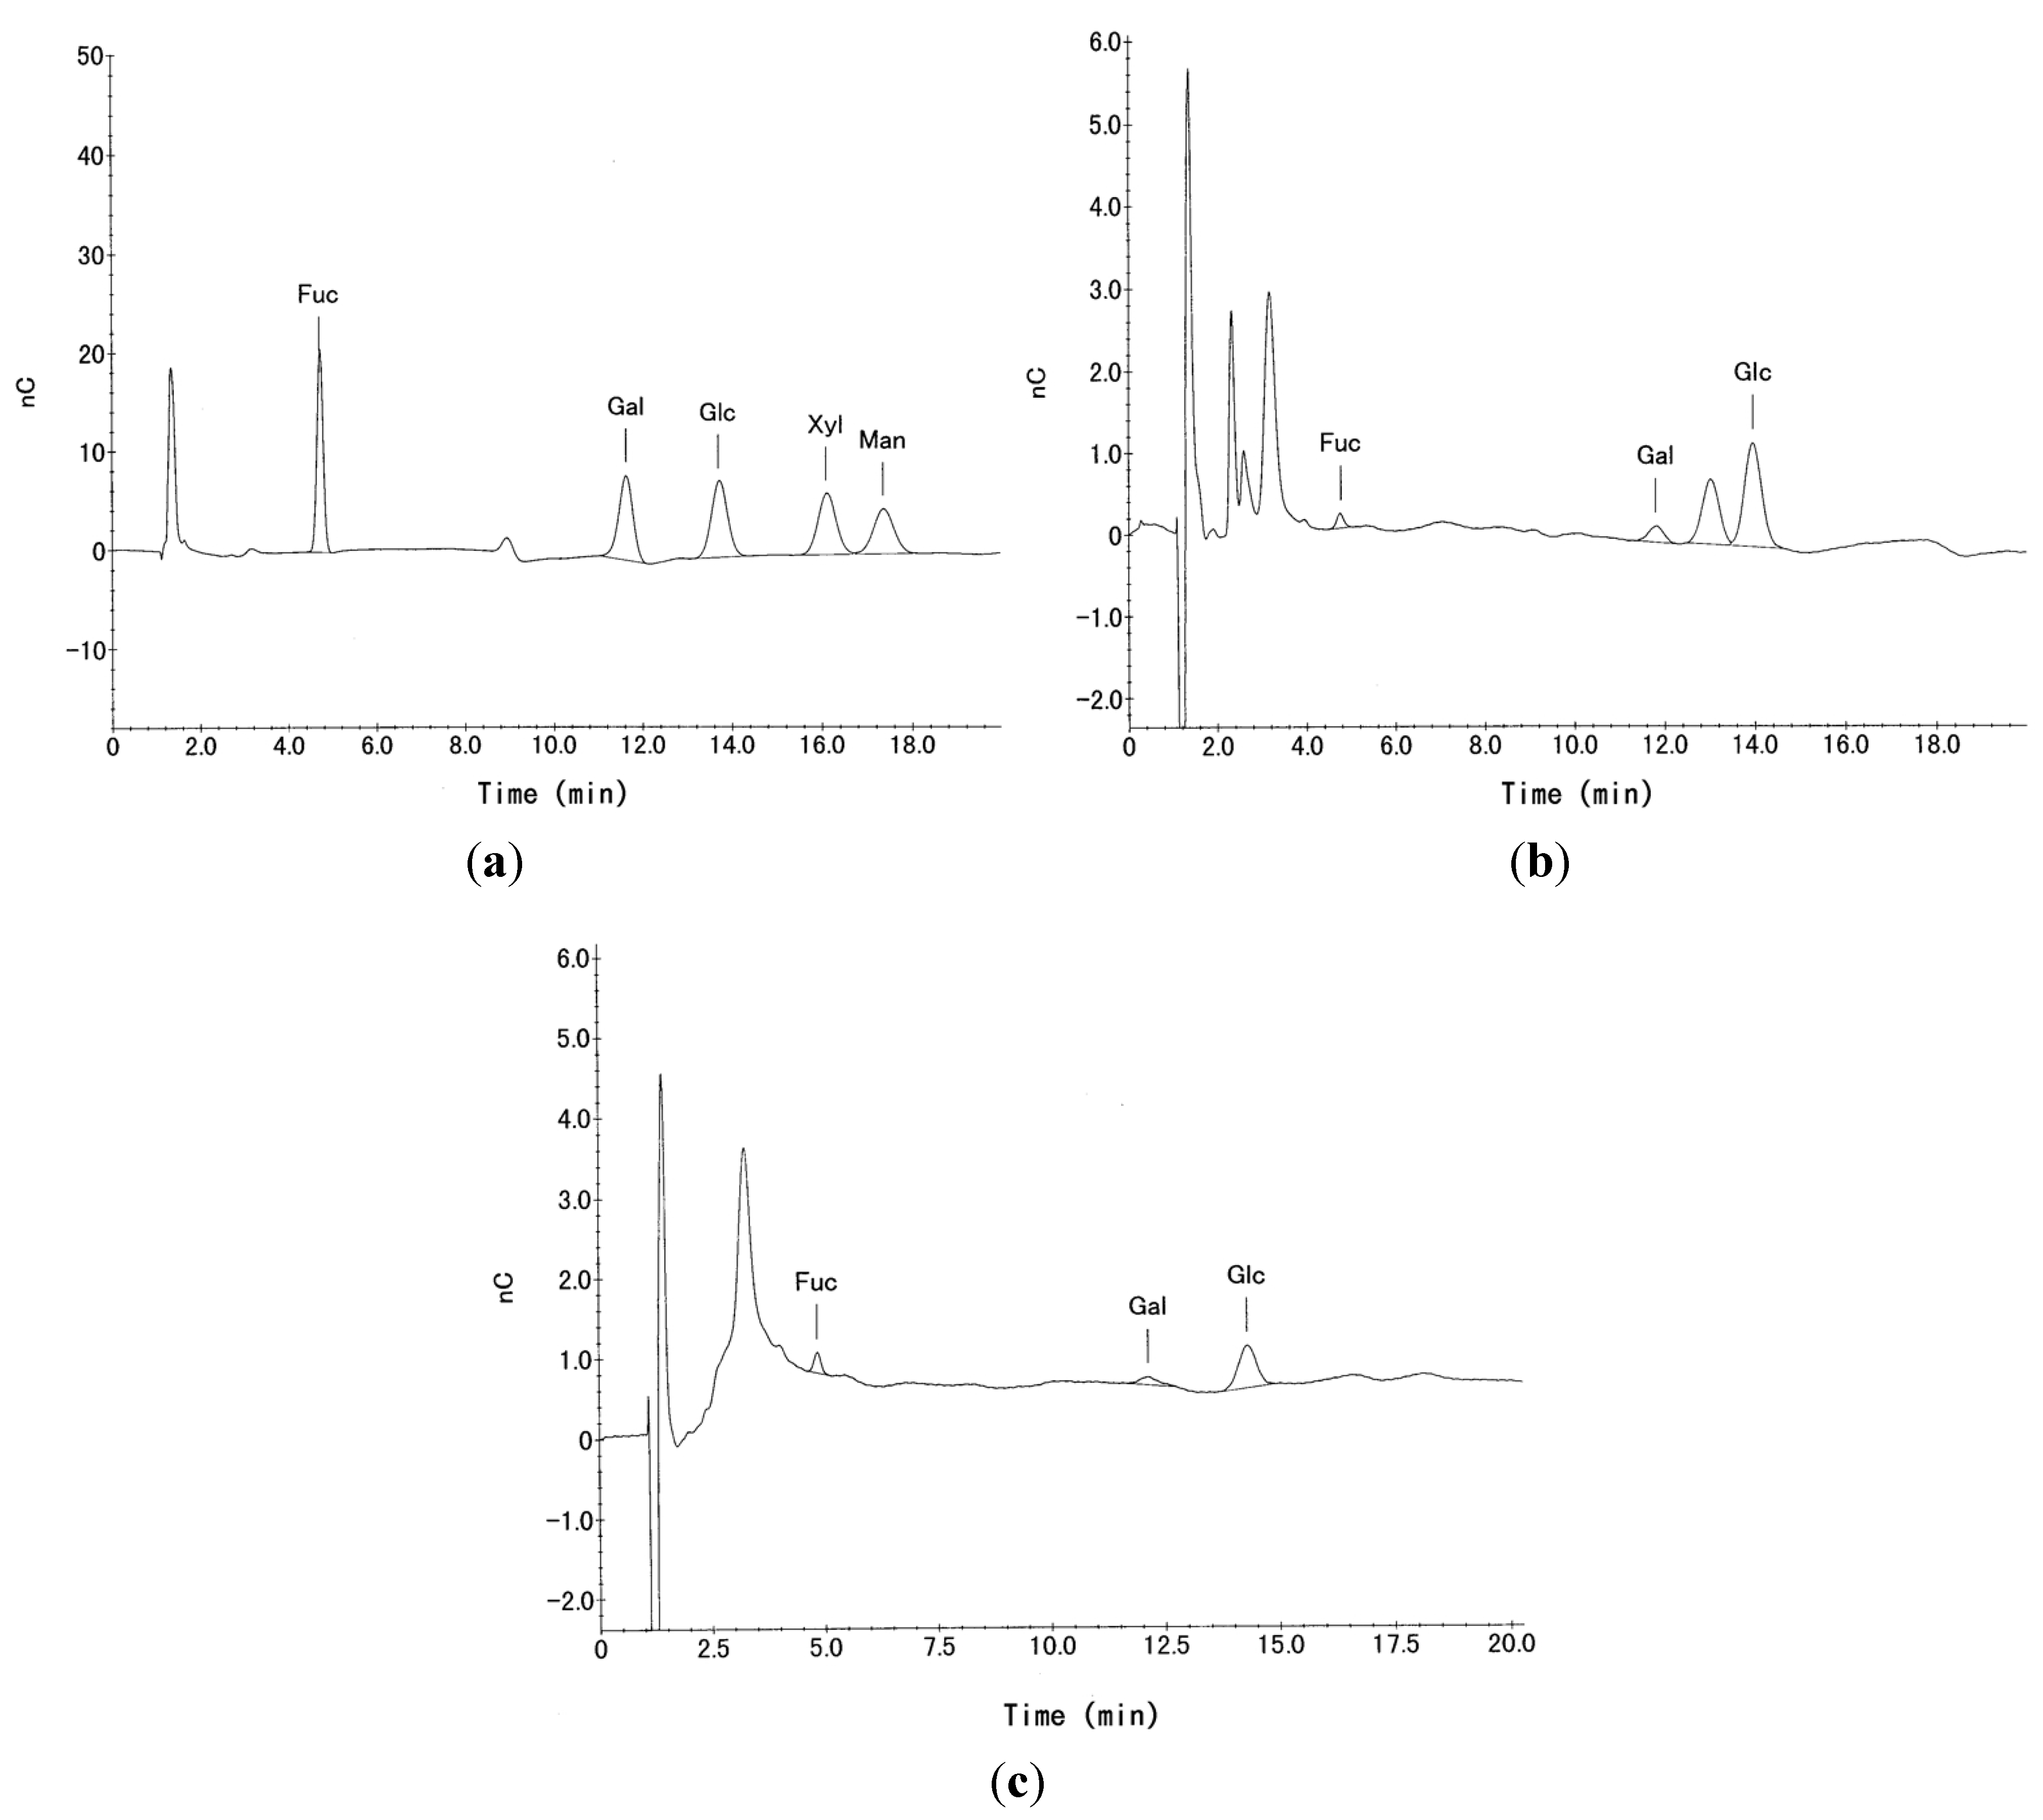
2.7. Neutral Sugar Analysis
2.8. NMR and GC-MS
3. Results
3.1. Homogeneity of P-1 and P-2 Fractions

3.2. Neutral Sugar Composition
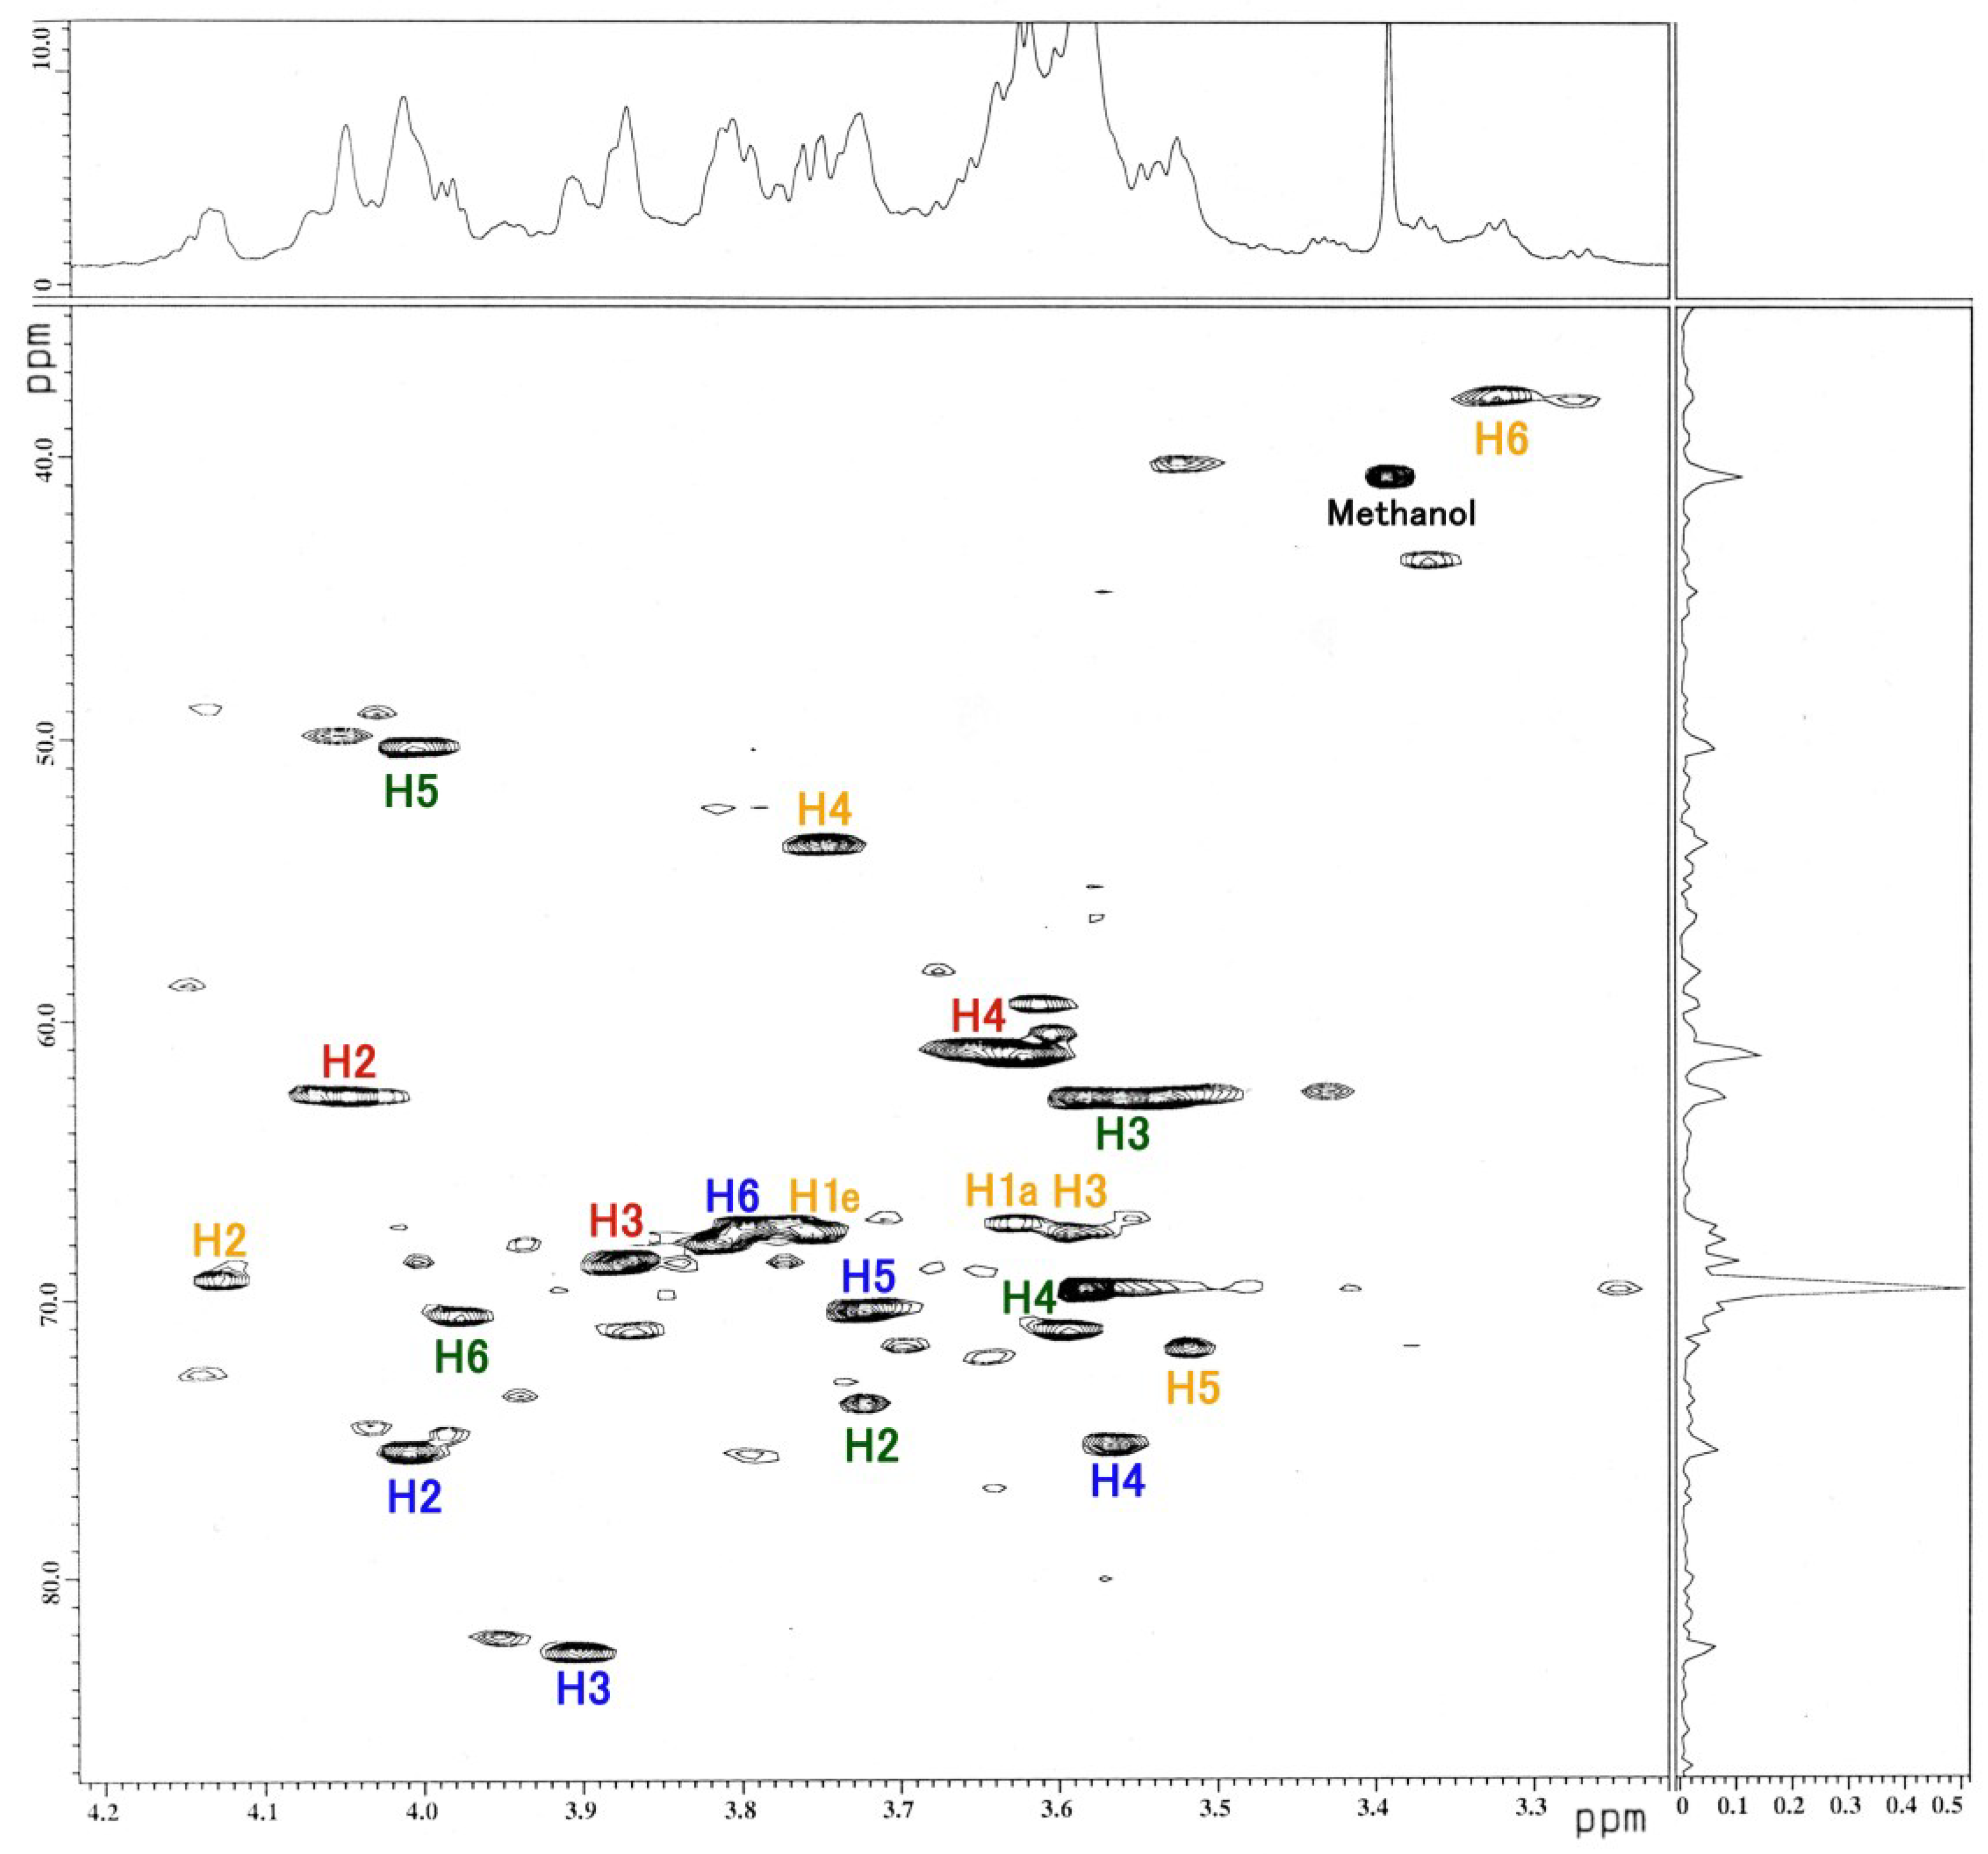
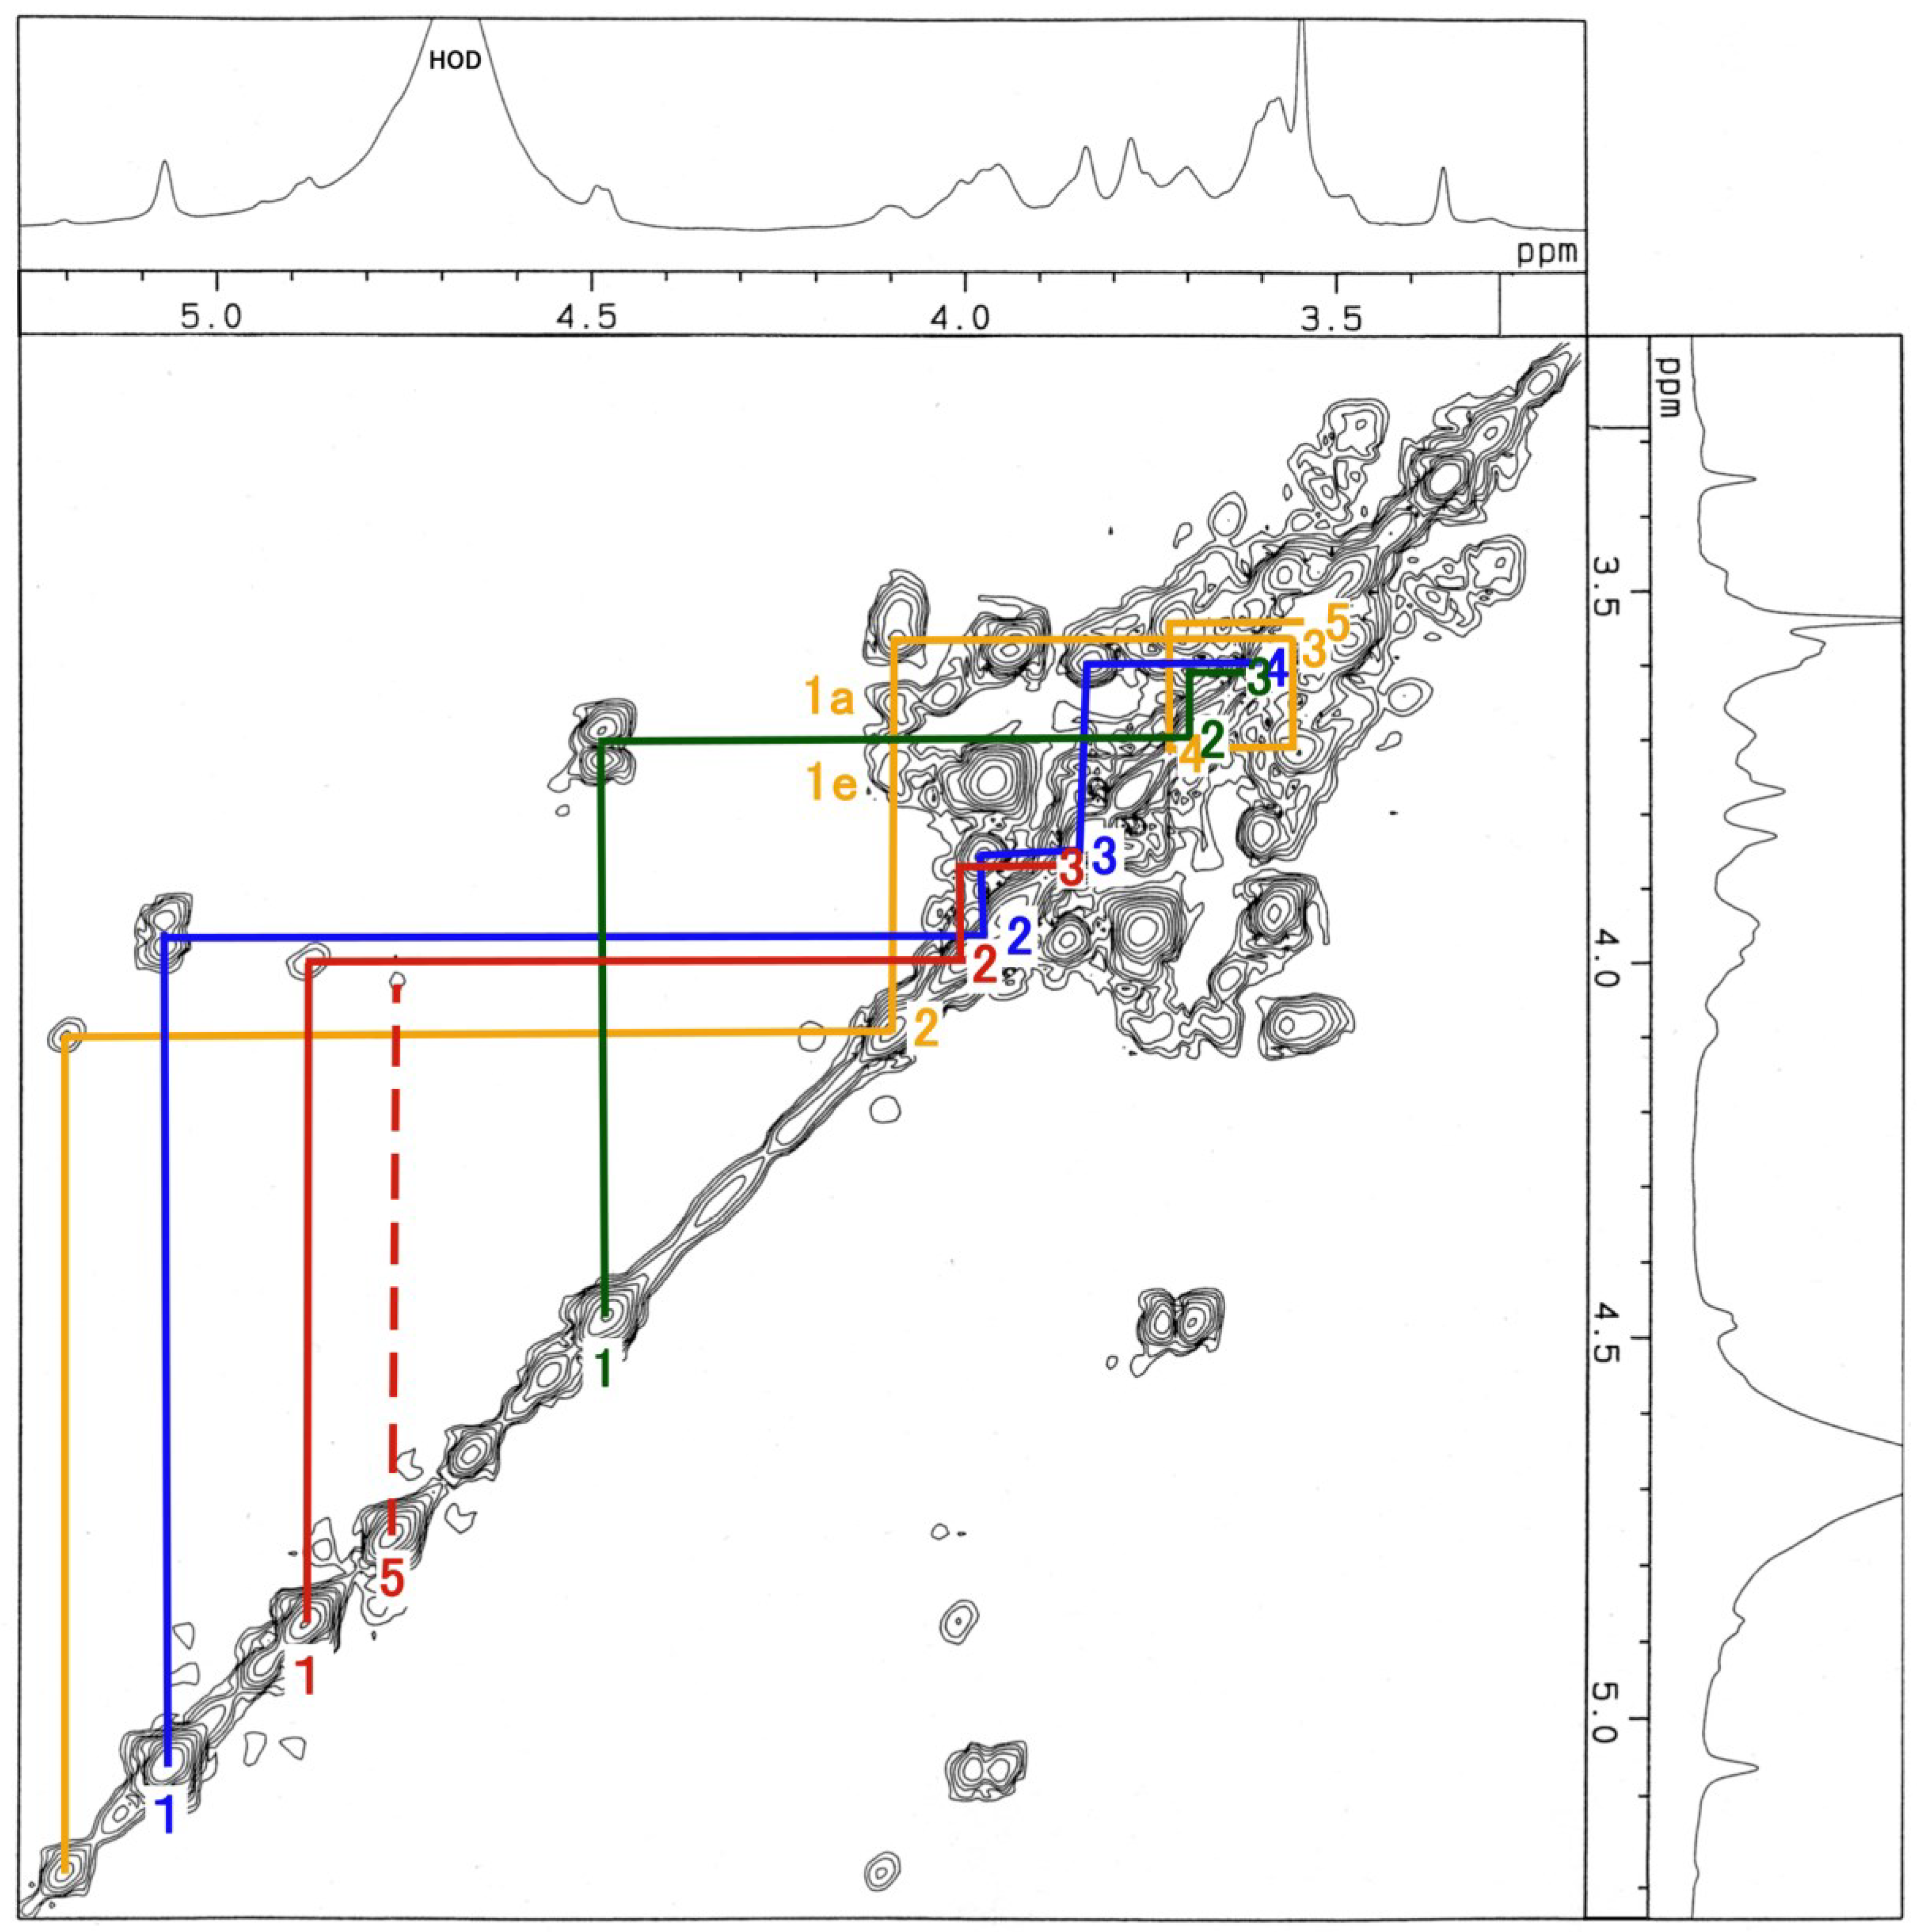
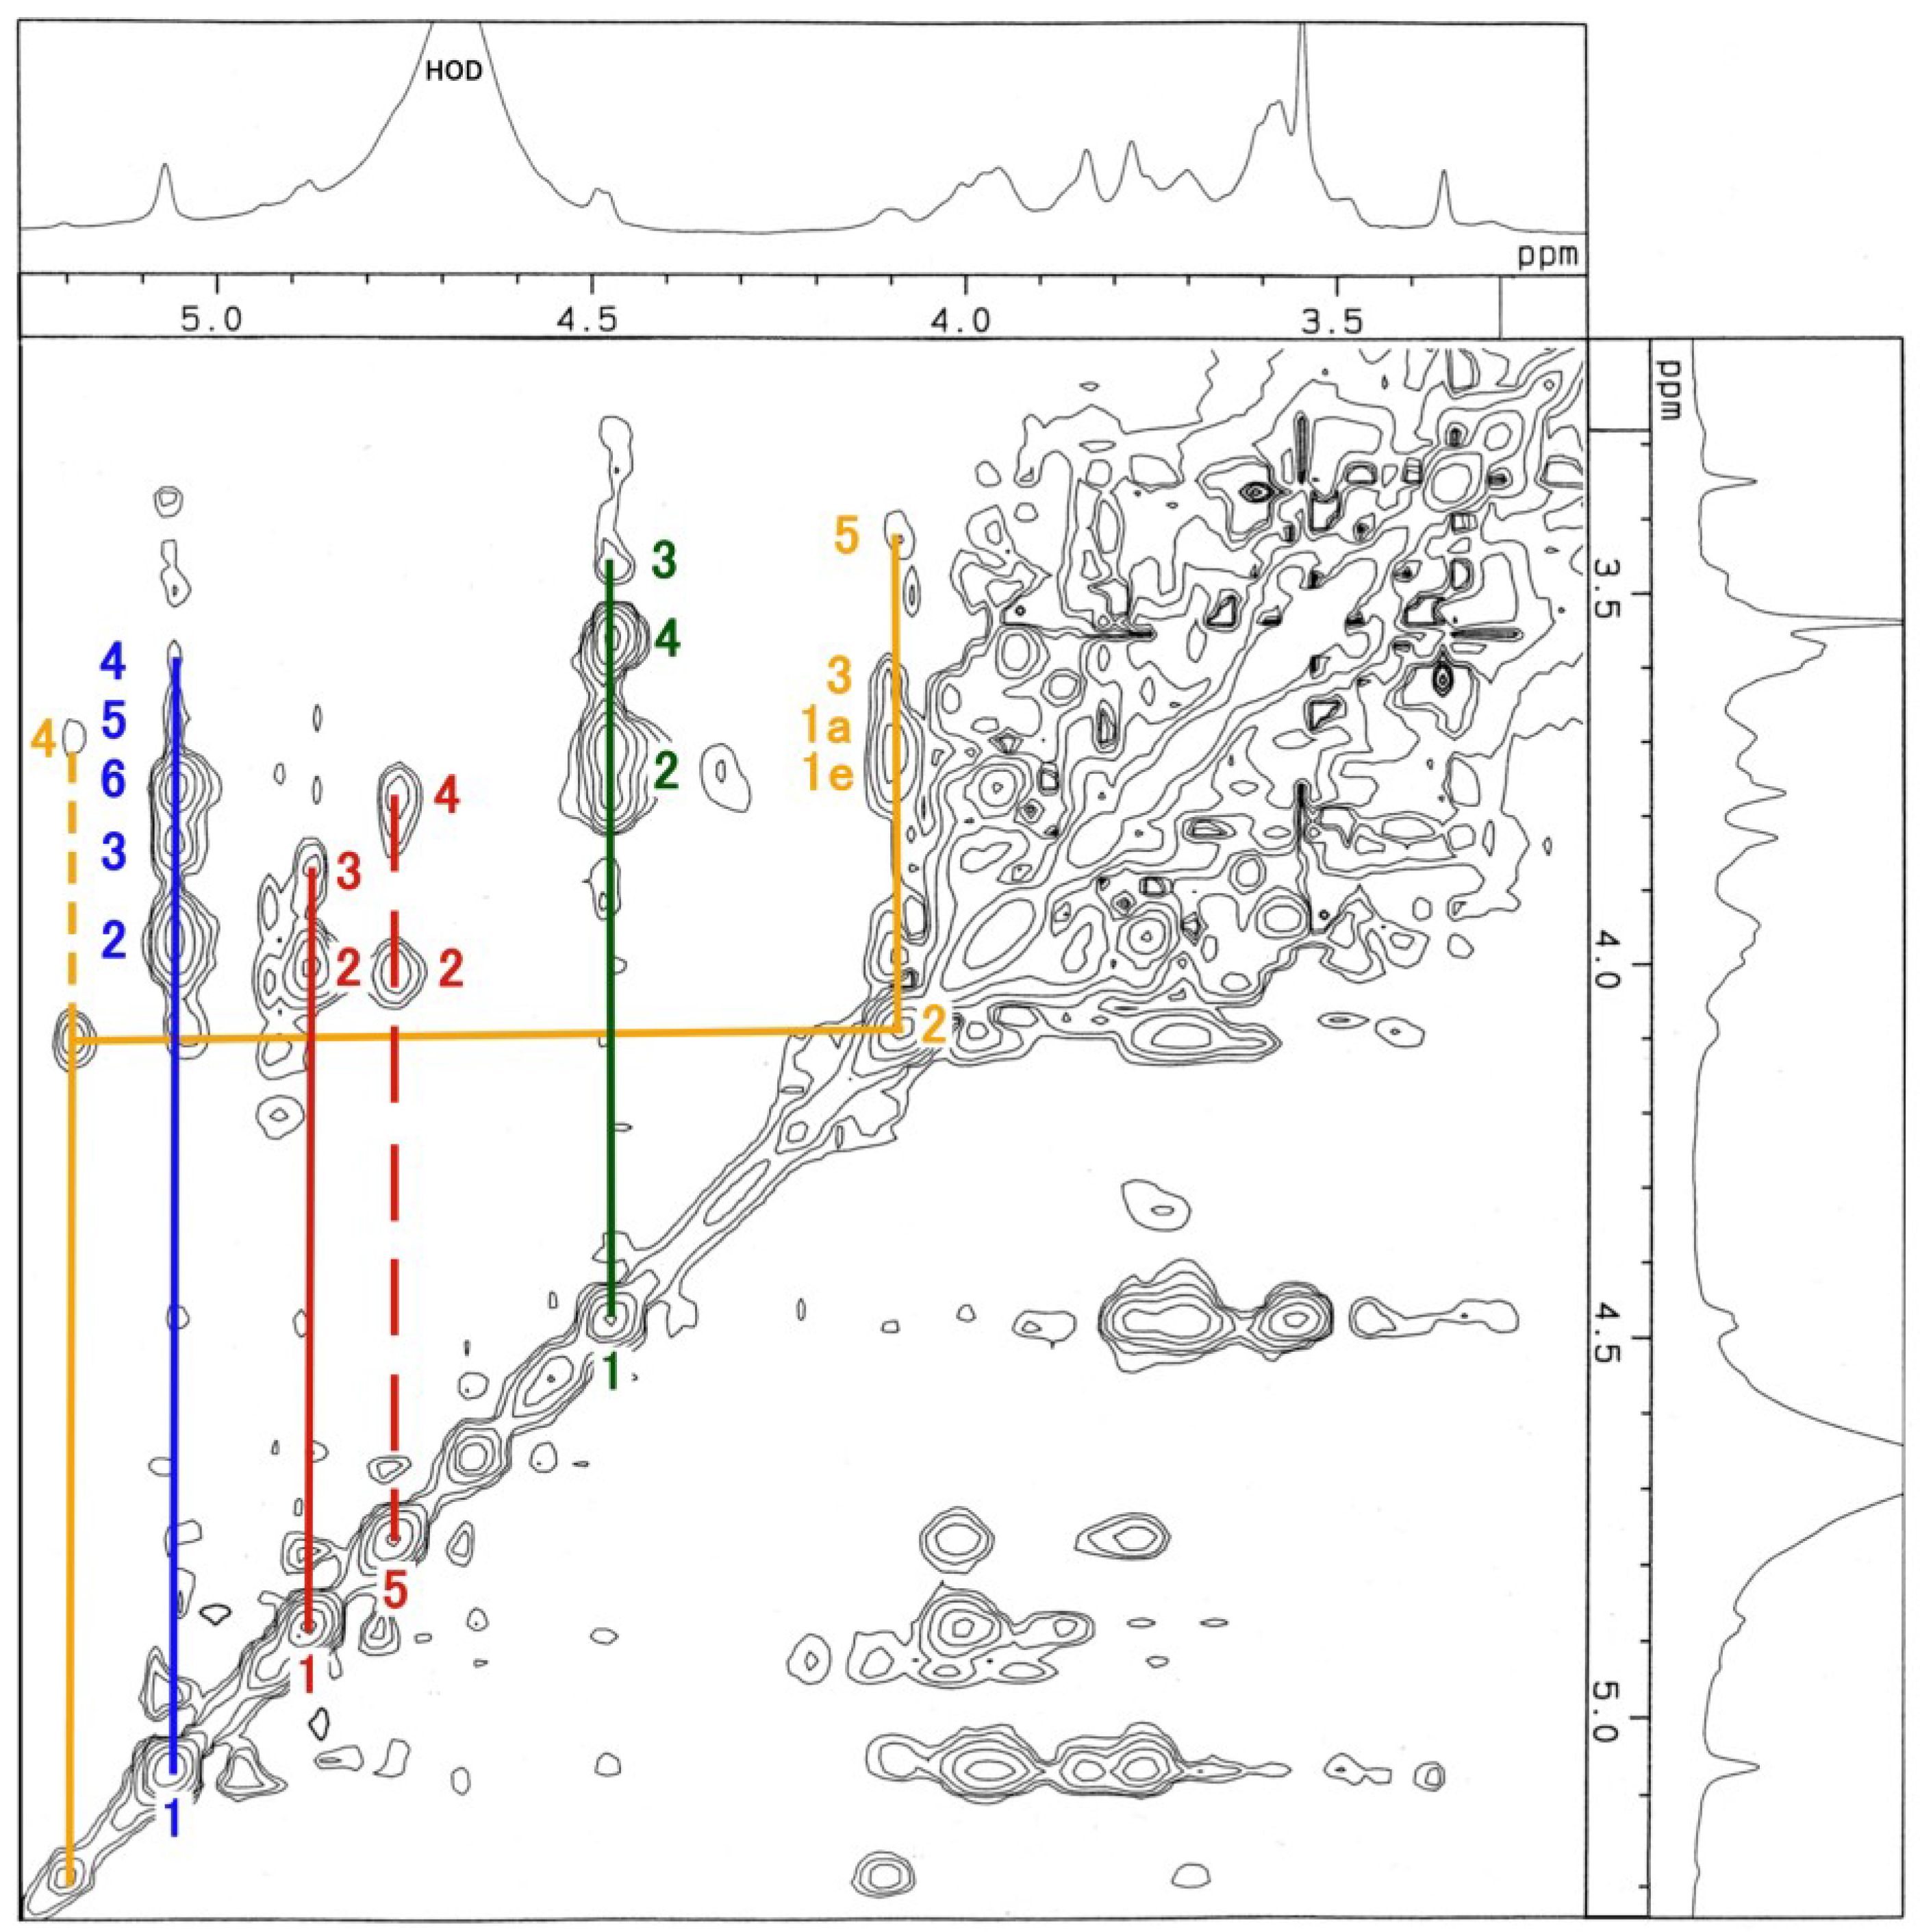
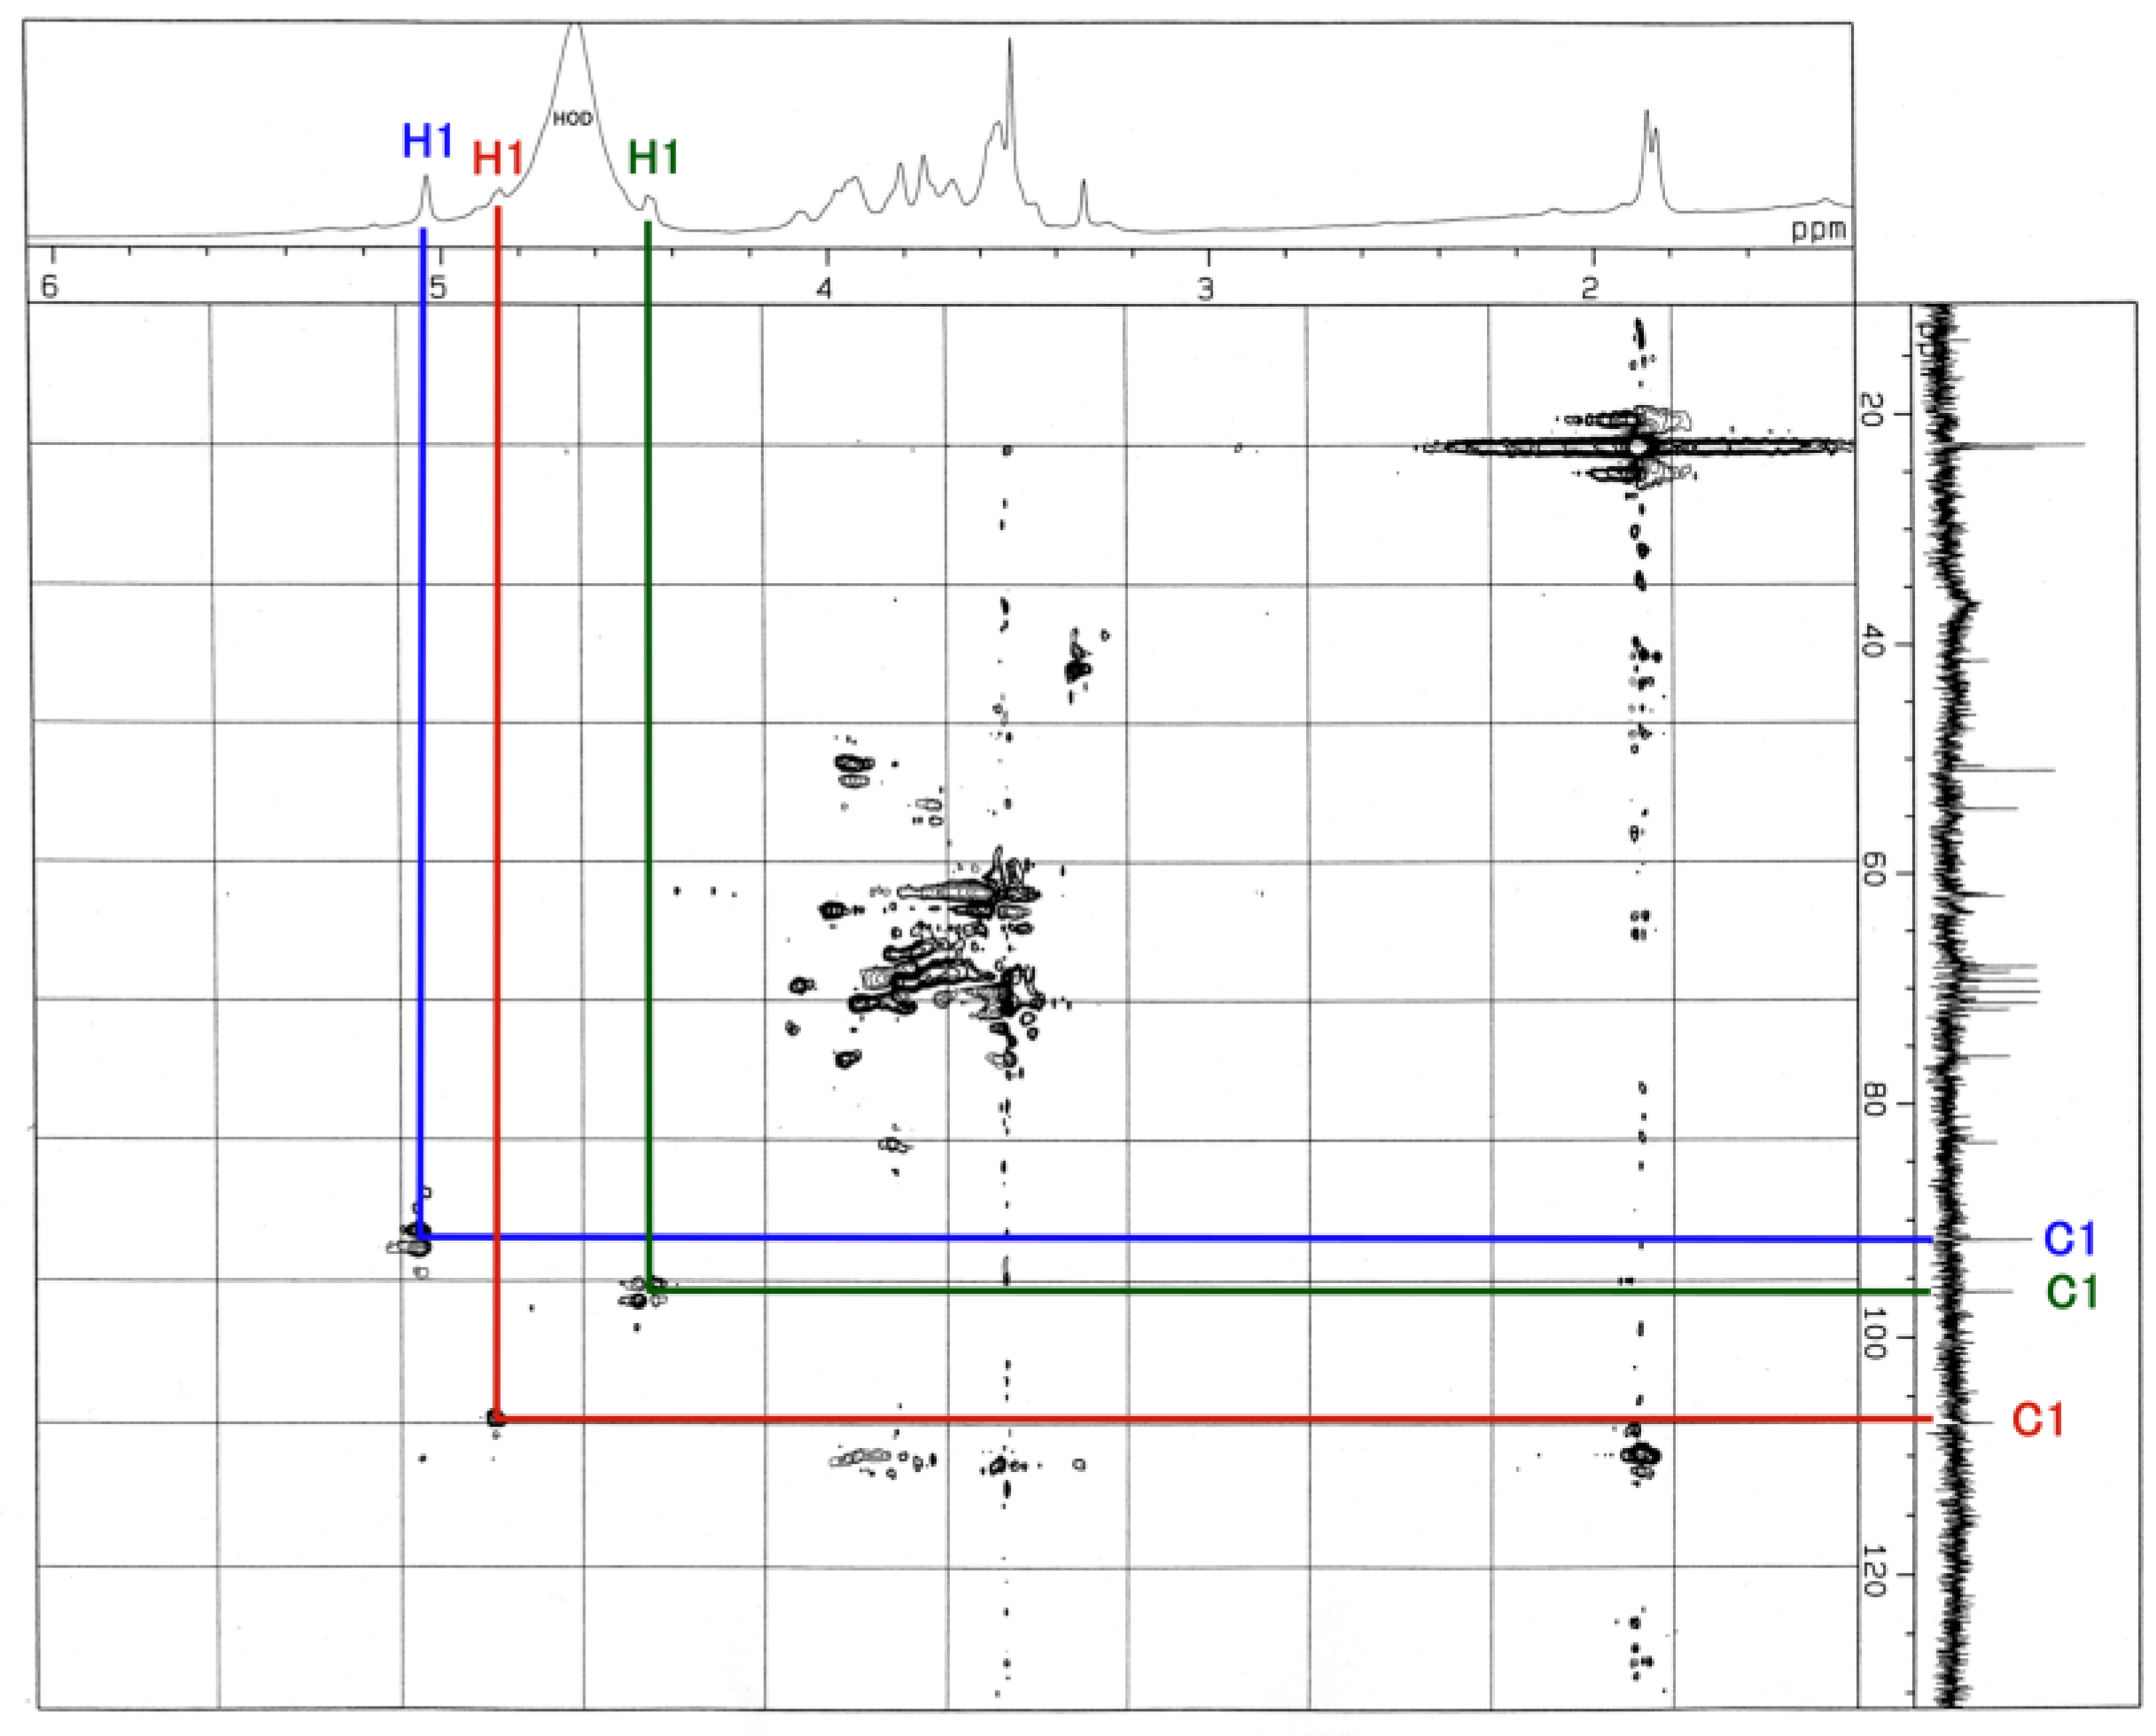
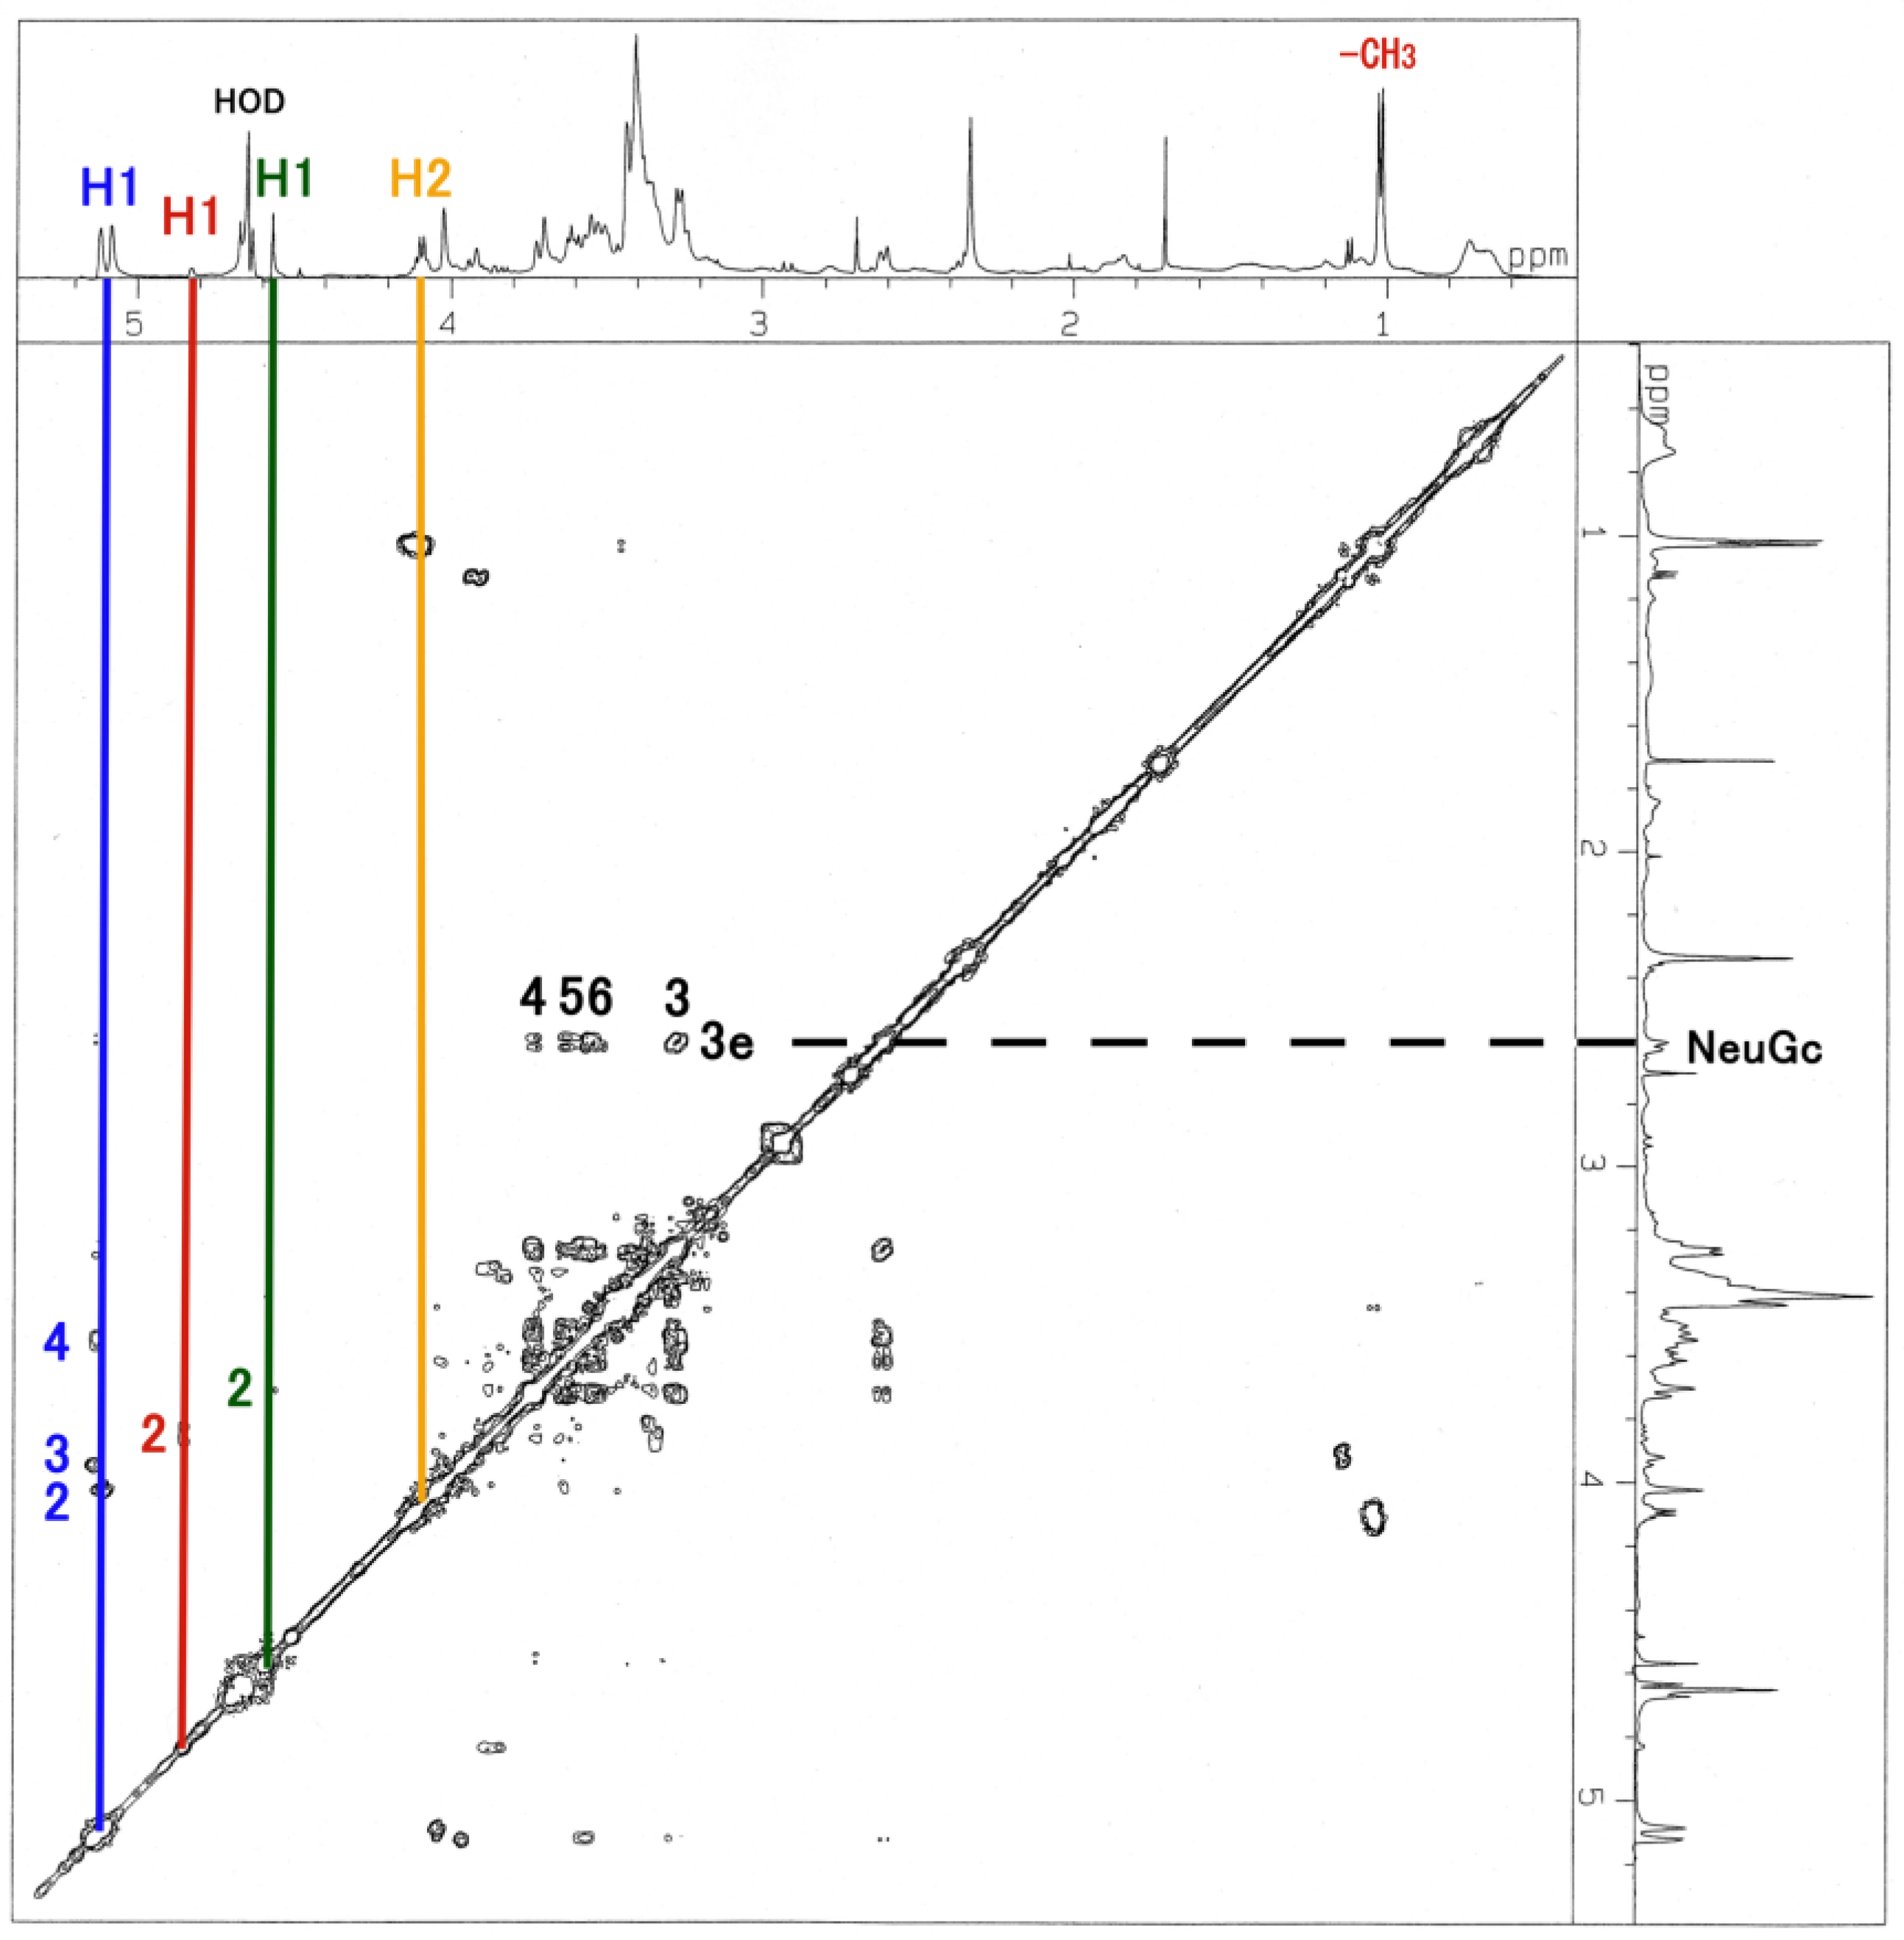
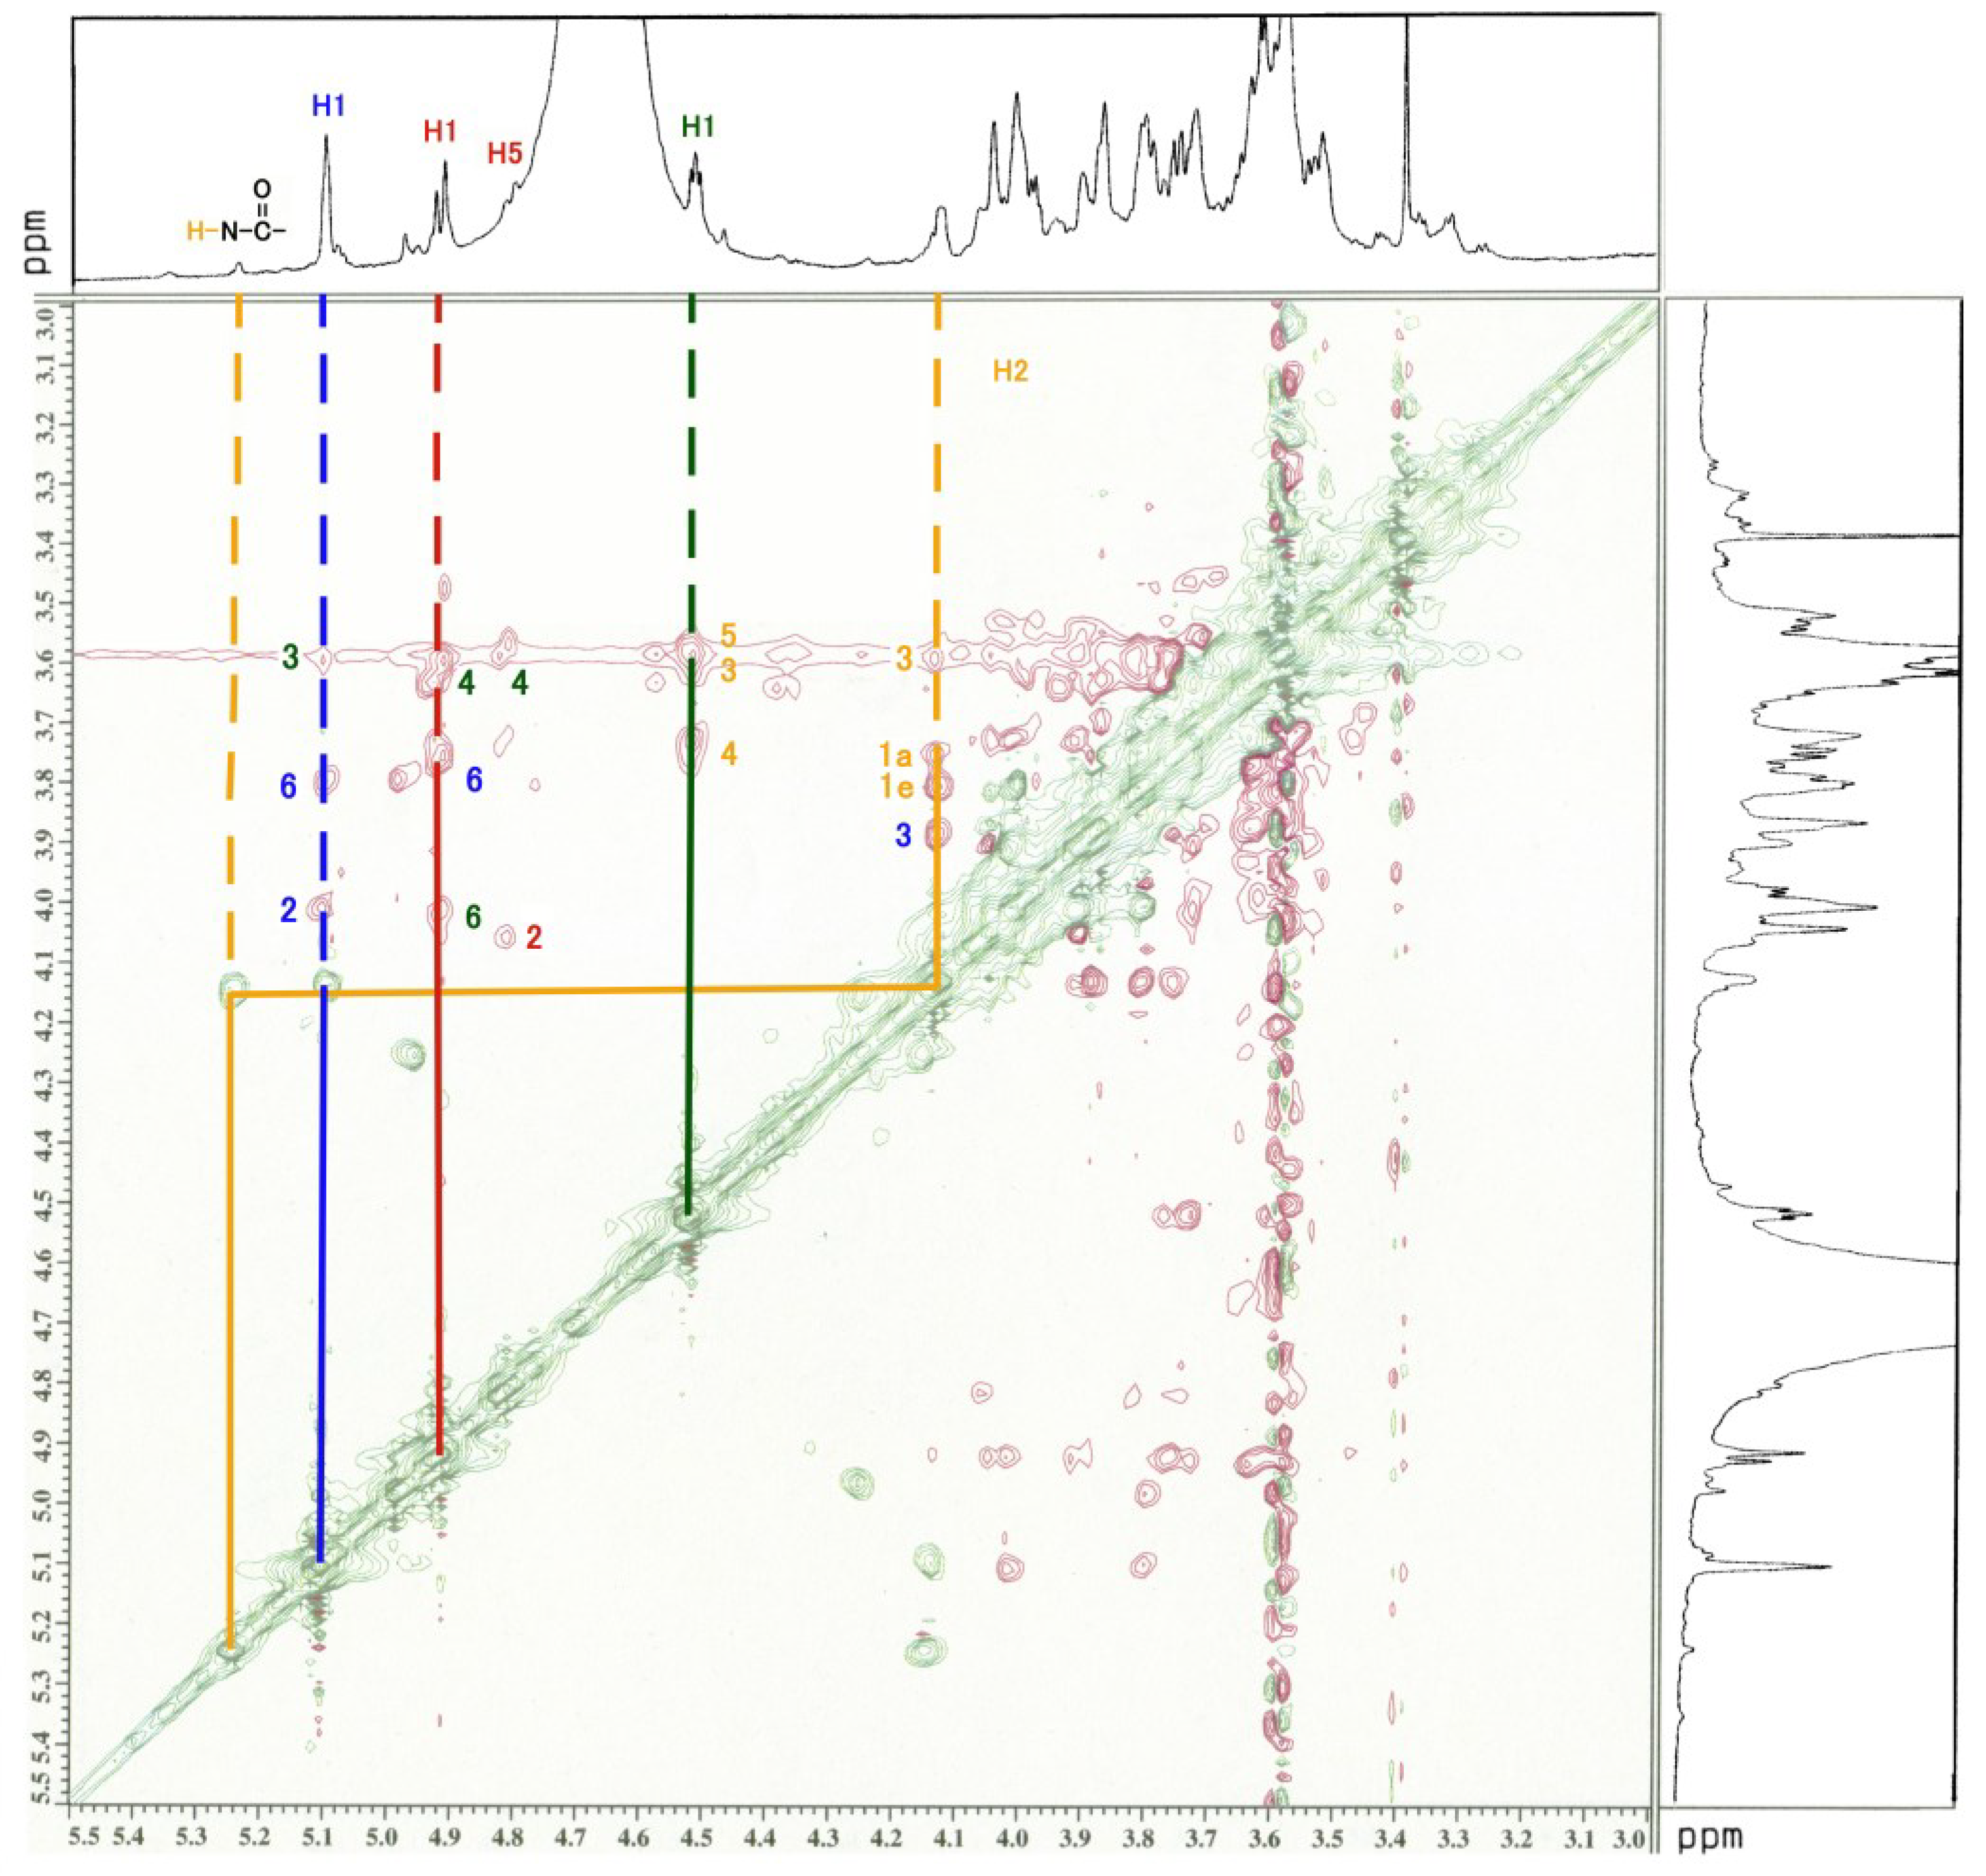
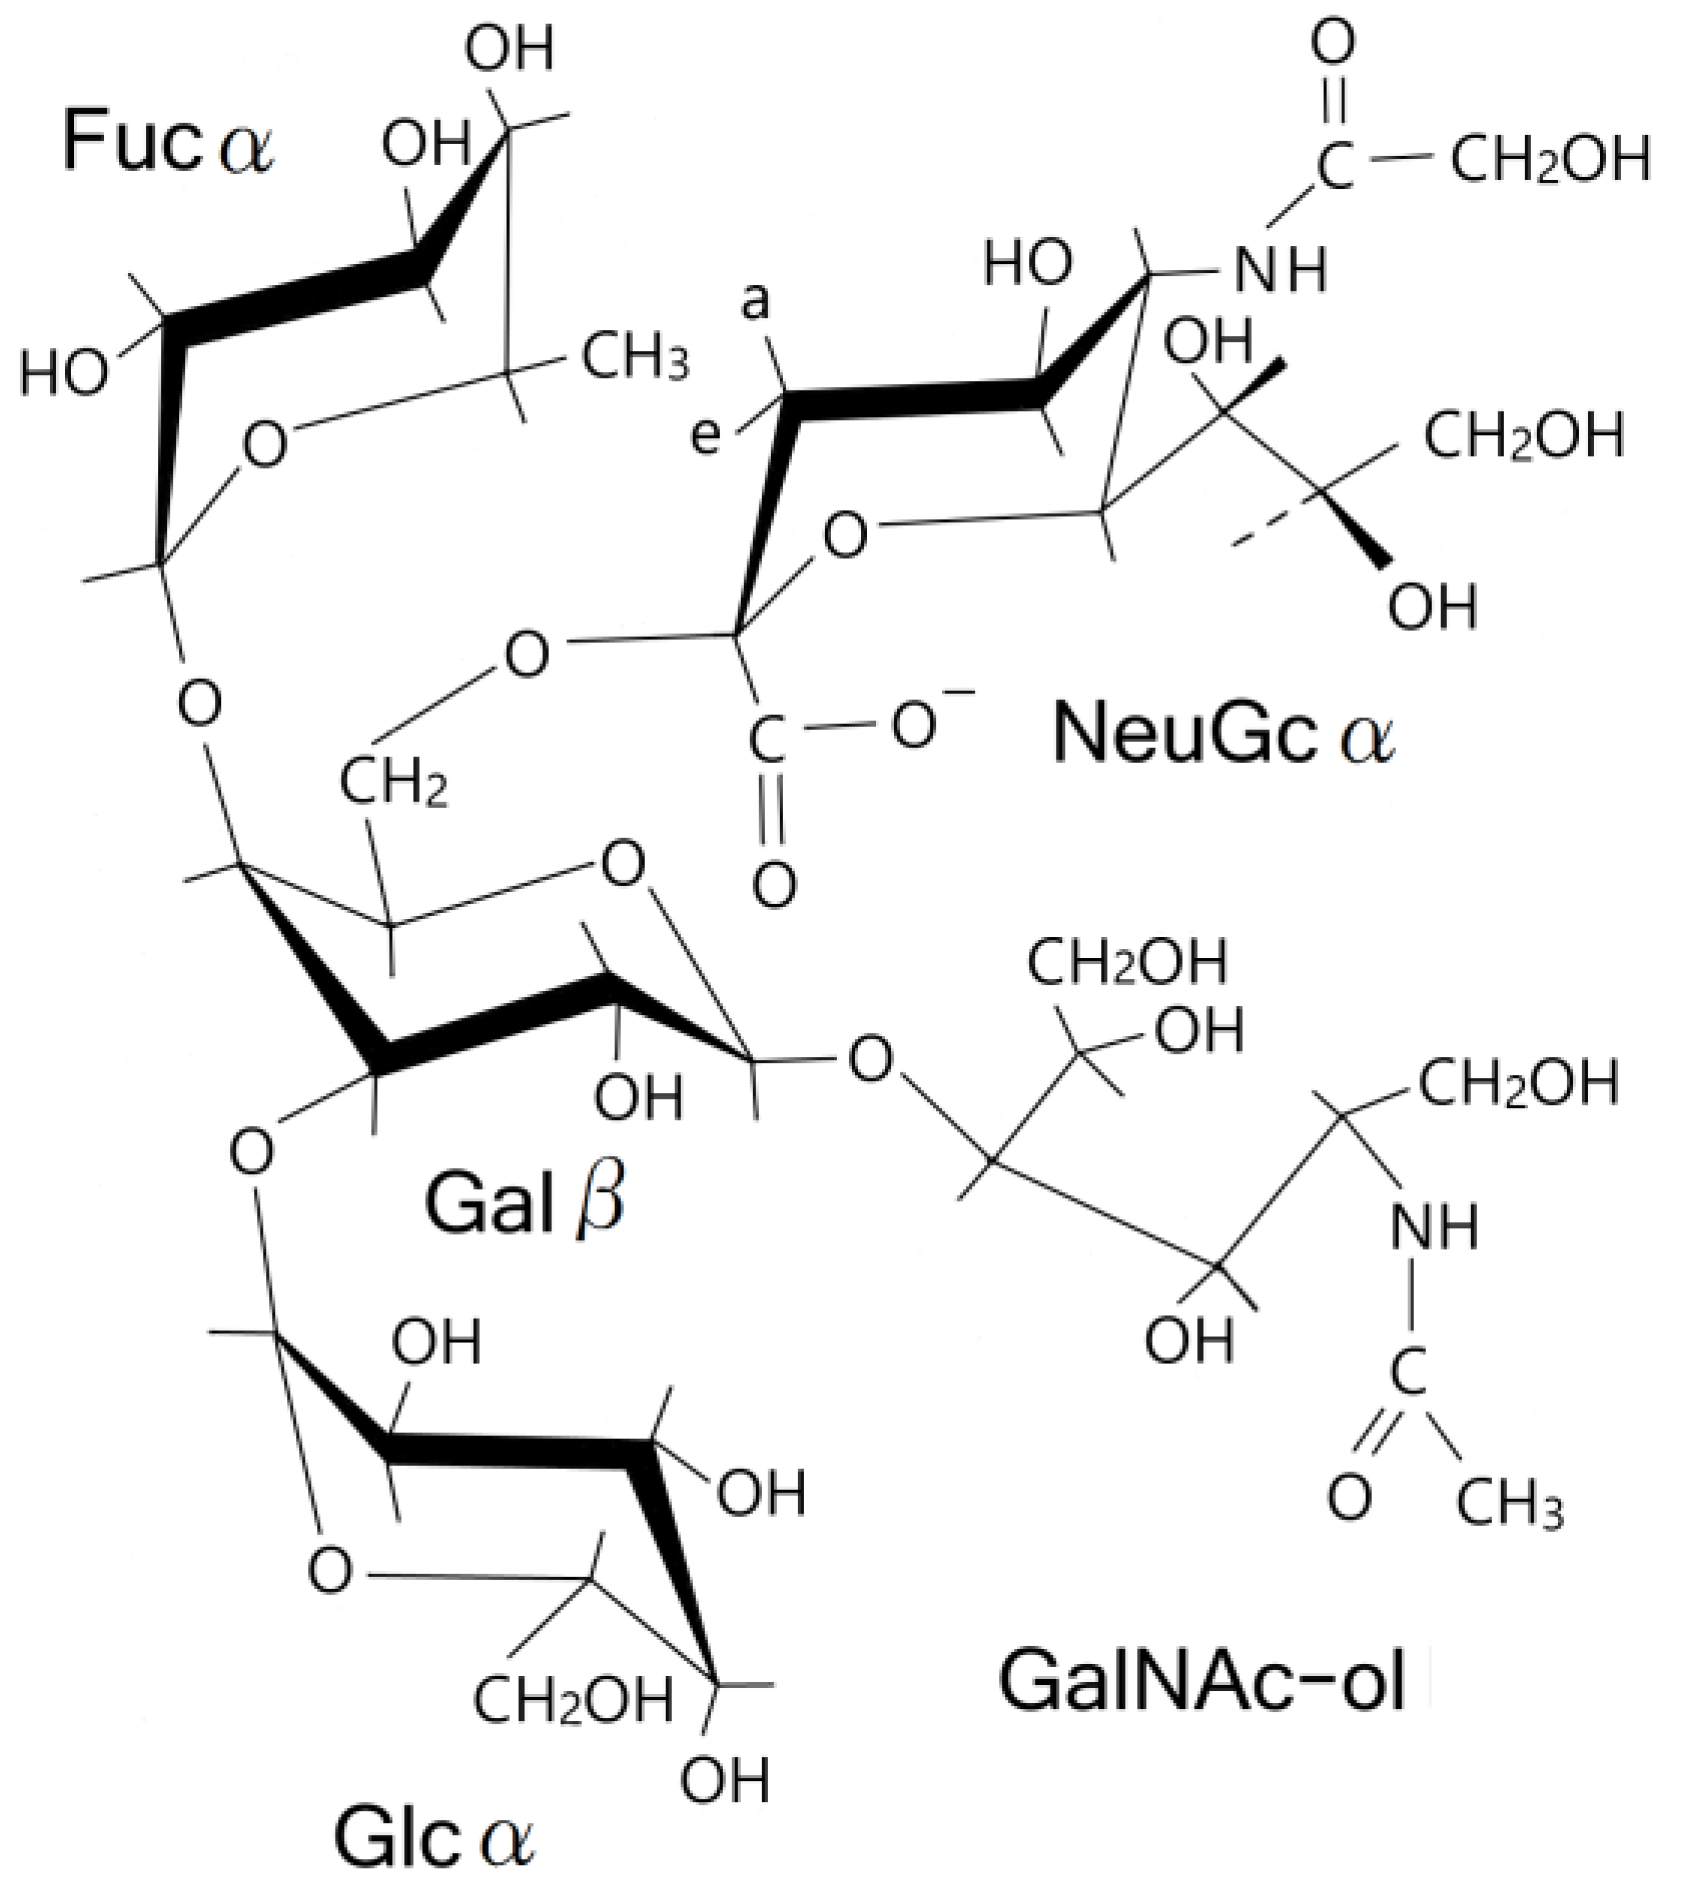
3.3. NMR and GC-MS


| Residue | Reporter Site | 1H | 13C |
|---|---|---|---|
| GalNAc-ol | 1a 1e | 3.626 3.763 | 67.34 67.34 |
| 2 | 4.130 | 69.21 | |
| 3 | 3.592 | 67.58 | |
| 4 | 3.749 | 53.66 | |
| 5 | 3.519 | 71.71 | |
| 6 | 3.326 | 37.82 | |
| αGlc | 1 | 5.103 | 91.01 |
| 2 | 4.012 | 75.42 | |
| 3 | 3.905 | 82.62 | |
| 4 | 3.567 | 75.20 | |
| 5 | 3.727 | 70.37 | |
| 6 | 3.803 | 67.32 | |
| αFuc | 1 | 4.917 | 106.5 |
| 2 | 4.048 | 62.64 | |
| 3 | 3.875 | 68.61 | |
| 4 | 3.678 | 61.08 | |
| 5 | 4.764 | 71.60 | |
| -CH3 | 1.234 | 20.10 | |
| βGal | 1 | 4.518 | 95.39 |
| 2 | 3.726 | 73.70 | |
| 3 | 3.583 | 62.76 | |
| 4 | 3.583 | 69.60 | |
| 5 | 4.007 | 50.27 | |
| 6 | 4.023 | 70.04 |

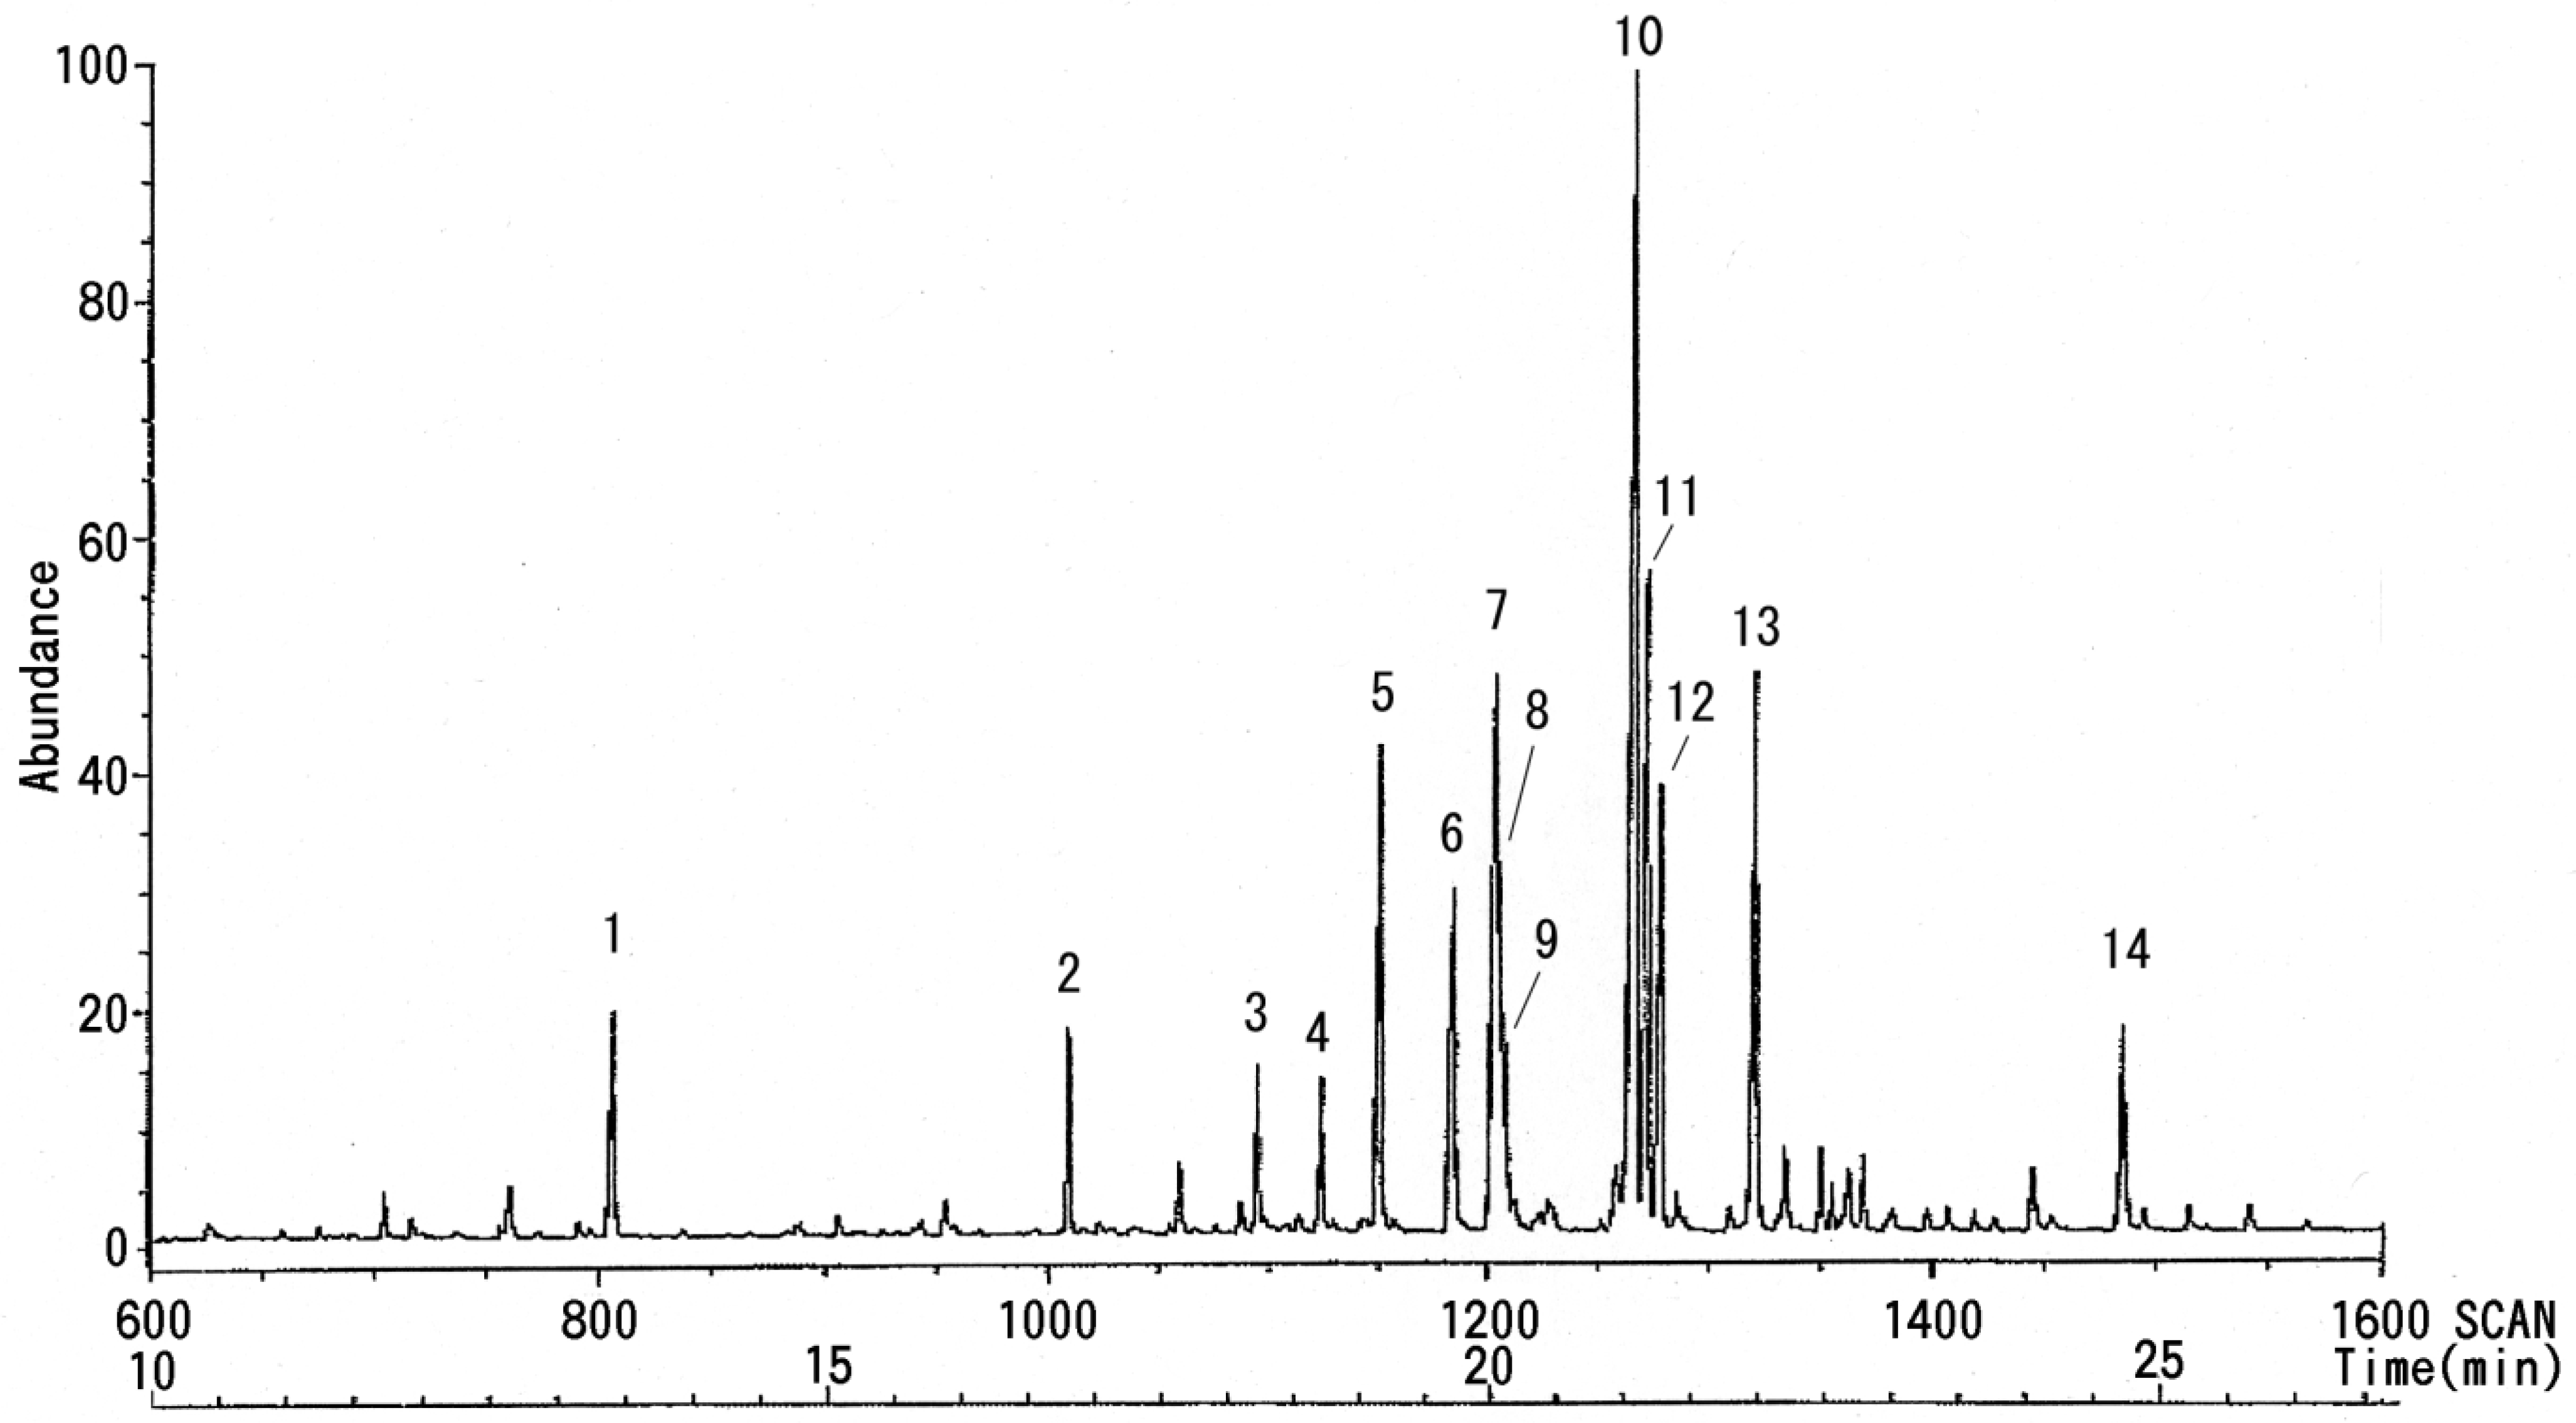
| Peak No. | Linkage Site | GC Retention Time (min) | Peak Area | MS Retention Time (min) |
|---|---|---|---|---|
| 1 | − | 15.297 | 13,928 | 13.23 |
| 2 | Pen 1 → | 18.747 | 11,924 | 16.47 |
| 3 | → 2 Pen 1 → | 20.200 | 7,818 | 18.13 |
| 4 | Fuc 1 → | 20.747 | 13,925 | 18.42 |
| 5 | → 5 Pen 1 → | 21.170 | 30,312 | 19.09 |
| 6 | Hex 1 → | 21.755 | 26,944 | 19.43 |
| 7 | Hex 1 → | 22.071 | 41,924 | 20.02 |
| 8 | → 6 Hex 1 → | 22.153 | 28,993 | 20.04 |
| 9 | → 6 Hex 1 → | 22.205 | 8,515 | 20.07 |
| 10 | → 4 Hex 1 → | 23.162 | 91,934 | 21.05 |
| 11 | → 4 Hex 1 → | 23.257 | 39,668 | 21.10 |
| 12 | → 3 Hex 1 → | 23.361 | 25,210 | 21.17 |
| 13 | → 3,4 Hex 1 → | 24.083 | 39,414 | 21.59 |
| 14 | → 4 HexNAc 1 → | 27.002 | 11,999 | 24.43 |


4. Discussion
Abbreviations
| NeuGc | N-glycolylneuraminic acid |
| Ac | acetyl |
| Fuc | fucose |
| Glc | glucose |
| Gal | galactose |
| GalNAc-ol | N-acetylgalactosaminitol |
Acknowledgments
Conflicts of Interest
References
- Aoki, T.; Chimura, K.; Nakao, N.; Mizuno, Y. Isolation and characterization of glycophorin from carp red blood cell membranes. Membranes 2014, 4, 491–508. [Google Scholar] [CrossRef] [PubMed]
- Chasis, J.A.; Mohandas, N. Red blood cell glycophorins. Blood 1992, 80, 1869–1879. [Google Scholar] [PubMed]
- Tanner, M.J.A. Molecular and cellular biology of the erythrocyte anion exchanger (AE1). Semin. Hematol. 1993, 30, 34–57. [Google Scholar] [PubMed]
- Weise, M.J.; Ingram, V.M. Proteins and glycoproteins of membranes from developing chick red cells. J. Biol. Chem. 1976, 251, 6667–6673. [Google Scholar]
- Watts, C.; Wheeler, K.P. Protein and lipid components of the pigeon erythrocyte membrane. Biochem. J. 1978, 173, 899–907. [Google Scholar] [PubMed]
- Dockham, P.A.; Vidaver, G.A. Comparison of human and pigeon erythrocyte membrane proteins by one- and two-dimensional gel electrophoresis. Comp. Biochem. Physiol. 1987, 87B, 171–177. [Google Scholar] [CrossRef]
- Duk, M.; Krotkiewski, H.; Stasyk, T.V.; Lutsik-Kordovsky, M.; Syper, D.; Lisowska, E. Isolation and characterization of glycophorin from nucleated (Chicken) erythrocytes. Arch. Biochem. Biophys. 2000, 375, 111–118. [Google Scholar] [CrossRef] [PubMed]
- Fukuda, M.; Dell, A.; Oates, J.E.; Fukuda, M.N. Structure of branched lactosaminoglycan, the carbohydrate moiety of band 3 isolated from adult human erythrocytes. J. Biol. Chem. 1984, 259, 8260–8273. [Google Scholar] [PubMed]
- Furthmayr, H. Structural comparison of glycophorins and immunochemical analysis of genetic variants. Nature 1978, 271, 519–524. [Google Scholar] [CrossRef] [PubMed]
- Wybenga, L.E.; Epand, R.F.; Nir, S.; Chu, J.W.K.; Sharom, F.J.; Flanagan, T.D.; Epand, R.M. Glycophorin as a receptor for Sendai virus. Biochemistry 1996, 35, 9513–9518. [Google Scholar] [PubMed]
- Kanaseki, T.; Kawasaki, K.; Murata, M.; Ikeuchi, Y.; Ohnishi, S. Structural features of membrane fusion between influenza virus and liposome as revealed by quick-freezing electron microscopy. J. Cell Biol. 1997, 137, 1041–1056. [Google Scholar] [CrossRef] [PubMed]
- Carlson, D.M. Structures and immunochemical properties of oligosaccharides isolated from pig submaxillary mucins. J. Biol. Chem. 1968, 243, 616–626. [Google Scholar] [PubMed]
- Bailey, R.W.; Bourne, E.J. Colour reactions given by sugars and diphenylamine-aniline splay reagents on paper chromatograms. J. Chromatogr. 1960, 4, 206–213. [Google Scholar] [CrossRef]
- Ciucanu, I.; Kerek, F. A simple and rapid method for the permethylation of carbohydrates. Carbohydr. Res. 1984, 131, 209–217. [Google Scholar] [CrossRef]
- Fukuda, M.; Lauffenburger, M.; Sasaki, H.; Rogers, M.E.; Dell, A. Structures of novel sialylated O-linked oligosaccharides isolated from human erythrocyte glycophorins. J. Biol. Chem. 1987, 262, 11952–11957. [Google Scholar] [PubMed]
- Krotkiewski, H. The structure of glycophorins of animal erythrocytes. Glycoconj. J. 1988, 5, 35–48. [Google Scholar] [CrossRef]
- Guérardel, Y.; Balanzino, L.; Maes, E.; Leroy, Y.; Coddeville, B.; Oriol, R.; Strecker, G. The nematode Caenorhabditis elegans synthesizes unusial O-linked glycans: Identification of glucose-substituted mucin-type O-glycans and short chondroitin-like oligosaccharides. Biochem. J. 2001, 357, 167–182. [Google Scholar] [CrossRef] [PubMed]
- Podbielska, M.; Fredriksson, S-Å.; Nilsson, B.; Lisowska, E.; Krotkiewski, H. ABH blood group antigens in O-glycans of human glycophorin A. Arch. Biochem. Biophys. 2004, 429, 145–153. [Google Scholar] [CrossRef] [PubMed]
- Kuhn, R.; Gauhe, A.; Baer, H.H. Einfluß von Substituenten auf die Farbreaktion von N-Acetyl-glucosamin mit p-Dimethylamino-benzaldehyd. Chem. Ber. 1954, 87, 1138–1141. [Google Scholar] [CrossRef]
- Araki, T.; Aoki, T.; Kitamikado, M. Isolation and Identification of a β-1,3-xylanase-producing bacterium. Nippon Suisan Gakkaishi 1987, 53, 2077–2081. [Google Scholar] [CrossRef]
© 2014 by the authors; licensee MDPI, Basel, Switzerland. This article is an open access article distributed under the terms and conditions of the Creative Commons Attribution license (http://creativecommons.org/licenses/by/4.0/).
Share and Cite
Aoki, T.; Chimura, K.; Sugiura, H.; Mizuno, Y. Structure of a Sialo-Oligosaccharide from Glycophorin in Carp Red Blood Cell Membranes. Membranes 2014, 4, 764-777. https://doi.org/10.3390/membranes4040764
Aoki T, Chimura K, Sugiura H, Mizuno Y. Structure of a Sialo-Oligosaccharide from Glycophorin in Carp Red Blood Cell Membranes. Membranes. 2014; 4(4):764-777. https://doi.org/10.3390/membranes4040764
Chicago/Turabian StyleAoki, Takahiko, Kenji Chimura, Hikaru Sugiura, and Yasuko Mizuno. 2014. "Structure of a Sialo-Oligosaccharide from Glycophorin in Carp Red Blood Cell Membranes" Membranes 4, no. 4: 764-777. https://doi.org/10.3390/membranes4040764