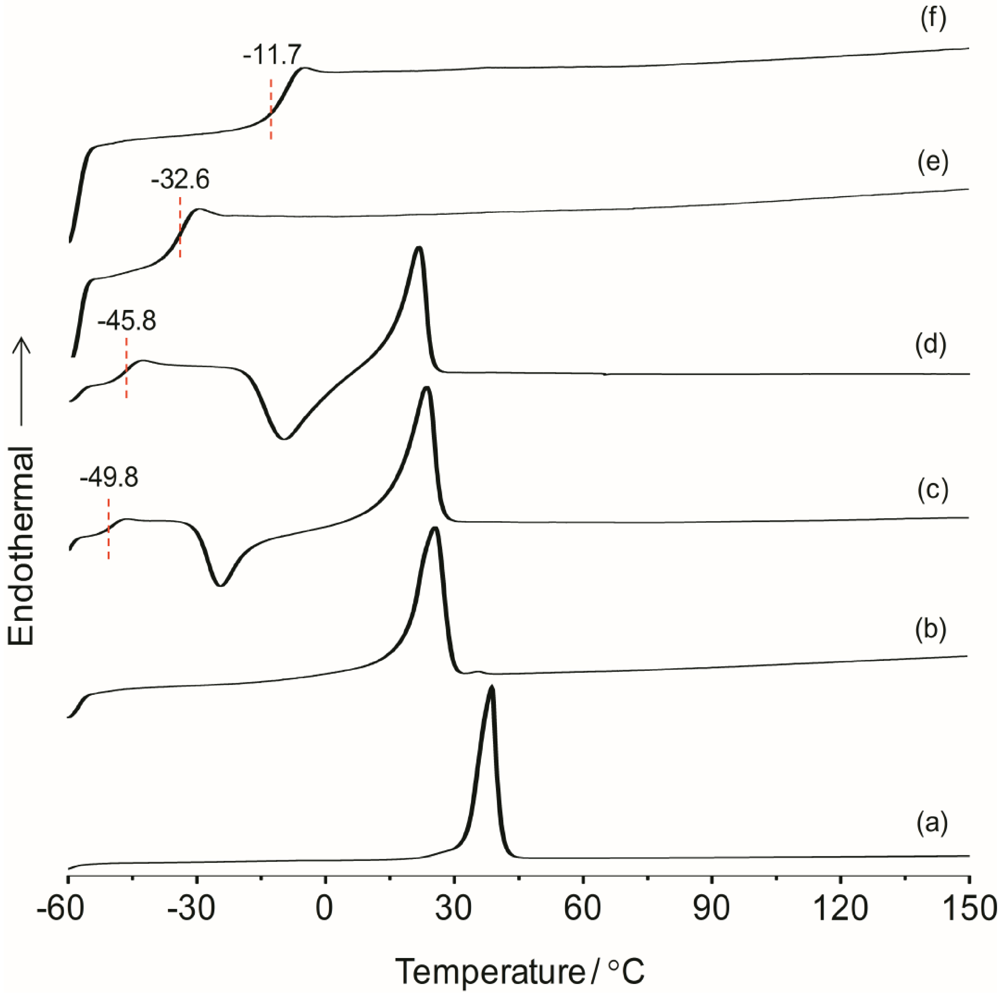
2.1. Thermal Behavior
The overall thermal properties of the organic–inorganic hybrid polymer electrolyte systems have been investigated by the differential scanning calorimetry (DSC) technique. The glass transition temperature (
Tg), melting point (
Tm) and the crystallinity (
χ) of the material are all important parameters resulting from the microstructure and morphology of the system. These parameters have influence on the overall separator properties of the hybrid electrolyte material when operating in a battery. The thermal behaviors of the hybrid electrolytes TIE(2000)-Z and TIE(600)-Z, with various [O]/[Li] ratios are shown in
Figure 1 and Figure S1 (
Electronic Supplementary Information, ESI), respectively and the results are summarized in
Table 1. As seen in
Figure S1, the thermograms of TIE(600)-Z hybrid electrolytes are completely amorphous. The DSC thermograms for TIE(2000)-Z hybrid electrolytes show that the crystallinity of the hybrid decreases with decreasing the [O]/[Li] ratio and become completely amorphous for [O]/[Li] ratios 16 and 8, since no melting transitions are observed. The parent polymer ED2000 has a melting transition at 38.7 °C. After reacting with ICPTES and TEOS, the peak shifts to 25.9 °C. The melting peak further shifts to 23.4 °C and 21.6 °C after doping with LiClO
4 for the [O]/[Li] ratios of 32 and 24, respectively. The decrease and disappearance of
Tm and the endothermic heat with increasing salt concentrations indicates that the crystalline structure of ED2000 is disrupted and completely suppresses with high level of LiClO
4 doping. The percentages of the crystallinity of the hybrid electrolytes are estimated using the equation:
where
![Membranes 02 00253 i002]()
is the enthalpy of fusion of pure ED2000 (111.7 J g
−1) and
∆Hf is the enthalpy of fusion of the hybrid electrolyte and the results are listed in
Table 1. As seen in
Table 1, the endothermic heat decreases with the decrease in the [O]/[Li] ratios and so as the crystallinity. It suggests that the increased interactions between the ether oxygen atoms of PEG and PPG and the Li
+ ions with increasing salt concentration inhibit the effective reorganization of the polymer chains and thus help to restrict crystallinity [
25]. An exothermic peak in the temperature range of −30 to −10 °C, corresponding to the recrystallization of ED2000 was observed for the TIE(2000)-Z (Z = 32 and 24) samples, while such a peak was not found in the other samples with higher salt contents [
22]. The recrystallization phenomenon was also not observed with the TIE(2000)-∞ (no salt) sample. This implies that the recrystallization process is related with lower salt concentration and it is suppressed by higher salt contents for the other hybrid electrolyte samples (TIE(2000)-16 and 8).
Figure 1.
Differential scanning calorimetry (DSC) thermograms of (a) pure ED2000 and TIE(2000)-Z hybrid electrolytes with various [O]/[Li] ratios, where Z = (b) ∞; (c) 32; (d) 24; (e) 16 and (f) 8.
Figure 1.
Differential scanning calorimetry (DSC) thermograms of (a) pure ED2000 and TIE(2000)-Z hybrid electrolytes with various [O]/[Li] ratios, where Z = (b) ∞; (c) 32; (d) 24; (e) 16 and (f) 8.
Table 1.
Glass-transition temperature (Tg), melting temperature (Tm), endothermic heat (ΔHf), crystallinity (χc), Fourier transform infrared (FTIR) deconvolution result, Arrhenius activation energy (Ea) and Vogel-Tamman-Fulcher (VTF) parameters of TIE(Y)-Z hybrid electrolytes with various [O]/[Li] ratios.
| Samples | TIE (2000)-Z | TIE (600)-Z |
|---|
| Tg (°C) | Tm (°C) | Δ Hf (J g−1) | χc (%) | Free ClO4−, % (~625 cm−1) | Ea (eV) | A (Scm−1 K 0.5) | B (eV) | Tg (°C) | Free ClO4−, % |
|---|
| Z | | | | | | | | | | |
|---|
| Pure ED2000 | - | 38.7 | 111.7 | 100 | - | - | - | - | - | - |
| ∞ | - | 25.9 | 56.6 | 50.6 | - | - | - | - | −31.7 | - |
| 32 | −49.8 | 23.5 | 39.9 | 35.5 | 100 | 0.32 | 36.7 | 0.13 | −25.5 | 85.2 |
| 24 | −45.8 | 21.6 | 29.3 | 26.3 | 88.2 | 0.3 | 60.2 | 0.12 | −20.0 | 81.3 |
| 16 | −32.6 | - | - | - | 85.7 | 0.35 | 141.6 | 0.12 | −11.5 | 79.3 |
| 8 | −11.7 | - | - | - | 75 | 0.42 | 60.5 | 0.1 | 7.8 | 73.3 |
The mobility of the Li ions within the polymer matrix is one of the factors which govern the ionic conductivity in SPEs. It depends on the segmental motion of the polymer chains in the amorphous phase, which is characterized by
Tg.
Tg is one of the most important parameters of the amorphous phase for the flexibility of the polymer at room temperature. As seen in
Figure 1 and
Figure S1, the
Tg values are progressively shifted to higher values with increasing salt concentrations for the TIE(2000)-Z and TIE(600)-Z hybrid electrolyte systems. The increase in the
Tg value is attributed to the interactions developed between the polymer segment and the salt due to the formation of transient cross-links between the salt and the polyether phase [
26]. As the salt concentration increases in the hybrid electrolytes, the formation of associated ionic species (e.g., contact ion pairs and/or ion aggregates) also increases and these aggregates may be less mobile than the dissociated ions. The presence of such polymer-salt interactions restricts segmental mobility of the host hybrid matrix and progressively increases the
Tg values.
The polymer chain length also influences the
Tg of the hybrid matrix. As seen in
Table 1, the increase of the PEG fraction of the polymer chains in TIE(2000)-Z decreases the
Tg values more for all the lithium concentrations in comparison to TIE(600)-Z hybrid electrolytes. This suggests that the PEG fraction of the polymers has an effect on the dynamics of the polymer and influence the
Tg. Since the polymer chains are bonded to the silicate network by covalent bonds, it is reasonable that the entire chain is closer to the silica node and the segmental motions are thus more hindered for the case of shorter PEG chains. For longer PEG chains, however, only a small fraction of the chains is located near the silica interface and the majority of chain segments have high mobility, which makes TIE(2000)-Z hybrids more flexible and lower
Tg values than TIE(600)-Z hybrids.
2.2. Polymer-Ion Interactions
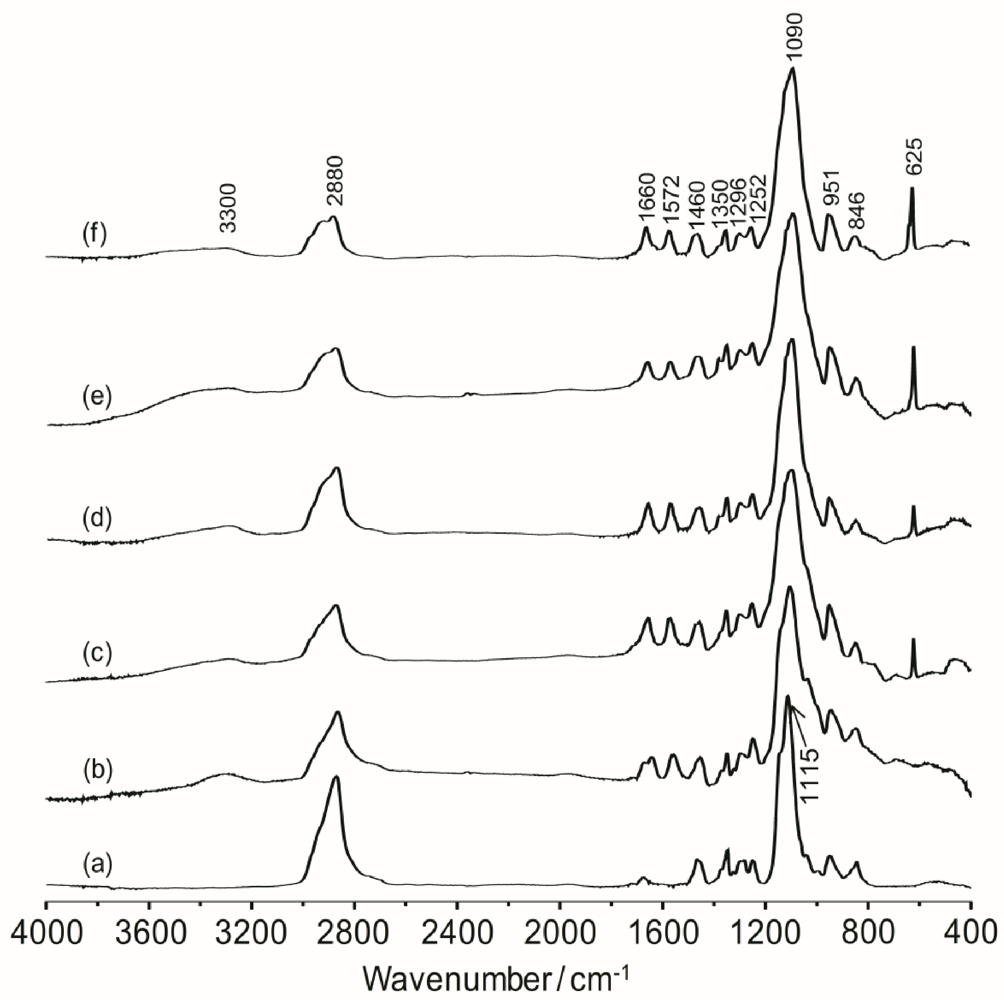
Infrared spectroscopy is a convenient method to provide the information about the structure of organic–inorganic system and the interaction of the polyether with the lithium salt.
Figure 2 shows the FTIR spectra of the TIE(2000)-Z hybrid electrolytes with various [O]/[Li] ratios. The band observed around 3300 cm
−1 is assigned to the hydrogen-bonded N–H stretching mode [
27]. The band around 2880 cm
−1 is due to –CH
2 stretching of polyether groups [
28]. The band at 1660 cm
−1 is assigned to the amide I modes with hydrogen bonding. Generally, the amide I band is related to C=O stretching, the C–N stretching and C–C–N deformation vibrations [
29]. The amide II band is associated with the vibration of N–H in-plane bending, the C–N stretching, and the C–C stretching modes [
29,
30]. The band observed at 1572 cm
−1 is attributed to the amide II mode. The presence of these amide bands confirms a successful synthesis of the hybrid. The peaks at 1460, 1350, 1296, 1252 and 846 cm
−1 are assigned to –CH
2 bending, wagging, twisting and rocking vibrations of the polymer, respectively [
31,
32]. One major peak associated with C–O–C asymmetric stretching vibration is observed at 1115 cm
−1 for pure ED2000. After formation of the polymer-silica hybrid (
i.e., TIE(2000)-∞), the peak becomes broader since the characteristic absorption bands of the hydrolysis product of TEOS and ICPTES are also expected to appear in the same region. With the addition of the lithium salts, the peak at 1115 cm
−1 is shifted to 1090 cm
−1, suggesting that the ether groups of ED2000 have some interactions with the added lithium cations. The typical absorption band for noncondensed Si–OH is observed around 951 cm
−1 [
33].
Figure 2.
FTIR spectra of (a) pure ED2000 and TIE(2000)-Z hybrid electrolytes with Z = (b) ∞; (c) 32; (d) 24; (e) 16 and (f) 8.
Figure 2.
FTIR spectra of (a) pure ED2000 and TIE(2000)-Z hybrid electrolytes with Z = (b) ∞; (c) 32; (d) 24; (e) 16 and (f) 8.
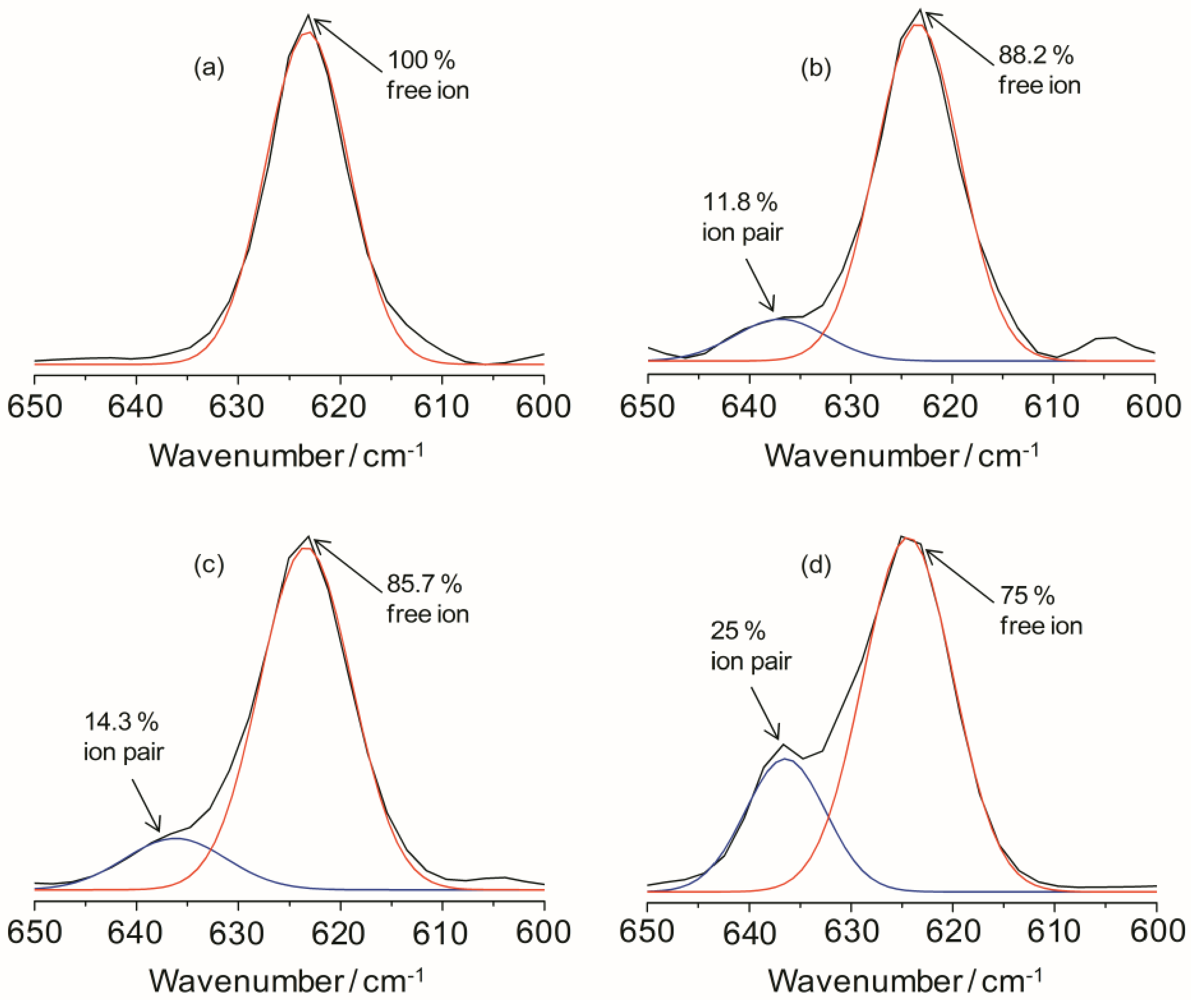
The ionic association of the hybrid electrolyte system can be analyzed by estimating the vibrational modes of the ClO
4− anion. The characteristic
ν(ClO
4−) mode of LiClO
4 is particularly sensitive in changing the ion-ion interactions in the electrolyte systems. The peak around 610 to 650 cm
−1 in the IR spectra for the TIE(2000)-Z samples can be deconvoluted into two bands centered at 625 and 635 cm
−1 due to the vibration modes of ClO
4− ions. The band around 625 cm
−1 has been assigned to the vibration of the “free” ClO
4− anion, which does not interact directly with the lithium cations, and the band around 635 cm
−1 to the vibration of the Li
+ClO
4− contact-ion pairs [
34,
35]. The behavior of ionic association is investigated by fitting the
ν(ClO
4−) envelop with Gaussian-Lorentzian functions and the results are displayed in
Figure 3 for TIE(2000)-Z hybrid electrolytes. The fraction of “free” anions and contact-ion pairs has been calculated as the ratio of the area under the peaks attributed respectively to “free” anions and contact-ion pairs to the total area for the
ν(ClO
4−) vibrations. As can be seen in
Figure 3, the peak characteristic for “free” anions is much larger than that representing contact-ion pairs. The fractions of “free” anions as a function of salt concentration for the hybrid electrolytes are given in
Table 1. As seen in
Table 1, the fraction of free anions decreases with increasing salt concentrations. About 100% of ClO
4− exists as spectroscopically “free” species for TIE(2000)-32, while about 75% of free ClO
4− is observed for the electrolyte TIE(2000)-8, with higher salt concentration (
Table 1). This is as expected since more and more free ions become bound with the opposite ions to form contact ions upon addition of more salts leading to the decrease in free ions. The degree of ion dissociation slightly increased when the molecular weight of the polymer host changed from 600 to 2000 g mol
−1 (
Table 1). As the [O]/[Li] ratios are based on the PEO and PPO unit in the oligomers (ED2000, PEO = 40.5 and PPO = 3.5; ED600, PEO = 8.5 and PPO = 3.5) and amount of PPO is same in both the oligomers, the slight increase in degree of ion dissociation at a given [O]/[Li] ratio may be due to the contribution from the PEO segment. Since PPO is expected to have a poorer ability to dissolve salts as compared to PEO, these hybrid systems based on the polymer ED2000 have a high degree of ionic dissolution, suggesting that the effect of the silica network resulting from the sol-gel condensation of silica precursors is important as in the case of composite polymer electrolytes.
Figure 3.
IR deconvolution results (in the range of 600 to 650 cm−1) of TIE(2000)-Zhybrid electrolytes with various [O]/[Li] ratios, where Z = (a) 32; (b) 24; (c) 16 and (d) 8.
Figure 3.
IR deconvolution results (in the range of 600 to 650 cm−1) of TIE(2000)-Zhybrid electrolytes with various [O]/[Li] ratios, where Z = (a) 32; (b) 24; (c) 16 and (d) 8.
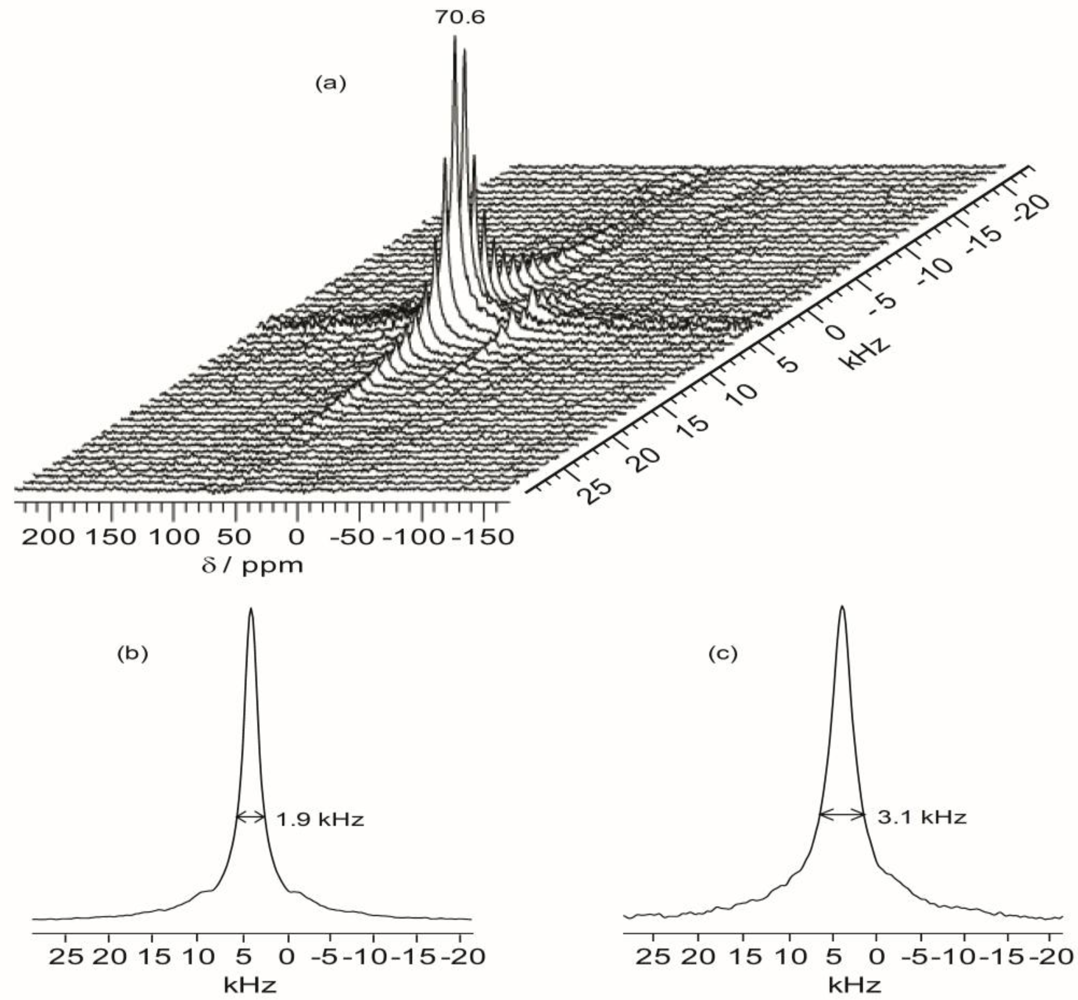
2.6. 2D 1H–13C WISE NMR
Two-dimensional wide-line separation (WISE) NMR spectroscopy is a simple and elegant method to measure the local mobility of polymers by correlating the proton lineshape with the carbon chemical shift [
37]. With this technique, the spectroscopic information about the dynamic behavior within the present hybrid can be qualitatively assessed by examining the proton line widths associated with the ether carbons in the polymer host.
Figure 7 shows the projections of the
1H dimension of the WISE spectra associated with the 70.7 ppm peak for TIE(600)-32 and TIE(600)-8. The linewidth of the
1H line reflects the nature of the dipolar interaction between the protons and thus can be used to monitor the mobility of the polymer chains. For the selected carbon signal at 70.7 ppm, the TIE(600)-8 sample exhibits a larger linewidth (3.1 kHz) in the
1H dimension than the TIE(600)-32 sample (1.9 kHz). This indicates some microscopic dynamic changes of the polymer chains as the salt content is increased.
Thus, the 2D WISE NMR spectra confirm that the mobility of the polymer chains decreases as the salt concentration is increased due to complexation of Li+ with the ether oxygen atoms. In comparison to most crystalline or semicrystalline polymers, which always exhibits proton linewidth larger than 50 kHz, the much narrower proton linewidth from the 2D WISE NMR reveals considerable chain mobility for the present hybrid electrolytes. The WISE NMR results provide a microscopic view into the mobility change of the polymer chains as functions of salt concentrations, which are also corroborated by the Tg trends as revealed by DSC.
Figure 7.
Representative 2D 1H–13C wide-line separation (WISE) NMR spectrum (a) and the projections of the 1H dimension of 2D 1H–13C WISE spectra associated with the 70.7 ppm peak in the 13C dimension for TIE(600)-Z hybrids, where Z = (b) 32 and (c) 8.
Figure 7.
Representative 2D 1H–13C wide-line separation (WISE) NMR spectrum (a) and the projections of the 1H dimension of 2D 1H–13C WISE spectra associated with the 70.7 ppm peak in the 13C dimension for TIE(600)-Z hybrids, where Z = (b) 32 and (c) 8.
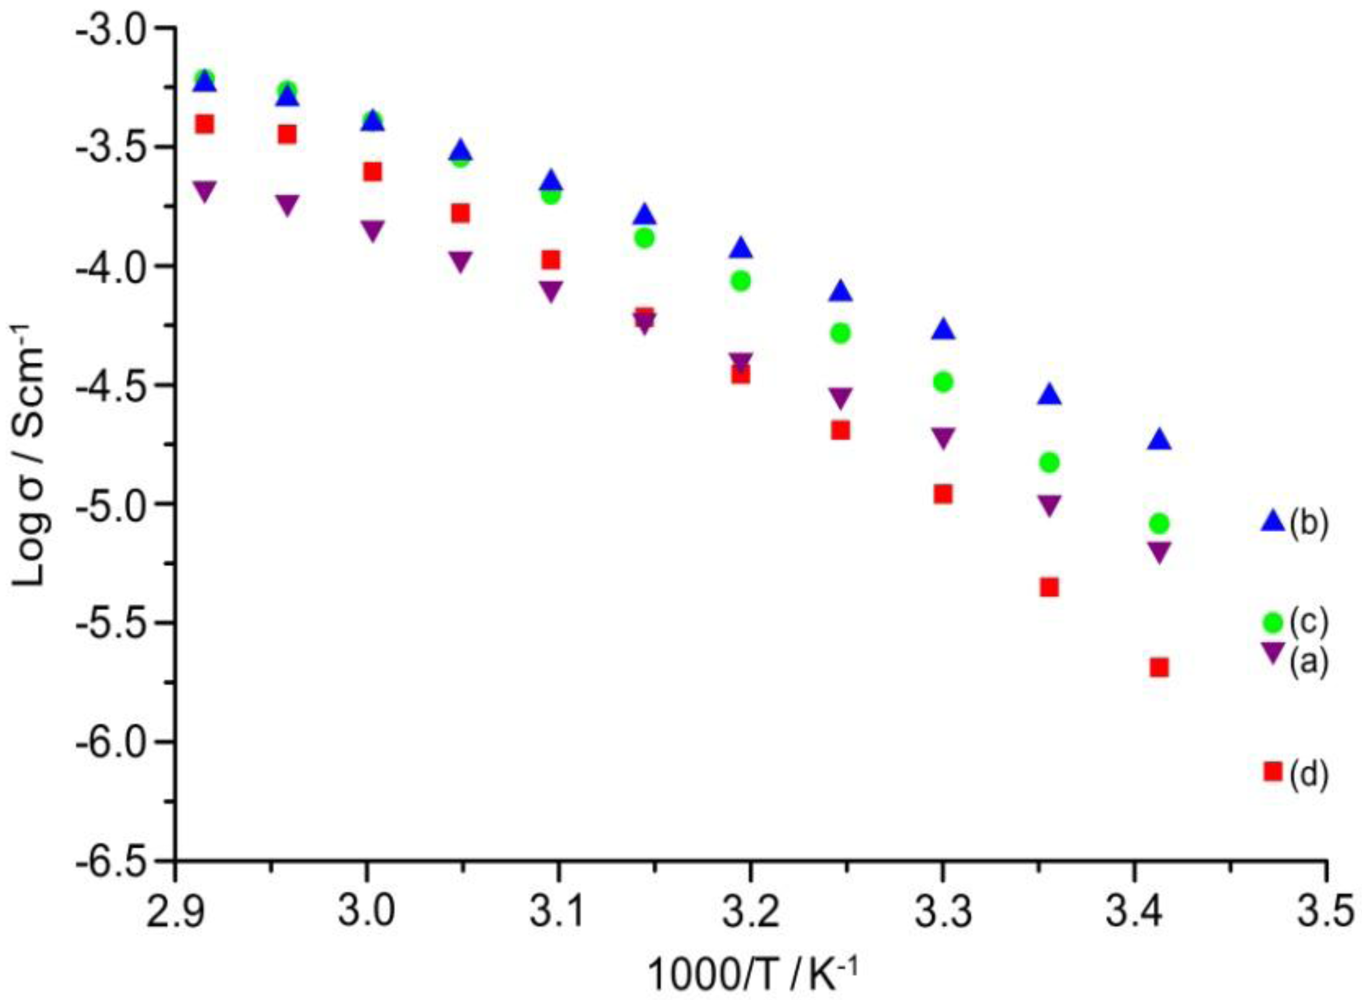
2.7. Ionic Conductivity
The temperature dependence of ionic conductivity of the TIE(2000)-Z and TIE(600)-Z organic–inorganic hybrid electrolytes with various [O]/[Li] ratios are shown in
Figure 8 and
Figure S2 (ESI), respectively. The variation of conductivity with temperatures suggests a Vogel-Tamman-Fulcher (VTF) like behavior, indicating that the ion transport in the present hybrid electrolytes is mainly dependent on the polymer segmental motion. It is observed that ionic conductivity of the hybrid electrolytes increases with increase in salt concentration and reached the maximum at [O]/[Li] = 24. The hybrid electrolyte exhibits the highest ionic conductivity values of 5.3 × 10
−5 Scm
−1 and 4.0 × 10
−4 Scm
−1 at 30 °C and 60 °C, respectively, for TIE(2000)-24 sample. Further increase in the salt content results in a decrease in the ionic conductivity for the hybrid electrolyte with [O]/[Li] = 16 and 8. The conductivity trend can be described from FTIR data on free ClO
4− ion. As seen in
Table 1, the lithium ions in the TIE(2000)-32 sample are almost 100% free in comparison to 88% in TIE(2000)-24. The total number of lithium ions are less in [O]/[Li] = 32 than [O]/[Li] = 24, which are not enough to push the ionic conductivity value above the conductivity value of [O]/[Li] = 24. For [O]/[Li] = 16 and 8, by contrast, the number of charge carriers is more, but the amount of contact ion pairs/aggregates is also enhanced (14% and 25%, respectively). These aggregates naturally contribute less effectively to charge transport and eventually hinder the mobility of the charge carriers throughout the polymer matrix. Therefore, the optimum ionic conductivity value is obtained for the TIE(2000)-24 sample. The activation energy (
Ea) is calculated from the conductivity plot and the values are given in
Table 1. As seen in
Table 1, the activation energy increases with the increase in salt concentration. The increase in the ion-ion interaction (e.g., formation of ion pairs/multiple ions) with the increase in salt concentration reduces the ionic mobility and thus enhances the activation energy. This result also complies with the FTIR deconvolution results, which show more ion pairs at higher salt concentration.
Figure 8.
Temperature dependence of ionic conductivity of TIE(2000)-Z hybrid electrolytes with Z = (a) 32; (b) 24; (c) 16 and (d) 8.
Figure 8.
Temperature dependence of ionic conductivity of TIE(2000)-Z hybrid electrolytes with Z = (a) 32; (b) 24; (c) 16 and (d) 8.
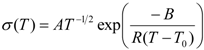
As the conductivity plot suggests a curve profile, necessitating interpretation of the results by the VTF equation:
where
A is the pre-exponential factor related to the number of charge carriers in the polymer electrolyte,
B is the pseudo-activation energy of the ion transport related to the configurational entropy of the polymer chains,
R is the perfect gas constant, 8.314 JK
−1mol
−1 and
T0 is the ideal transition temperature at which the configurational entropy becomes zero,
i.e., the disappearance of the free volume is complete.
T0 is fixed at
Tg − 50 K for the present electrolytes resulting in a good fit to the data. The VTF equation predicts that a plot of ln(
σT0.5)
vs. 1/(
T −
T0) should be linear, which is nearly observed in
Figure S3 (ESI). The values of the VTF parameters (
A and
B) for the hybrid electrolytes are listed in
Table 1. The
A parameter increases with the increase in salt concentration and exhibits a maximum value for the [O]/[Li] = 16. A further increase in salt concentration decreases the value of
A. Moreover, the calculated values of the pseudo-activation energy,
B, are in the range of 0.1–0.13 eV, indicating sufficient mobility of the ions.
In the case of TIE(600)-Z hybrid electrolyte system, the maximum room temperature ionic conductivity value achieved is 4.9 × 10
−6 Scm
−1 with [O]/[Li] = 8. It is observed that the ionic conductivity increases with the increase in the salt concentrations. Although the number of free ions are more in the case of [O]/[Li] = 32 (85%), the sample with [O]/[Li] = 8 also possesses more than 73% free ions, which may be sufficient to get this value of conductivity. In addition, the number of charge carriers are more in [O]/[Li] = 8 in comparison to 32, which may assist in the enhancement of ionic conductivity. The conductivity of the TIE(2000)-24 sample is almost one order higher than the conductivity of the TIE(600)-8 sample. This may be attributed to the longer chains of alkylene oxides of ED2000, compared to ED600, and hence the lower
Tg of TIE(2000)-Z based samples. In addition, the higher percentage of ethylene oxide to propylene oxide ratio in ED2000 than ED600 (about 40.5 and 8.5 PEG units contain in ED2000 and ED600, respectively) is also helpful for the enhancement of conductivity [
18]. These conductivity results are comparable or higher than the organic–inorganic hybrid electrolytes previously reported [
14,
15,
16,
17].
The behavior of conductivity enhancement with temperature can be understood in terms of the free-volume model [
38]. As the temperature increases, the vibrational energy of the polymer segments has acquired sufficient energy to push against the hydrostatic pressure imposed by its neighboring atoms and thus polymer can expand easily to produce free volume. Therefore, with the increase in temperature, the free volume increases. The resulting conductivity, represented by the overall mobility of ions and the polymer, is determined by the free volume around the polymer chains. Therefore, as temperature increases, ions, solvated molecules, or polymer segments can move into the free volume [
39]. This leads to an increase in ion mobility and segmental mobility that will assist ion transport and virtually compensate for the retarding effect of the ion clouds.
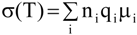
Several factors, such as mobility of polymer chains, cation and anion types, and salt concentration, are important to determine the ionic conductivity in polymer electrolytes. The ionic conductivity of a polymer electrolyte depends on the actual concentration of the conducting species and their mobility and may be given as:
where n
i is the number of charge carriers, q
i is the charge on each charge carrier, and μ
i is the mobility of charge carriers. According to the equation (4), the ionic conductivity depends on the amount of charge carriers in the system and the mobility of the various species. Mobility of the charge carriers depends on the
Tg of the polymer and it is observed that
Tg increases linearly with increasing salt concentration. The increase in the
Tg can be ascribed to the inter- and intramolecular coordination of ether dipoles with the charge carriers,
i.e., dissociated ions, which may act as transient cross-linking points in the polymer electrolytes. The increase in the
Tg decreases segmental motion of the matrix polymer, which directly reduces the ionic mobility.
It has been reported that the number of ions available for conduction is not the only cause for the increase in conductivity exhibited in amorphous and semicrystalline polymers. Ionic conductivity may depend on the influence of the filler on the mobility of both the polymer and the salt [
40]. As the present organic–inorganic hybrid electrolyte produces
in-
situ silica domains in the matrix, it can be considered as a two-phase system consisting of an ionically conducting polymer matrix with dispersed silica network. The space charge interphase layer between the polymer electrolyte and silica particles makes conductive paths for ions to move easily [
41]. At low salt concentration levels, the extent of contact ion pairs is low and the conductivity is dominated by the mobility of charge carriers, which is promoted by the existence of a space-charge layer at the polymer/silica interface. Therefore, the maximum ionic conductivity found for TIE(2000)-24 electrolyte sample is assumed to be caused by the combined effects of segmental movement, charge carrier concentration,
Tg and existence of polymer/silica interface layer in the hybrid.
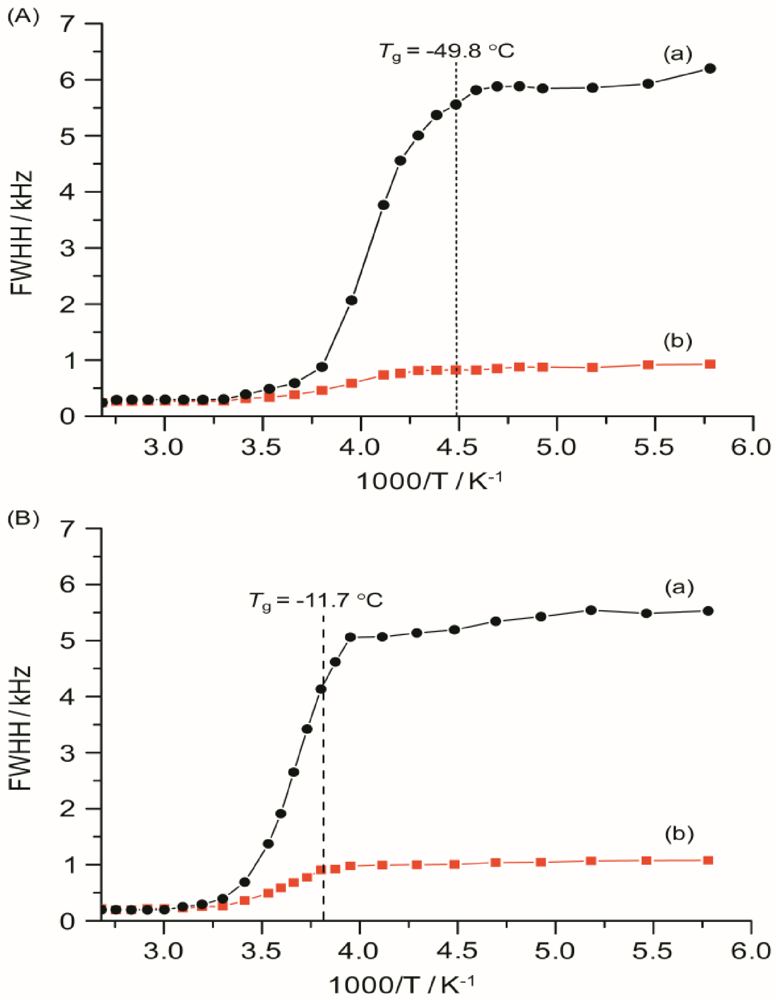
2.8. 7Li Linewidth Measurements
The mobility and transport of the charge carriers in a dynamic environment created by the polymer motion in the amorphous phase is a key factor for the ionic conductivity. The static
7Li line width measurements as a function of temperature are useful in determining the status of the motional narrowing process of the lithium cations. The NMR spectrum of the
7Li spin (
I = 3/2) in a crystalline sample is expected to consist of a narrow component due to the 1/2 ↔ −1/2 central transition and a Pake doublet due to the 3/2 ↔ 1/2 and –1/2 ↔ −3/2 satellite transitions [
36]. At lower temperatures the lineshape consists of a relatively narrow line superimposed on a broader line typically observed in other disordered systems [
42]. The broad or quadrupolar component is associated with the satellite transitions (±3/2 ↔ ±1/2), while the narrow component represents the central transition (1/2 ↔ −1/2). When the temperature is increased, both the narrow and broad components are narrowed around the glass transition temperature. Because the present hybrid electrolyte is a heterogeneous system, it is expected that there is a wide distribution of possible electric field gradients (EFG), which results in a Gaussian-broadened satellite line. Since, on the first order, the satellite splitting is dependent on the electric field gradients, the distribution of the quadrupolar coupling constants produced by disorder may smear out the satellites. Chung
et al. have shown that, at the low temperatures, the width of the central line is independent of the Larmor frequency and concluded that the dipolar interaction is the dominant factor in the 1/2 ↔ −1/2 central transition [
43].
The line associated with the 1/2 ↔ −1/2 transition is not broadened (up to the first order) by the quadrupole coupling [
44,
45], but other broadening sources, such as dipole–dipole couplings to neighboring nuclei, can contribute to its linewidth. Besides the homonuclear dipole–dipole broadening of the central line, there are heteronuclear contributions from protonic species (PEG and PPG) and coupling with the chlorine and oxygen from ClO
4− species. Given the small gyromagnetic factors and/or low natural abundance of
13C,
35Cl and
17O stable isotopes, one can conclude that the
7Li–
7Li and
7Li–
1H dipolar interactions are two major sources responsible for the observed lithium linewidth.
The
7Li linewidths, measured with and without
1H decoupling, are shown in
Figure 9 as a function of temperature from −100 to 100 °C for TIE(2000)-32 and TIE(2000)-8 samples. The static
7Li NMR linewidth evolution as a function of temperature can be described by a curve composed of two plateaus separated by a temperature range where a rapid change in the linewidths occurs. At the low-temperature region of −100 to −50 °C, below the
Tg of the systems, the line widths are very broad (fullwidth at half-height (FWHH) ≈ 5–6 kHz) and are not very sensitive to temperature changes. This suggests that the lithium ions are not mobile at low temperatures and thus are not conductive. The broad linewidth observed is the result of increased quadrupolar and/or internuclear dipole-dipole interactions. Upon increasing the sample temperature, the line widths are motionally narrowed, with the onset of narrowing correlating with the
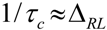
Tg. Motional narrowing begins when the rate of the fluctuations (1/τ
c) of either the local dipolar fields or the electric field gradients (EFG) is comparable to their respective rigid lattice linewidths (Δ
RL) or when 1/τ
c ~ Δ
RL, where 1/τ
c is the motional correlation time [
36]. The onset temperature of narrowing for both TIE(2000)-32 and TIE(2000)-8 samples corroborated well with their glass transition temperature, suggesting that the mobility of the lithium cations are coupled with the polymer dynamics in a cooperative way.
From the TIE(2000)-Z spectra it is possible to remove the heteronuclear interaction from the
7Li natural linewidth. The
7Li natural linewidths for TIE(2000)-32 and TIE(2000)-8 are found to be ~5.8 kHz and ~5.3 kHz, respectively at −60 °C. Decoupling the proton to remove
7Li–
1H dipolar interaction gives the residual linewidths of 0.8 and 1.03 kHz for TIE(2000)-32 and TIE(2000)-8 samples, respectively, which mainly results from
7Li–
7Li homonuclear interaction. Therefore, contributions of ~5.0 kHz for TIE(2000)-32 and ~4.3 kHz for TIE(2000)-8 to the lithium linewidths can be ascribed to
7Li–
1H interaction,
i.e., to the interaction between a nearly stationary lithium ion and the protons of the polymer chains. Therefore, approximately 85–80% interaction is for
7Li–
1H and 15–20% for
7Li–
7Li interaction in TIE(2000)-32 and TIE(2000)-8 hybrid electrolyte samples. This confirms that the linewidth of
7Li NMR spectra is predominately governed by
7Li–
1H dipolar interactions. These results are comparable to the PEO- and PPO-based SPEs [
46,
47,
48]. At sufficiently high temperatures, each sample exhibits a common high-temperature linewidth limit of about 0.2 kHz. The similarity in the temperature dependence of the linewidth for each sample indicates that a common diffusion mechanism and similar
7Li local environments exist for both the samples studied. This suggests that the ions segregate into regions of high density (polymer-rich domain) and low density (silica-rich domain). The change with salt concentration is only associated with the percentages of the two kinds of regions.
Figure 9.
Temperature dependence of 7Li static line widths of TIE(2000)-Z hybrid electrolytes with various [O]/[Li] ratios, where Z = (A) 32 and (B) 8, measured (a) without and (b) with proton decoupling. The dashed lines represent the Tg values obtained from DSC.
Figure 9.
Temperature dependence of 7Li static line widths of TIE(2000)-Z hybrid electrolytes with various [O]/[Li] ratios, where Z = (A) 32 and (B) 8, measured (a) without and (b) with proton decoupling. The dashed lines represent the Tg values obtained from DSC.
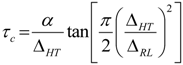
The activation energy,
Ea, of the samples can be obtained from NMR line narrowing data. The NMR motional narrowing of the
7Li linewidth takes place when the rate of fluctuations of the local magnetic fields or electric field gradients, which are generally described by a correlation time,
τc, is of the order of the rigid lattice linewidth, Δ
RLAn estimation of the activation energy for the narrowing process,
Ea, may be obtained by the relationship [
43]
where Δ
HT and Δ
RL are the FWHHs at a given temperature and in the rigid lattice, respectively, and
α is a constant of the order of unity. For both the TIE(2000)-32 and TIE(2000)-8 samples, the onset temperature of the rigid lattice linewidth (approximately 5–6 kHz) occurs at about −50 °C. Assuming that
τc is thermally activated
The
Ea values are calculated from
7Li linewidth measurements by fitting equations (6,7) and found to be 0.34 eV and 0.39 eV for the [O]/[Li] ratios of 32 and 8, respectively, which have similarities to the values obtained by other researchers [
46,
49,
50]. Although the measured E
a values from the
7Li linewidth measurements and the conductivity data (0.32 and 0.42 eV for [O]/[Li] = 32 and 8, respectively) have some variations, more or less the results are similar, which validate the accuracy of the measurement procedure.

 is the enthalpy of fusion of pure ED2000 (111.7 J g−1) and ∆Hf is the enthalpy of fusion of the hybrid electrolyte and the results are listed in Table 1. As seen in Table 1, the endothermic heat decreases with the decrease in the [O]/[Li] ratios and so as the crystallinity. It suggests that the increased interactions between the ether oxygen atoms of PEG and PPG and the Li+ ions with increasing salt concentration inhibit the effective reorganization of the polymer chains and thus help to restrict crystallinity [25]. An exothermic peak in the temperature range of −30 to −10 °C, corresponding to the recrystallization of ED2000 was observed for the TIE(2000)-Z (Z = 32 and 24) samples, while such a peak was not found in the other samples with higher salt contents [22]. The recrystallization phenomenon was also not observed with the TIE(2000)-∞ (no salt) sample. This implies that the recrystallization process is related with lower salt concentration and it is suppressed by higher salt contents for the other hybrid electrolyte samples (TIE(2000)-16 and 8).
