Author Contributions
Conceptualization, P.P., M.M. and S.U.; methodology, P.P., M.M. and S.U.; software, P.P.; validation, P.P., M.M., Y.O., Y.W.B., H.M., T.K. and S.U.; formal analysis, P.P., M.M., Y.O., Y.W.B., H.M., T.K. and S.U.; investigation, P.P.; resources, S.U.; data curation, P.P., M.M. and S.U.; writing—original draft preparation, P.P.; writing—review and editing, P.P.; visualization, P.P., M.M., H.M. and S.U.; supervision, M.M. and S.U.; project administration, S.U.; funding acquisition, M.M. and S.U. All authors have read and agreed to the published version of the manuscript.
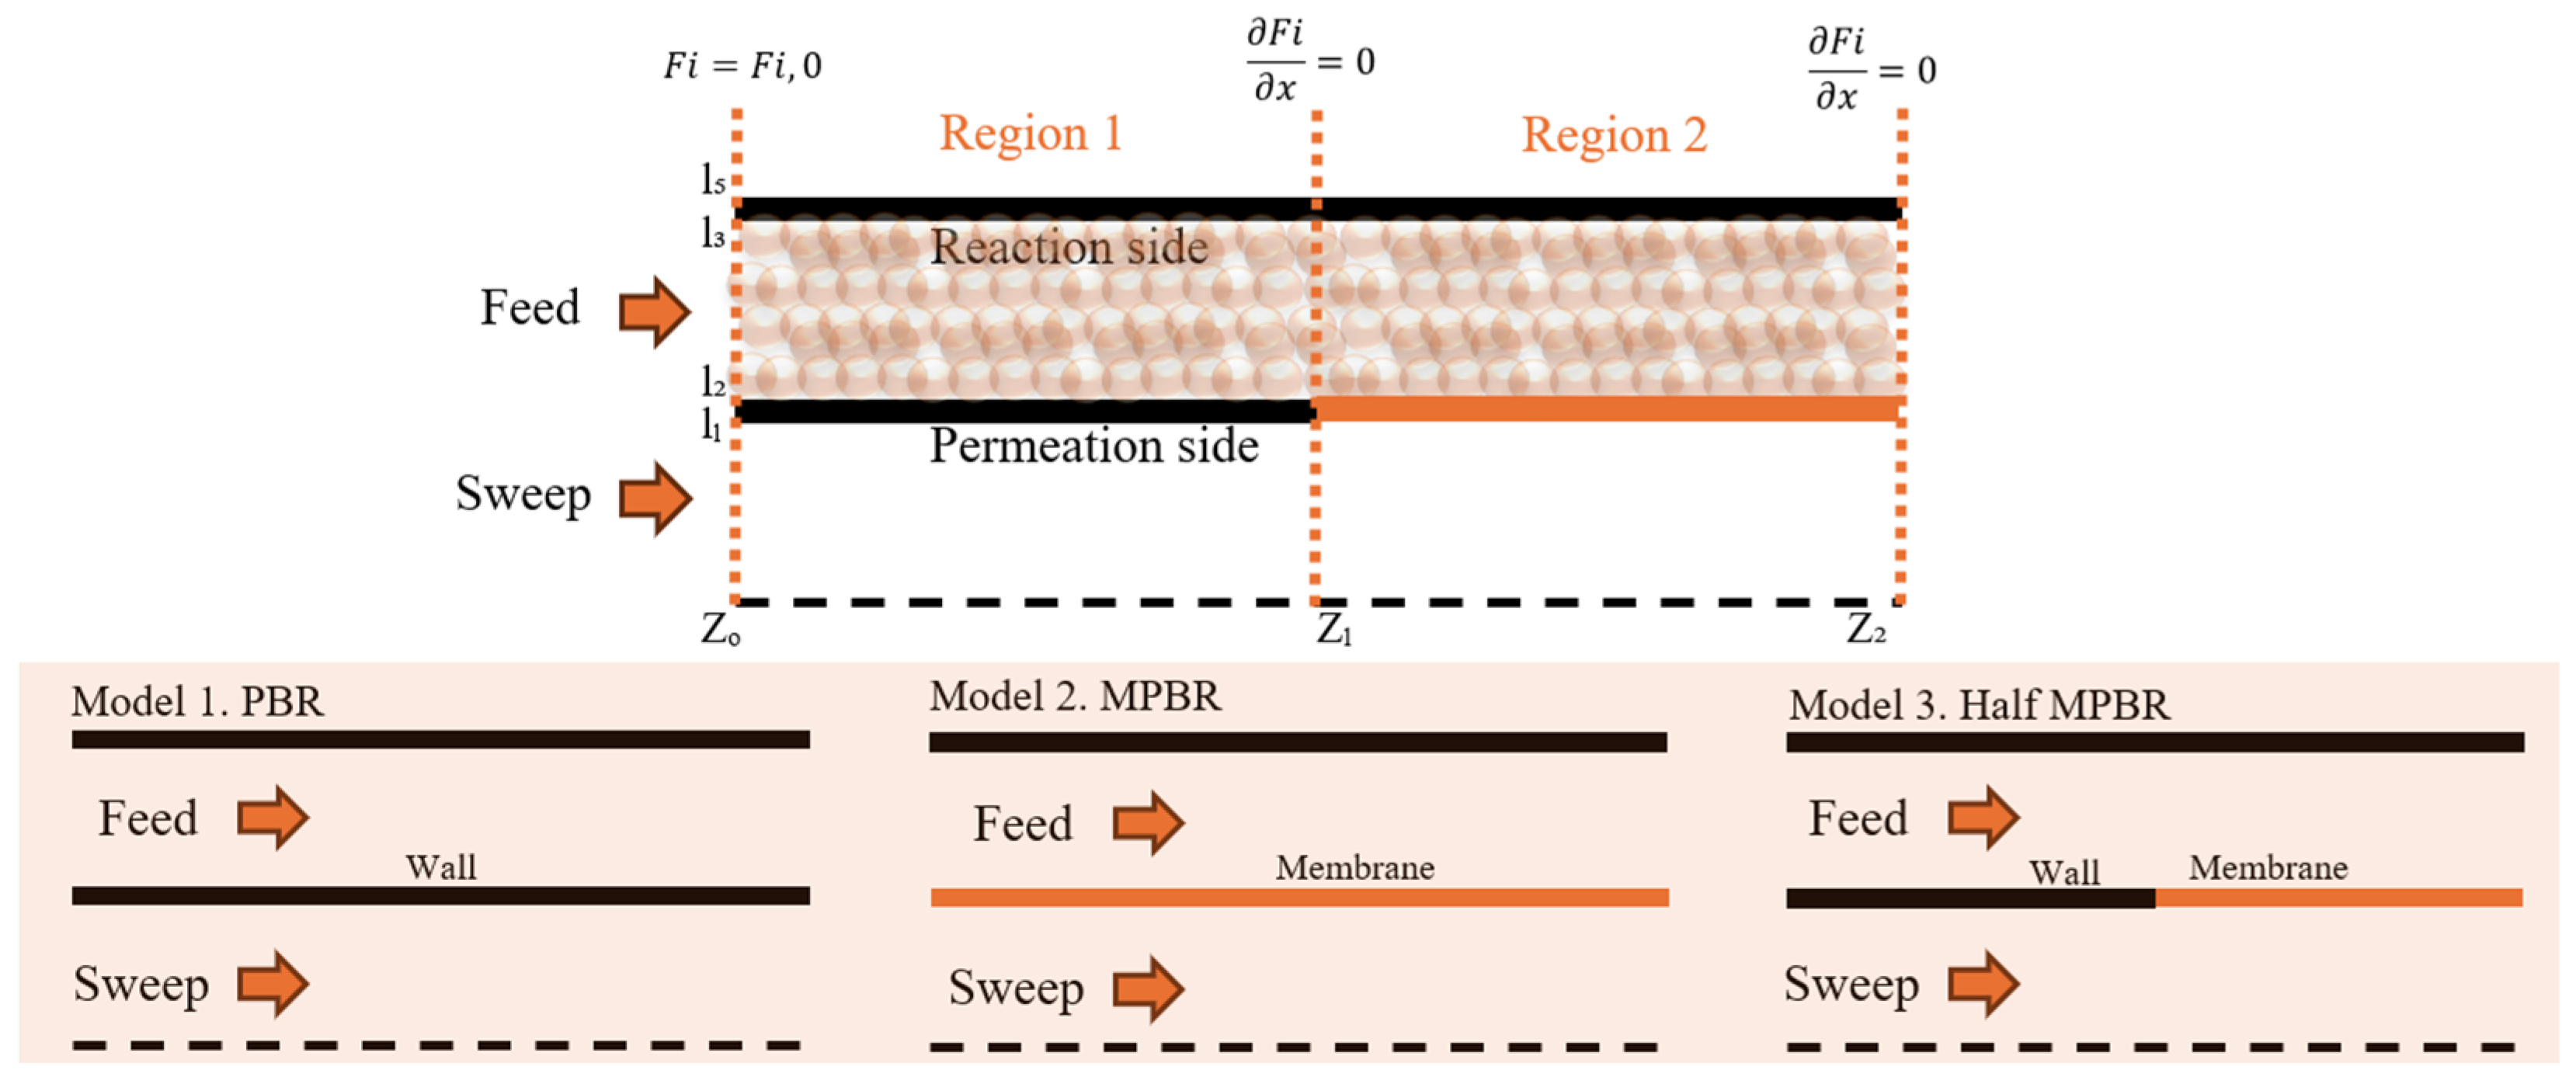
Figure 1.
Comparison of the PBR (left) and MPBR (right) systems.
Figure 1.
Comparison of the PBR (left) and MPBR (right) systems.
Figure 2.
Configuration tests on the MPBR system.
Figure 2.
Configuration tests on the MPBR system.
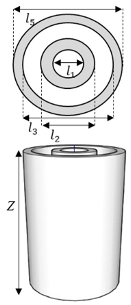
Figure 3.
Reactor design.
Figure 3.
Reactor design.
Figure 4.
Experiment versus simulation for PBR system development: (a) Conversion as a function of W/F, (b) Conversion as a function of temperature, and (c) Conversion as a function of H₂/CO₂ ratio.
Figure 4.
Experiment versus simulation for PBR system development: (a) Conversion as a function of W/F, (b) Conversion as a function of temperature, and (c) Conversion as a function of H₂/CO₂ ratio.
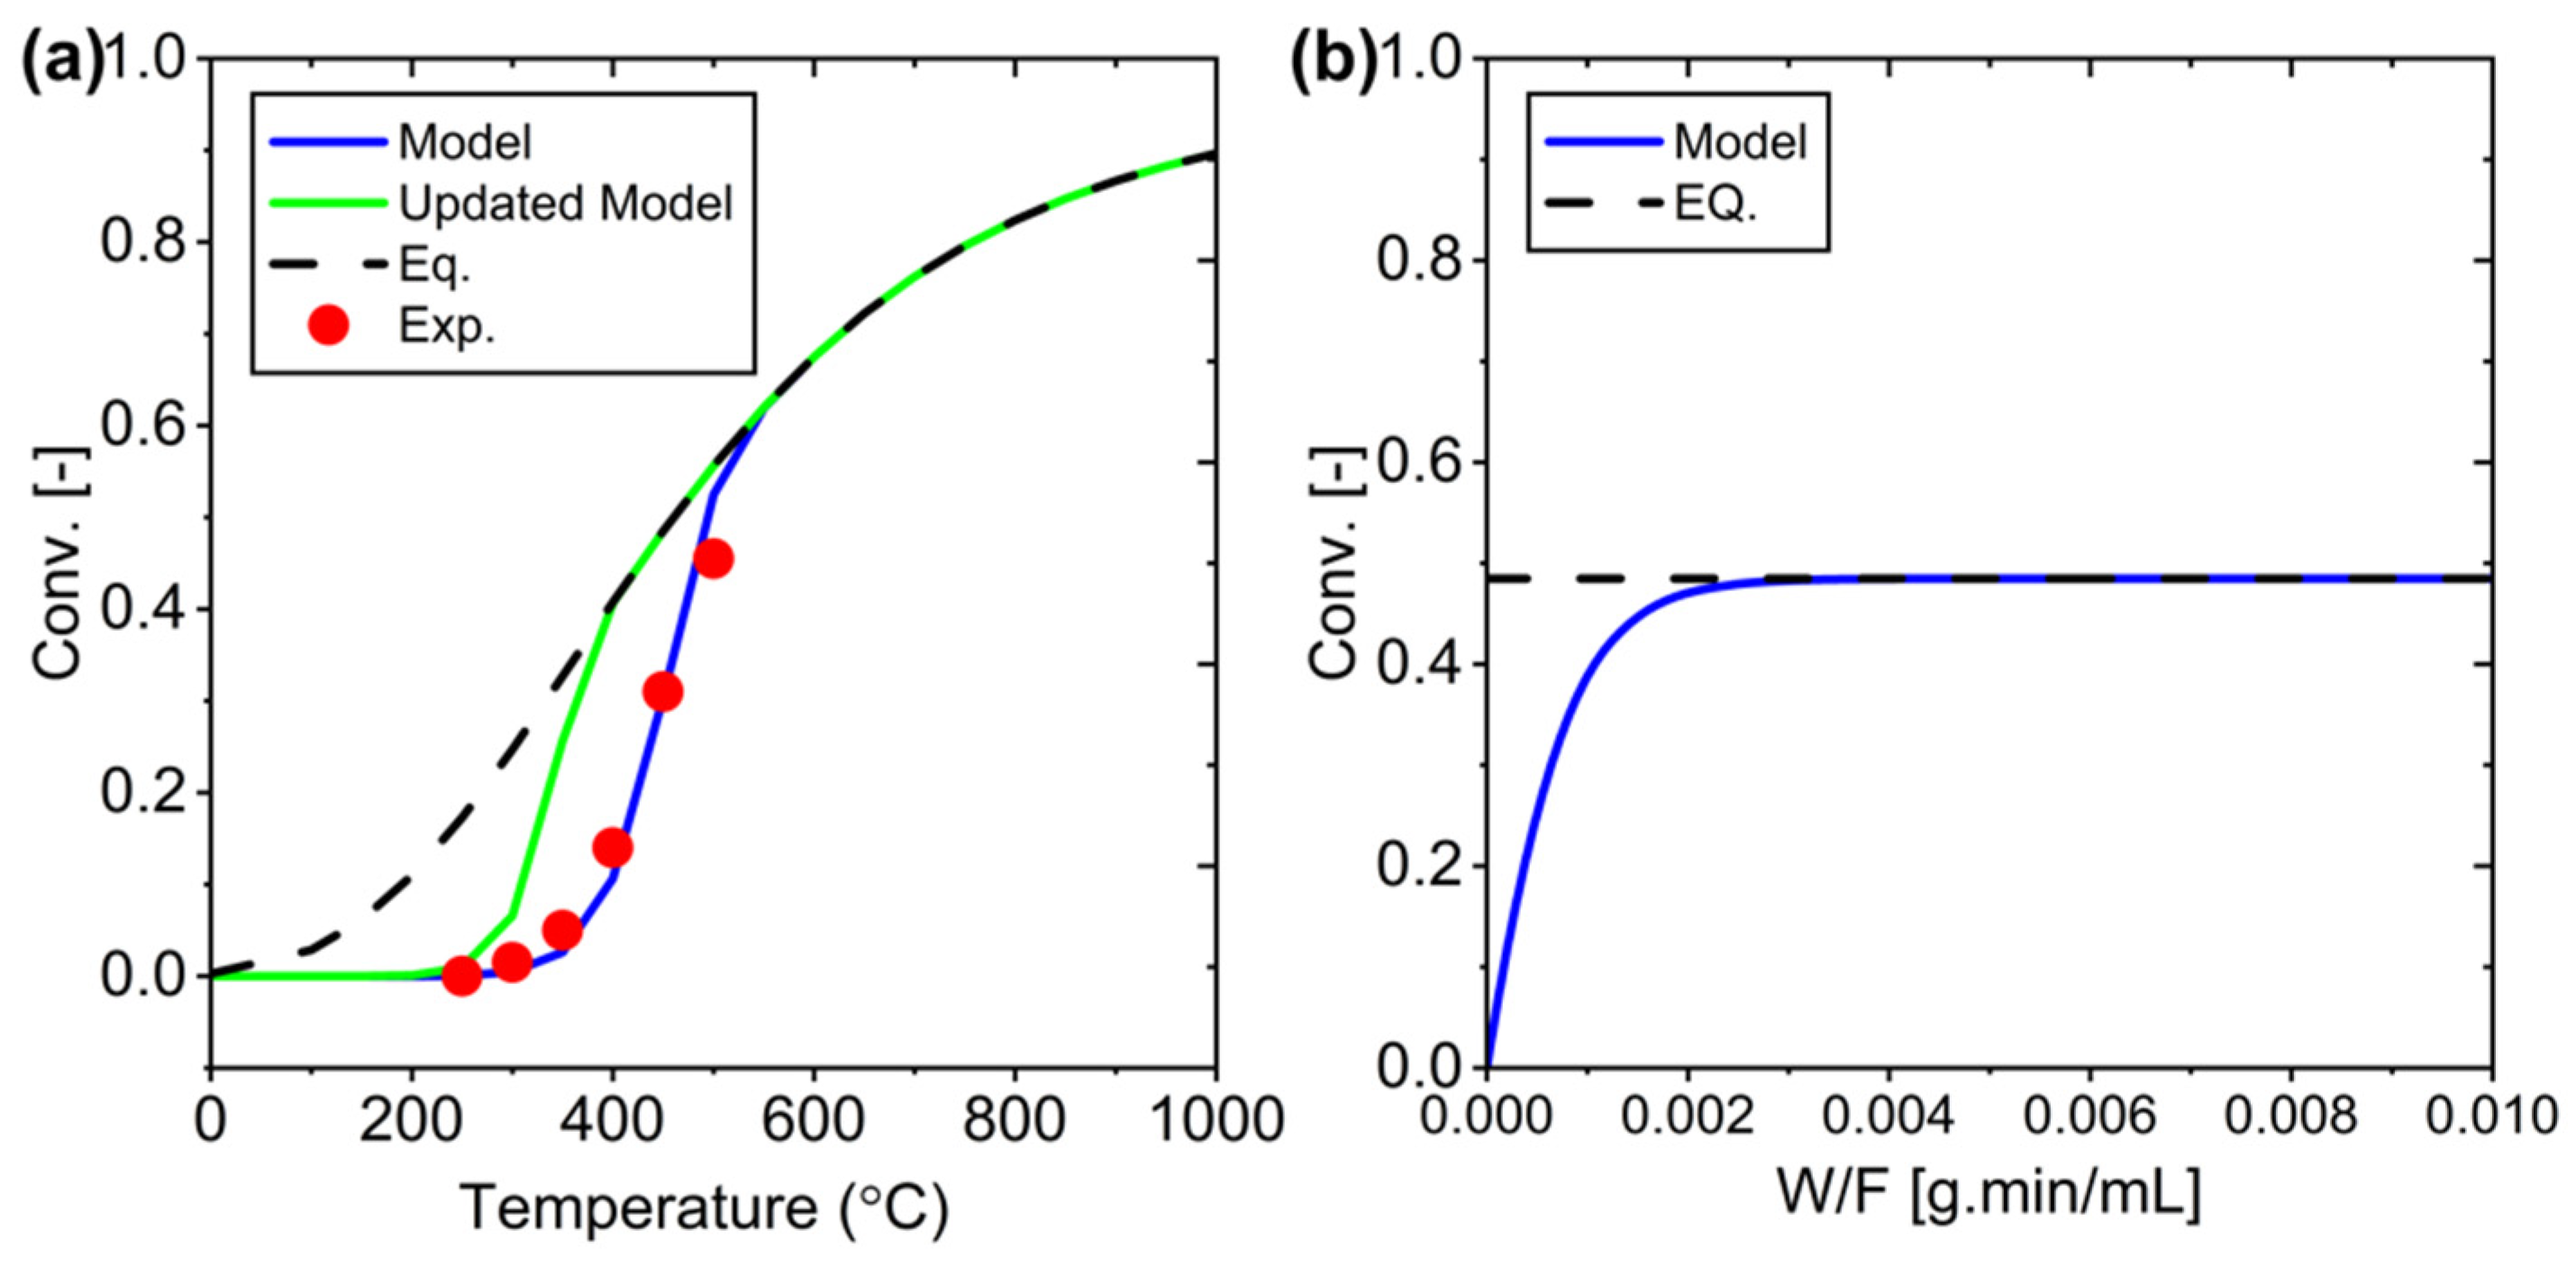
Figure 5.
Optimal conditions for the PBR system: (a) Conversion vs. temperature, and (b) Conversion vs. W/F at 400 °C (the optimal temperature).
Figure 5.
Optimal conditions for the PBR system: (a) Conversion vs. temperature, and (b) Conversion vs. W/F at 400 °C (the optimal temperature).
Figure 6.
(a) CO2 conversion profile in different reactor configurations. (b) Water pressure distribution along the reactor for the reaction and permeation side. (c) Temperature profile along the reactor, where minor oscillations at the inlet region are observed due to localized reaction effects before reaching thermal stability.
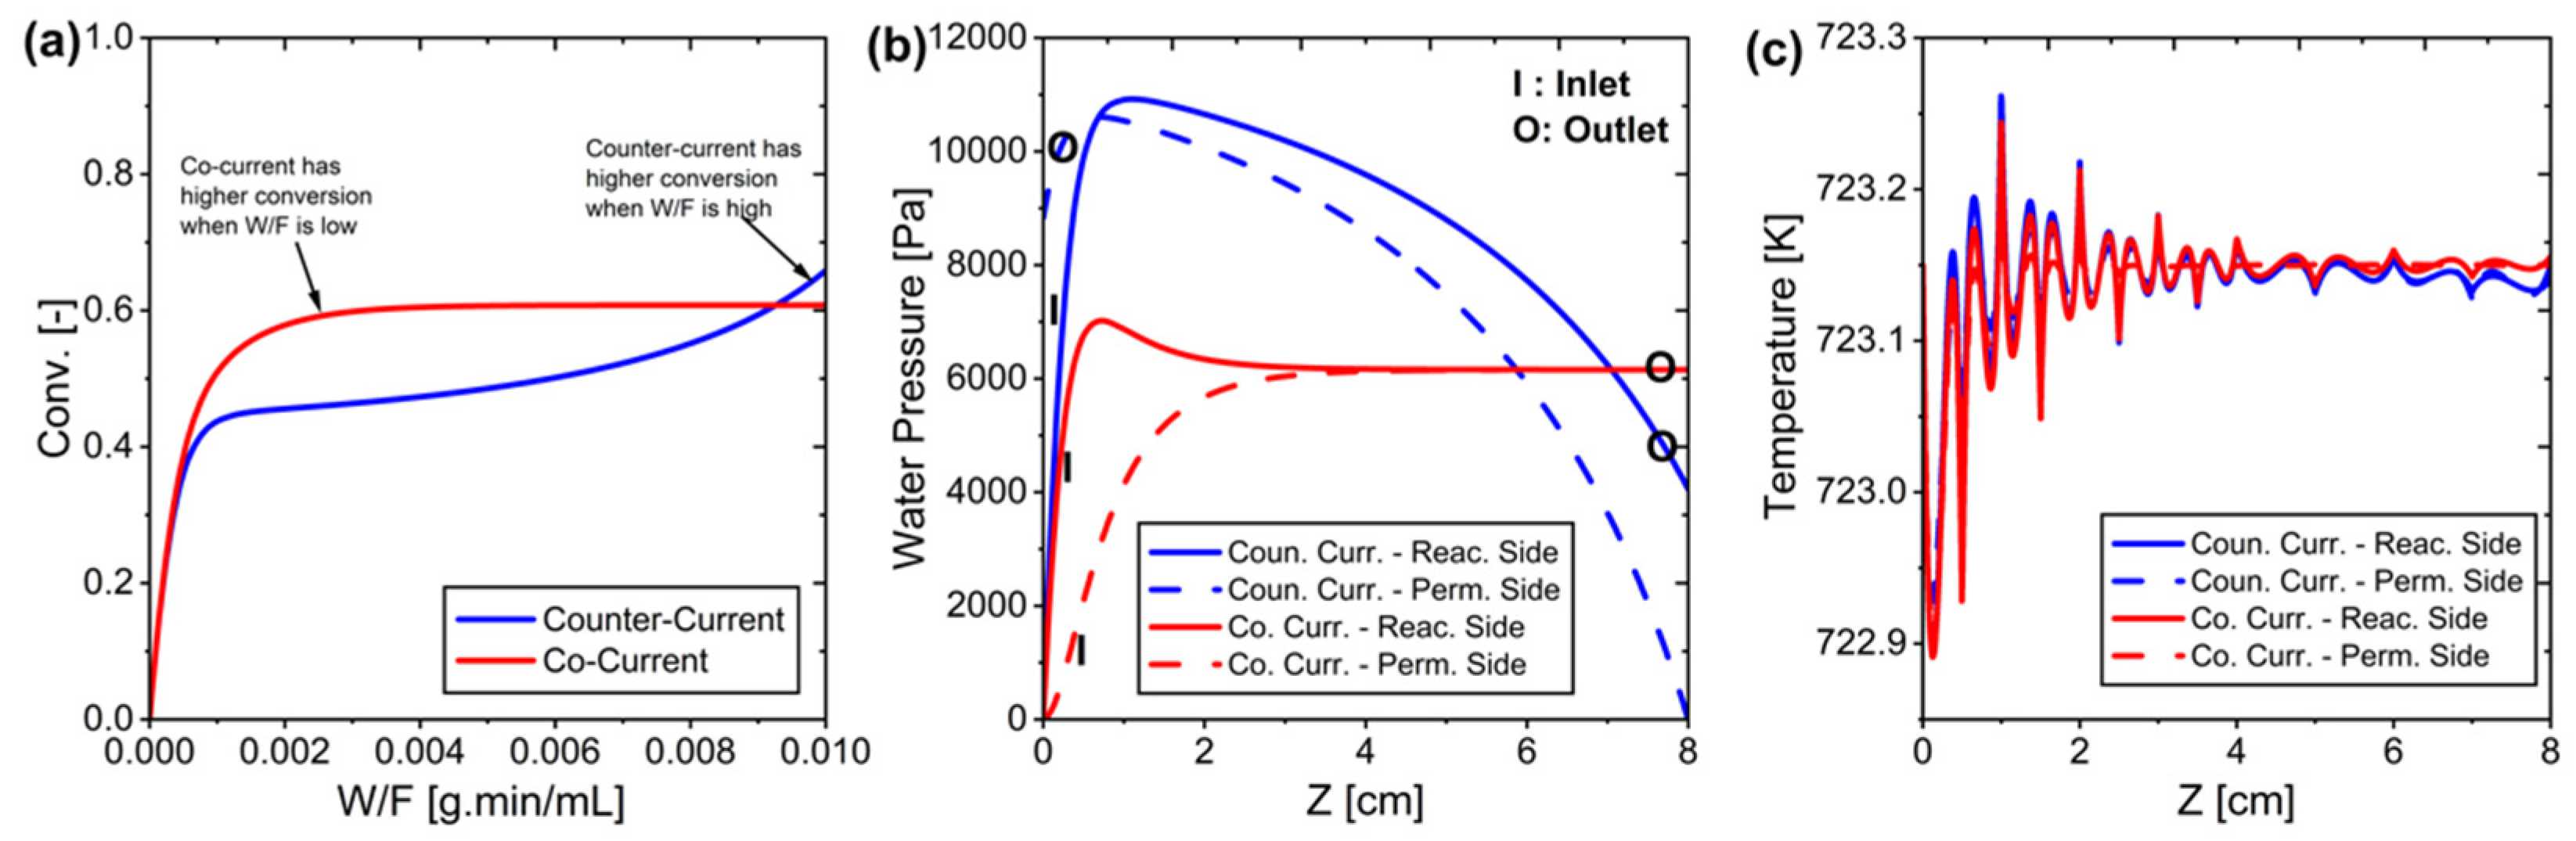
Figure 7.
Results of co-current and counter-current arrangements: (a) Conversion vs. W/F, (b) Water pressure on the reaction and permeation sides along the system, and (c) Temperature distribution along the system.
Figure 7.
Results of co-current and counter-current arrangements: (a) Conversion vs. W/F, (b) Water pressure on the reaction and permeation sides along the system, and (c) Temperature distribution along the system.
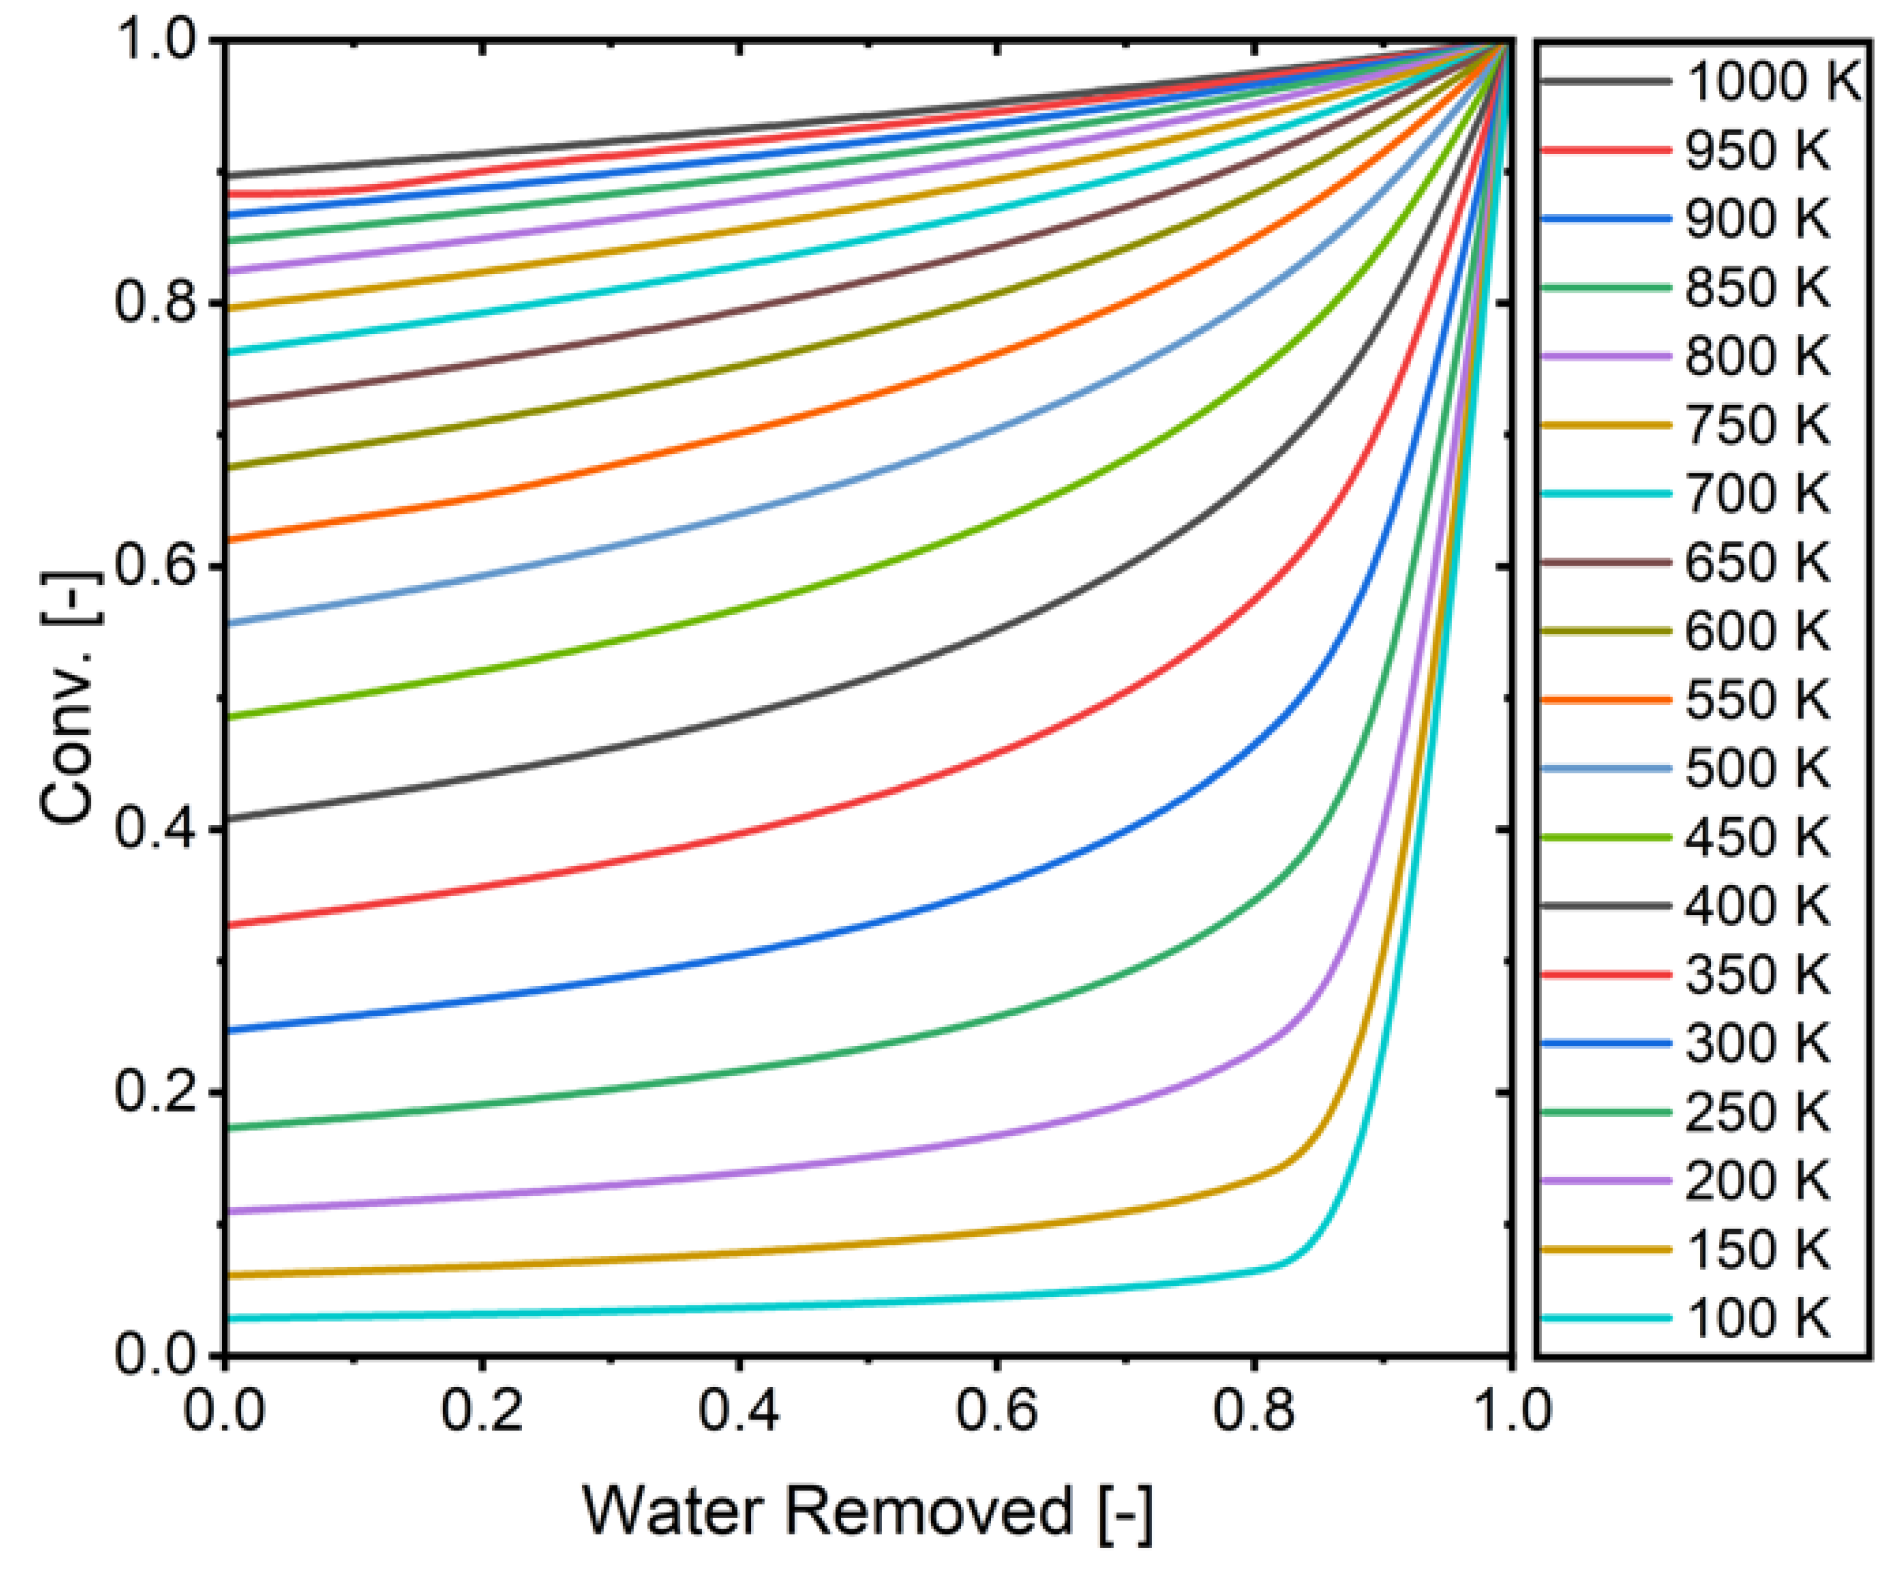
Figure 8.
The relationship between removed water and conversion (H2/CO2 = 4).
Figure 8.
The relationship between removed water and conversion (H2/CO2 = 4).
Figure 9.
System performance with the ideal membrane at various temperatures: (a) conversion vs temperature, (b) only water removed profile at different temperature, and (c) water pressure profile at reaction and permeation side at different temperatures.
Figure 9.
System performance with the ideal membrane at various temperatures: (a) conversion vs temperature, (b) only water removed profile at different temperature, and (c) water pressure profile at reaction and permeation side at different temperatures.
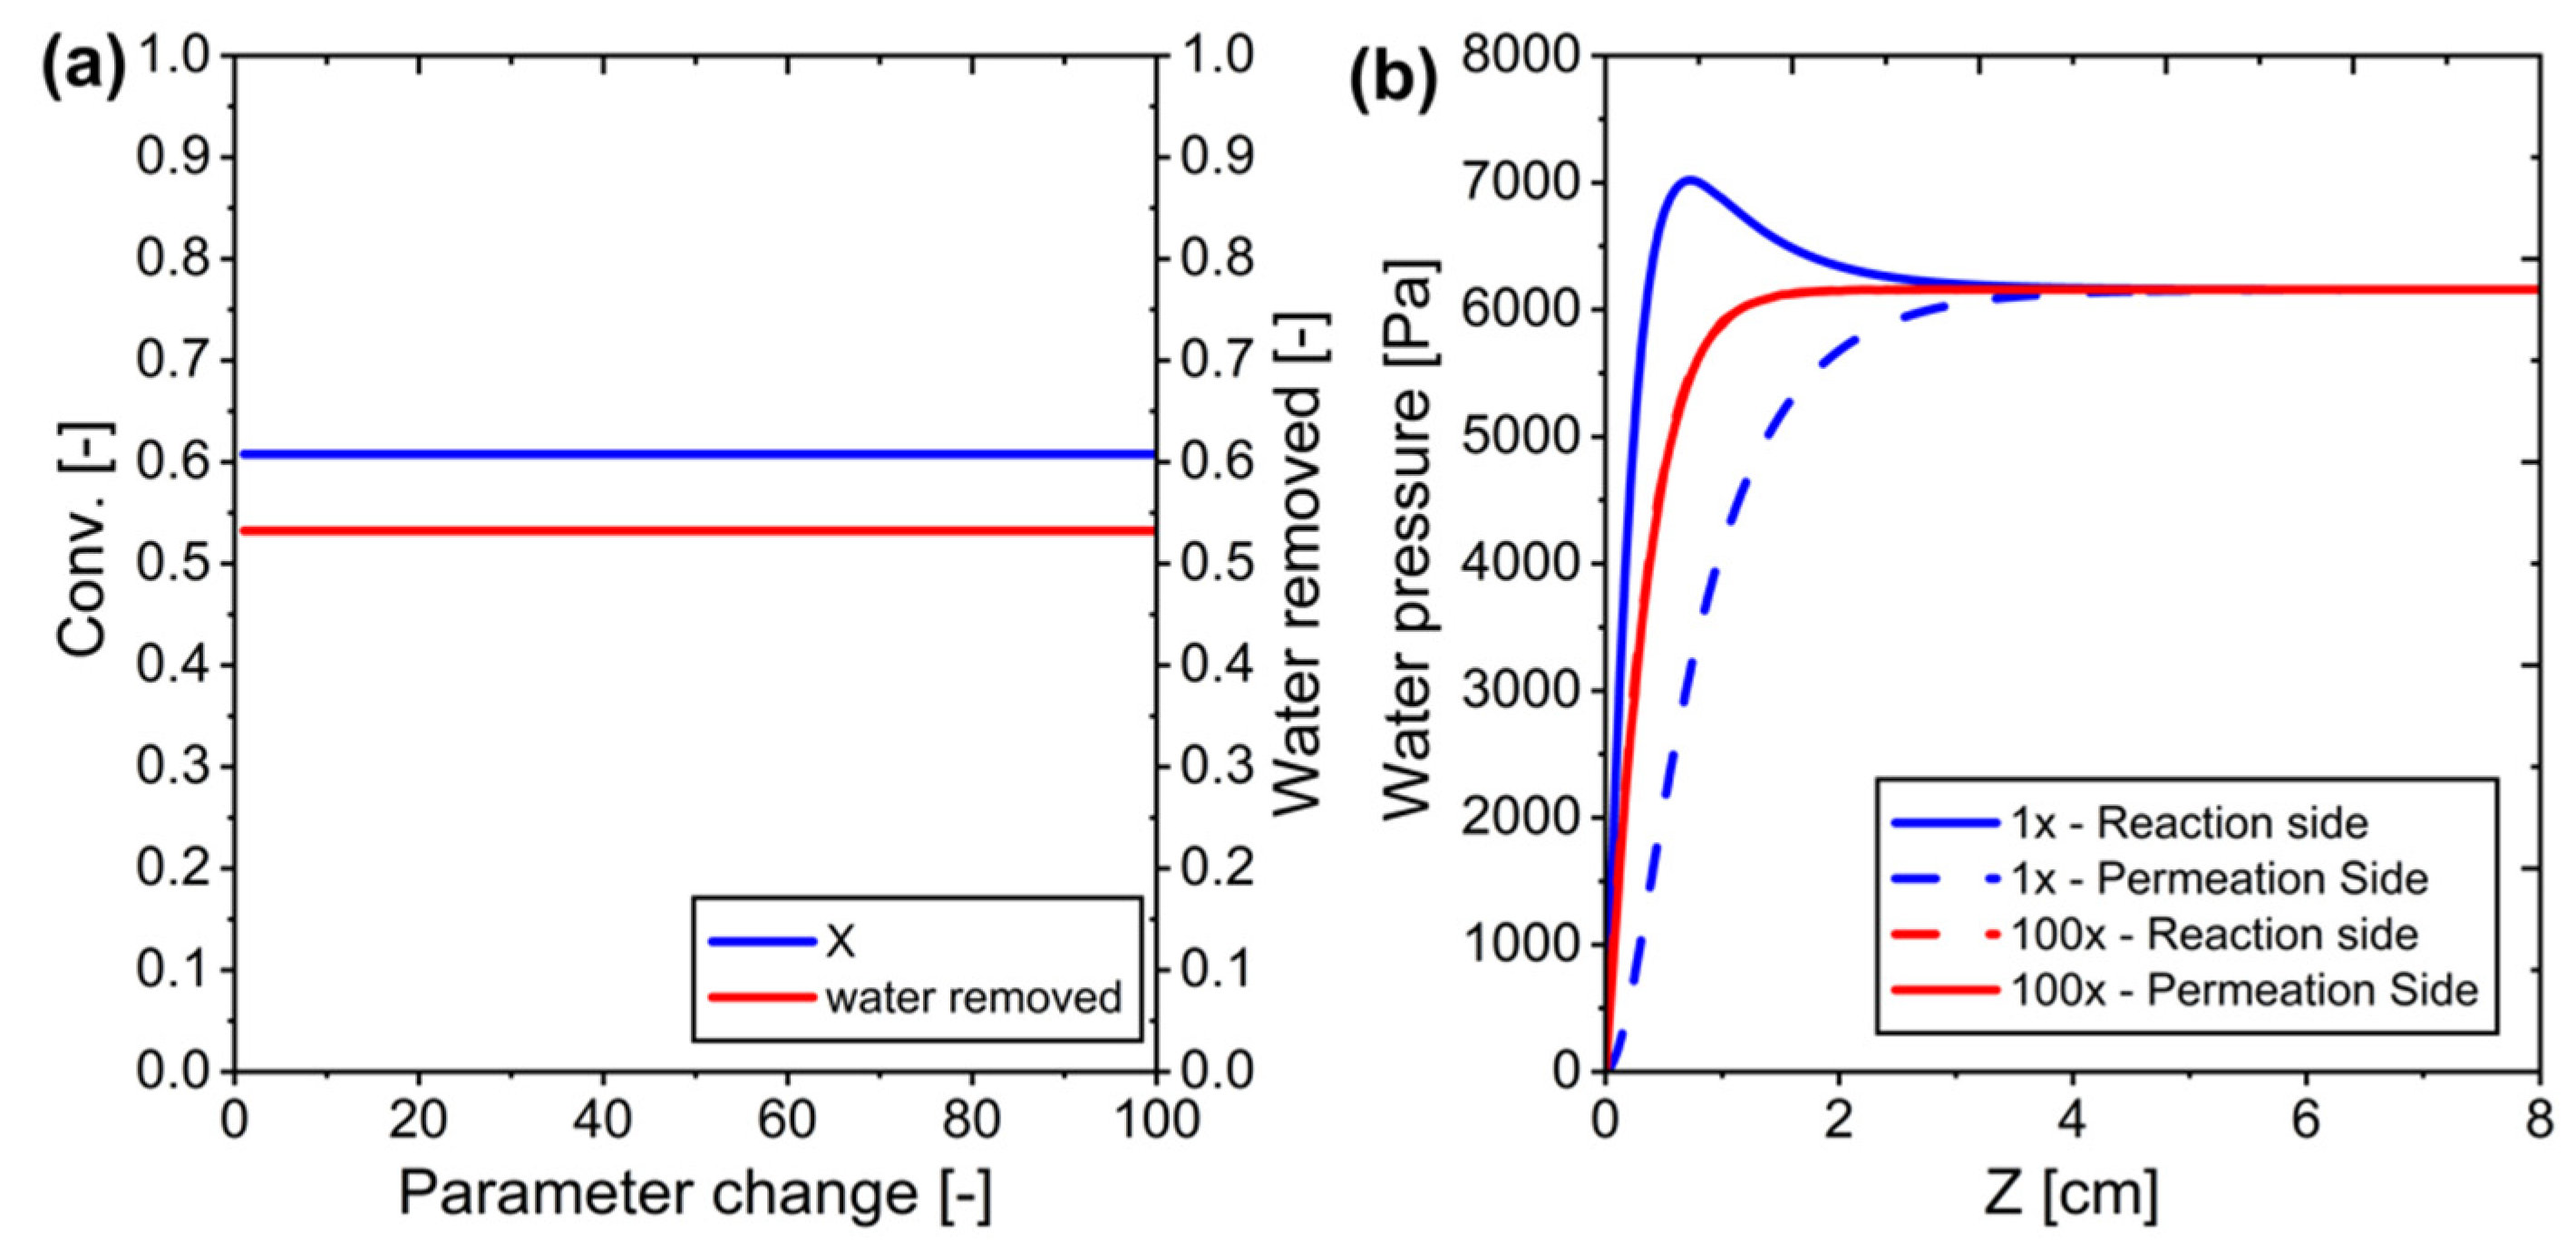
Figure 10.
Modifying water permeance in ideal membrane systems: (a) Conversion versus changes in parameters, and (b) Water pressure across the system for parameter J is equal to 1 and when multiplied by 100.
Figure 10.
Modifying water permeance in ideal membrane systems: (a) Conversion versus changes in parameters, and (b) Water pressure across the system for parameter J is equal to 1 and when multiplied by 100.
Figure 11.
Modifying the permeate side sweep gas flow rate in ideal membrane systems: (a) Conversion as a function of parameter change, (b) Water pressure profile as a function of parameter change, and (c) Water pressure profile on the reaction and permeation sides along the system for parameter changes of 1×, 5×, 10×, and 100×.
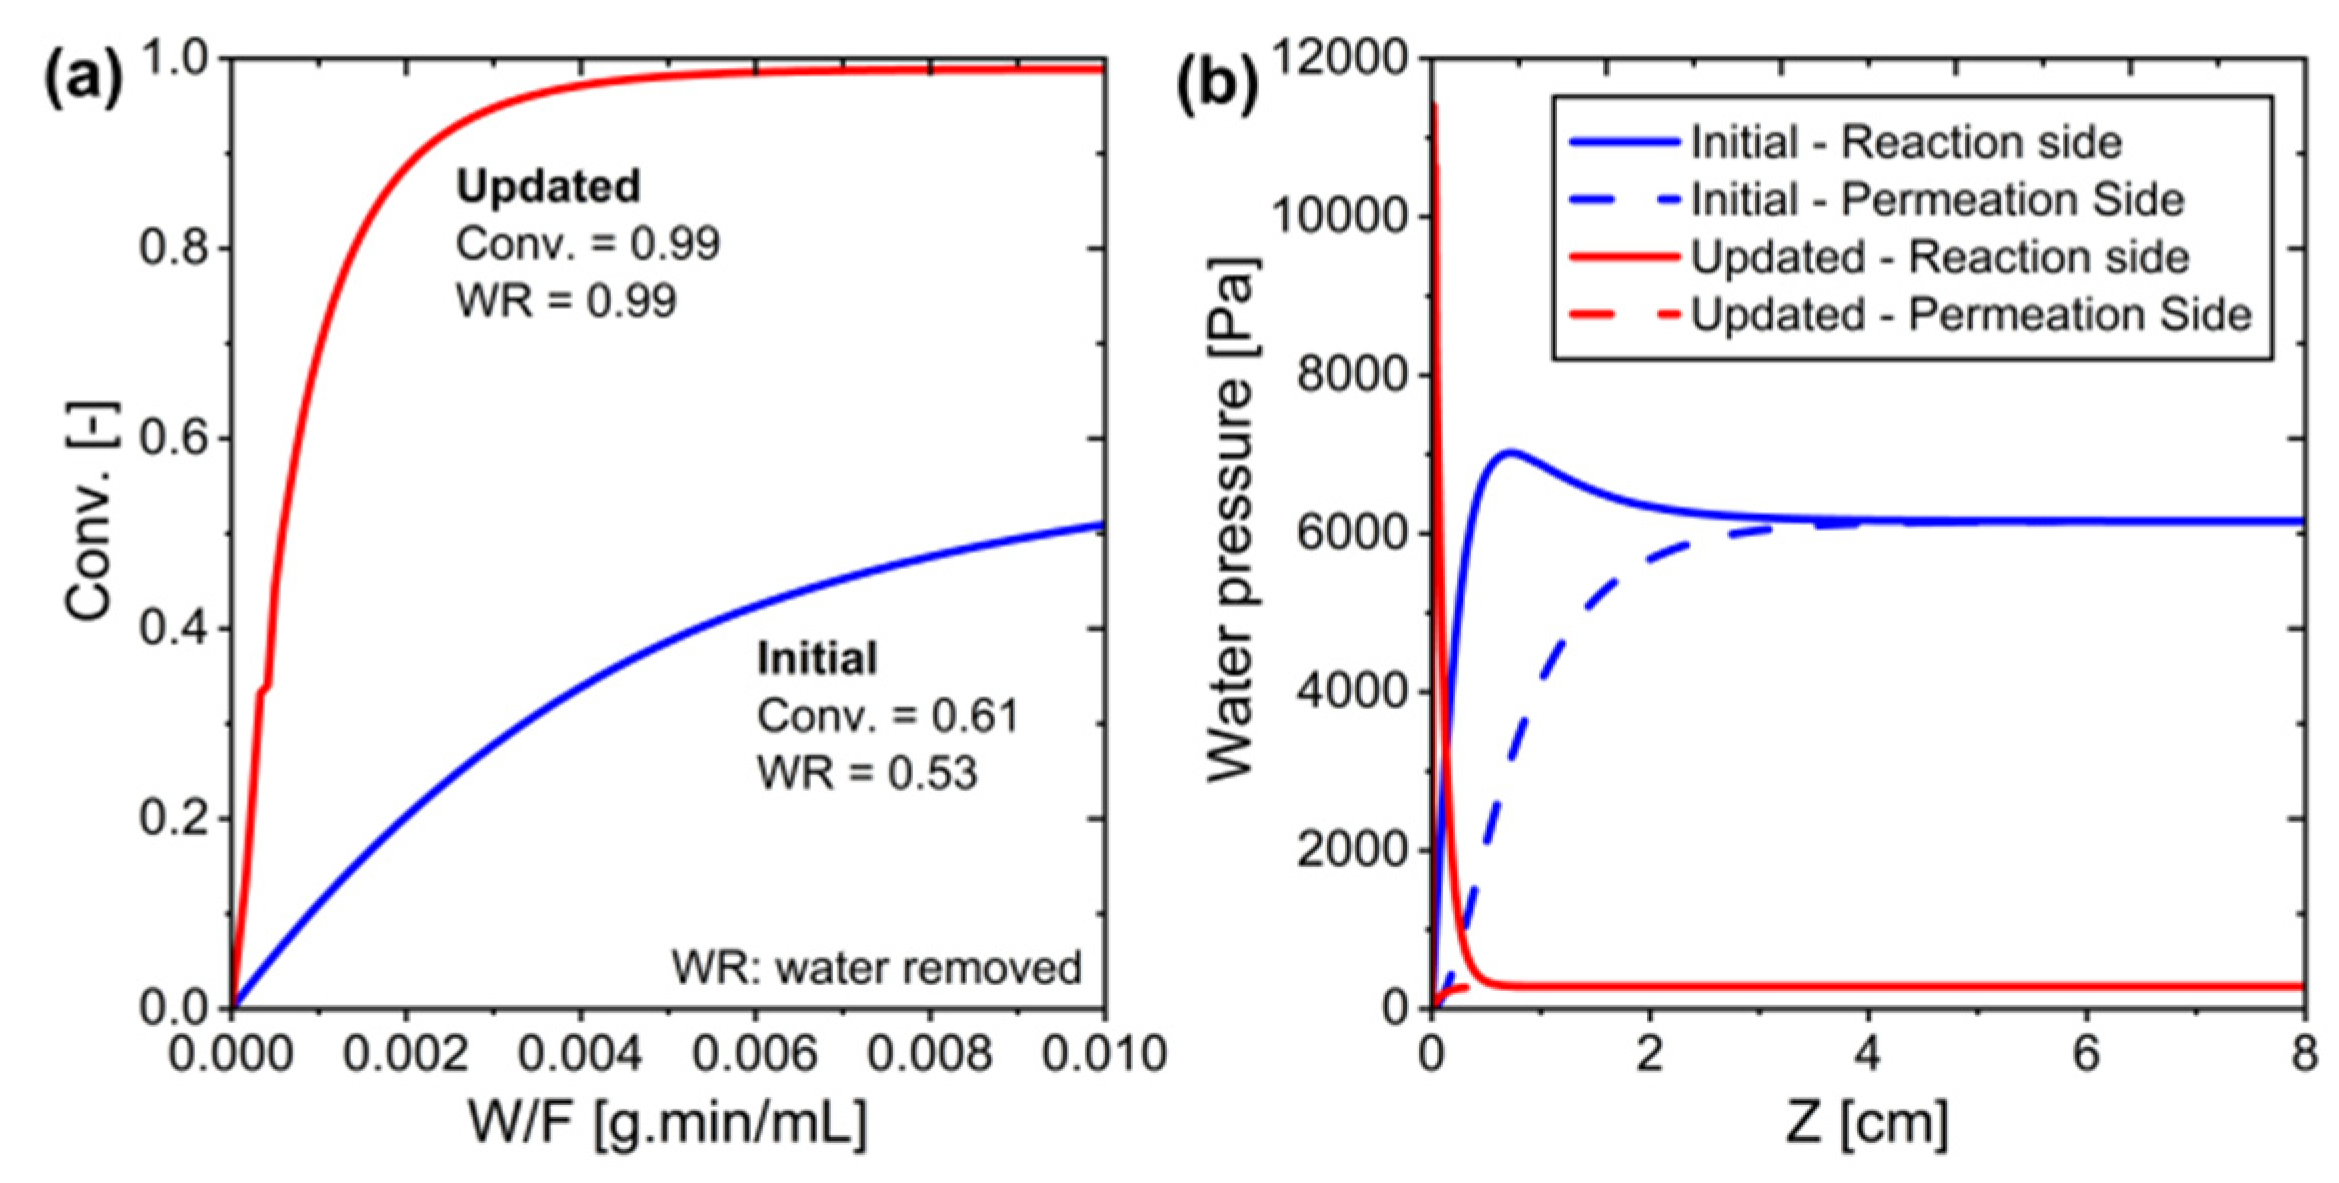
Figure 12.
The initial and updated conditions in the MPBR ideal membrane system: (a) Conversion versus W/F, and (b) Water pressure along the system.
Figure 12.
The initial and updated conditions in the MPBR ideal membrane system: (a) Conversion versus W/F, and (b) Water pressure along the system.
Figure 13.
Comparison of gas composition at the outlet (experimental vs. simulation) at various temperatures: (a) 515 K, (b) 539 K, (c) 560 K, (d) 585 K, and (e) 609 K.
Figure 13.
Comparison of gas composition at the outlet (experimental vs. simulation) at various temperatures: (a) 515 K, (b) 539 K, (c) 560 K, (d) 585 K, and (e) 609 K.
Figure 14.
Comparison of simulation and experimental results at different temperatures.
Figure 14.
Comparison of simulation and experimental results at different temperatures.
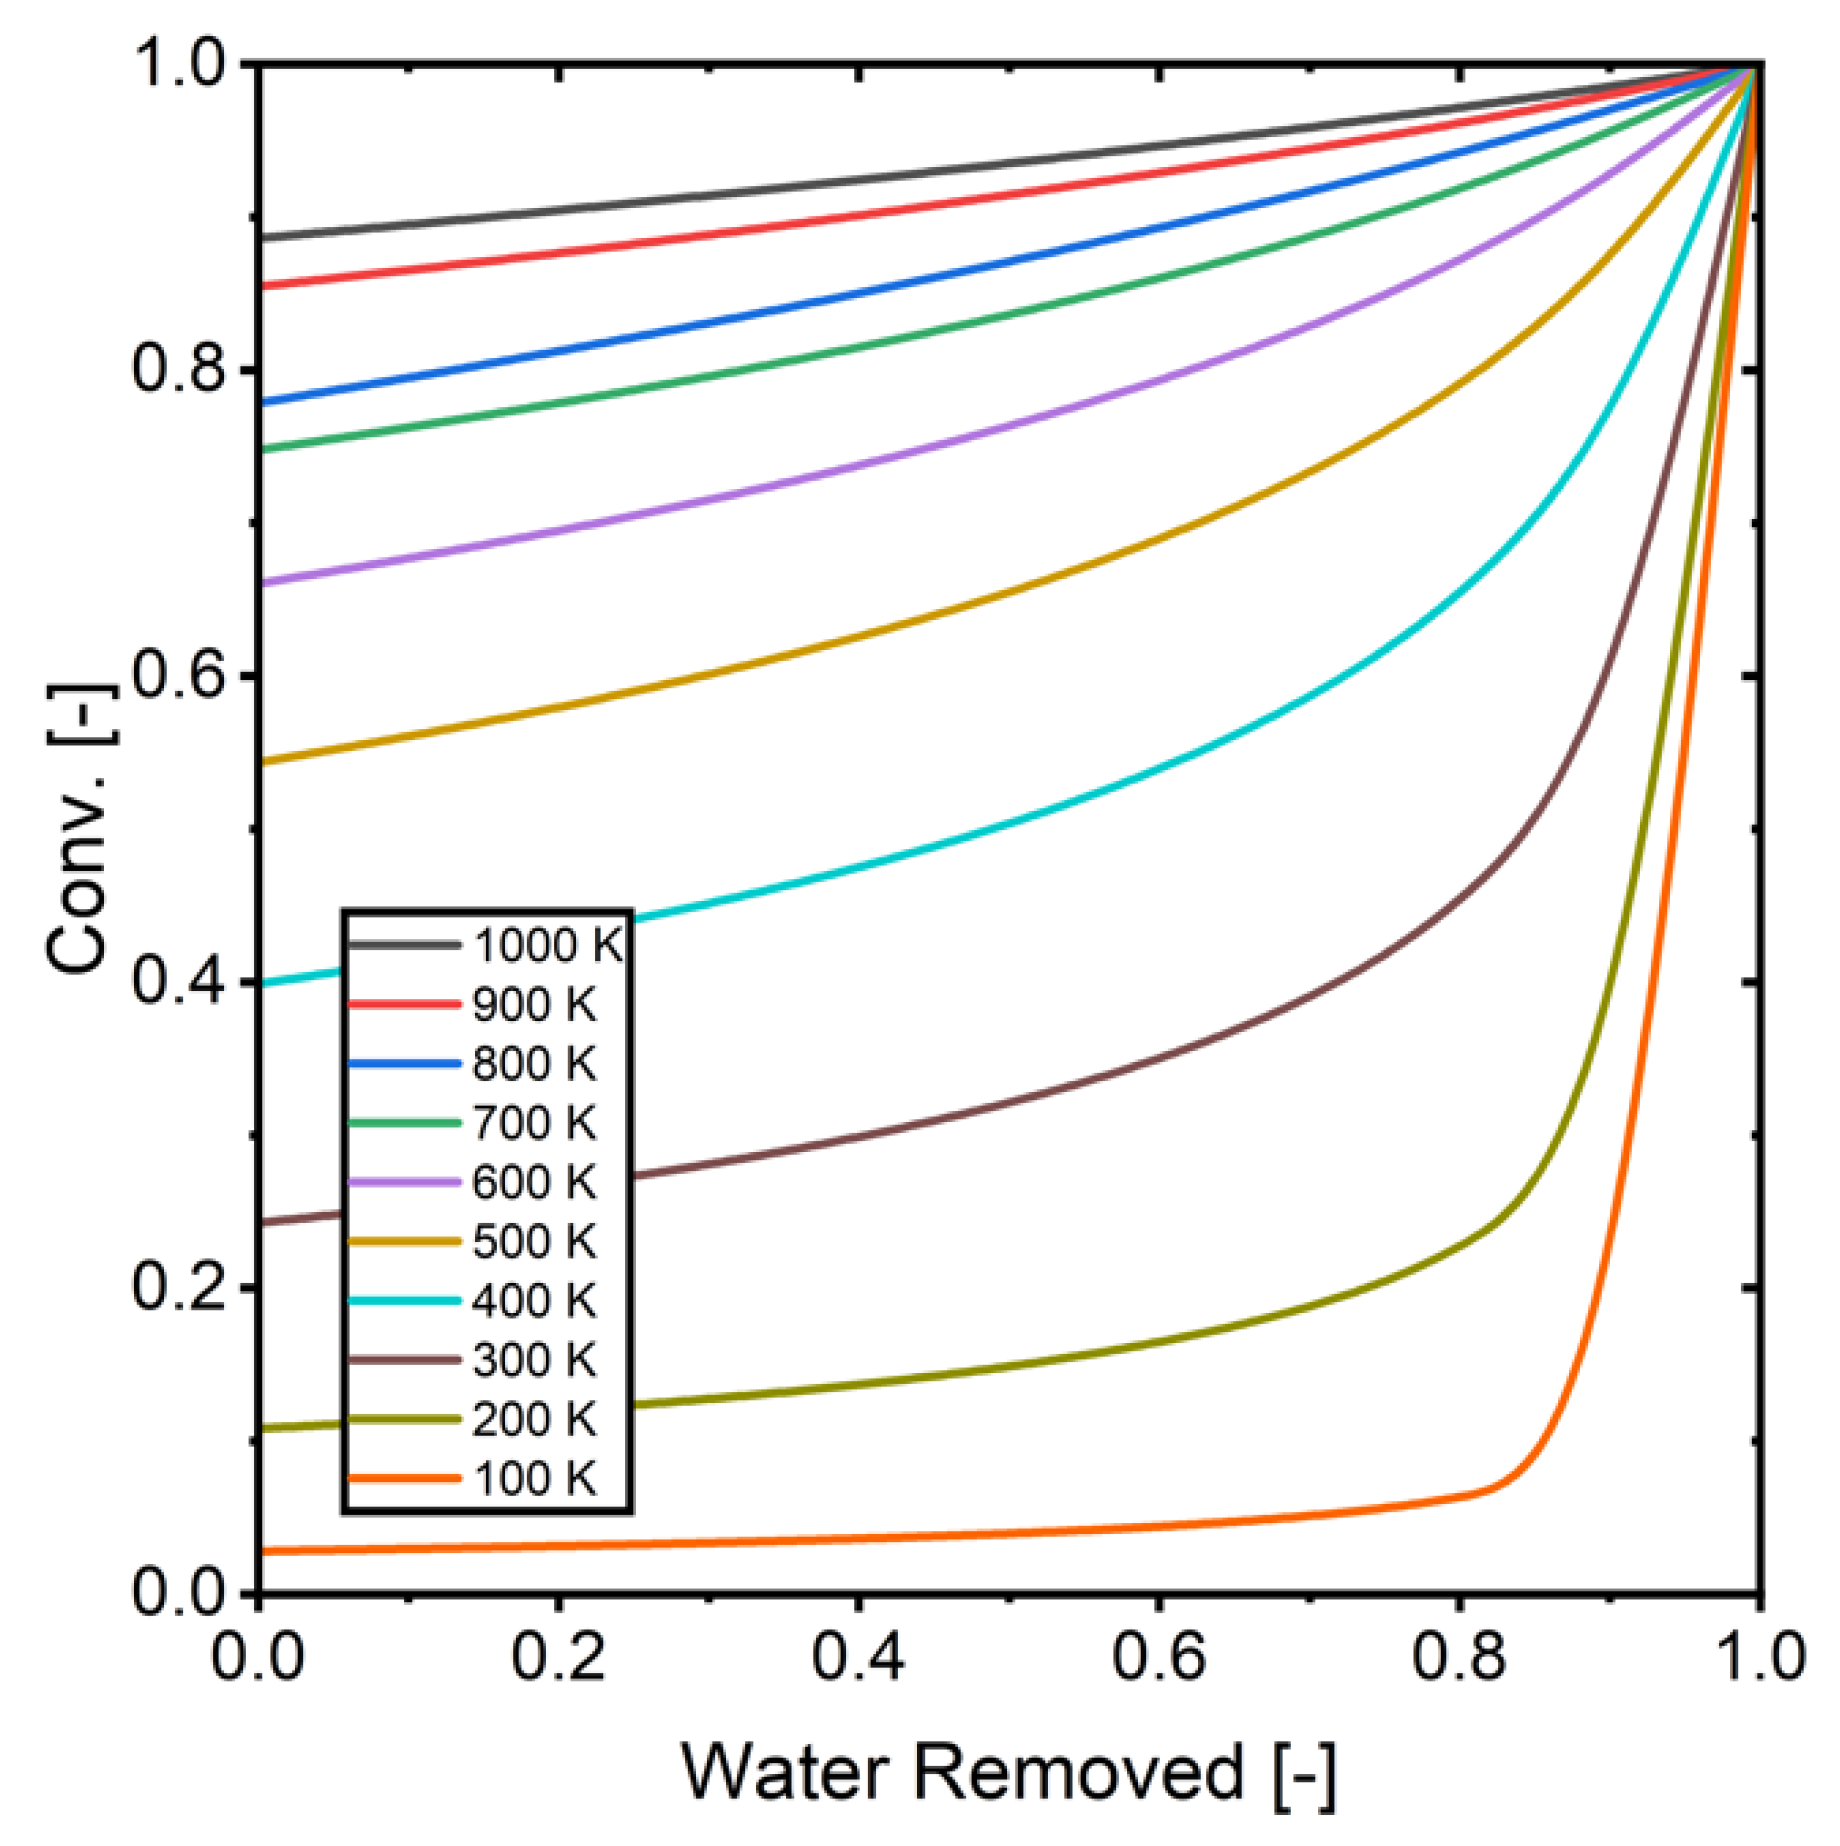
Figure 15.
The relationship between removed water and conversion (H2/CO2 = 3).
Figure 15.
The relationship between removed water and conversion (H2/CO2 = 3).
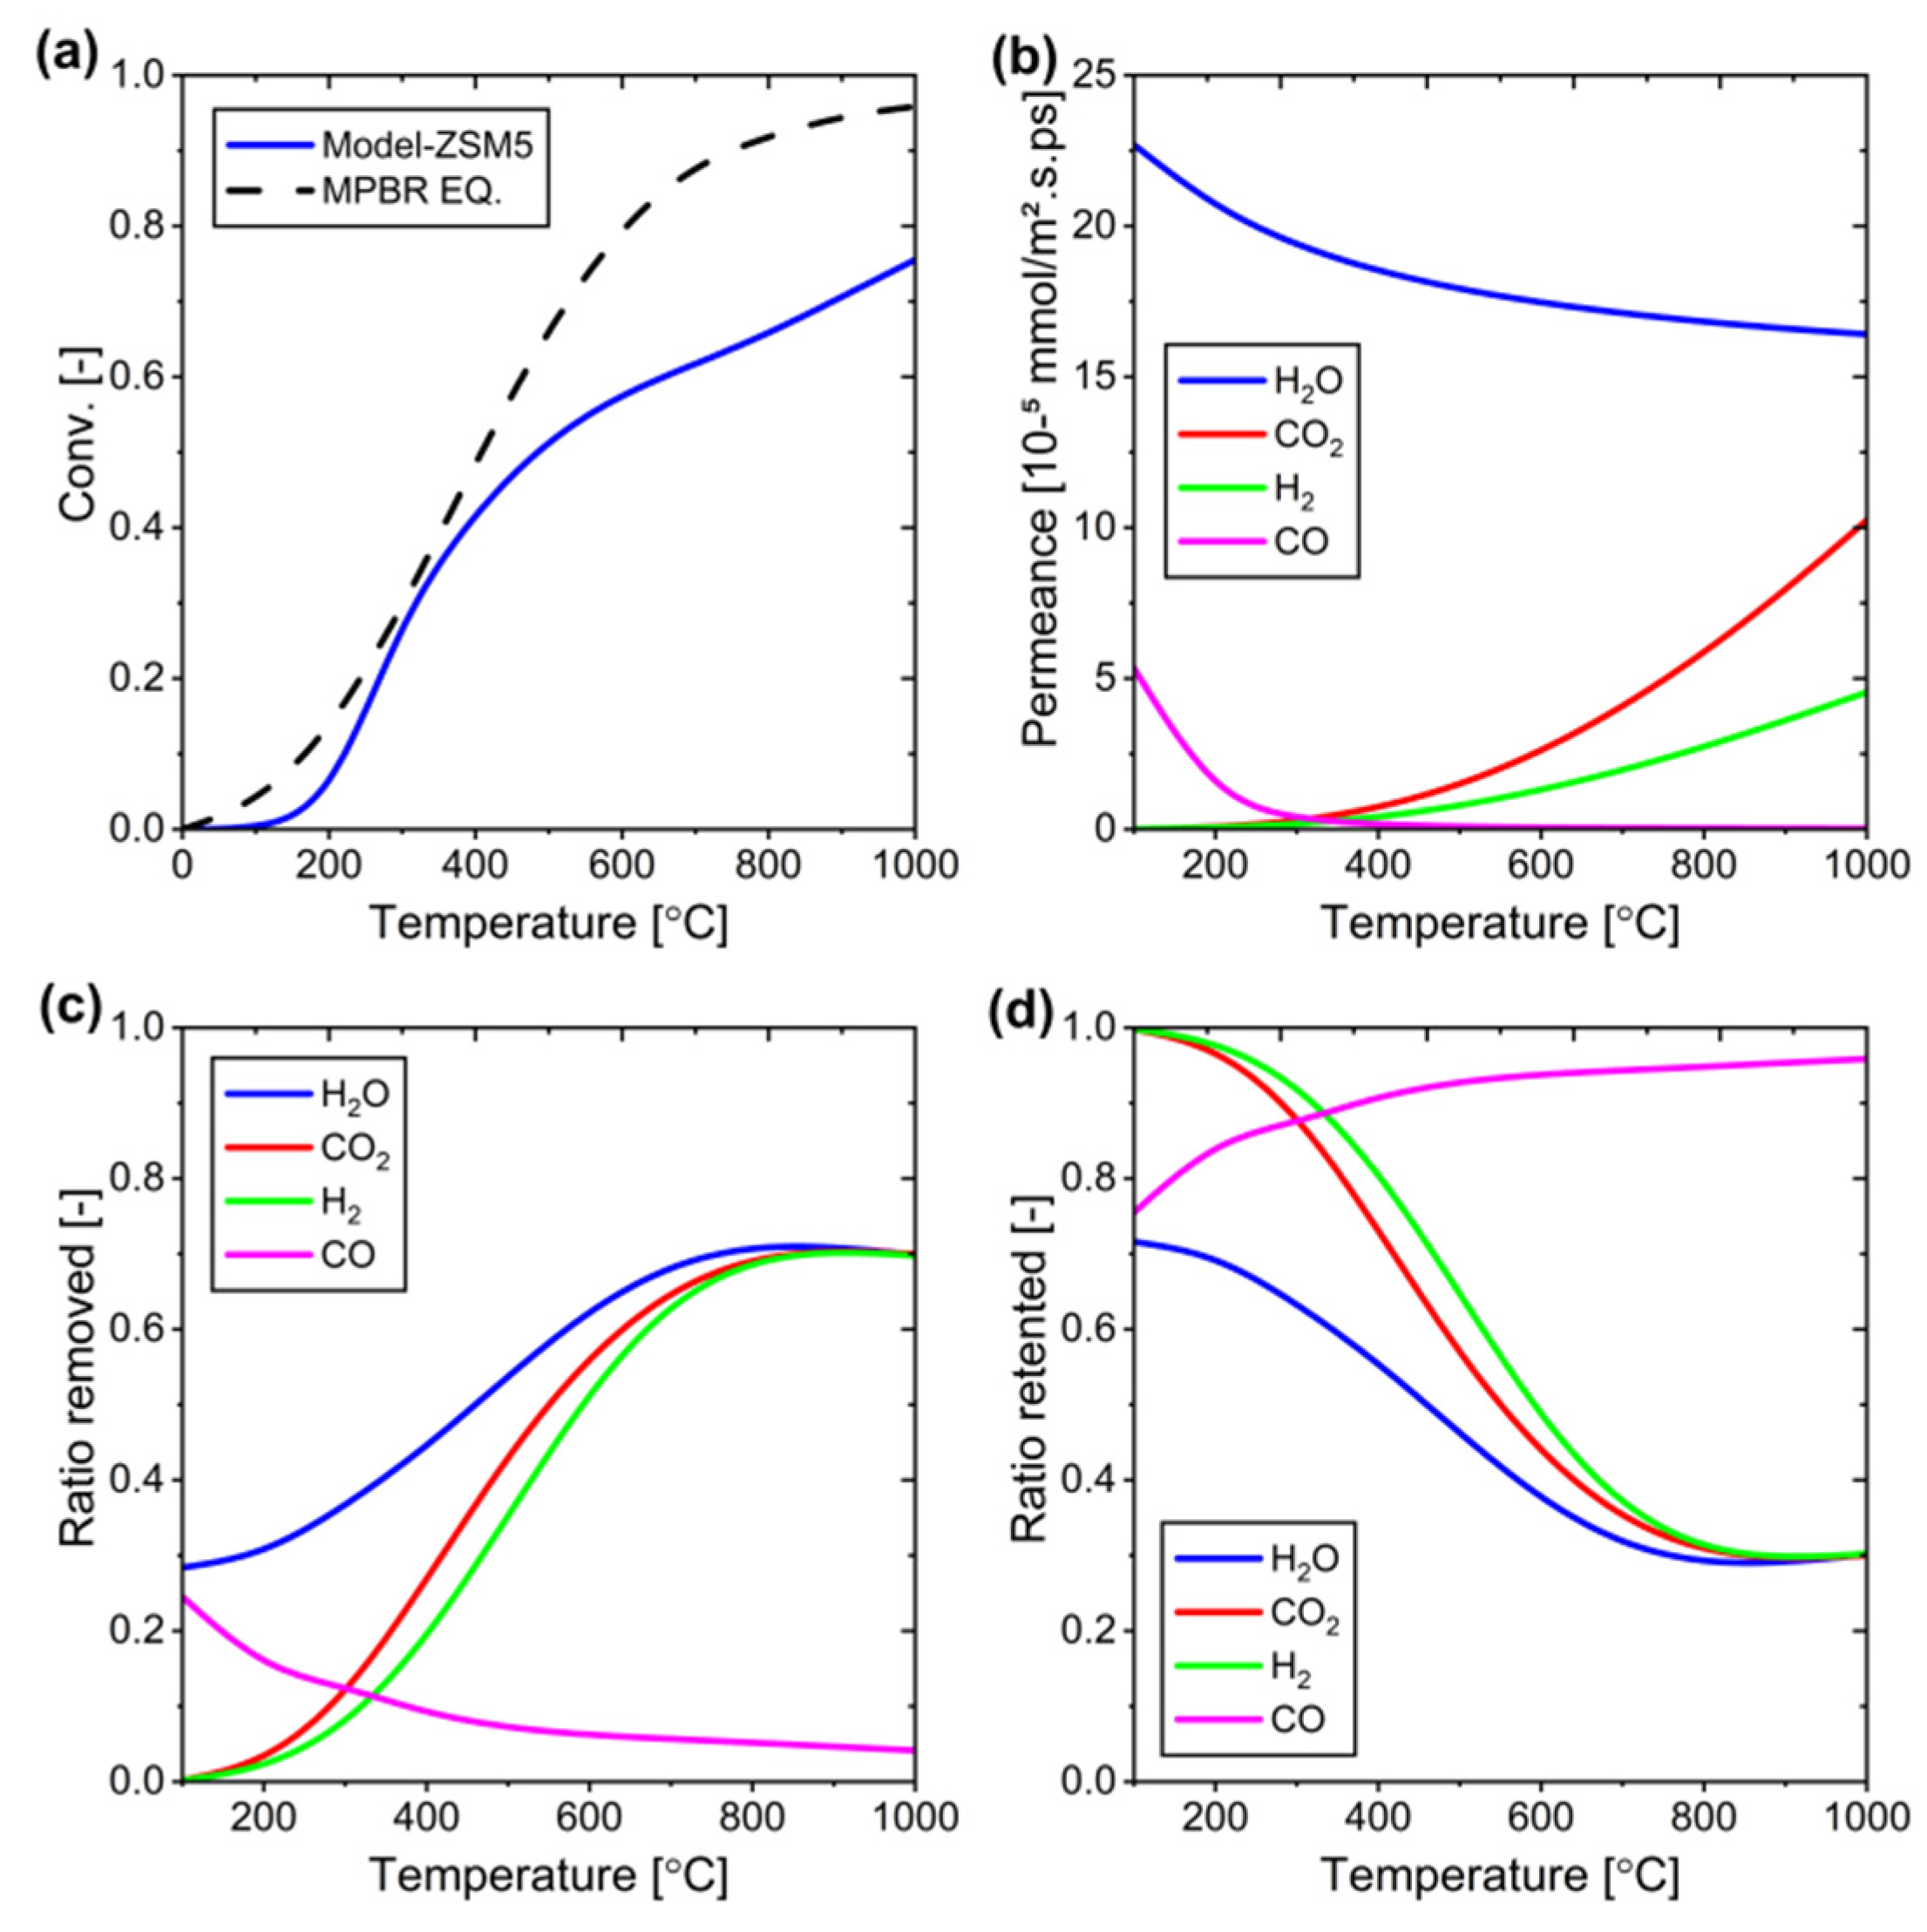
Figure 16.
Performance of the ZSM-5 membrane at different temperatures: (a) Conversion versus temperature, (b) Changes in permeance of each component versus temperature, (c) Component removal (permeation) ratio at different temperatures, and (d) Component retention ratio at different temperatures.
Figure 16.
Performance of the ZSM-5 membrane at different temperatures: (a) Conversion versus temperature, (b) Changes in permeance of each component versus temperature, (c) Component removal (permeation) ratio at different temperatures, and (d) Component retention ratio at different temperatures.
Figure 17.
Performance comparison between ZSM-5 membrane and ideal membrane at different temperatures: (a) conversion as a function of temperature, (b) water rejection as a function of temperature.
Figure 17.
Performance comparison between ZSM-5 membrane and ideal membrane at different temperatures: (a) conversion as a function of temperature, (b) water rejection as a function of temperature.
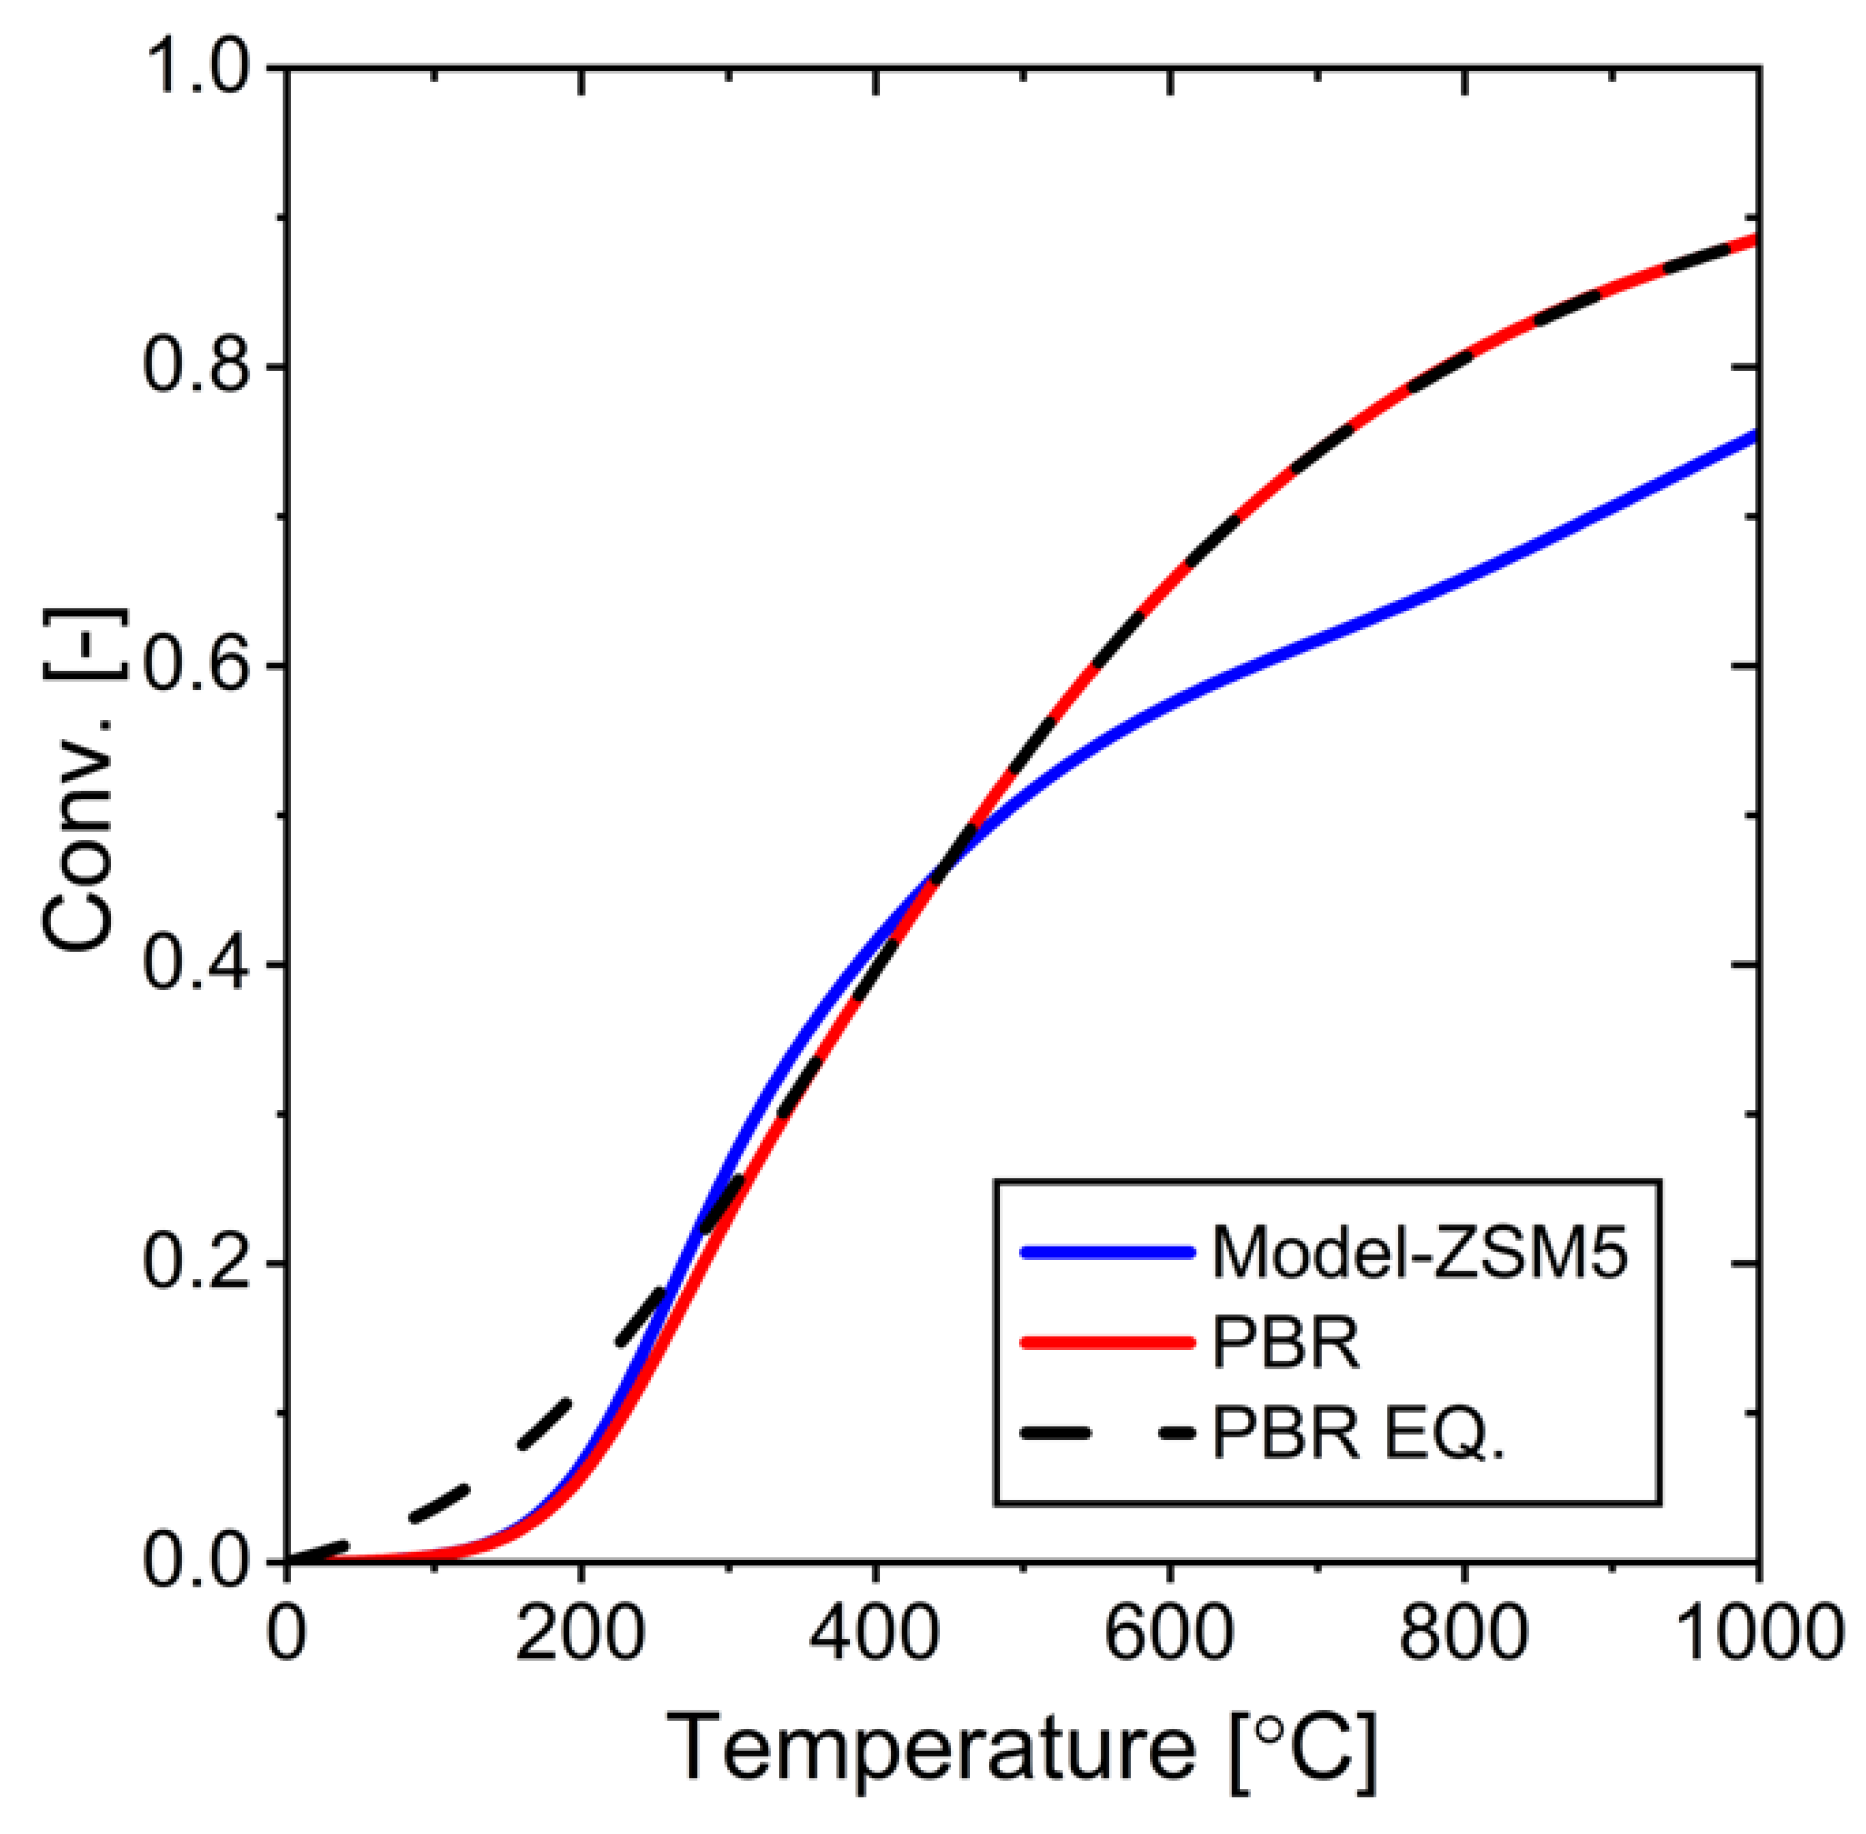
Figure 18.
Performance comparison of PBR vs. MPBR at different temperatures.
Figure 18.
Performance comparison of PBR vs. MPBR at different temperatures.
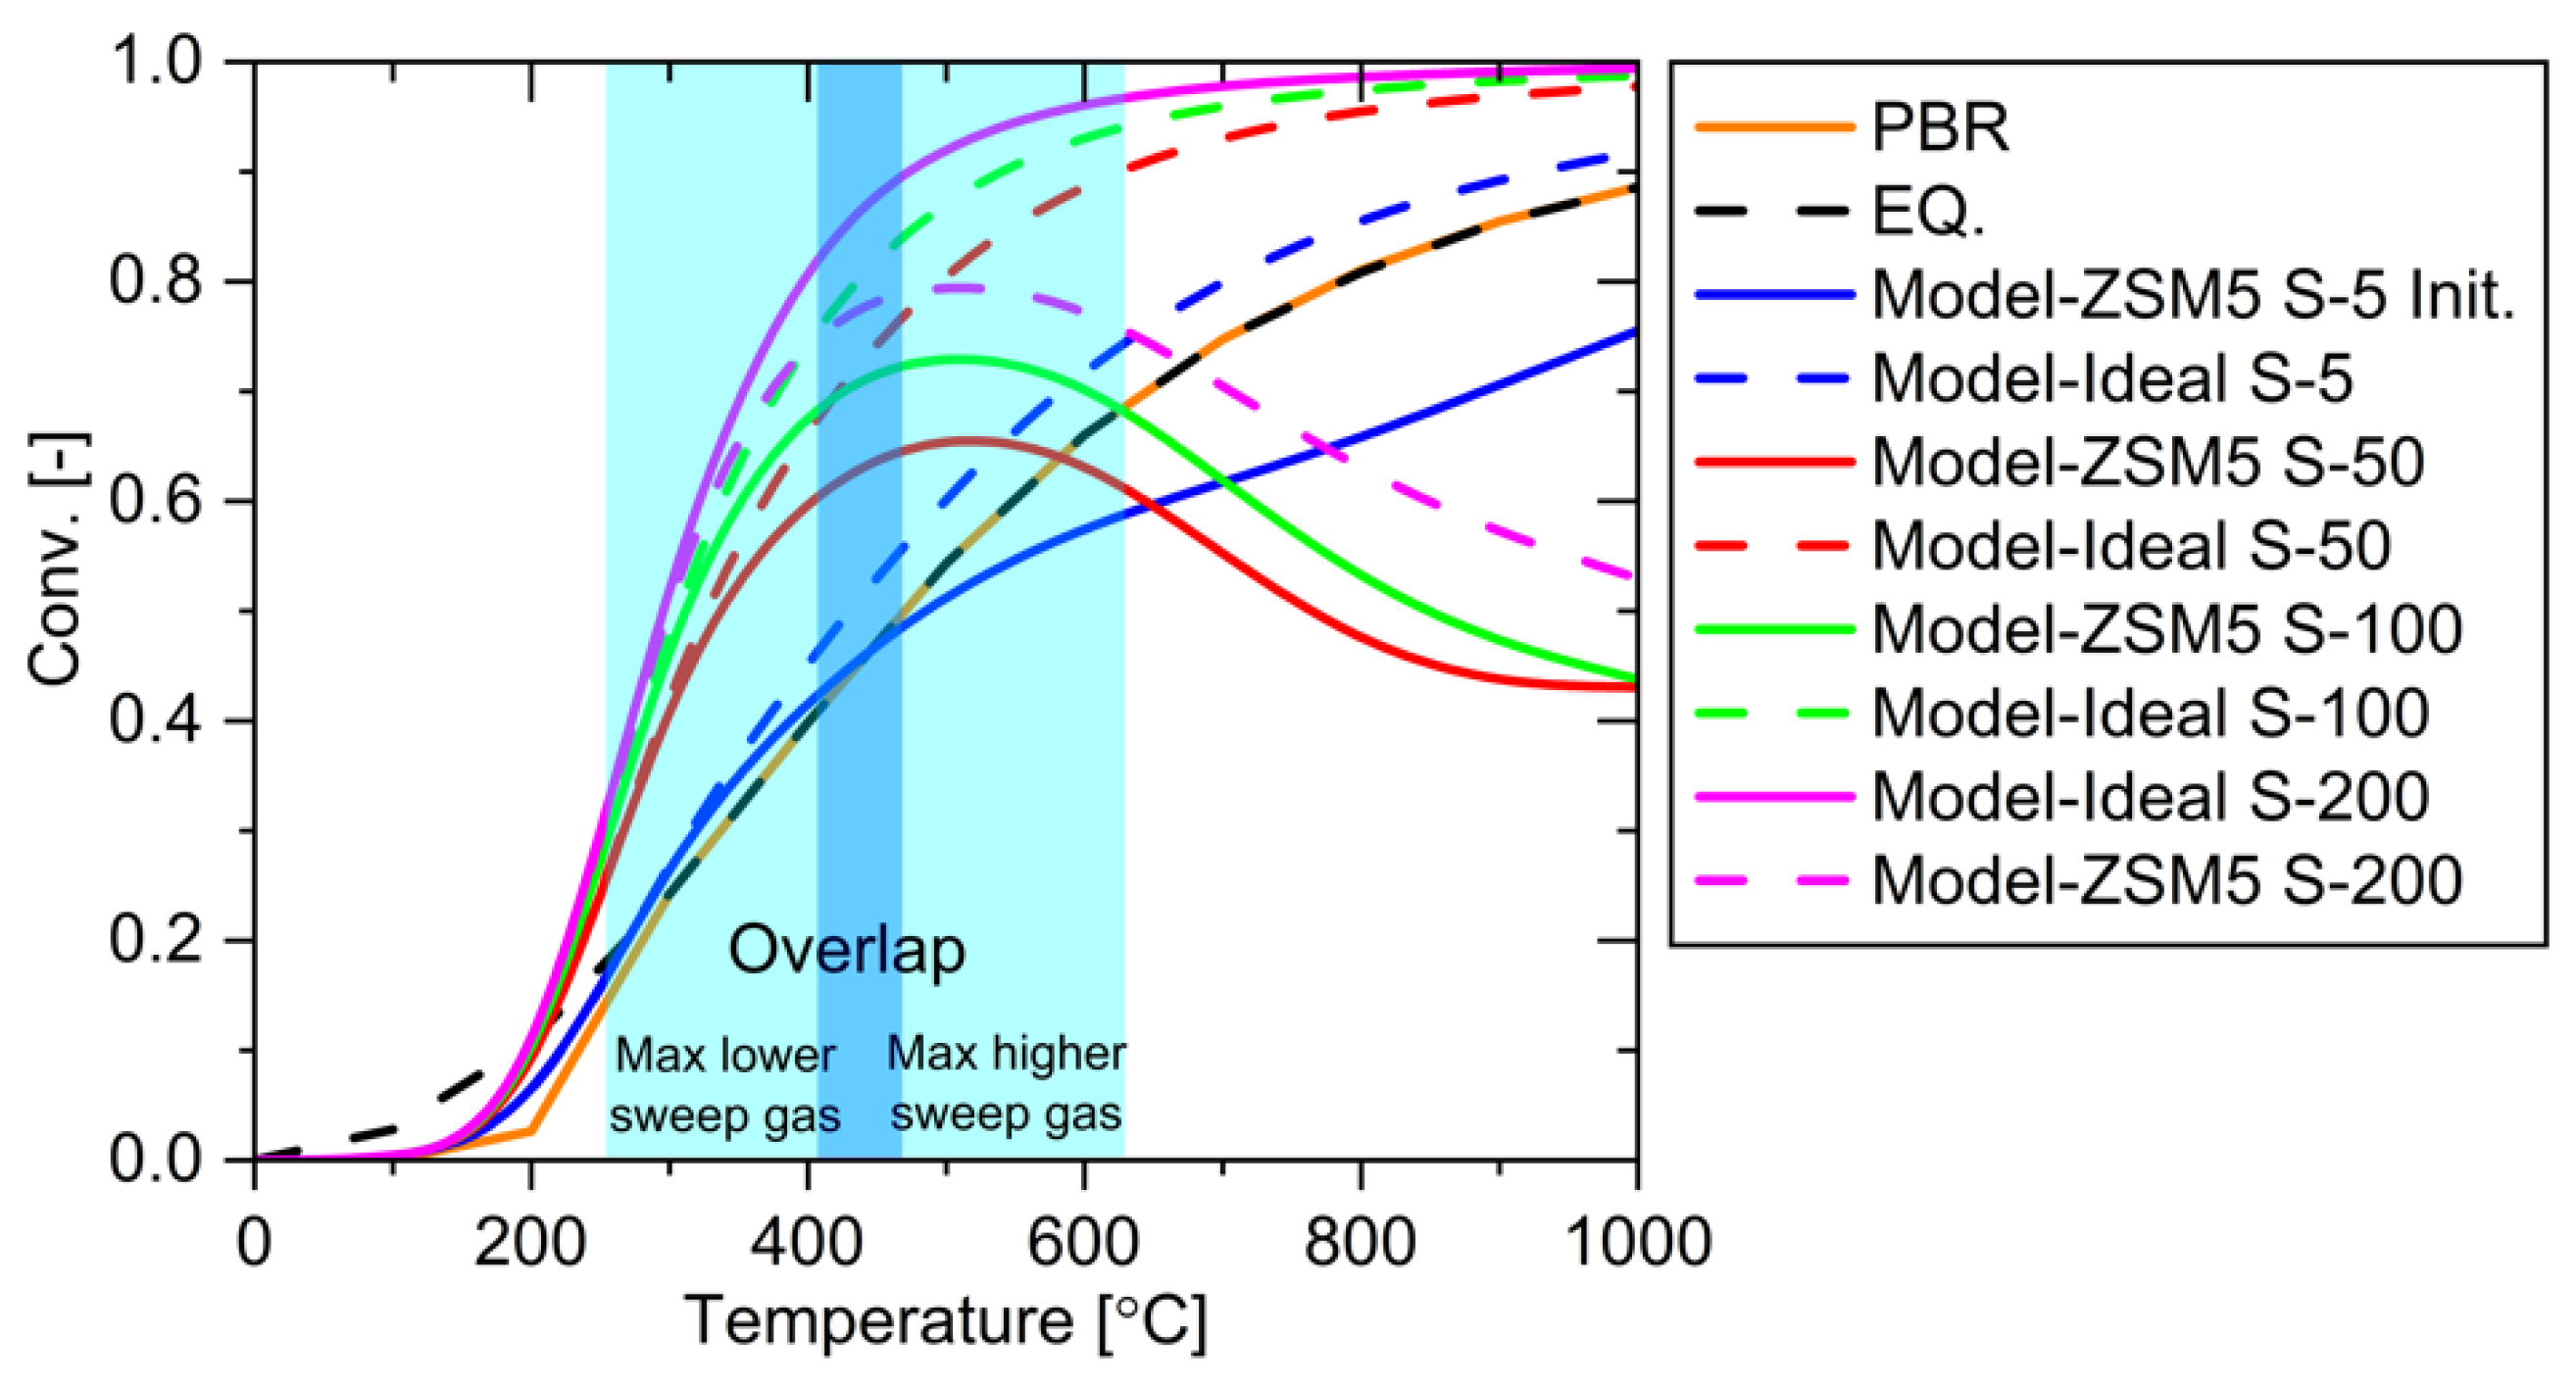
Figure 19.
System performance using various temperatures and sweep gases.
Figure 19.
System performance using various temperatures and sweep gases.
Figure 20.
(a) Influence of deactivating components on the ZSM-5 System, (b) Impact of varying feed gas flow rates on conversion, and (c) Effect of H2O permeance on conversion efficiency.
Figure 20.
(a) Influence of deactivating components on the ZSM-5 System, (b) Impact of varying feed gas flow rates on conversion, and (c) Effect of H2O permeance on conversion efficiency.
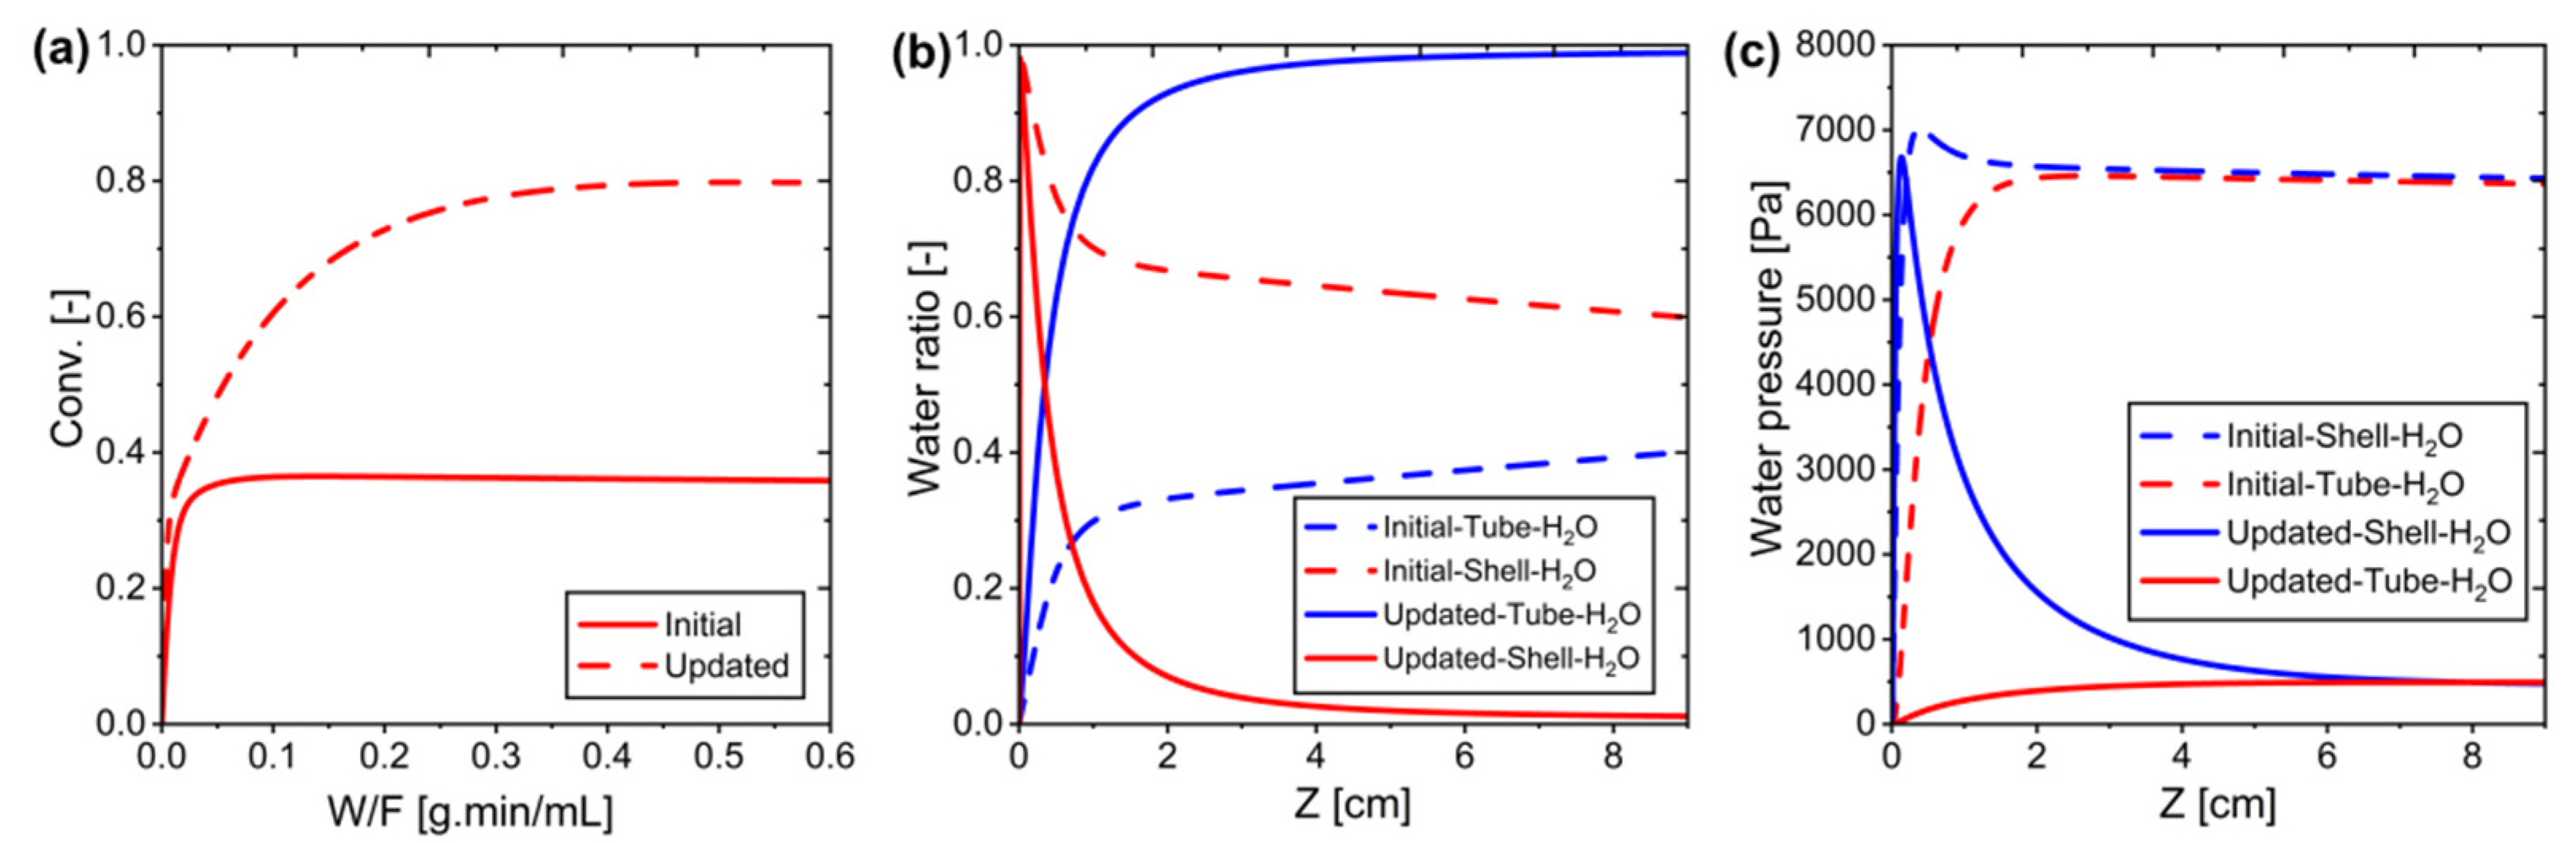
Figure 21.
Comparison of initial and updated systems: (a) Conversion vs. W/F, (b) Water ratio on the tube side and shell side along the system, and (c) Water pressure along the system.
Figure 21.
Comparison of initial and updated systems: (a) Conversion vs. W/F, (b) Water ratio on the tube side and shell side along the system, and (c) Water pressure along the system.
Figure 22.
Separation factors: MPBR vs. binary mixture: (a) H2O versus CO2, and (b) H2O versus H2.
Figure 22.
Separation factors: MPBR vs. binary mixture: (a) H2O versus CO2, and (b) H2O versus H2.
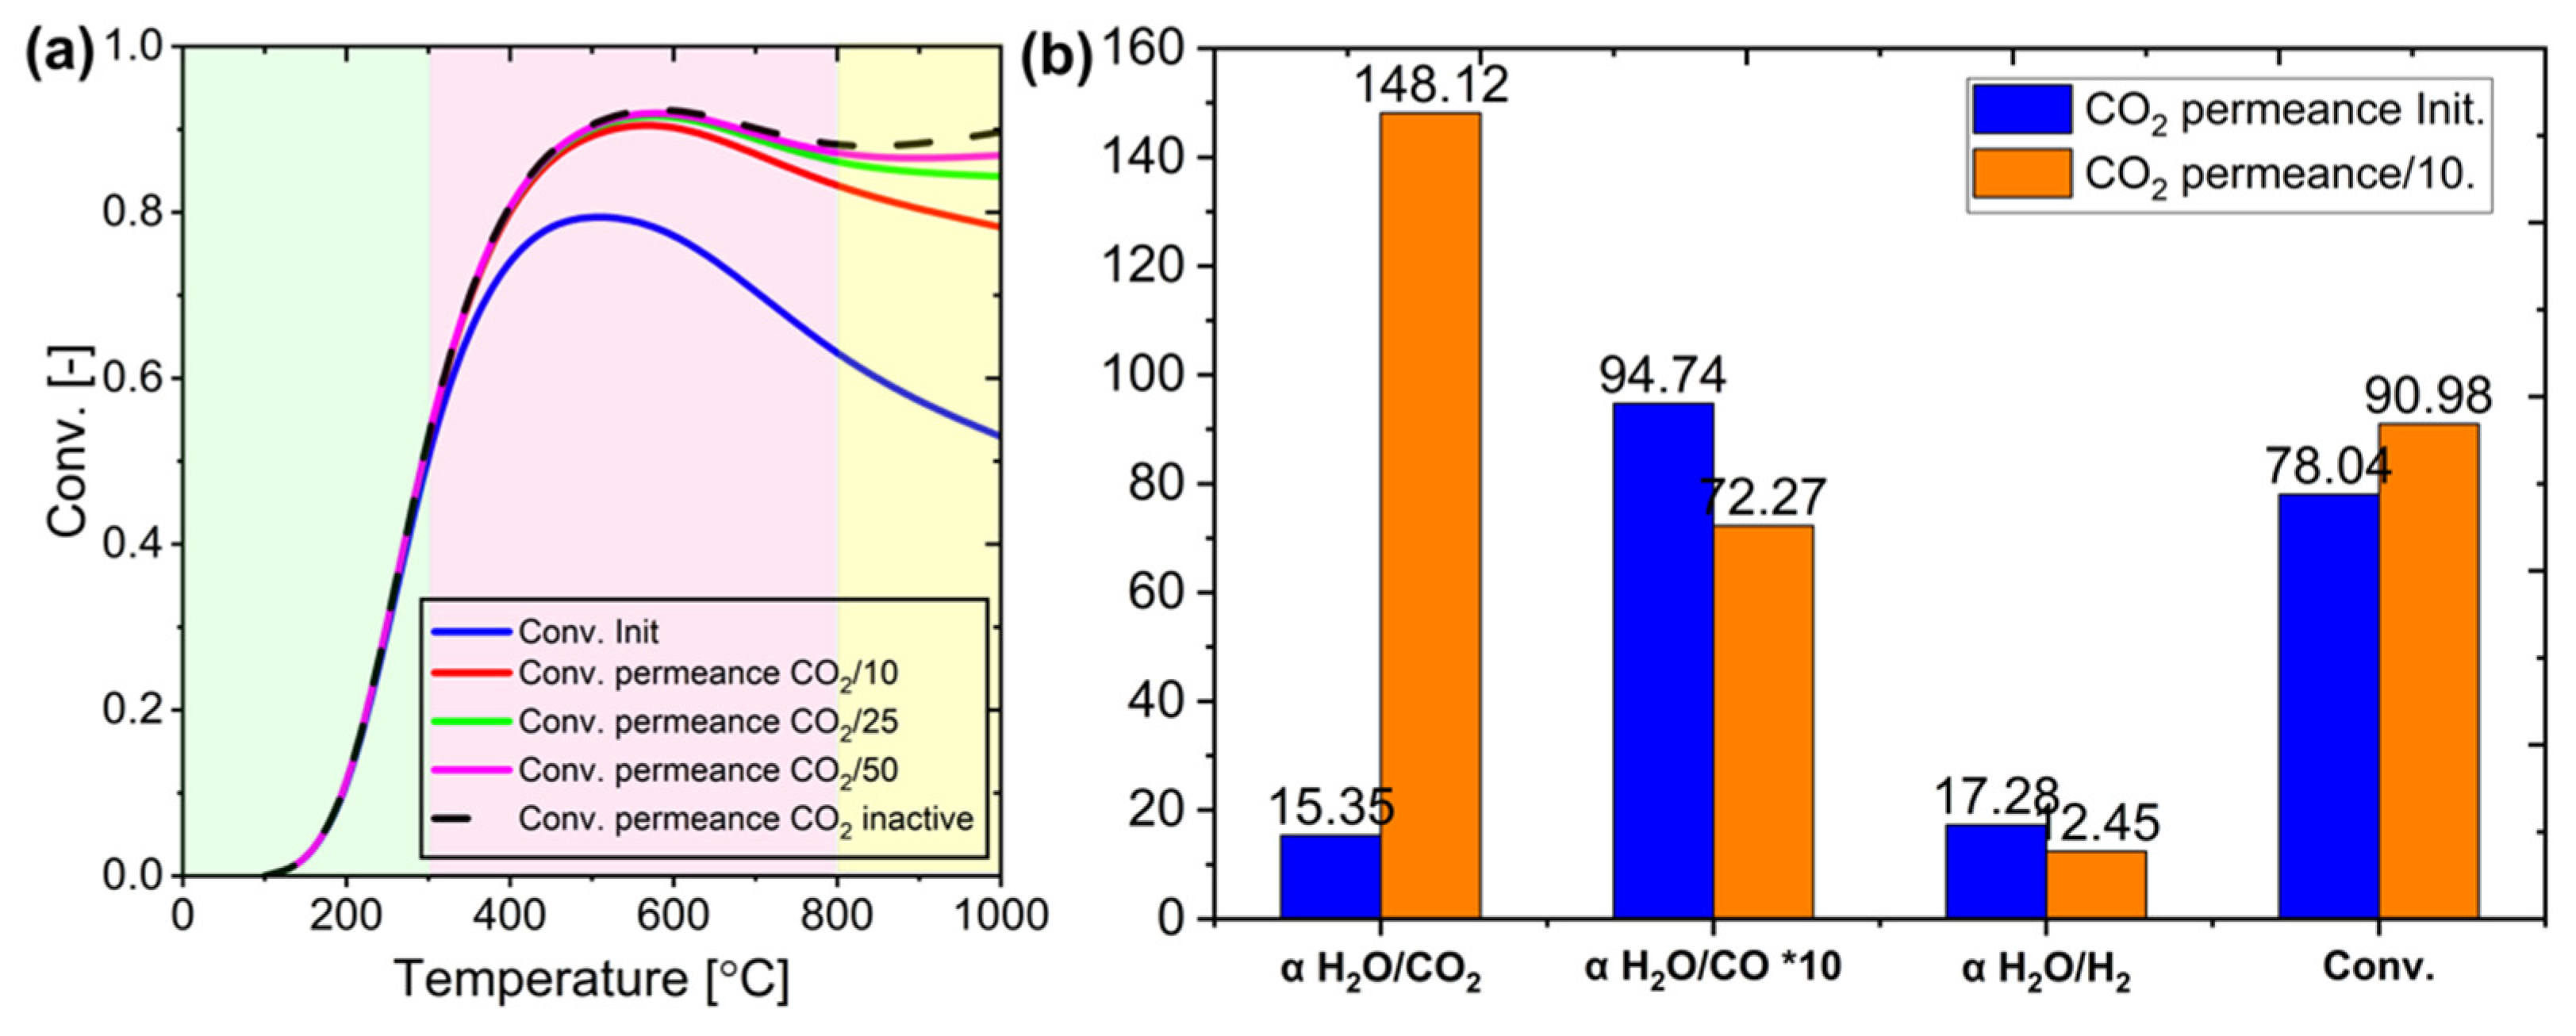
Figure 23.
(a) Impact of membrane CO2 permeance change on conversion at various temperatures, and (b) binary mixture separation factor at 600 °C under initial conditions (Init.) and when the membrane retains CO2 at 1/10 of its initial permeance.
Figure 23.
(a) Impact of membrane CO2 permeance change on conversion at various temperatures, and (b) binary mixture separation factor at 600 °C under initial conditions (Init.) and when the membrane retains CO2 at 1/10 of its initial permeance.
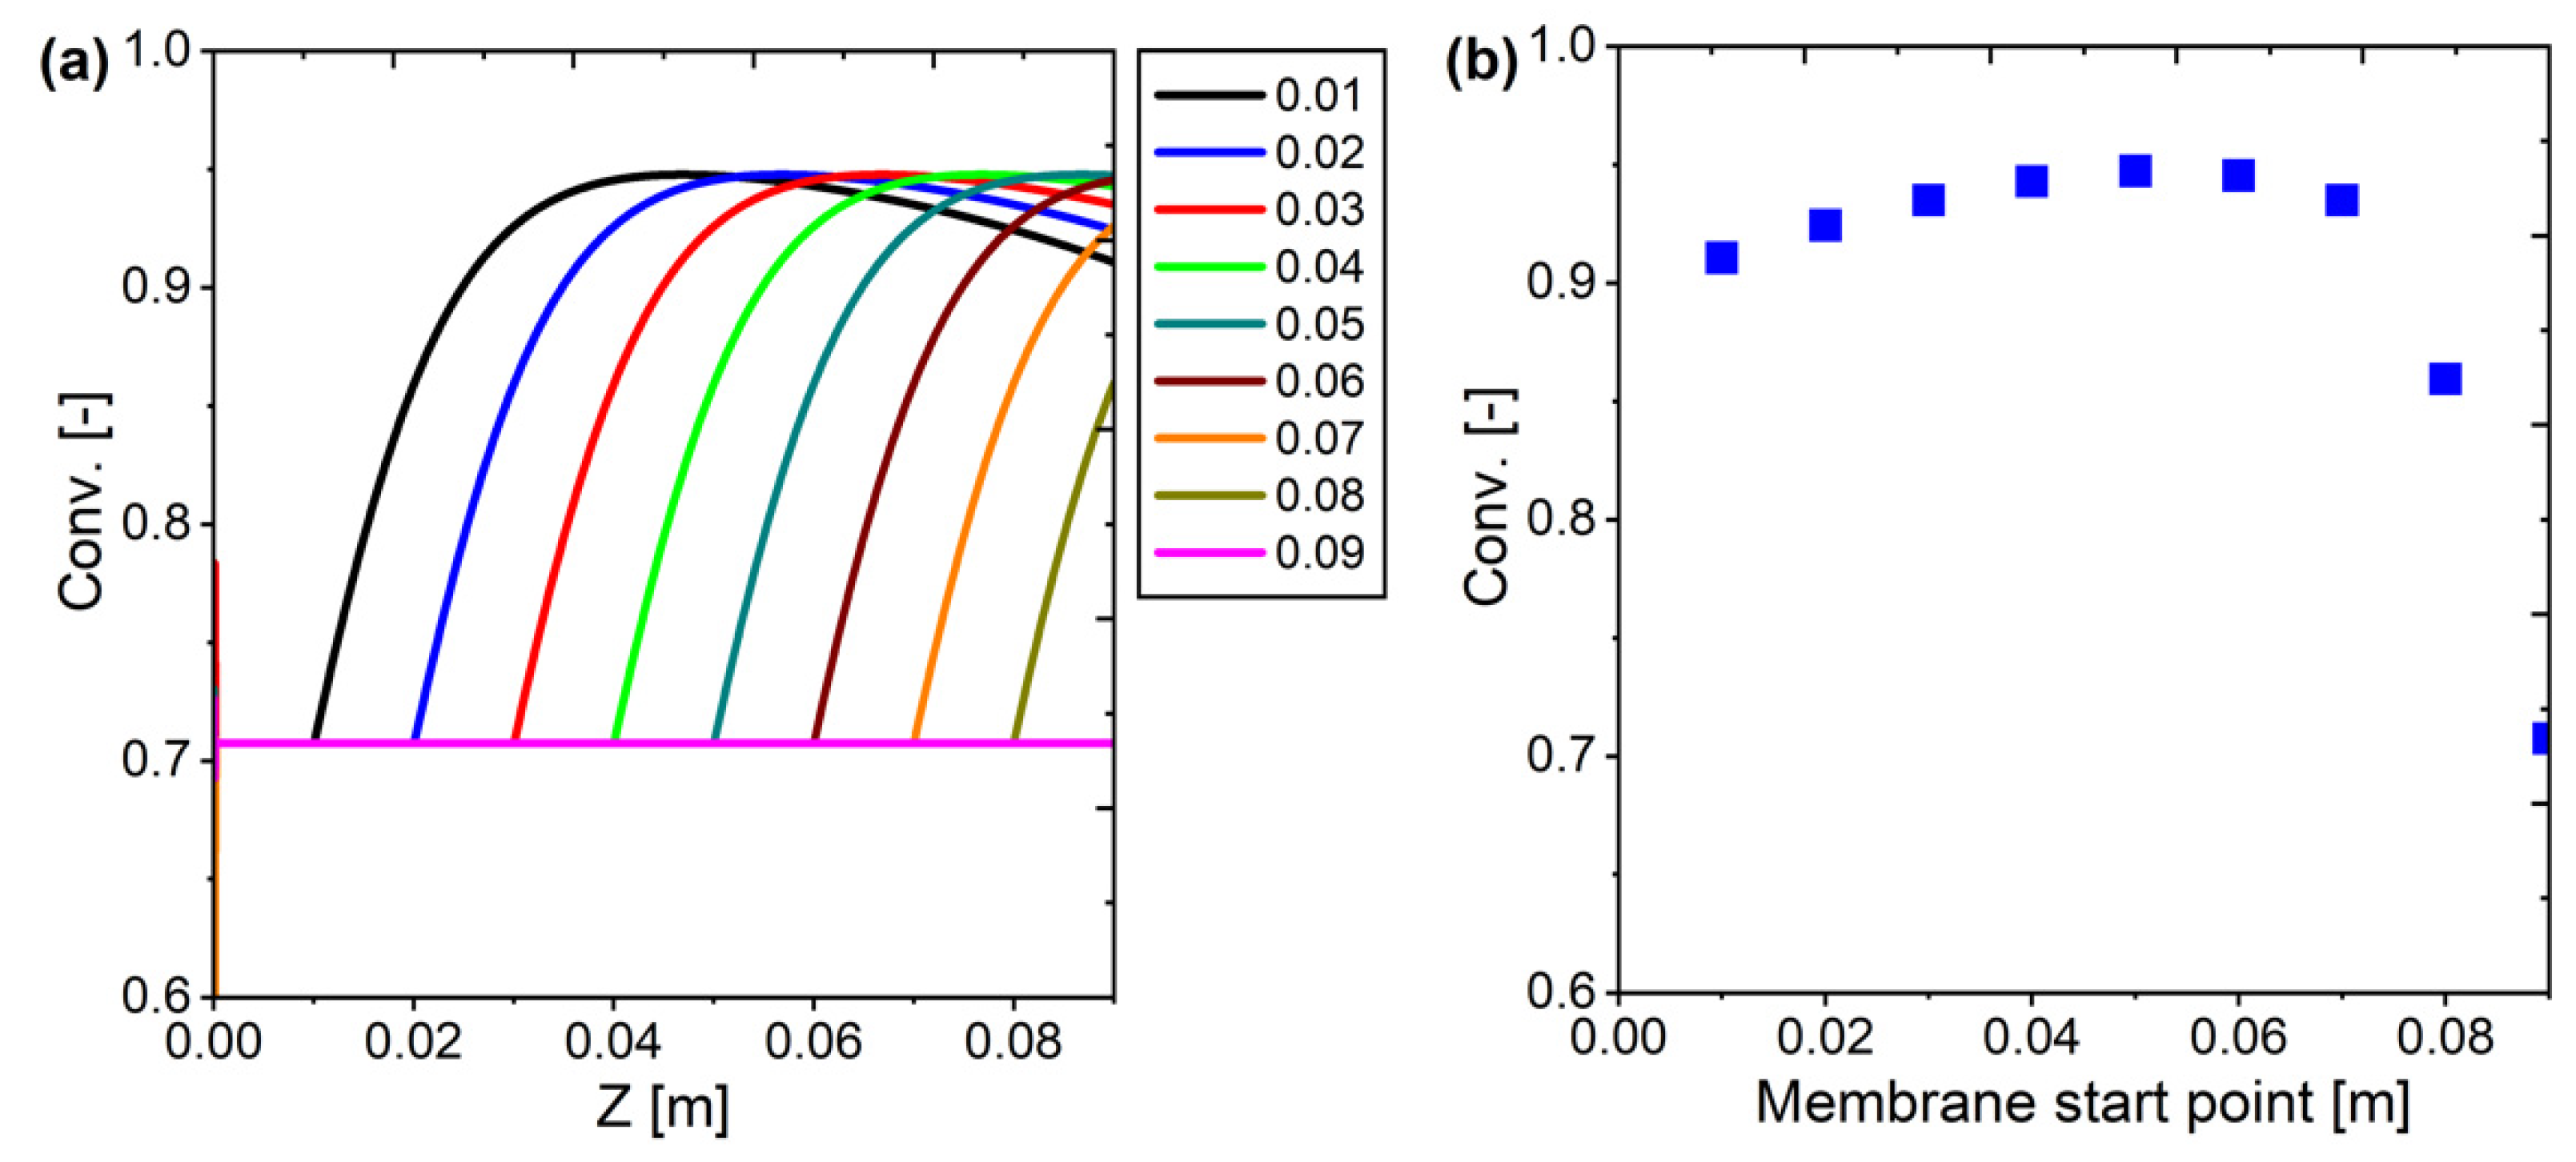
Figure 24.
Membrane starting point selection: (a) profile across the reactor; (b) conversion at the outlet.
Figure 24.
Membrane starting point selection: (a) profile across the reactor; (b) conversion at the outlet.
Figure 25.
The results of the proposed system: (a) Conversion at various temperatures, and (b) Conversion measured at the outlet at 650 °C for different configurations.
Figure 25.
The results of the proposed system: (a) Conversion at various temperatures, and (b) Conversion measured at the outlet at 650 °C for different configurations.
Table 1.
Summary of catalyst properties and reaction conditions.
Table 1.
Summary of catalyst properties and reaction conditions.
| Catalyst Properties [33] | |
|---|
| Activation energy [kJ/mol] | 96.8 |
| Frequency factor [mol/kg-cat.s.bar] @643K | 450 |
| Adsorption constant of CO2 [/bar] | 0 |
| Adsorption constant of CO [/bar] @648K | 0.6763 |
| Adsorption constant of H2O [/bar] @823K | 0.0042 |
| Adsorption enthalpy change in CO [kJ/mol] | −70.91 |
| Adsorption enthalpy change in H2O [kJ/mol] | 88.68 |
| Reaction Conditions [33] | |
| Catalyst weight [g] | 0.5 |
| Packed bed density [g/cm3] | 5 |
| Packed bed length [cm] | 1.3 |
Table 2.
Reaction conditions for each condition in the experiment and simulation in PBR.
Table 2.
Reaction conditions for each condition in the experiment and simulation in PBR.
| W/F | H2/CO2 | Temp. |
|---|
| Pressure [psi] | 45 | Pressure [psi] | 45 | Pressure [psi] | 45 |
| Temperature [°C] | 450 | Temperature [°C] | 450 | H2/CO2 | 4 |
| H2/CO2 | 4 | GHSV [mL/g·h] | 90,000 | GHSV [mL/g·h] | 90,000 |
Table 3.
Physical property value data for simulation.
Table 3.
Physical property value data for simulation.
| | CO2 | H2 | CO | H2O | Ar |
|---|
| ΔHf,298K [kJ/mol] | −3.94 × 10² | 0.00 × 100 | −1.11 × 10² | −2.42 × 10² | 0.00 × 100 |
| Sº [J/mol.K] | 2.14 × 10² | 1.31 × 10² | 1.98 × 10² | 1.89 × 10² | 0.00 × 100 |
| ai [J/mol/K] | 2.74 × 10 | 2.54 × 101 | 2.96 × 101 | 3.39 × 101 | 2.08 × 101 |
| bi [J/mol/K2] | 4.23 × 10⁻² | 2.02 × 10⁻² | -6.58 × 10⁻³ | −8.42 × 10⁻³ | 0.00 × 100 |
| ci [J/mol/K3] | −1.96 × 10⁻⁵ | −3.85 × 10⁻⁵ | 2.01 × 10⁻⁵ | 2.99 × 10⁻⁵ | 0.00 × 100 |
| di [J/mol/K4] | 4.00 × 10⁻⁹ | 3.19 × 10⁻⁸ | −1.22 × 10⁻⁸ | −1.78 × 10⁻⁸ | 0.00 × 100 |
| ei [J/mol/K5] | −2.99 × 10⁻¹³ | −8.76 × 10⁻¹² | 2.26 × 10⁻¹² | 3.69 × 10⁻¹² | 0.00 × 100 |
| Mw [g/mol] | 4.40 × 10 | 2.02 × 100 | 2.80 × 101 | 1.80 × 101 | 3.99 × 101 |
| K [Pas/K0.5] | 1.37 × 10⁻⁵ | 8.41 × 10⁻⁶ | 1.65 × 10⁻⁵ | 1.71 × 10⁻⁵ | - |
| C [K] | 2.40 × 10² | 7.20 × 101 | 1.18 × 10² | 5.63 × 10² | 1.51 × 10² |
| ρ0,i [kg/m3] | 1.98 × 100 | 8.99 × 10⁻² | 1.25 × 100 | 1.00 × 10³ | 1.78 × 100 |
Table 4.
Reaction conditions for ideal MPBR membrane.
Table 4.
Reaction conditions for ideal MPBR membrane.
| Reaction Conditions | |
|---|
| Total initial feed volumetric flow rate [mL/min] | 50 |
| H2/CO2 | 4 |
| Catalyst weight [mg] | 500 |
| Packed bed density [g/m3] | 97,261 |
| Total initial sweep volumetric flow rate [mL/min] | 50 |
| Pressure [atm] | 1 |
| Temperature [K] | 723.15 |
| Membrane Properties |
| Activation energy [kJ/mol] | 14.05 |
| Frequency factor [mol/m2·s·Pa] | 7.57 × 10⁻⁶ |
Table 5.
Reactor dimensions.
Table 5.
Reactor dimensions.
| Reactor Type | PBR | MPBR-In, Co-Current, and Counter-Current | MPBR-Out |
|---|
| Z [m] | 8.00 × 10⁻² | 8.00 × 10⁻² | 8.00 × 10⁻² |
| l1 [m] | 1.79 × 10⁻² | 1.79 × 10⁻² | 7.00 × 10⁻³ |
| l2 [m] | | 2.19 × 10⁻² | 1.10 × 10⁻² |
| l3 [m] | | 2.30 × 10⁻² | 2.10 × 10⁻² |
| l5 [m] | | 2.50 × 10⁻² | 2.50 × 10⁻² |
| S1 [m2] | 2.01 × 10⁻⁵ | 2.01 × 10⁻⁵ | 3.08 × 10⁻⁶ |
| S2 [m2] | | 3.13 × 10⁻⁶ | 2.01 × 10⁻⁵ |
| V1 [m3] | 2.50 × 10⁻⁵ | 2.51 × 10⁻⁴ | 1.60 × 10⁻⁵ |
| V2 [m3] | | 1.60 × 10⁻⁵ | 2.51 × 10⁻⁴ |
Table 6.
The experimental conditions and dimensions used in the ZSM5 membrane system.
Table 6.
The experimental conditions and dimensions used in the ZSM5 membrane system.
| Experiment Conditions | System Illustration |
|---|
| Total pressure [Pa] | 101,325 | ![Membranes 15 00107 i001]() |
| Total feed shell side [mL/min] | 12 |
| Total feed tube side [mL/min] | 5 |
| H2/CO2 ratio | 3:01 |
| Catalyst weight [g] | 3.5 |
| Density of catalyst bed [g/m3] | 4.5 |
| Dimension |
| Z [m] | 9 × 10⁻² |
| l1 [m] | 7 × 10⁻³ |
| l2 [m] | 1 × 10⁻² |
| l3 [m] | 1.2 × 10⁻² |
| l5 [m] | 1.5 × 10⁻² |
| Membrane properties |
| | [mmol/m2 s Pa] | [mmol/m3 Pa] |
| CO2 | 2.1 × 10⁻³ | 32 |
| H2 | 7.08 × 10⁻⁴ | 29.1 |
| CO | 1.91 × 10⁻⁸ | −24.6 |
| H2O | 1.43 × 10⁻⁴ | −1.42 |
Table 7.
Reaction conditions for reactor design.
Table 7.
Reaction conditions for reactor design.
| Parameter [Unit] | Value |
|---|
| Pressure [atm] | 1 |
| H2O/CO2 | 3 |
| Feed [mL/min] | 12 |
| Sweep [mL/min] | 200 |
| [g/m3] | 4,500,000 |
| Zo [m] | 0 |
| Zₗ [m] | 0.5 |
| Z2 [m] | 0.9 |
| lₗ [m] | 0.007 |
| l2 [m] | 0.01 |
| l3 [m] | 0.012 |
| l5 [m] | 0.015 |
Table 8.
Changes from the initial reaction to the updated conditions in the PBR system.
Table 8.
Changes from the initial reaction to the updated conditions in the PBR system.
| | Initial Configuration—From Experimental Conditions | Updated Configuration—Optimized Process Variables |
|---|
| Pressure [Pa] | 310,264 | 101,325 |
| Total volumetric flow rate [mL/min] | 750 | 50 |
| H2/CO2 | 4 | 4 |
| Temperature at equilibrium is reached [°C] | ~500 | ~450 |
Table 9.
Changes from the initial to the updated configuration in the MPBR ideal membrane system.
Table 9.
Changes from the initial to the updated configuration in the MPBR ideal membrane system.
| | Initial Configuration | Updated Configuration |
|---|
| Shell side |
| Total initial volumetric flow rate [mL/min] | 50 | 5 |
| H2/CO2 | 4 | 4 |
| Catalyst weight [mg] | 500 | 500 |
| Packed bed density [g/m3] | 97,262 | 97,262 |
| Tube side |
| Total initial volumetric flow rate [mL/min] | 50 | 350 |
| Reactor general setting |
| Pressure [atm] | 1 | 1 |
| Temperature [K] | 723.15 | 823.15 |
| Membrane properties [23] | |
| Activation energy [kJ/mol] | 14.1 | 14.1 |
| Frequency factor [mol/m2 s Pa] | 7.57 × 10⁻⁶ | 7.57 × 10⁻⁶ |
Table 10.
Criteria for applying the 1D model in the system (the verification of the system’s validity).
Table 10.
Criteria for applying the 1D model in the system (the verification of the system’s validity).
| Criteria | Met/Not Met | Reason |
|---|
| Dominance of axial flow | ✅ | The Péclet number is very high (3338.46), indicating that axial flow dominates over diffusion. |
| Radial diffusion negligible | ✅ | The effective diffusion coefficient is small (0.0004345 cm2/s), and a high Péclet ensures radial diffusion is insignificant. |
| Laminar or plug flow | ✅ | Low flow velocity (1.45 mm/s) supports the plug flow assumption in the packed bed. |
| Axial reaction homogeneity | ✅ | High Péclet number and short reactor length (0.09 m) ensure axial reaction homogeneity. |
| Radial effects negligible | ✅ | Small lateral diffusion and dominance of advection minimize radial effects in this system. |
| Péclet number criterion [67] | ✅ | The calculated Pecrit is lower than the Péclet number: @609K Pecrit (0.099493) vs. Pe (3338.460) |


 ,
, 


