Article

Performance Evaluation of UF Membranes Derived from Recycled RO Membrane, a Step towards Circular Economy in Desalination

1
Institute of Environmental Sciences and Engineering IESE, National University of Sciences and Technology, NUST, Islamabad 24090, Pakistan
2
Department of Civil and Environmental Engineering, Hanyang University, Seoul, 04763, Republic of Korea
3
Creative Engineering Consultants, Peshawar 25100, Pakistan
4
School of Energy and Environment (SEE), City University of Hong Kong, Hong Kong SAR, China
*
Authors to whom correspondence should be addressed.
Membranes 2023, 13(7), 628; https://doi.org/10.3390/membranes13070628
Submission received: 19 May 2023 / Revised: 12 June 2023 / Accepted: 20 June 2023 / Published: 28 June 2023

Abstract

:
Reverse osmosis (RO) spiral wound membrane generation reached 93.5% in 2020, resulting in 14,000 tons of used RO membranes being discarded annually into landfills, which is unprecedented. The current study aims to chemically convert the end-of-life RO membrane, followed by its performance evaluation and microbial removal efficiency on three different sources of water, i.e., tap water (TW), integrated constructed wetland permeate (ICW-P), and membrane bio-rector permeate (MBR-P), respectively. This was accomplished by selecting 6 years of spent Filmtech (LC-LE-4040) thin film composite type brackish water reverse osmosis (BWRO) membrane, followed by alkaline and acidic cleaning for 2 h. Finally, the conversion was carried out by 6% sodium hypochlorite (NaOCl) with 300,000 ppm/h exposure by active system (AS) using the clean in place CIP pump at 2 bars for 10 h duration. The membrane demonstrated 67% water recovery and 1% saltwater rejection, which means RO membrane now converted into recycled RO (R-RO) or (UF) by removal of the polyamide (PA) layer. Water recovery was 67% for TW, 68% for ICW-P, and 74% for MBR-P, respectively, with the consistent saltwater rejection rate of 1% being observed, while R-RO exhibited an effective COD removal of 65.79%, 62.96%, and 67.72% in TW, ICW-P, and MBR-P, respectively. The highest turbidity removal of 96% in the ICW-P was also recorded for R-RO. For morphological properties, SEM analysis of the R-RO membrane revealed a likewise appearance as a UF membrane, while pore size is also comparable with the UF membrane. The most probable number (MPN) also showed complete removal of total coliforms after passing through the R-RO membrane. These features made the R-RO membrane an excellent choice for drinking water treatment and wastewater treatment polishing steps. This solution can help developing nations to be efficient in resource recovery and contribute to the circular economy.

1. Introduction

Desalination is an ancient technique to obtain clean water. With rapid population growth, the demand for water has increased. At present, water on the earth is accounted for with 97% as oceanic/salty, and the rest (3%) is freshwater which creates a great deal of interest in supplying clean water to humanity [1,2]. Historically on ships, distillation was a process where heat was used to separate water from salt, which was later used and developed for voyages in the late 18th century. The history of desalination started when commercial desalination plants were being deployed (1881–1907) and were installed in Tinge, Malta, and Jeddah, Saudi Arabia, respectively [3,4]. In the past, it was conducted in the form of thermal distillation techniques such as multi-flash distillation and multiple effect distillation, installed foremost in the Middle East. Later on, this was shifted towards desalination due to the high footprint of energy consumption and the emergence of the RO membrane [5,6]. The reverse osmosis (RO) membrane was a revolutionary advancement in the desalination sector [7], especially the spiral wound membrane discovered by Westmoreland, Bray, in the late 1960s [8]. It is a rolled configuration with enhanced surface area, which sustains more pressure and exhibits higher saltwater rejection % and water recovery %. The capacity of RO membrane use has increased as compared to Multi-Stage Flash (MSF) and Multiple-Effect Distillation (MED) and is expected to reach production of 6 million m3/day, according to the data from the Global Water Intelligence(GWI)/Desal 2020 report [9,10].
The (Thin-Film Composite) TFC polyamide RO membrane is most abundantly used in the world and has large footprint for desalination, and its fouling leads to a reduction of lifespan of 5 to 10 years which ultimately goes towards the landfill and creates more waste to deal with [11,12].
Due to unsustainable consumption patterns mixed with rising industrialization, urbanization, and population growth, the environment and natural resources are under stress. Environmental issues such as climate change, air pollution, biodiversity loss, and the degradation of water and soil are often caused by economic development and underlying patterns of unsustainable production and consumption [13]. The circular economy addresses decoupling, resource efficiency, production efficiency, slower material flows rather than linear economic models, and decreased resource extraction without diminishing economic activity [14].
In the linear economy, things are made, used, and disposed of while in the circular economy the resource is recycled instead of going to waste, its life is enhanced, and this poses less threat to the environment [15]. Using these spent RO membranes to convert them into Ultrafiltration (UF) membranes is one such approach that can significantly contribute in the circular economy to deal with the 2 million expected spiral-wound spent RO membranes by 2025 [16,17].
The RO membrane, by removing the top layer of PA, can be converted into a UF membrane with higher permeability, and excellent performance can be achieved for many purposes [18]. Jawad in 2021 converted the RO membrane and tested it on the gray water that showed higher water recovery % and removal of E. coli [19]. Khaless et al. in 2021 observed the salt rejection percentage of the RO spent membrane and proposed to use it for phosphoric acid treatment [20,21]. Salinas et al. in 2020 evaluated the life cycle assessment (LCA) and direct economic analysis of recycling of RO membranes that showed positive results, and it proved effective as an environmental benefit, and recycled modules can be sold at a competitive price of 80 euros in the market [22,23].
The Pakistan Council of Research in Water Resources (PCRWR) has recently published a report on the drinking water quality in Pakistan and its current status and challenges in 2021, which was conducted in 29 cities of 4 provinces, revealing that out of 435 water sources, when compared with National Standards for Drinking Water Quality Standards (NSDWQ), 267 (61%) sources showed that they are unsafe for drinking. There were 11 major issues including 41% being microbiological issues, turbidity (9%), nitrates (4%), pH (1%), and others [24]. Pakistan and other developing countries also need membrane (RO/UF pilot scale plants) solutions that must be cost-effective, sustainable, and efficient in performance to provide pure and clean drinking water to its people, but the cost is an eminent factor that curtails the achievement of this objective [25,26,27].
The novelty of study lies in the evaluation of recovered RO membranes as tertiary treatment for integrated constructed wetland permeate and membrane bioreactor (MBR) permeate, which have not been previously investigated. Furthermore, the performance of this recovered membrane was compared with drinking water standards. This unique approach allows us to assess the suitability and effectiveness of the recovered membranes in reusing water from different types of sources. This research explored diverse water and wastewater permeate treatment scenarios, expanding the possibilities for sustainable and cost-effective water purification solutions. This study aims (1) for the chemical conversion of spent RO membrane into recycled RO or ultrafiltration for water treatment and (2) to observe the performance and microbial removal efficiency on different sources of water, i.e., tap water (TW), integrated constructed wetland permeate (ICW-P), and membrane bio-rector permeate (MBR-P).

2. Material and Methods

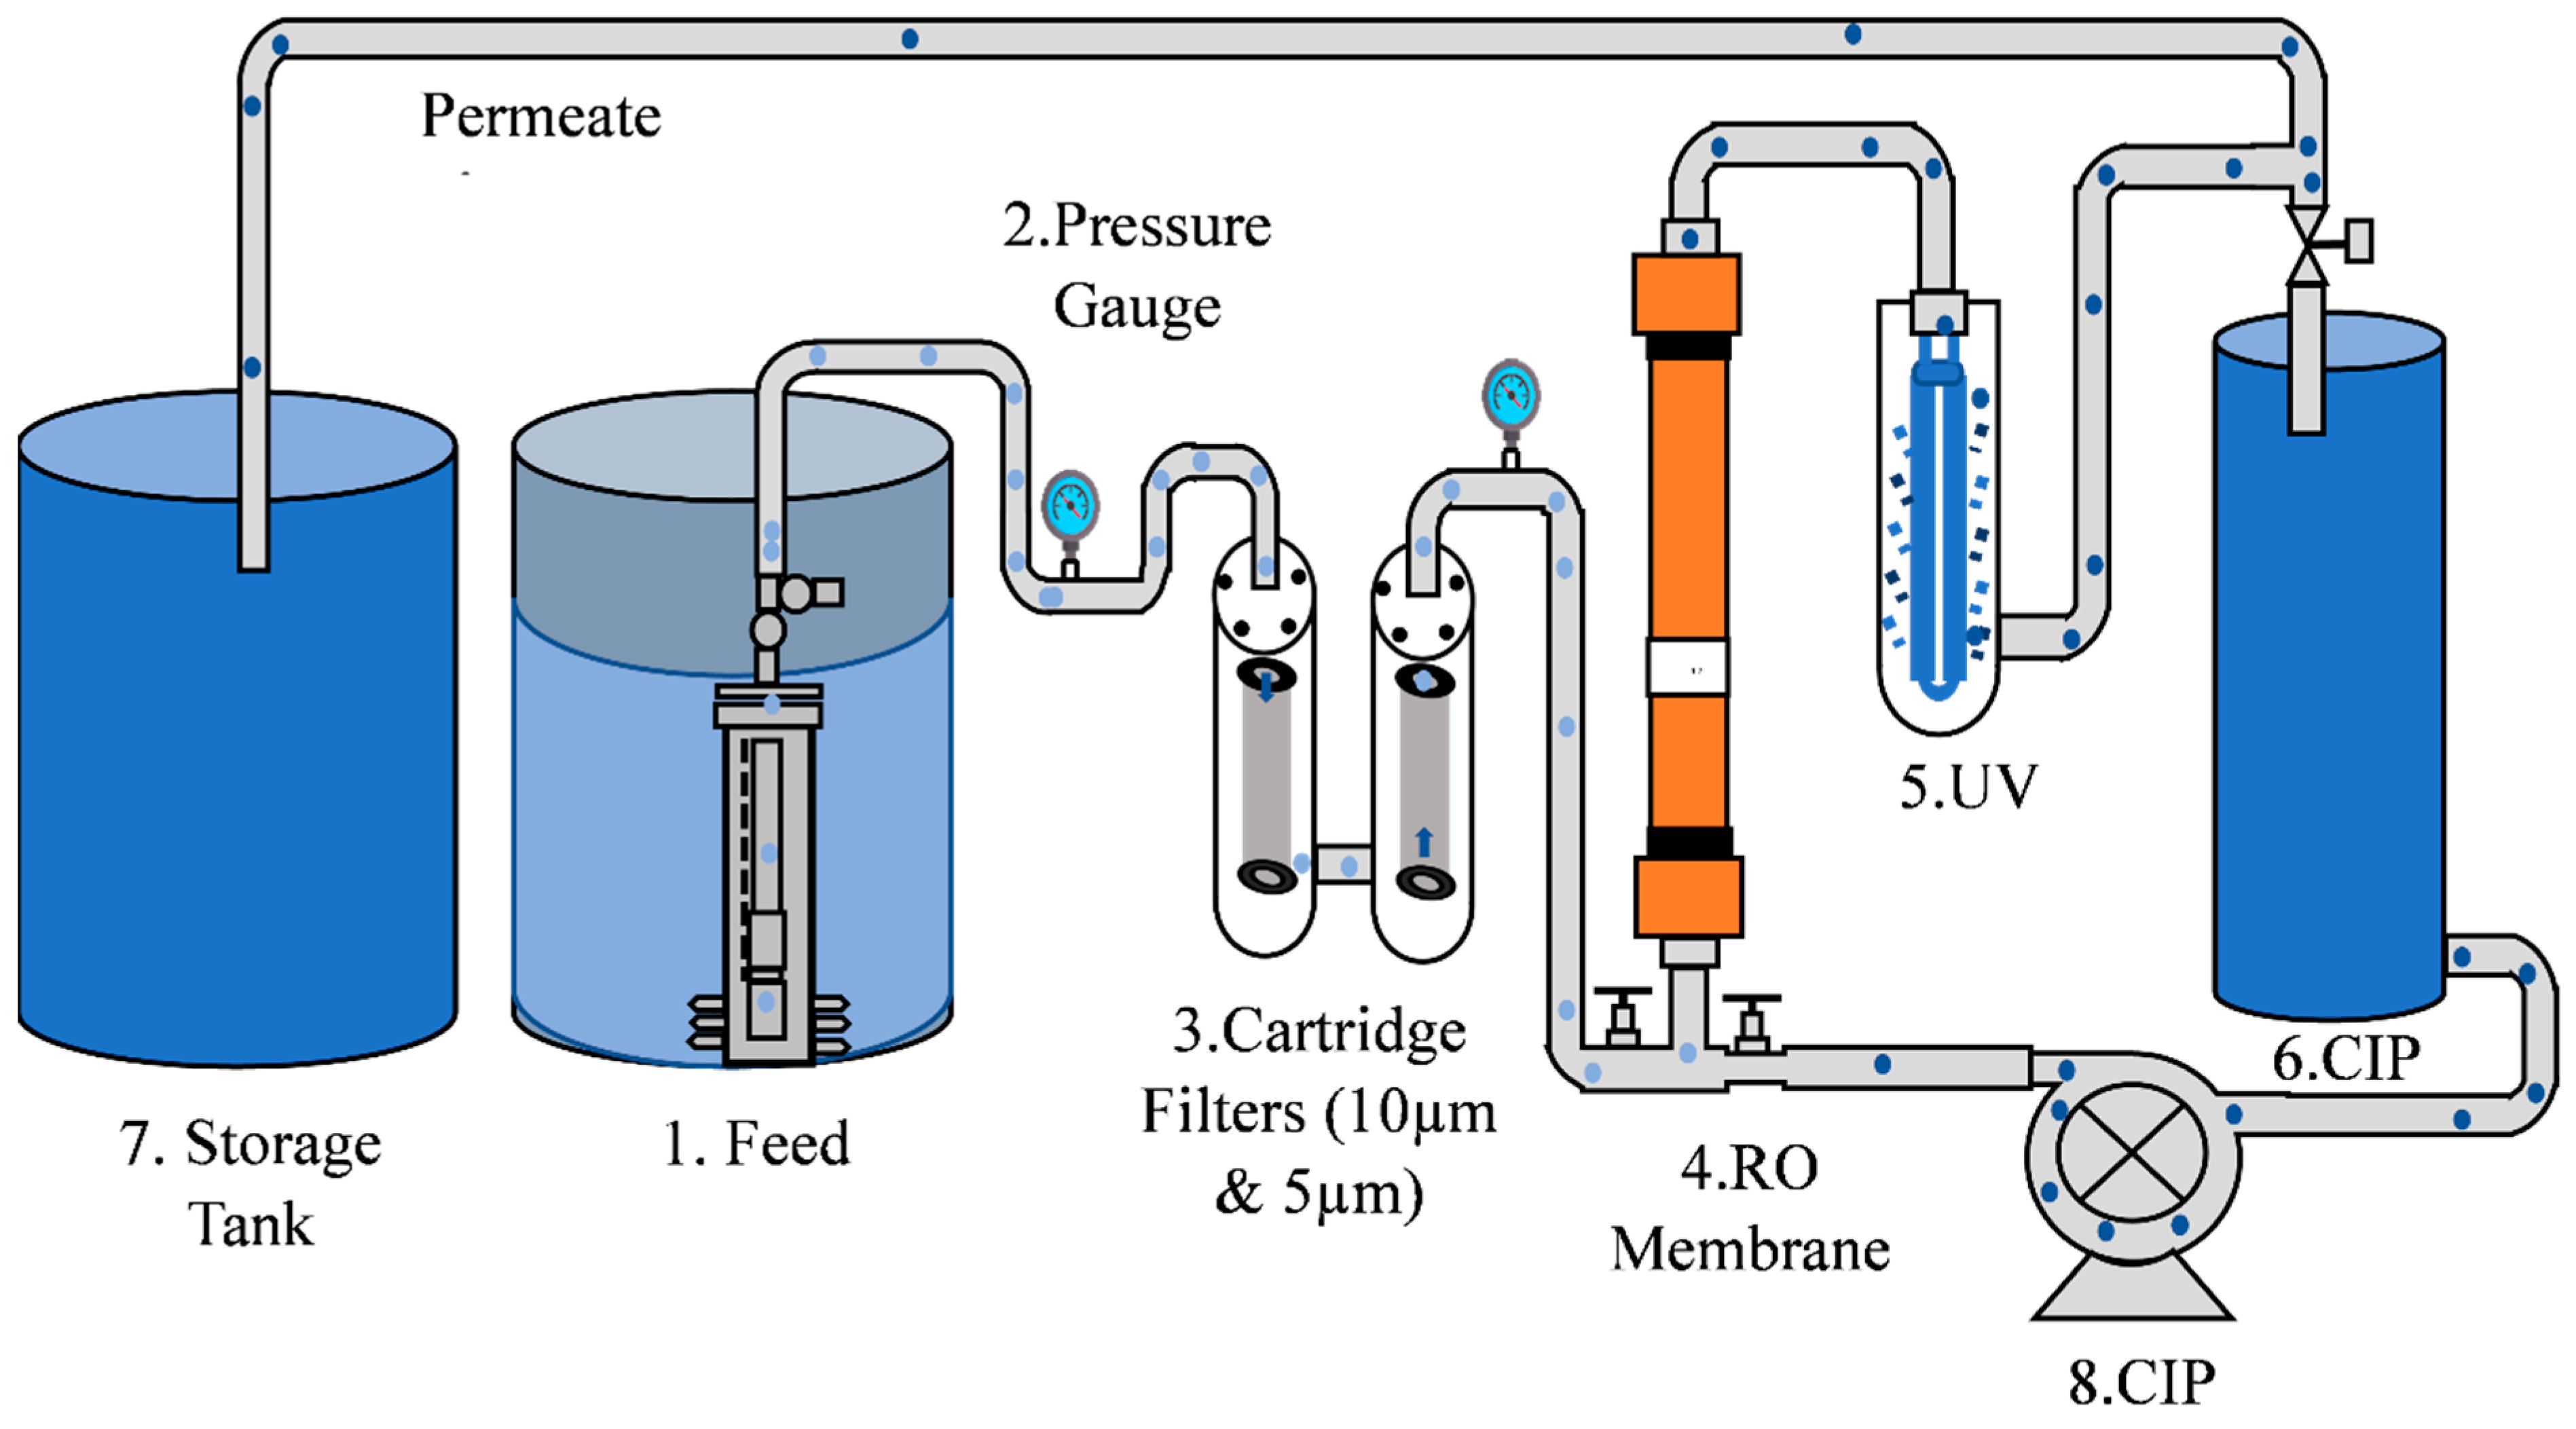
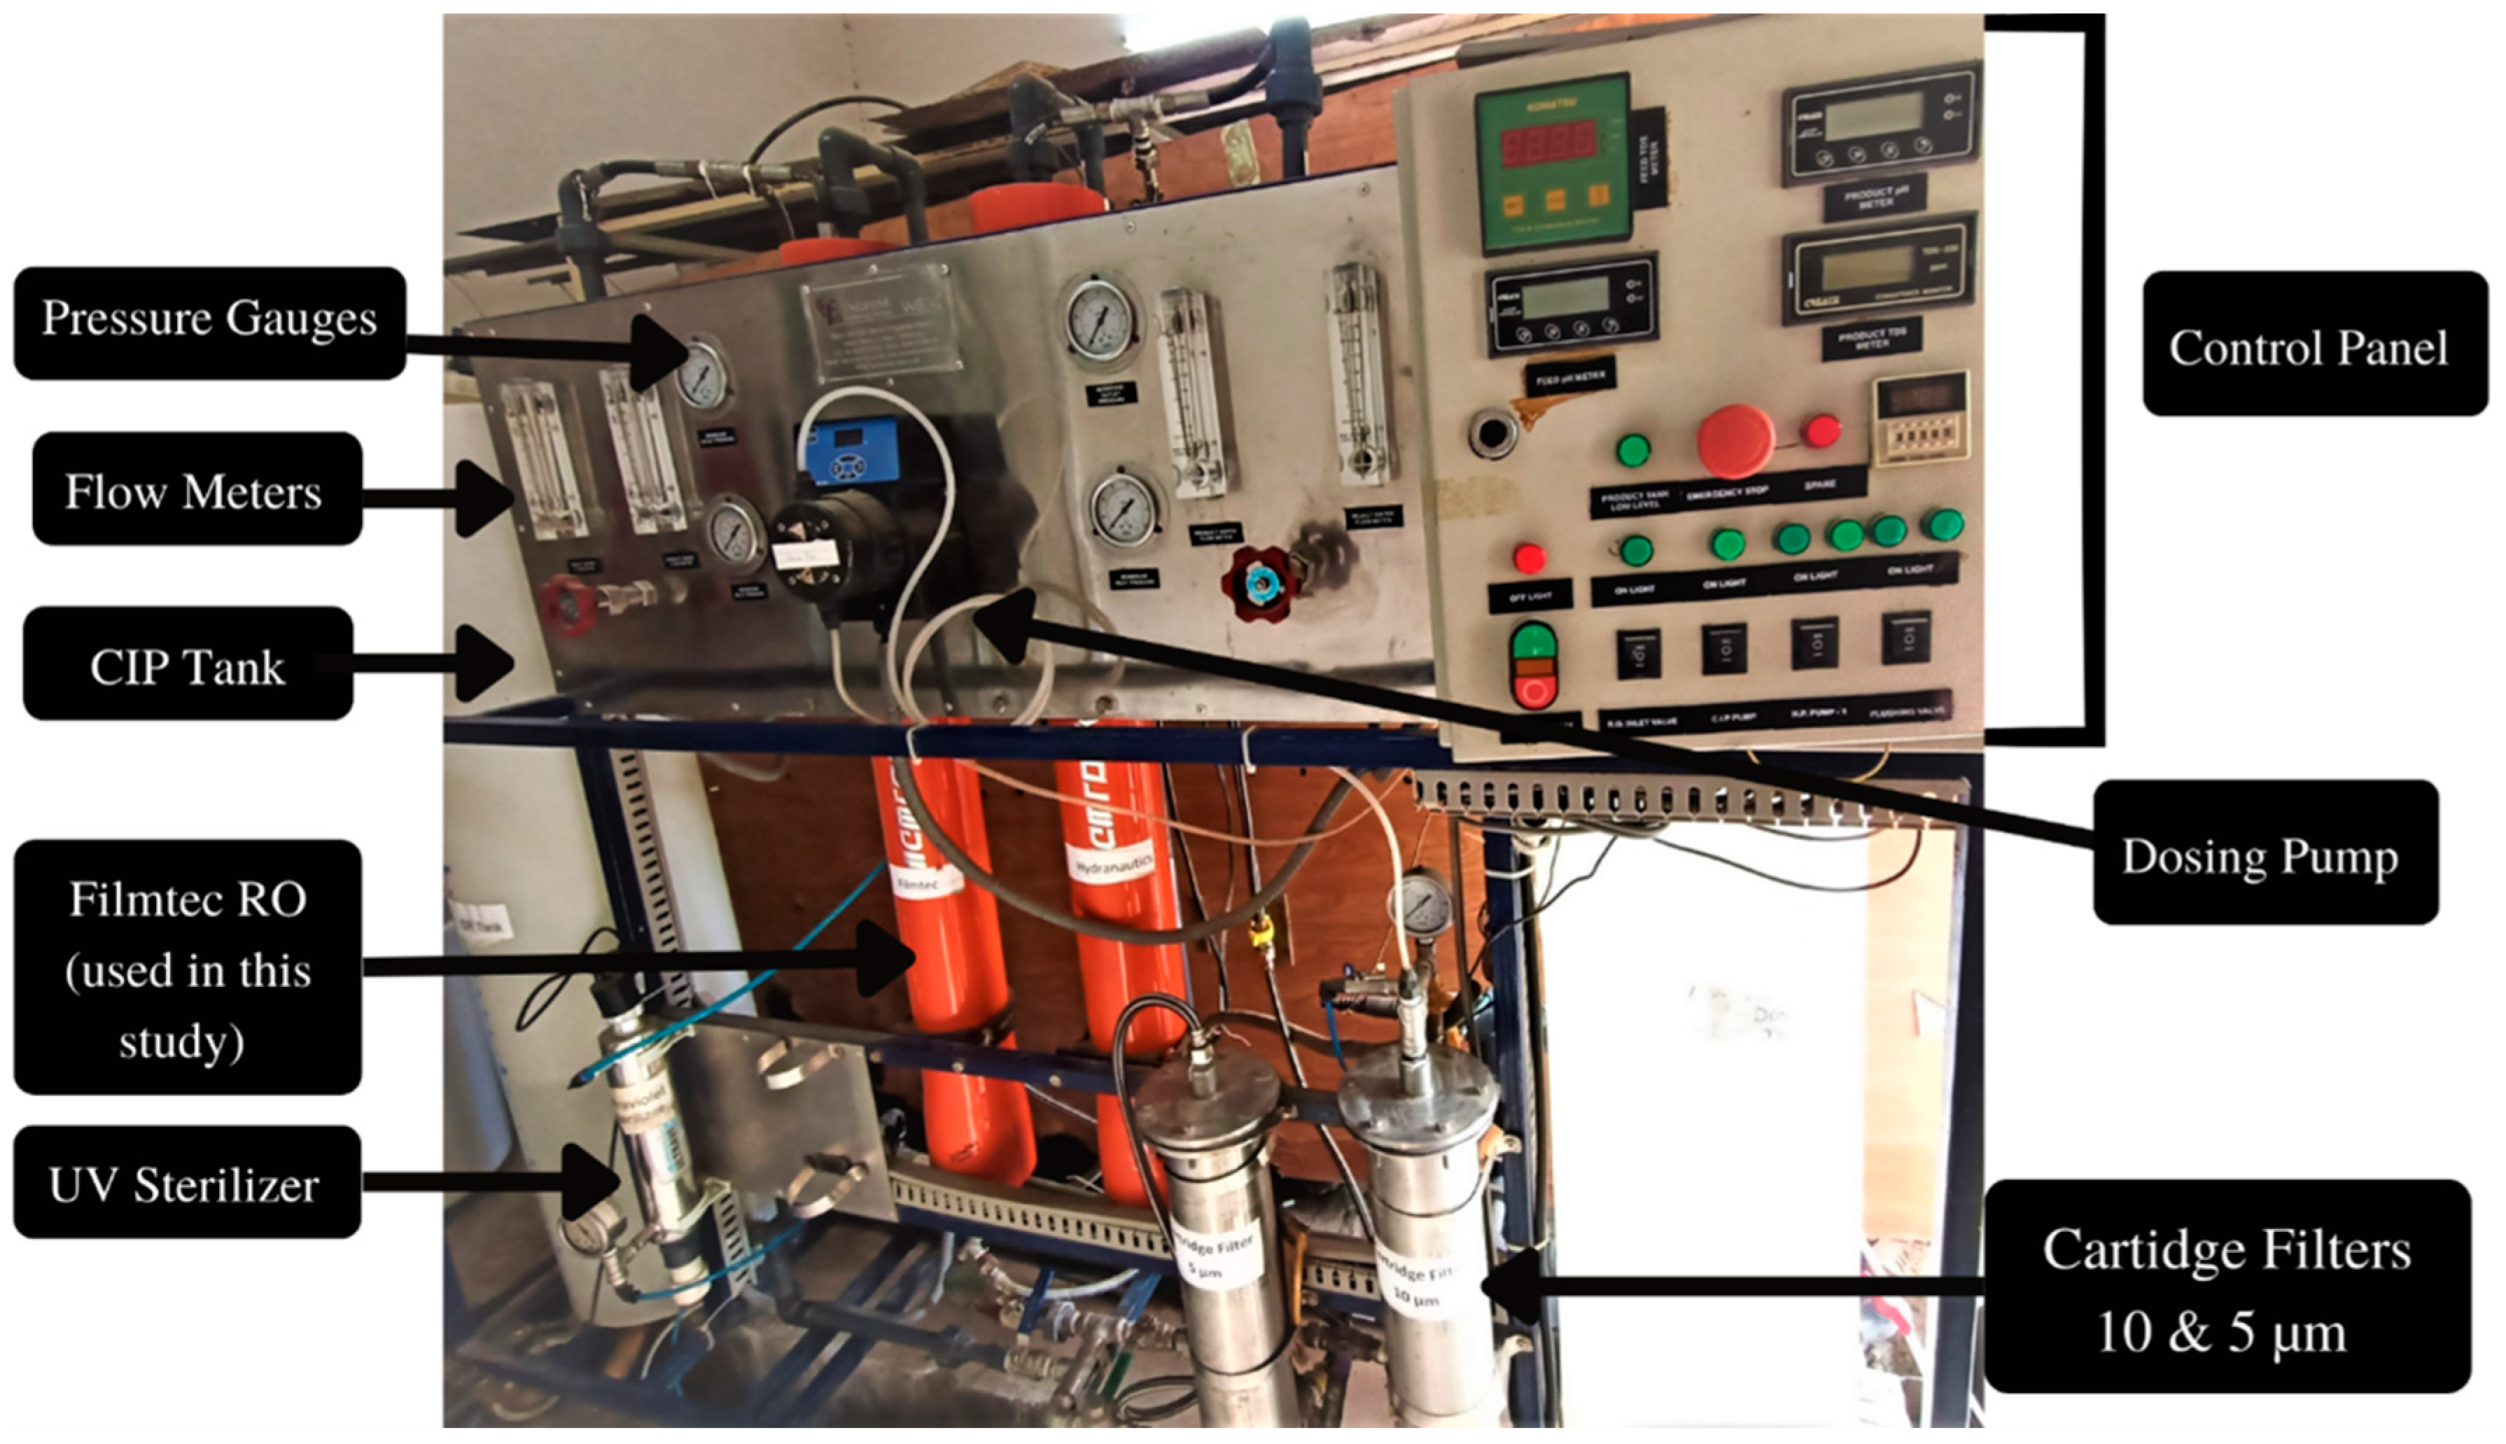
2.1. RO Pilot Plant Description

This study used the pilot scale (RO plant), with a brackish water reverse osmosis (BWRO) membrane embedded from the past 6 years, previously used for synthetic brackish water evaluation and a performance study conducted by Khanzada in 2017 [28].
The system as shown in Figure 1 comprises a submersible feed pump (Model: SQF 0.6–3, Grundfos, Edenbridge, UK) placed inside the feed tank of 200 US gallon (757 L) water capacity, followed by 2 melt blown cartridge filters (CF), 10 µm and 5 µm, respectively, an end-of-life RO membrane thin film-composite TFC type (Model: Filmtech LC-LE-4040) of size 4 by 40″, an ultraviolet sterilizer UV lamp (Model: Wonder Light Stainless Steel PC-2: 2 GPM 110v), and a clean in-place pump CIP (Model: MSP 230, Marchmay, Saint Neots, UK) and a CIP tank as well, while the outlet and inlet membrane pressure were measured by pressure gauges (model: 233.55 LBM, WIKA Instrument Corporation, Lawrenceville, GA, USA), a continuous meter for TDS (model: TDS consistent monitor 230), and a pH meter placed in the plant. The actual pilot scale experimental setup is shown in Figure 2.

2.2. Operational Details and Parameters

The BWRO membrane is a polyamide thin-film composite TFC-type spiral wound membrane used in the study. In the composition, the RO membrane polyamide (PA) is at the top, followed by polysulfone (PSF) and a base of polyester.
The PA layer is highly susceptible to chlorine exposure and starts degrading at 1000 ppm/h due to the deformation in its structure as Singh explained in 2006. Membrane properties are described in Table 1.
The recycled RO (R-RO) membrane water recovery %, saltwater rejection %, permeability, and transmembrane TMP are calculated during the operation.
For water recovery percentage following Equation (1) was used [29,30].
Water   recovery   % = Q p Q f × 100
where Qp is permeate and Qf is feed water flow in (L/h).
Saltwater rejection % was determined using Equation (2) [30].
Saltwater   rejection   % = ( 1 C p C f ) × 100
where Cp refers to permeate and Cf refers to feed concentrations, respectively.

2.3. Conversion Procedure

When the spent RO membrane is treated with 300,000 ppm conc. per hour of sodium hypochlorite, it removes the top layer of PA by converting the membrane into recycled RO (R-RO) or UF membrane. This procedure is well-documented and performed as followed by [20] that sodium hypochlorite exposure degrades the polyamide layer with the above concentration.
For conversion, an active system (AS) followed in which, at the start, alkaline cleaning was performed using 0.1% of sodium hydroxide (NaOH) in pellet form purchased from Sigma Aldrich (Burlington, MA, United States) dissolved in 14 L of distilled water and stirred for 5 min [31]. The exposure time was 2 h, at 2 bar pressure, and the CIP pump was used for the alkaline cleaning process, and 5–10 min relaxation time was given after one hour. Acidic cleaning using 2% Citric Acid (C6H8O7) procured from Sigma Aldrich was followed with the same method as for the alkaline cleaning [32,33,34].
Some 6% sodium hypochlorite (NaOCl), i.e., 1200 mL of 12.5% concentration, was purchased from VWR Chemicals International, dissolved in distilled water (20 L), stirred for 5 min, and operated at 2 bar pressure for the 5 h of exposure time, but the required result was not achieved after the first process. So, the whole conversion with all the same details has been repeated one more time. The same concentration of NaOCl was applied a second time, and a net total of 2400 mL was used to convert the spent RO into an R-RO membrane [21]. The conversion procedure details are given in Table 2.

2.4. Characteristics of Water

Realizing the potential of the R-RO (Recycled RO) membrane, it was tested on the 3 different sources of water, i.e., tap water (TW) near the constructed wetland with a 16 m distance, the second type of membrane bio-rector permeate (MBR-P) water, and constructed wetland permeate (ICW-P)-treated water.
All the initial findings of the parameters conducted are compiled in Table 3.
Initial physicochemical and microbial analysis of TW, ICW-P, and MBR-P was measured in laboratory using pH meter (Model: Bench-top pH meter HI 8520 microprocessor); electrical conductivity was measured by an EC meter (Model: conductivity meter Cond 720); and turbidity was measured using a portable turbidimeter (Model: HACH 2100P). For chemical oxygen demand (COD), the media prepared using potassium dichromate (K2Cr2O7) purchased from Duksan International. Sulfuric acid (H2SO4) was purchased from Sigma Aldrich, and then after the addition of the sample, it was digested for 2 h. The sample was titrated against ferrous ammonium sulphate (NH4)2Fe(SO4)2·6H2O obtained from Duksan International, until a reddish brown color appeared.
The most probable number (MPN) was performed using 3 different media: lauryl tryptose broth LTB (code: CM0451), brilliant green bile BGB 2% (code: CM0031), and EC broth (code: CM0853), all procured from oxoid. For MPN, media were prepared, autoclaved for 2 h, and then placed for incubation at 37 °C overnight, and the sample was inoculated the next day followed by incubation at the same condition. On the second day, there was a check of the LTB tubes and a count of the positive numbers which are turbid, and the sample in BGB tubes was transferred using laminar flow, and the same procedure was repeated for the EC tubes as well, and then the number of positive tubes from the MPN index was checked.

2.5. Membrane Characterization

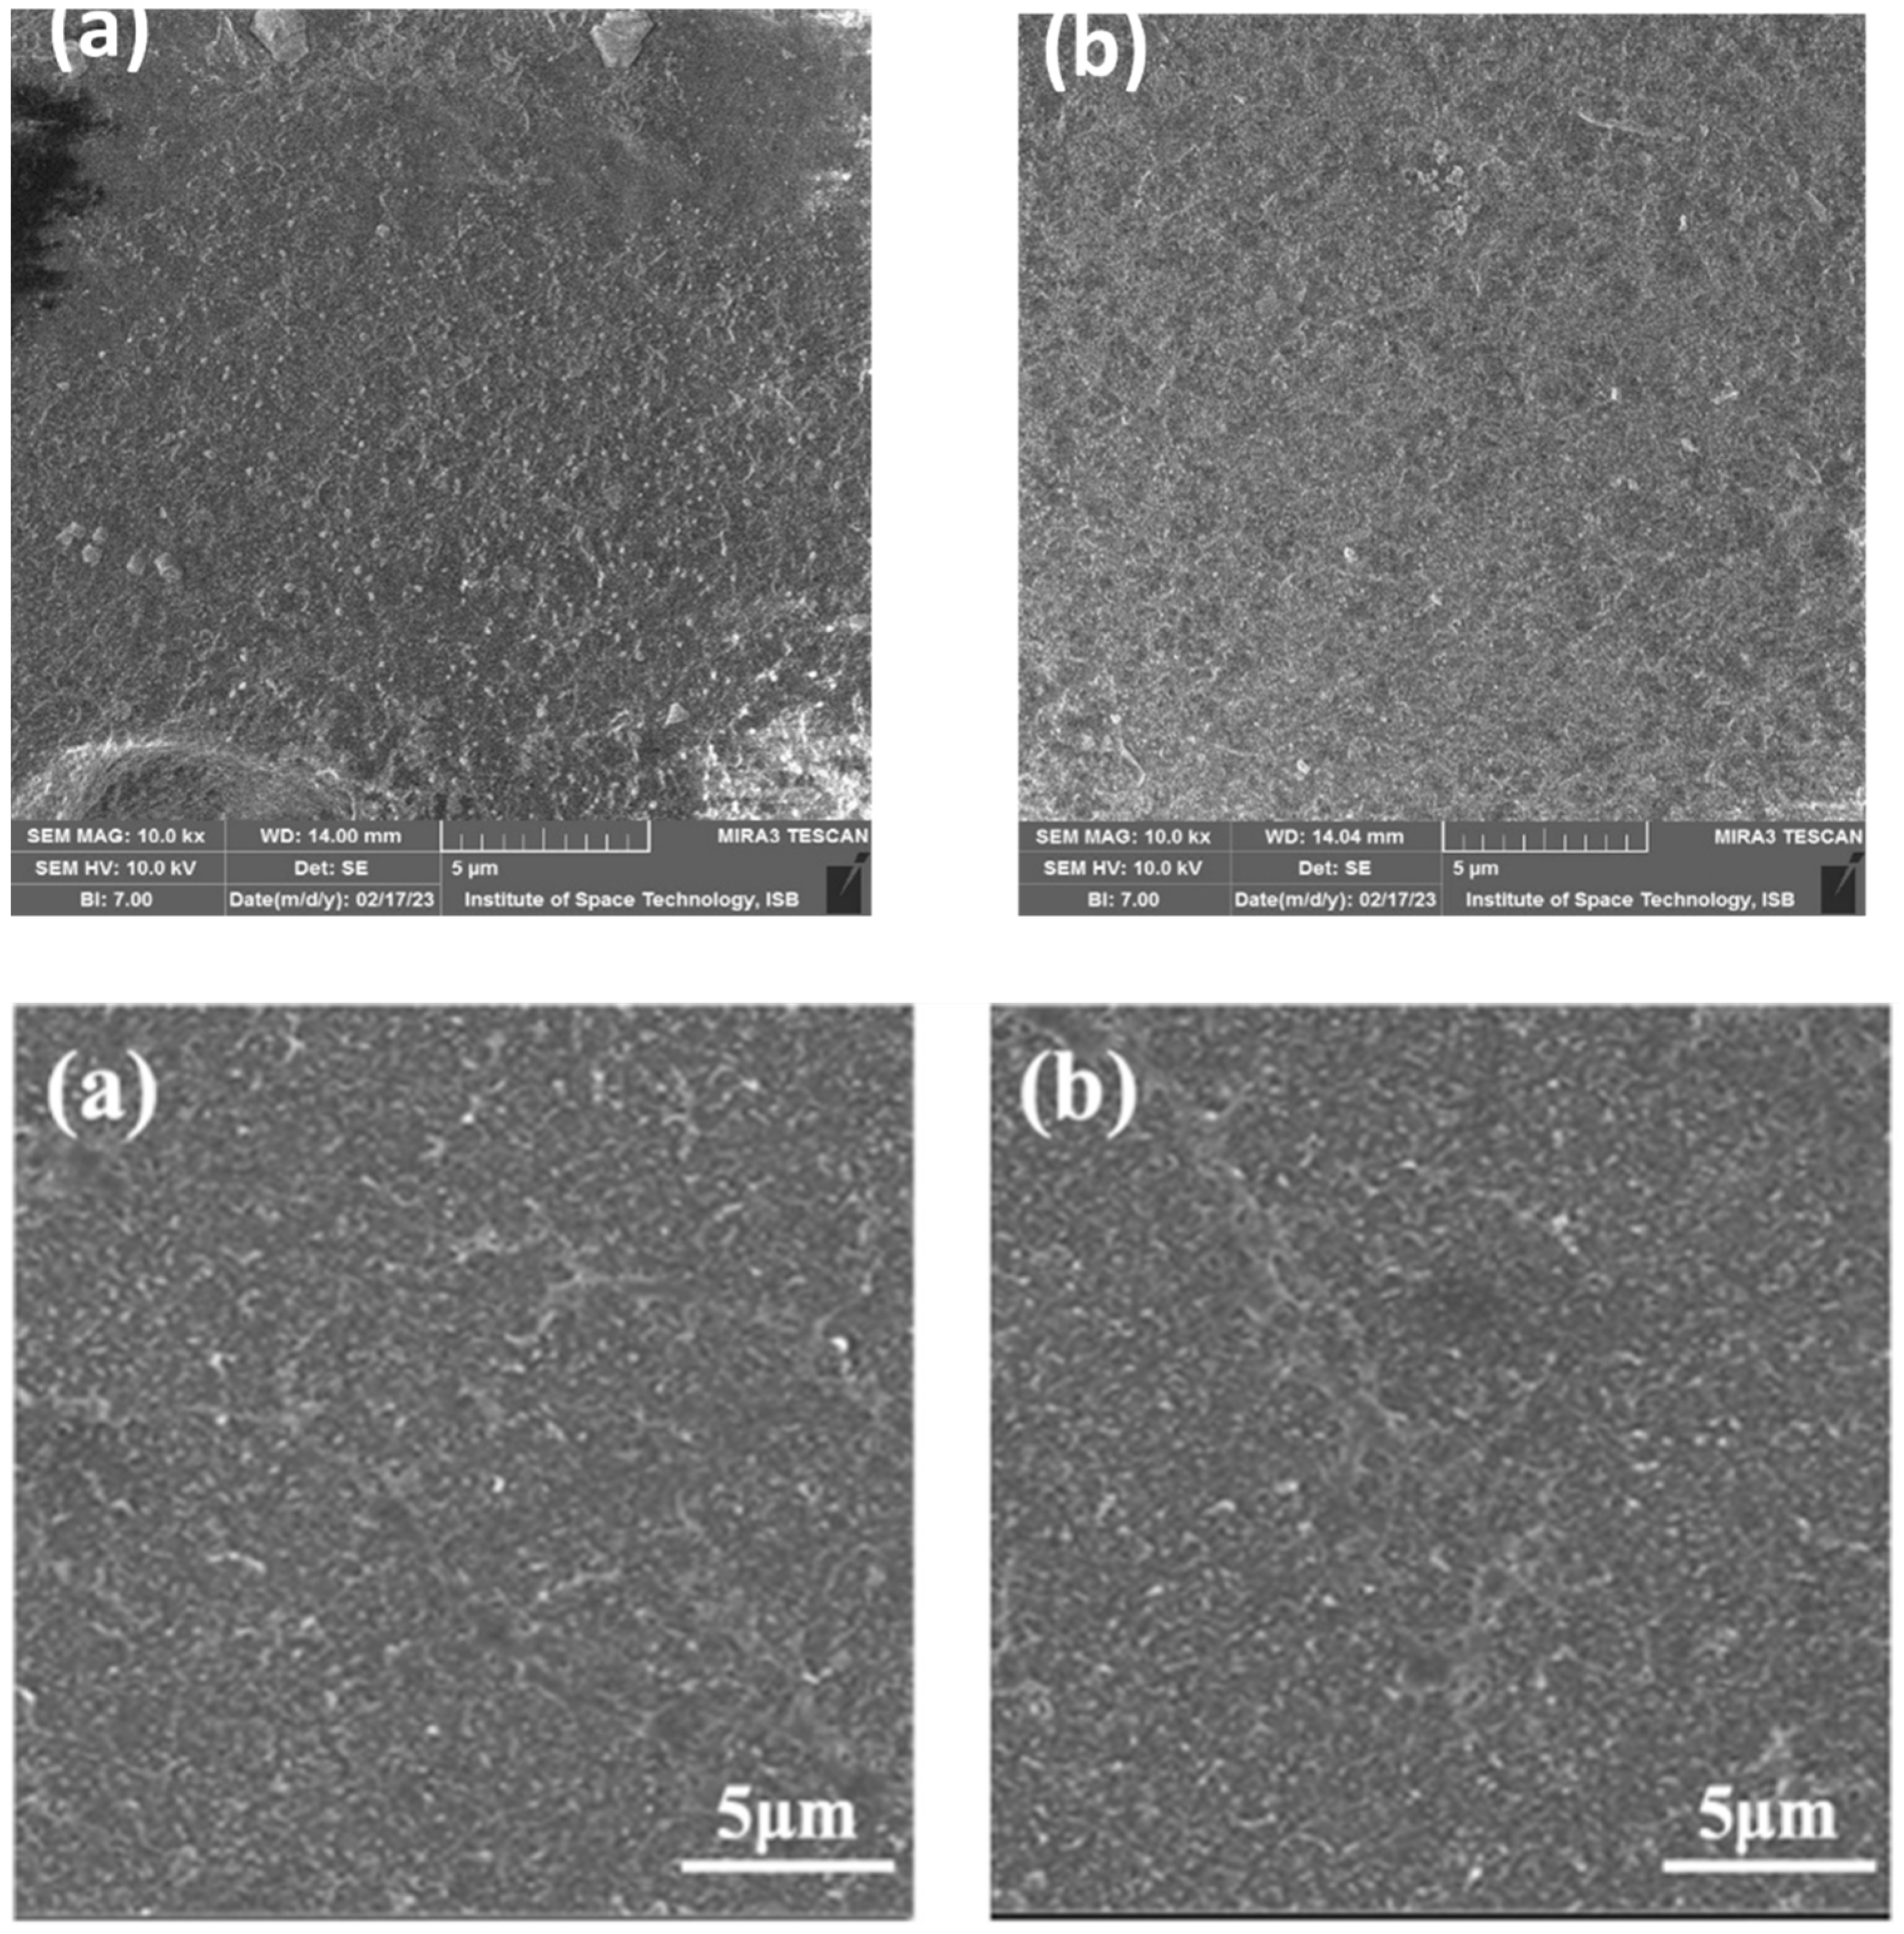
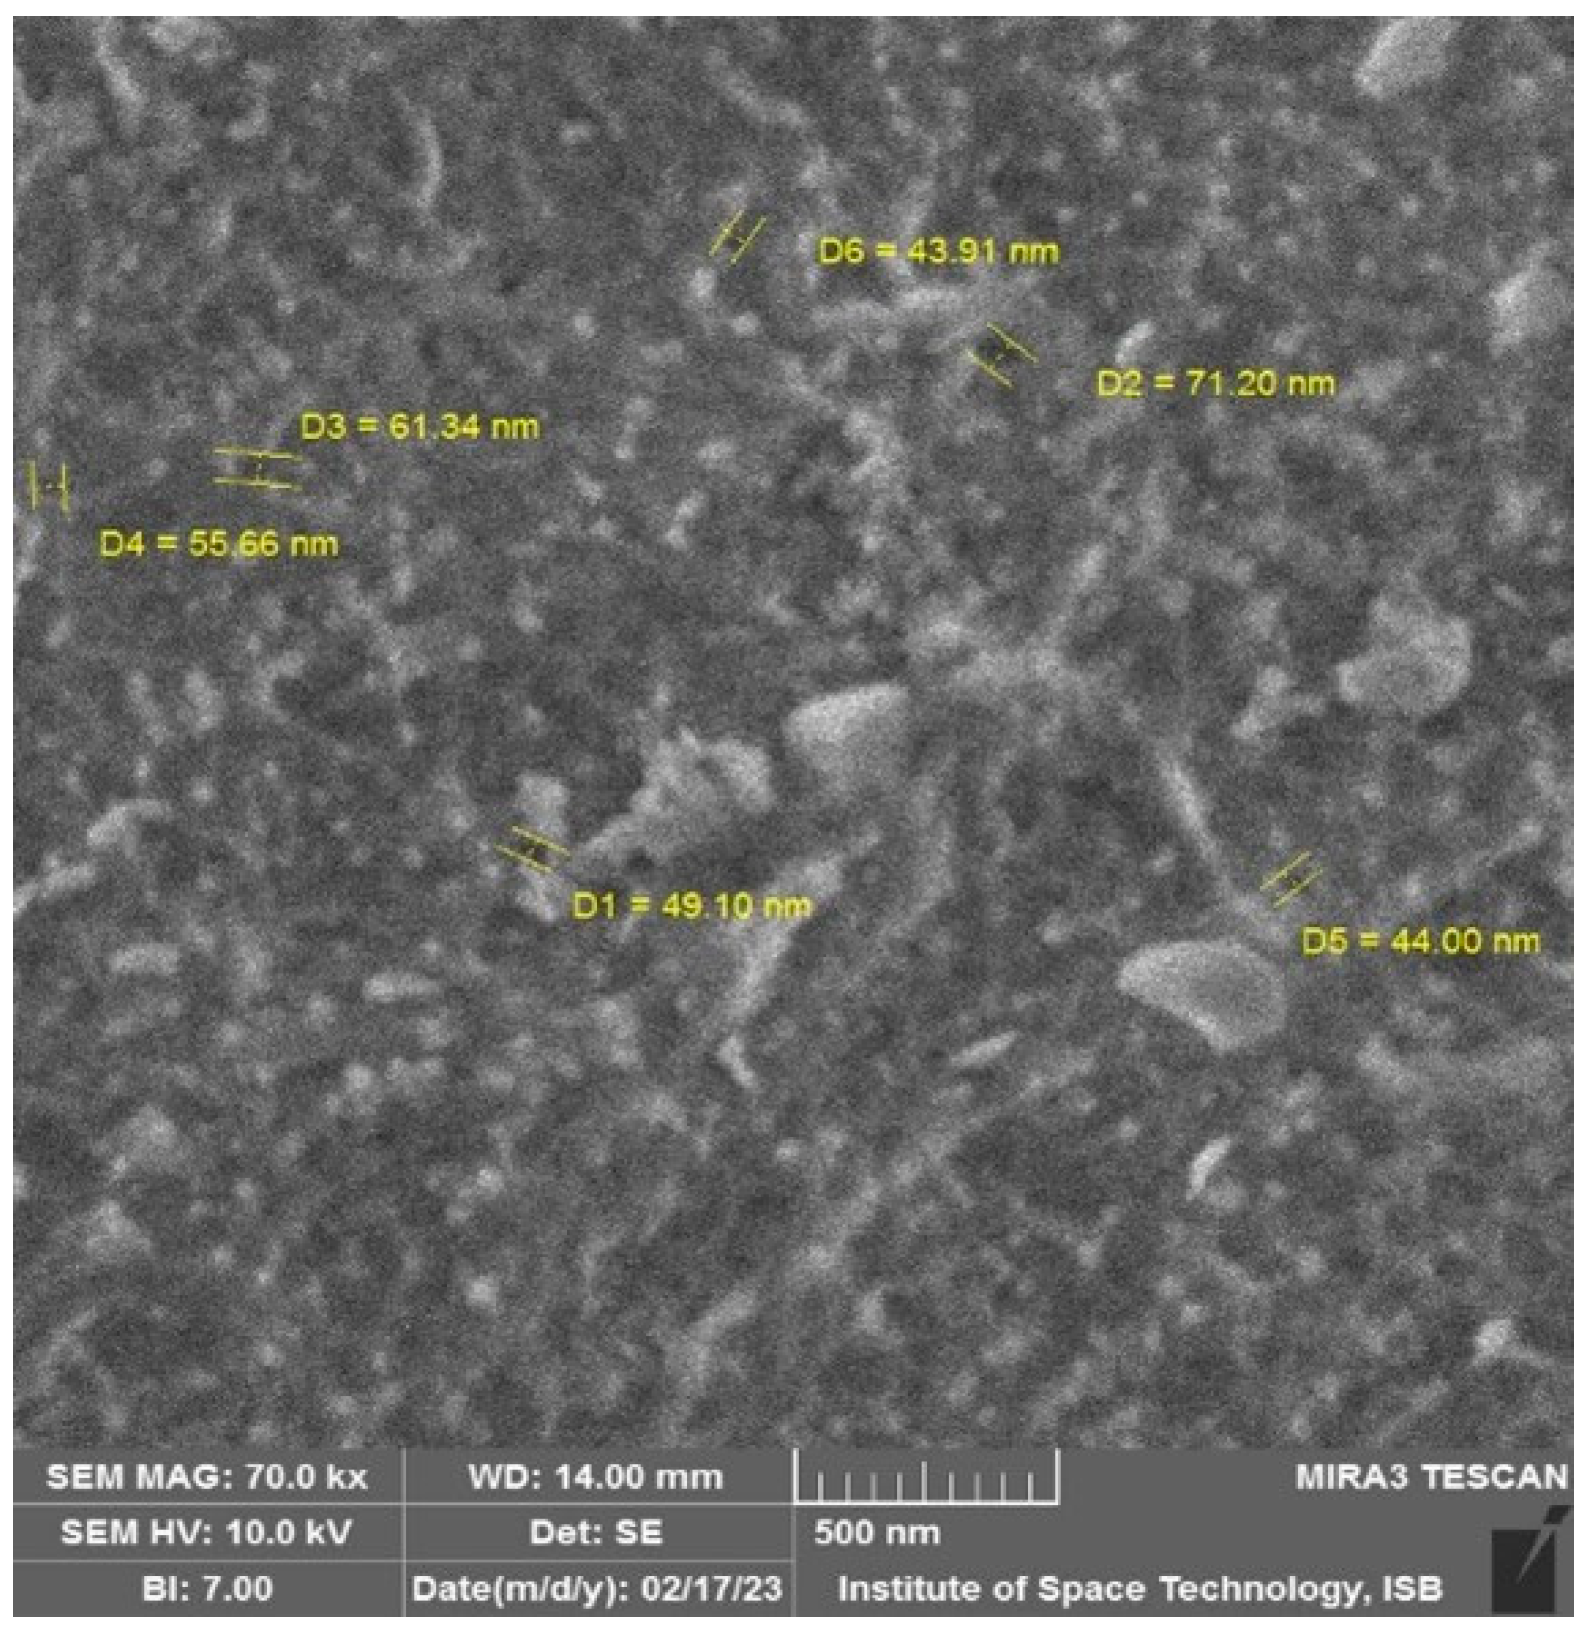
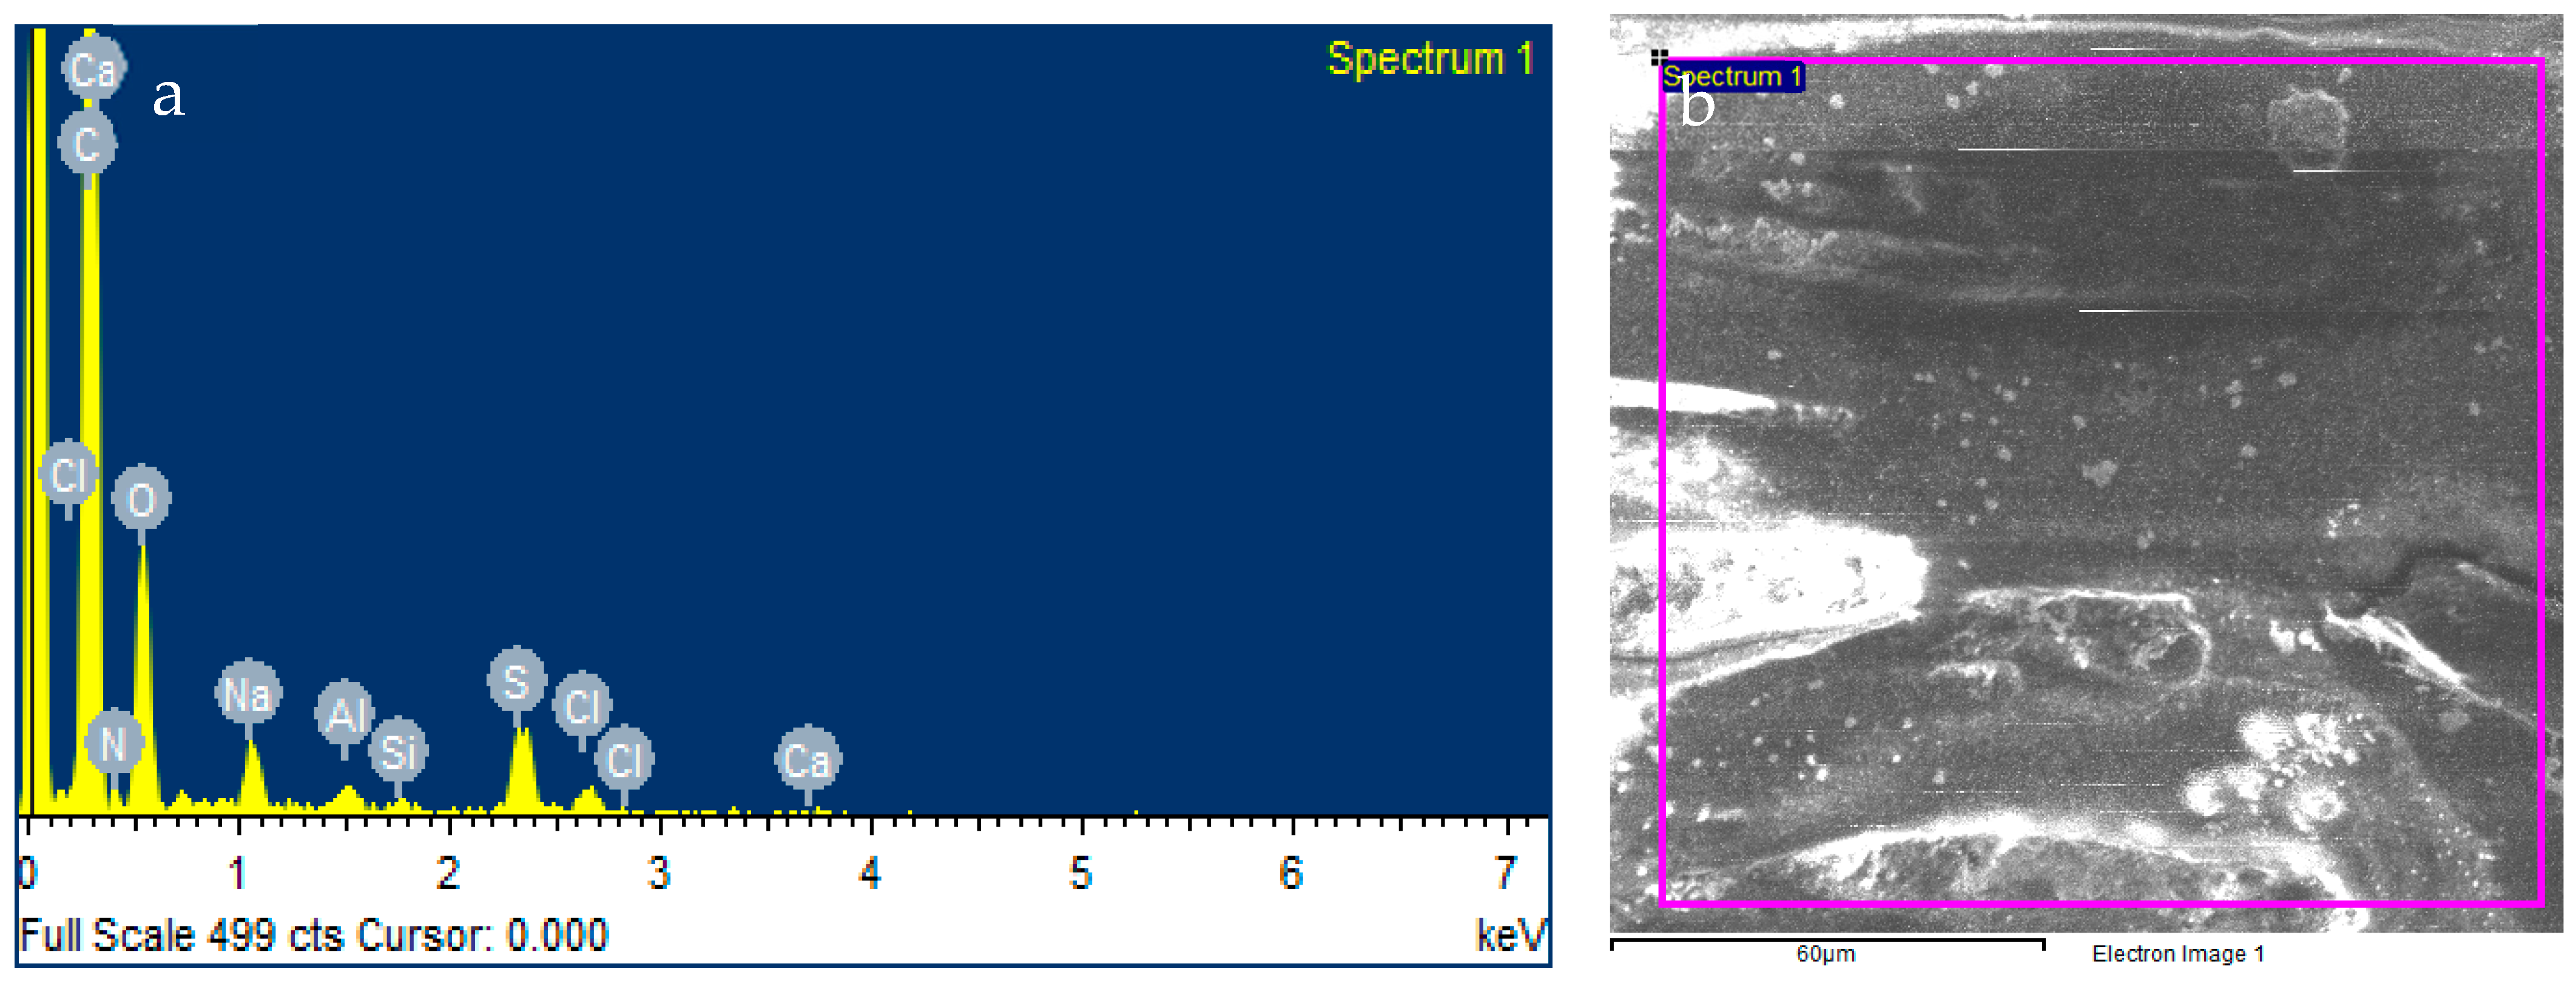
Scanning Electron Microscopy (SEM) Analysis

R-RO membrane samples were prepared and dried at 40 °C. Then, to analyze surface morphology of the membrane after chlorine exposure, SEM analysis was conducted using the SEM (model: MIRA3 TESCAN) from the Institute of Space Technology (IST), Islamabad. Then, pore size was determined using the same software. These high-resolution micrographs provide the results to evaluate the surface and were compared with the recycled RO membrane. Energy Dispersive X-ray Analysis (EDX) was also measured to know the concentration of different elements’ presence [35,36].

3. Results and Discussion

3.1. RO to R-RO (Degradation of Polyamide PA Layer)

The RO spent membrane showed a 20% water recovery percentage and a very high saltwater rejection percentage of 94%, 95%, and 96% on TW, ICW-P, and MBR-P, respectively, as shown in Figure 3 at the start of the study. After 6 years, the membrane still exhibited a considerable amount of saltwater rejection % but a low water recovery %.
Figure 4 shows that upon the first run of the plant at 1200 mL of NaOCl, water recovery increased from 20 to 56% but the saltwater rejection decreased to 52% which means the still PA layer exists and needs more chlorine exposure to further degrade the layer and expose the polysulfone (PSF) layer. A similar study observed that low exposure of chlorine at 50–1000 ppm/h caused an increase in the membrane permeability without reducing the saltwater rejection % of the RO membrane, which was conducted by Garcia [37].
Then, after the second run, the saltwater rejection % was 1%, and water recovery increased up to 67% which means the PA layer had been degraded and the PSF had been exposed. Now, it is known as a Recycled RO membrane (R-RO), and it lies between virgin RO and the UF membrane because of its performance. The R-RO performance remained consistent on all sources of water in terms of rejection %, but an increase in the water recovery with time has been observed. It was 67% for TW, 68% for ICW-P, and 74% for MBR-P, respectively, as depicted in Figure 5.
Another study on UF spiral wounds was conducted by Mierzwa et al. using the Guarapiranga Reservoir, a eutrophicated body, as a source which revealed that virgin UF showed 85% water recovery and 95% removal of turbidity [38] which is comparable with the recycled RO that showed a maximum of 74% water recovery. It is further enhanced with proper cleaning and backwashing.

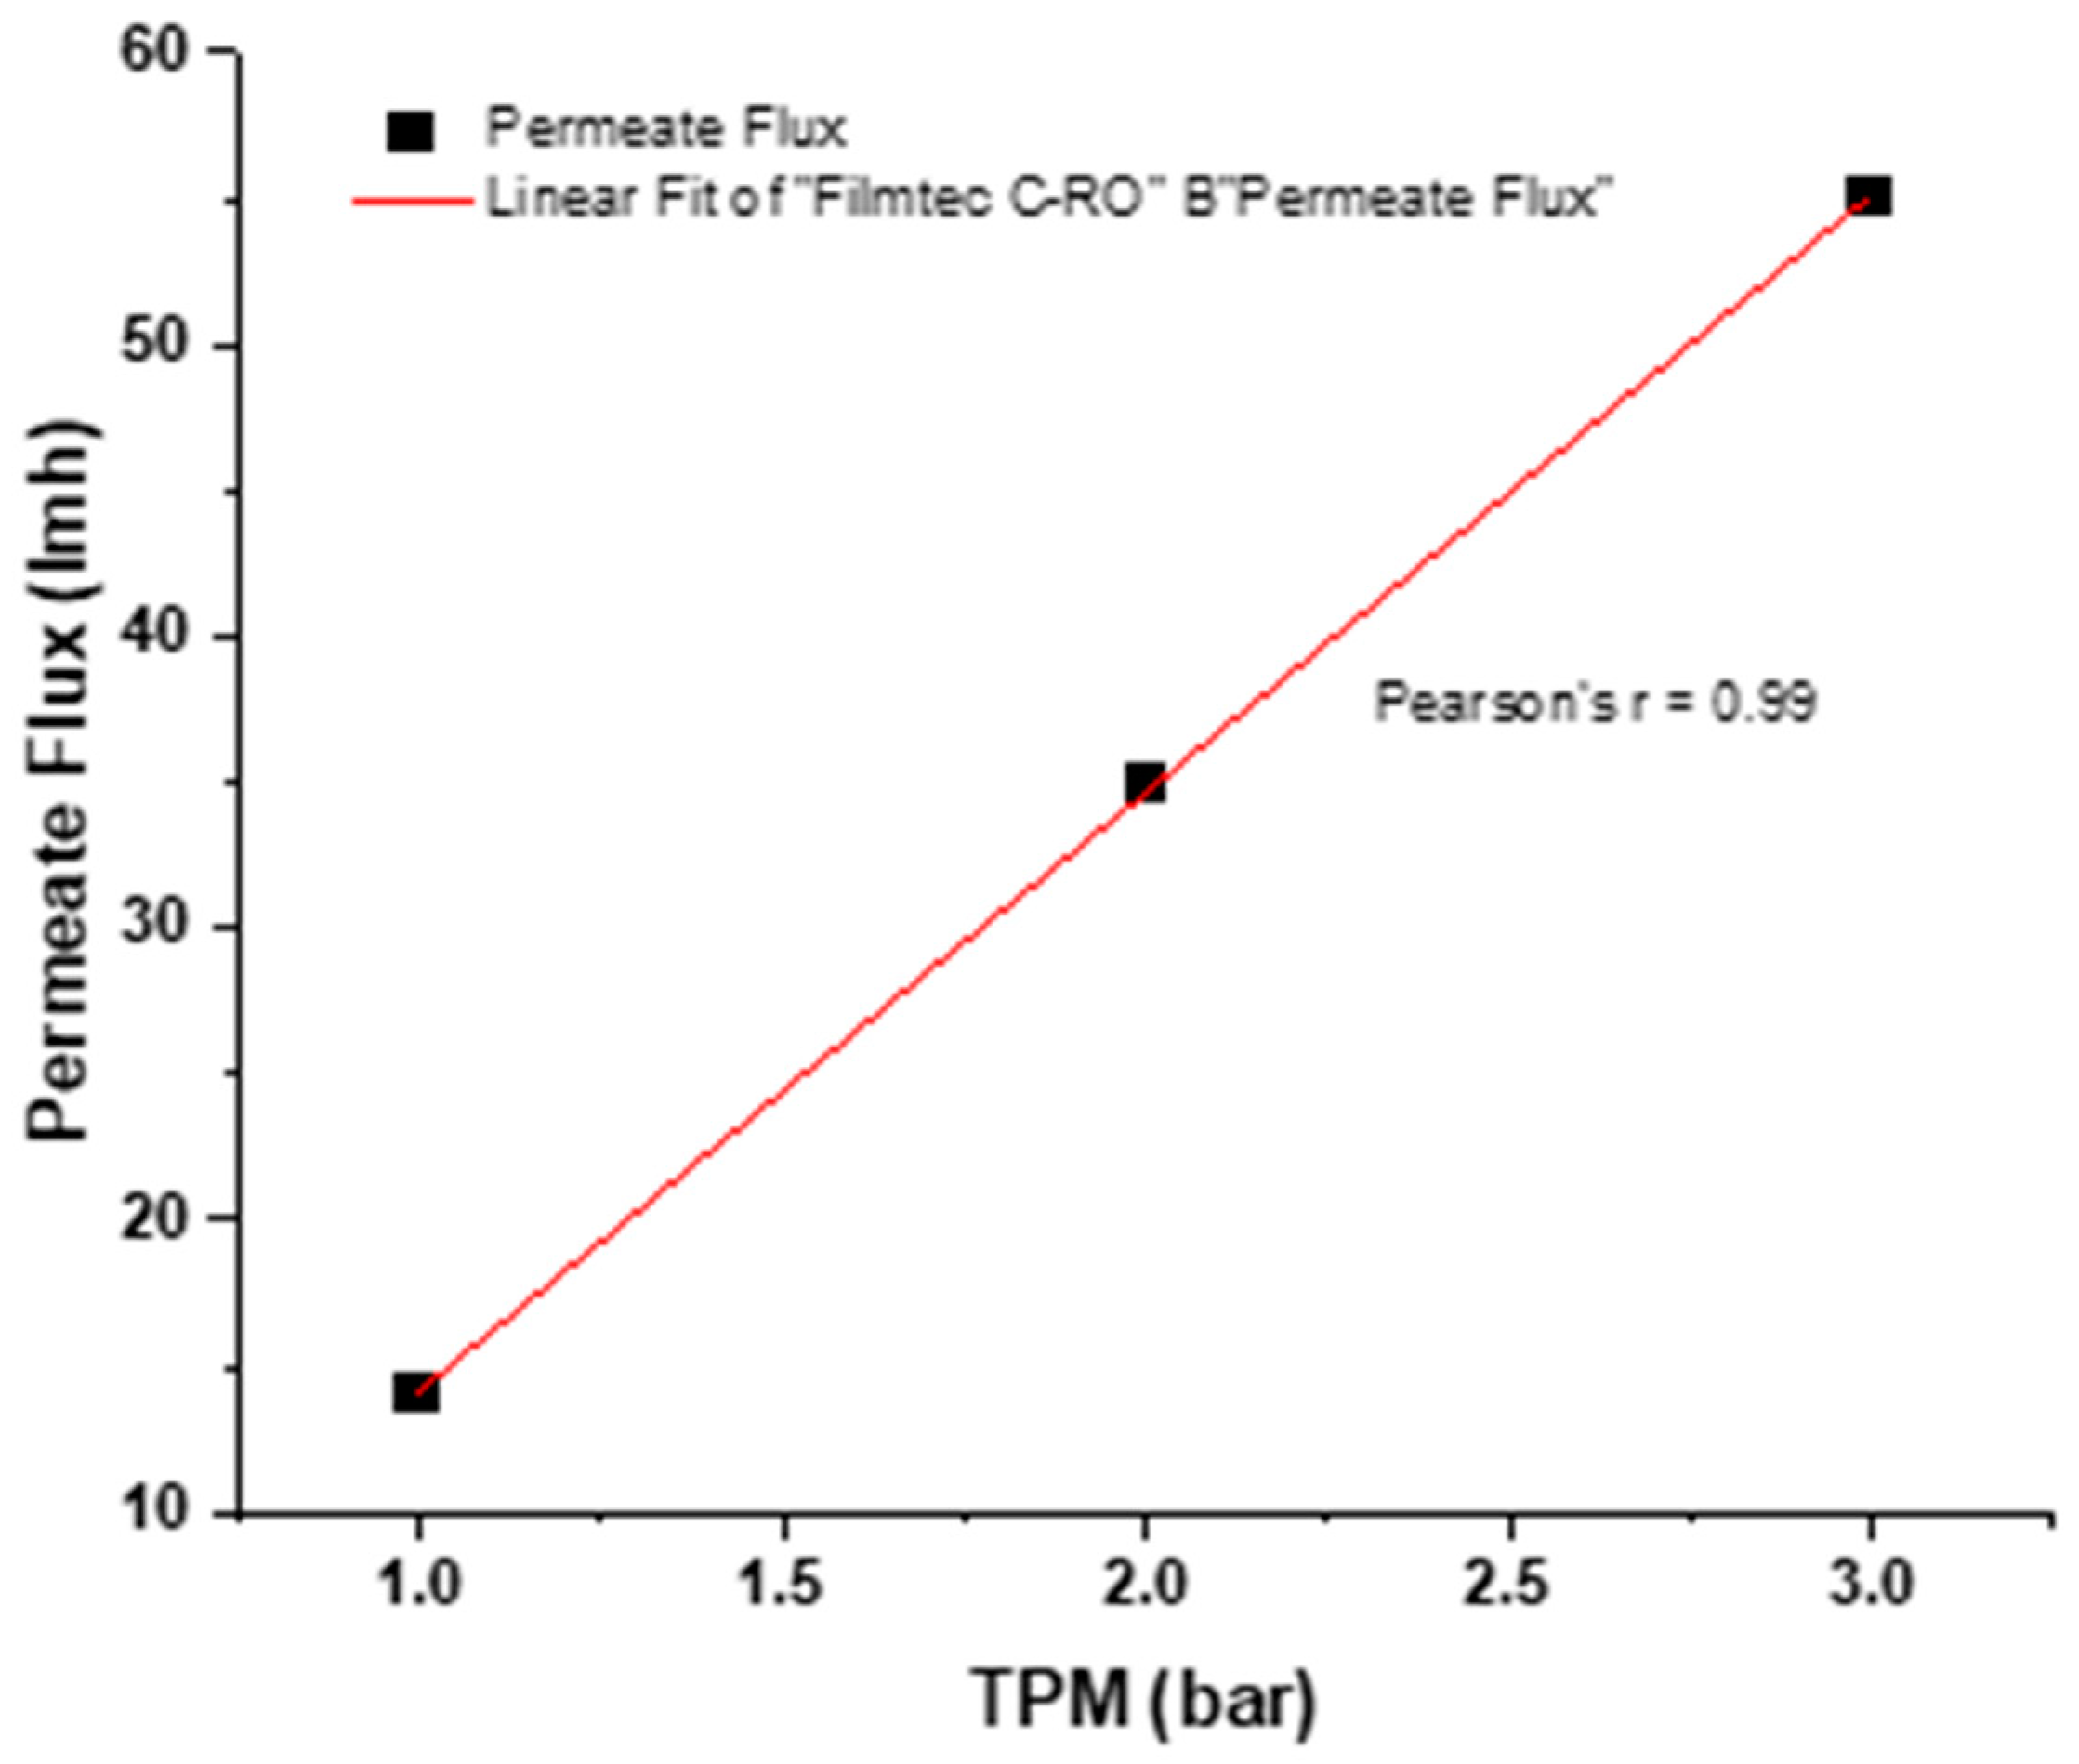
3.2. R-RO Permeate Flux and TMP

With the increase in TMP, a higher permeate flux rate was observed. At 1 bar, permeate flux was 14 lmh; at 2 bars, it was 35 lmh; and at 3 bars, it spiked to 55 lmh, respectively, as shown in Figure 6. The higher permeability of R-RO can be attributed to the exposure of chlorine 300,000 ppm/h and complete degradation of the PA layer [39]. It was observed that of the various foulants the membrane encountered while operating, the efficiency of the cleaning and the conversion process all contributed to the difference in converted membrane permeability.

3.3. SEM Analysis of R-RO Membrane

The micrograph of the recycled RO membrane in Figure 7 shows the removal of the polyamide layer and large pore sizes. After 10 h of exposure with sodium hypochlorite solution, the PA layer has been removed, similar to the membrane morphology presented in a study [31].
Figure 8 shows that the pore size range of R-RO membrane at 500 nm magnification is the same as UF membrane. Figures S3–S5 in supplementary information shows R-RO membrane at 1000 nm, 2000 nm and 500 nm respectively. One of the previous studies showed that UF membrane pore size usually ranges between 1 and 100 nm depending on the different brands of the membrane. Therefore, an end-of-life RO membrane has been converted into recycled RO or a converted UF membrane [40].
While in Figure 9 the SEM-EDX analysis of the sample shows the weight percent and atomic percent of various elements present in it, the analysis reveals that the sample is primarily composed of carbon (C) and nitrogen (N), with weight percentages of 38.21% and 37.24%, respectively. Oxygen (O) is the third most abundant element, with a weight percentage of 22.21%.
Other elements present in the sample include sodium (Na), aluminum (Al), silicon (Si), sulfur (S), chlorine (Cl), and calcium (Ca), with weight percentages ranging from 0.02% to 0.87% in Table 4. The atomic percentages of these elements are also provided for reference. These results can provide insights into the composition and potential applications of the sample, which can be further investigated in future studies. These elements can be validated from previous research [41,42].

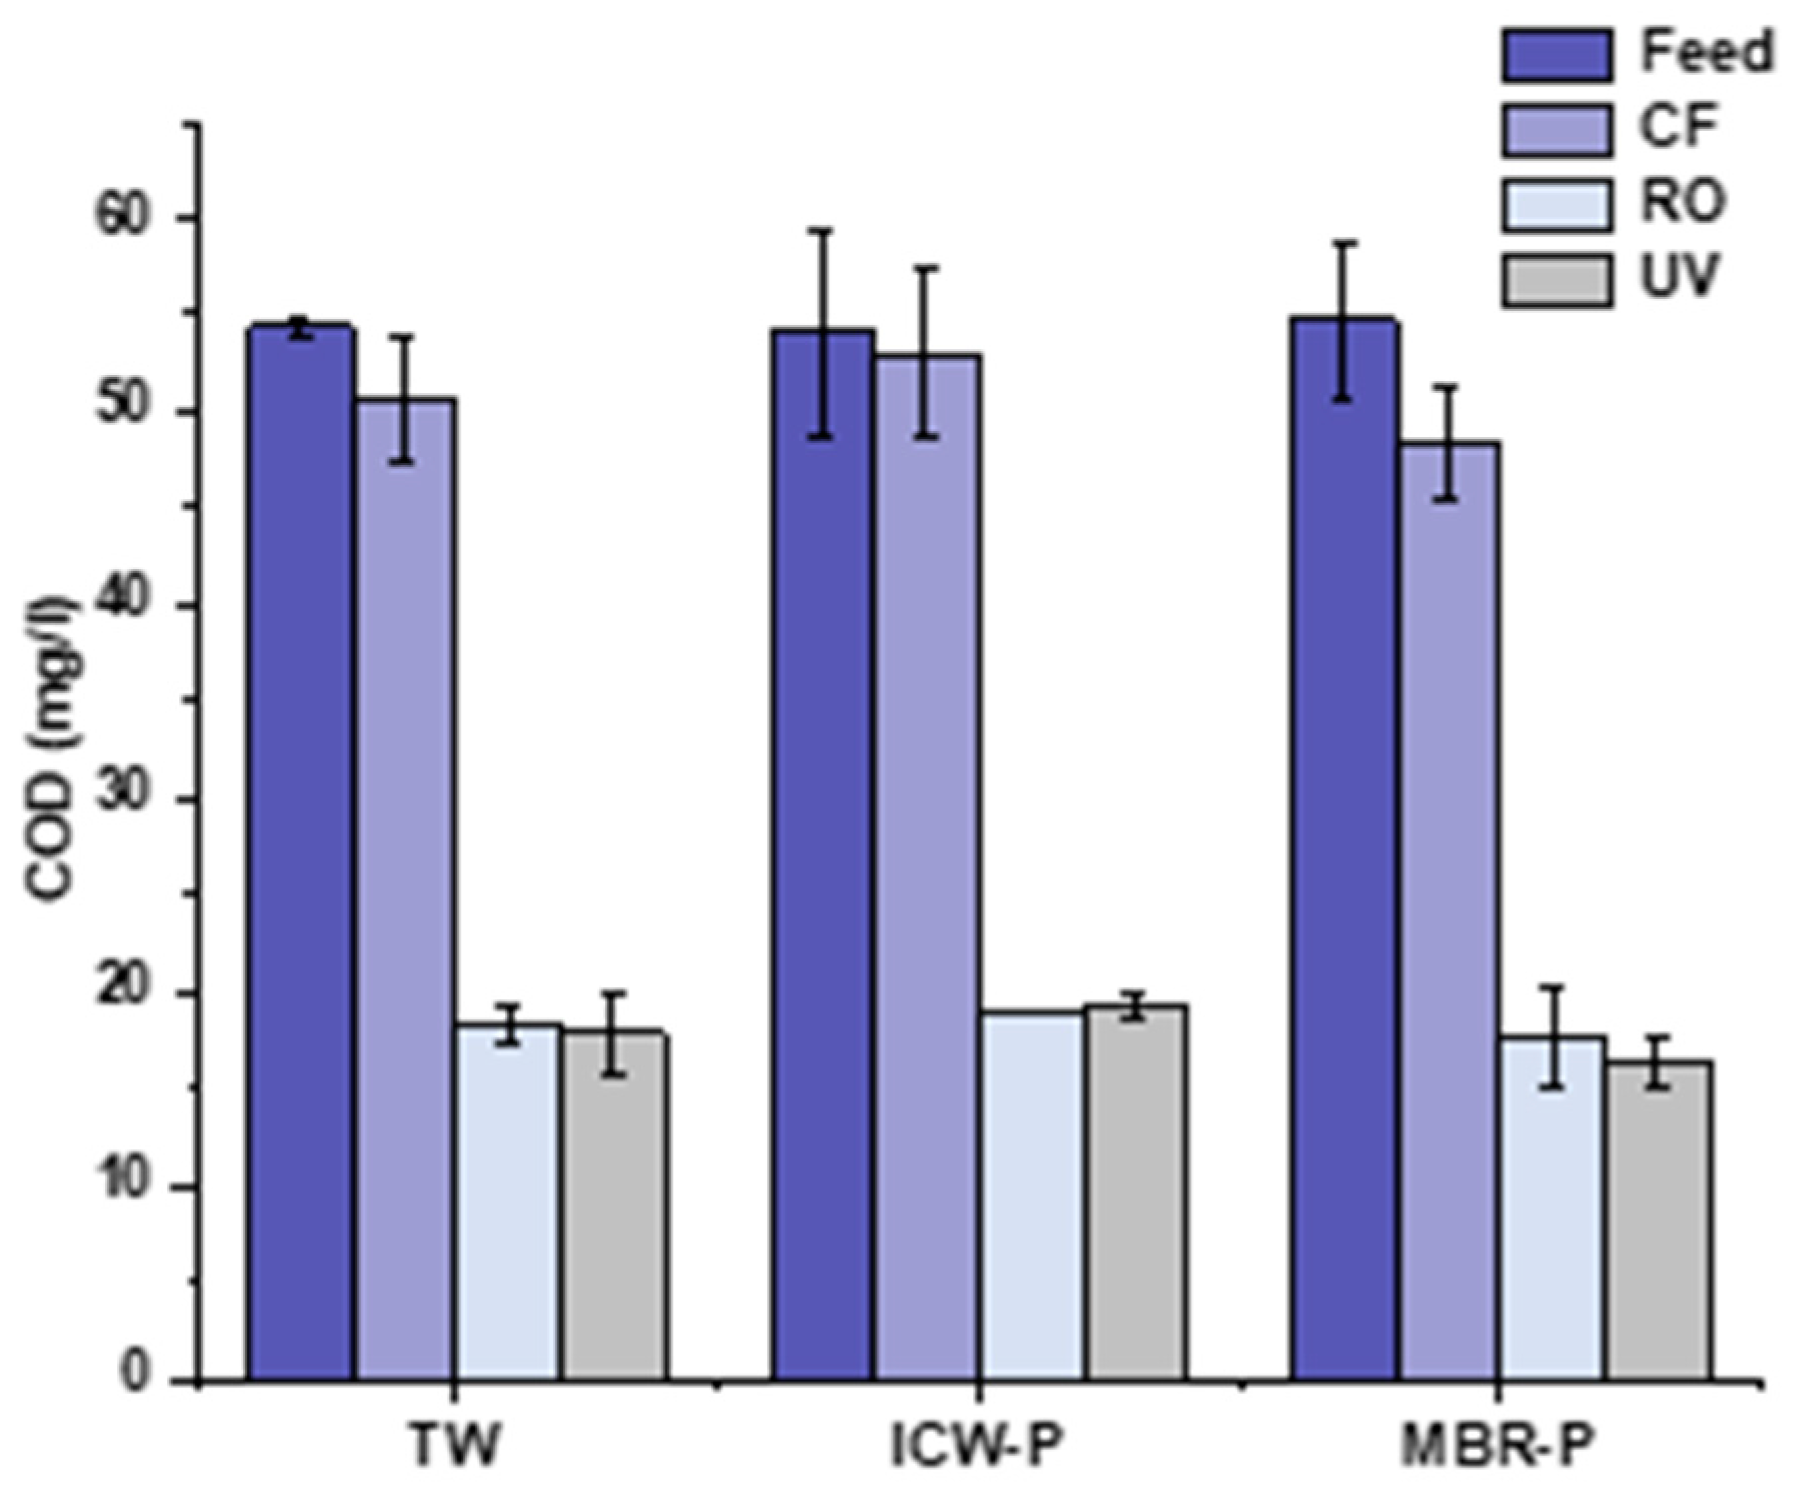
3.4. Physicochemical and Microbial Parameters

The R-RO membrane showed an excellent removal of COD efficiency as shown in Figure 10. In the feed of tap water, COD was 52 mg/L, with a slight decrease after passing through the cartridge filter (CF) of 43 mg/L, of 18 mg/L for COD after passing through the recycled RO, and of 17.7 mg/L after the UV lamp. A 65.79% COD reduction has been observed after the R-RO membrane. In all three runs, the performance of the membrane remained consistent in the tap water, which reiterates a higher capacity to remove the contaminants sustained inside the membrane.
In ICW-P feed water, the COD was 54 mg/L, with a minor change after CF 52 mg/L, and was 20 mg/L after passing through the R-RO membrane with a 62.96% COD removal efficiency, and after a UV reading, 19 mg/L was observed.
In MBR-P water used as feed, the COD was recorded as 54 mg/L, followed by 48 mg/L, 17 mg/L, and 17 mg/L in CF, R-RO, and UV, respectively, with 67.72% COD removal efficiency after passing through the membrane. It is the highest COD percentage removal found among three sources of water used in the study. Sumisha et al. checked the ultrafiltration membrane on the laundry wastewater and its capability of COD reduction efficiency which showed that the polyethersulfone (PES) membrane achieved 88% COD removal with 10% added PVP, while the R-RO membrane has expressed a challenging COD percentage reduction across the sources of water operated on in contrast with virgin UF membrane [43].
Liu et al. found out that the virgin RO membrane showed a COD less than 10 mg/L being tested, and also the COD removal % rate varies from 90 to 94% [44] while the R-RO COD removal % reduction in comparison to virgin RO can be attributed to the PA layer depletion and more fouling with the time on the membrane surface.

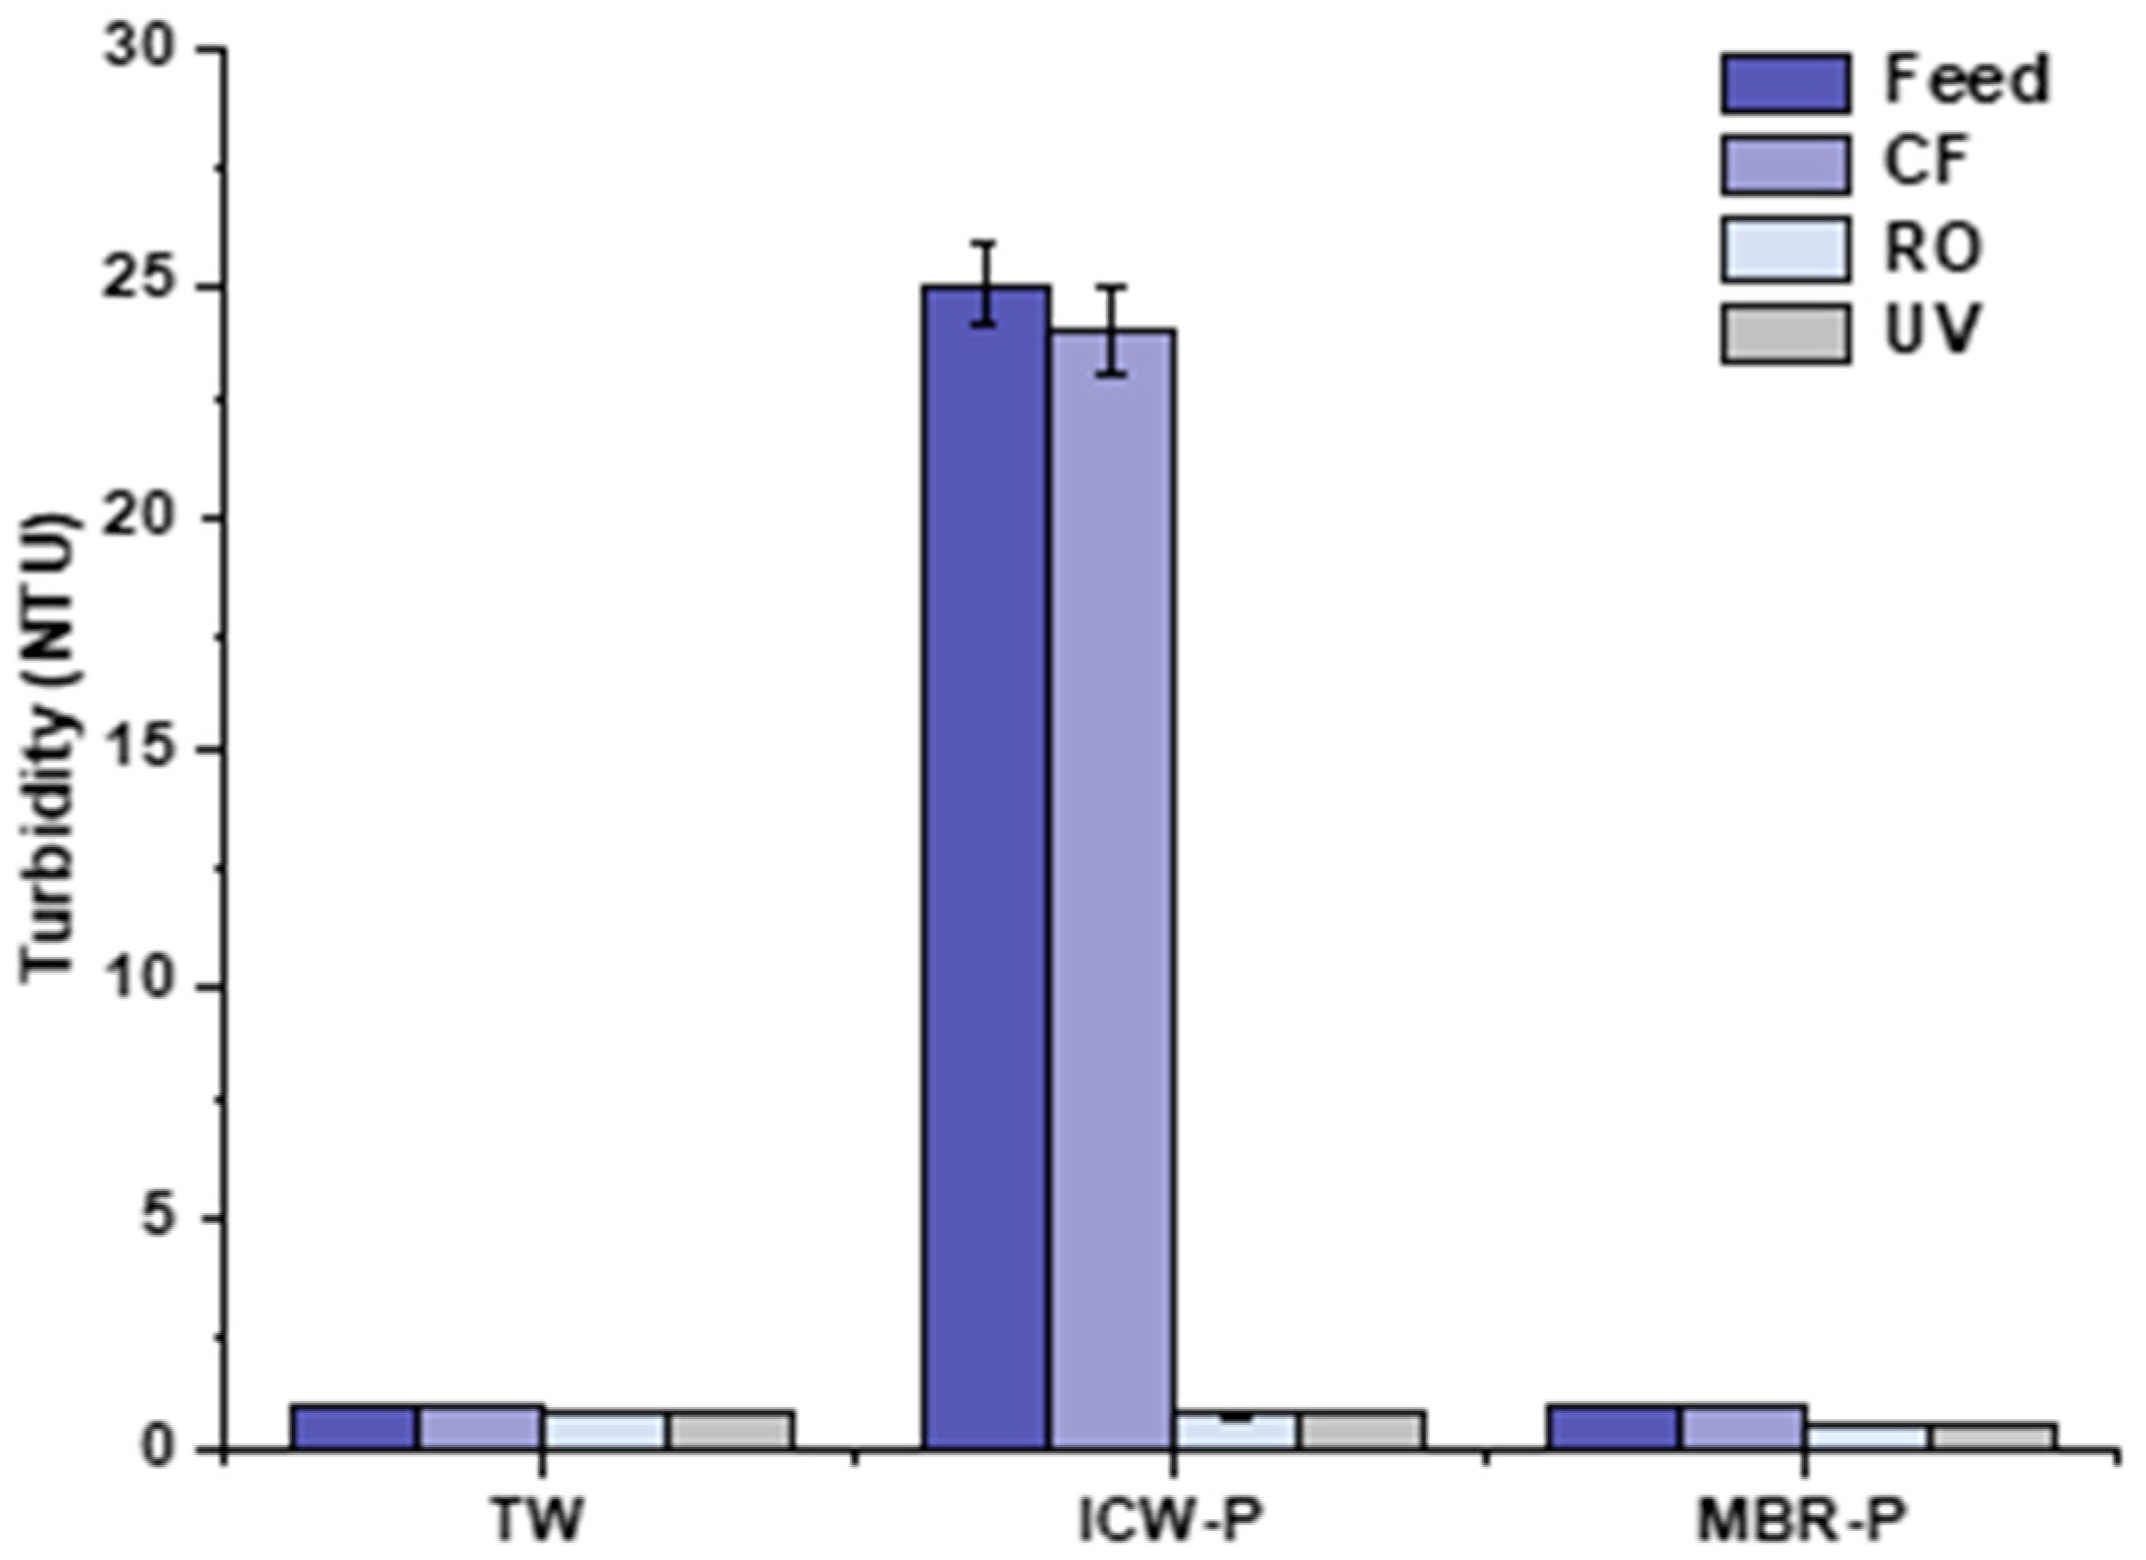
3.5. Turbidity Removal %

The turbidity removal is depicted in Figure 11. In the TW feed water, it was <1 NTU and remained less than 1 passing through CF, R-RO, and UV, respectively, while during the ICW-P run, the highest turbidity was observed as 25 NTU, followed by 24 NTU after the CF and 1 NTU after the R-RO membrane, and it remained the same after UV as well. The Filmtec R-RO demonstrated removal of 96% by removing all the suspended solids present in the integrated constructed wetland permeate (ICW-P). This performance of the recycled RO membrane is comparable with the virgin UF in terms of turbidity removal percentage, as Zulaikha et al. in the study reported UF (PES-10 kDa) used to treat the wastewater and demonstrated 99% turbidity removal while the Filmtec recycled RO membrane showed 96% removal. The efficacy of the recycled RO membrane is comparable with the virgin UF in terms of turbidity removal percentage [45].

3.6. Total Coliforms Removal %

The MPN results in Table 5 demonstrated the presence of total coliforms more than >23 CFU/100 mL with a 13-confidence limit in the feed. The second stage CF did not show any removal, while the R-RO membrane showed all negative tubes, and the index shows a confidence level of 3.4 and 100% total coliform removal in all three sources of TW, ICW-P, and MBR-P water.
The reason tap water results were similar is because of its source distance from the integrated constructed wetland ICW since its inception which shows evidence of groundwater contamination due to ICW operation. In the feed water of ICW-P and MBR-P, homogeneous results were found, and no microbial contamination was detected after R-RO membrane.
All water sources after passing through the recycled RO membrane were found to meet the WHO’s [46] standards and Pakistan’s National Standards for Drinking Water Quality (NSDWQ) limits [47]. In the case of tap water(TW) for drinking purposes and as wastewater effluent discharge for the integrated constructed wetland permeate (ICW-P) and membrane bio-rector permeate (MBR-P) is shown in Table 6.
The findings of the study emphasize that the resource (discarded RO membrane) has recovered, which contributes to the circular economy in the membrane technology field. Used RO membranes would otherwise end up in landfills, creating a huge burden operated at the pilot scale plant. Such R-ROs can be utilized by developing nations, and refined water can be obtained with a turbidity of <1 NTU, 100% removal of the total coliforms, and nitrate and pH being also under the prescribed WHO limits [48]. Detailed graphs of pH and nitrites can be found in Figures S1 and S2.
The sodium hypochlorite (NaOCl) exposure for 10 h also showed that the membrane remained consistent in its performance and can be used for drinking water purposes and for wastewater treatment polishing steps to further remove the bacterial contamination with the minimum resources utilization. The recycled RO membrane can be used in the replacement of the UF spiral wound membrane, which is the most economical and sustainable approach to reduce waste generation and recover the resource for the same usage. According to a study by Paula et al., replacing the UF spiral-wound membrane which has 5 years of life for water treatment with a recycled RO membrane with a life of 2 years provides 98.9% economic benefits [49]. Additionally, it is concluded that R-RO membranes have a potential to provide greater economic and environmental benefits while reducing waste [11,39,50].
This study proves recycled RO membrane’s effectiveness, performance on three sources of water, and resource recovery that can bring a lot of benefits to developing nations, if used membrane at a lower cost sells to them, instead of landing in landfills.

4. Conclusions

Previous research has been conducted on the conversion of recycled RO membranes to UF and being tested for different sources of feed as well. This study brings novelty by testing the converted R-RO membrane on the integrated constructed wetland permeate ICW-P and membrane bioreactor permeate MBR-P.
  • Conversion of R-RO using the same concentration of NaOCl for 10 h depicted no variation in the results, and pH also remained constant.
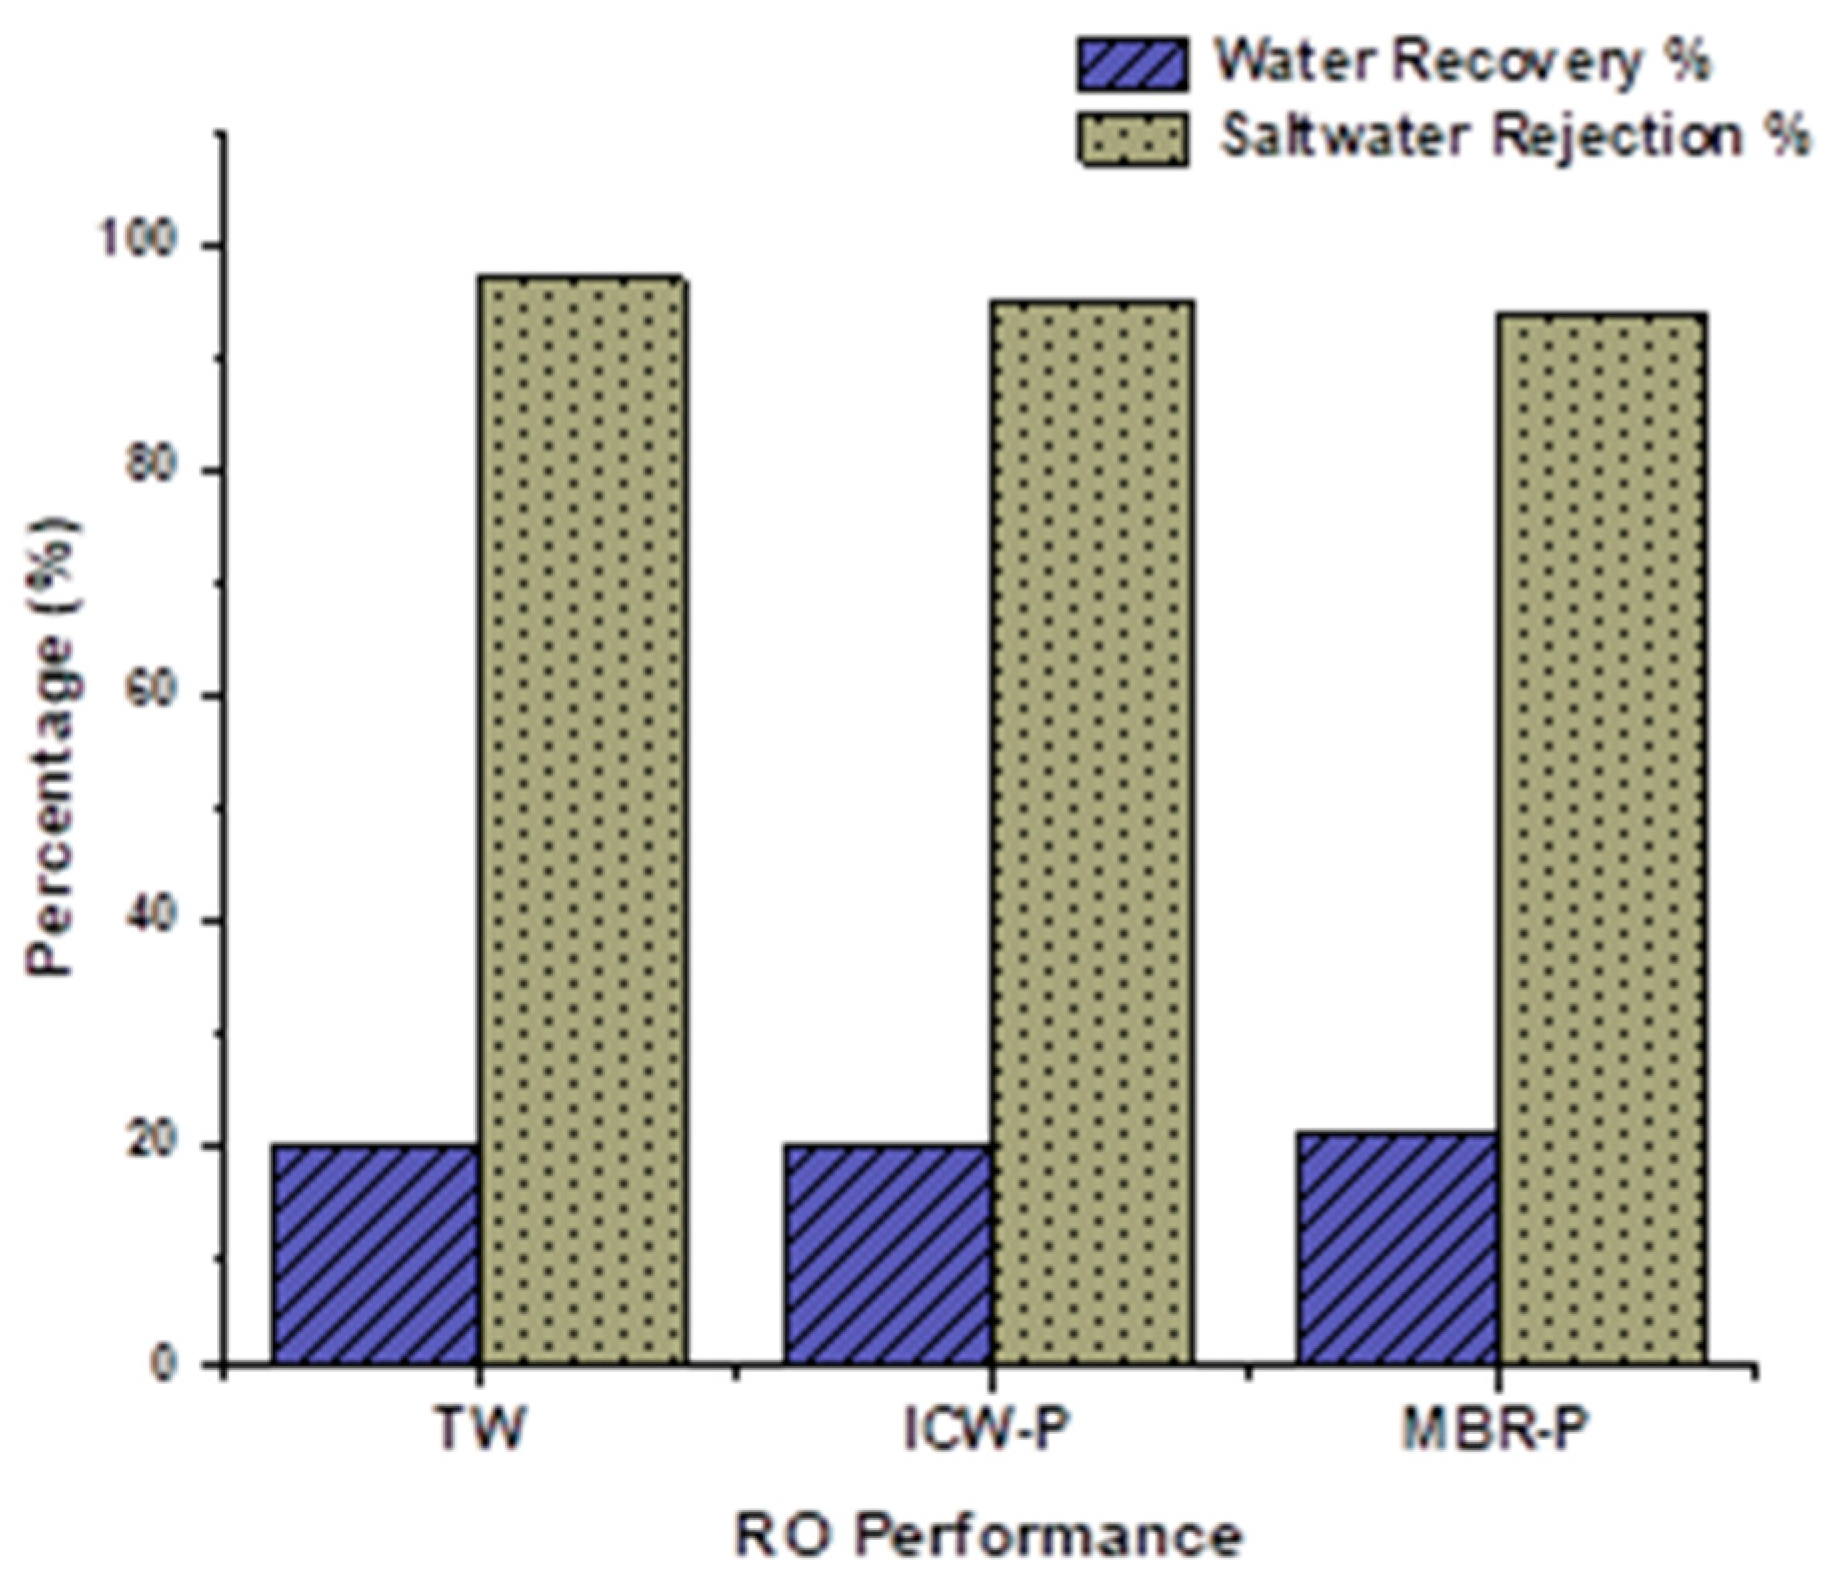
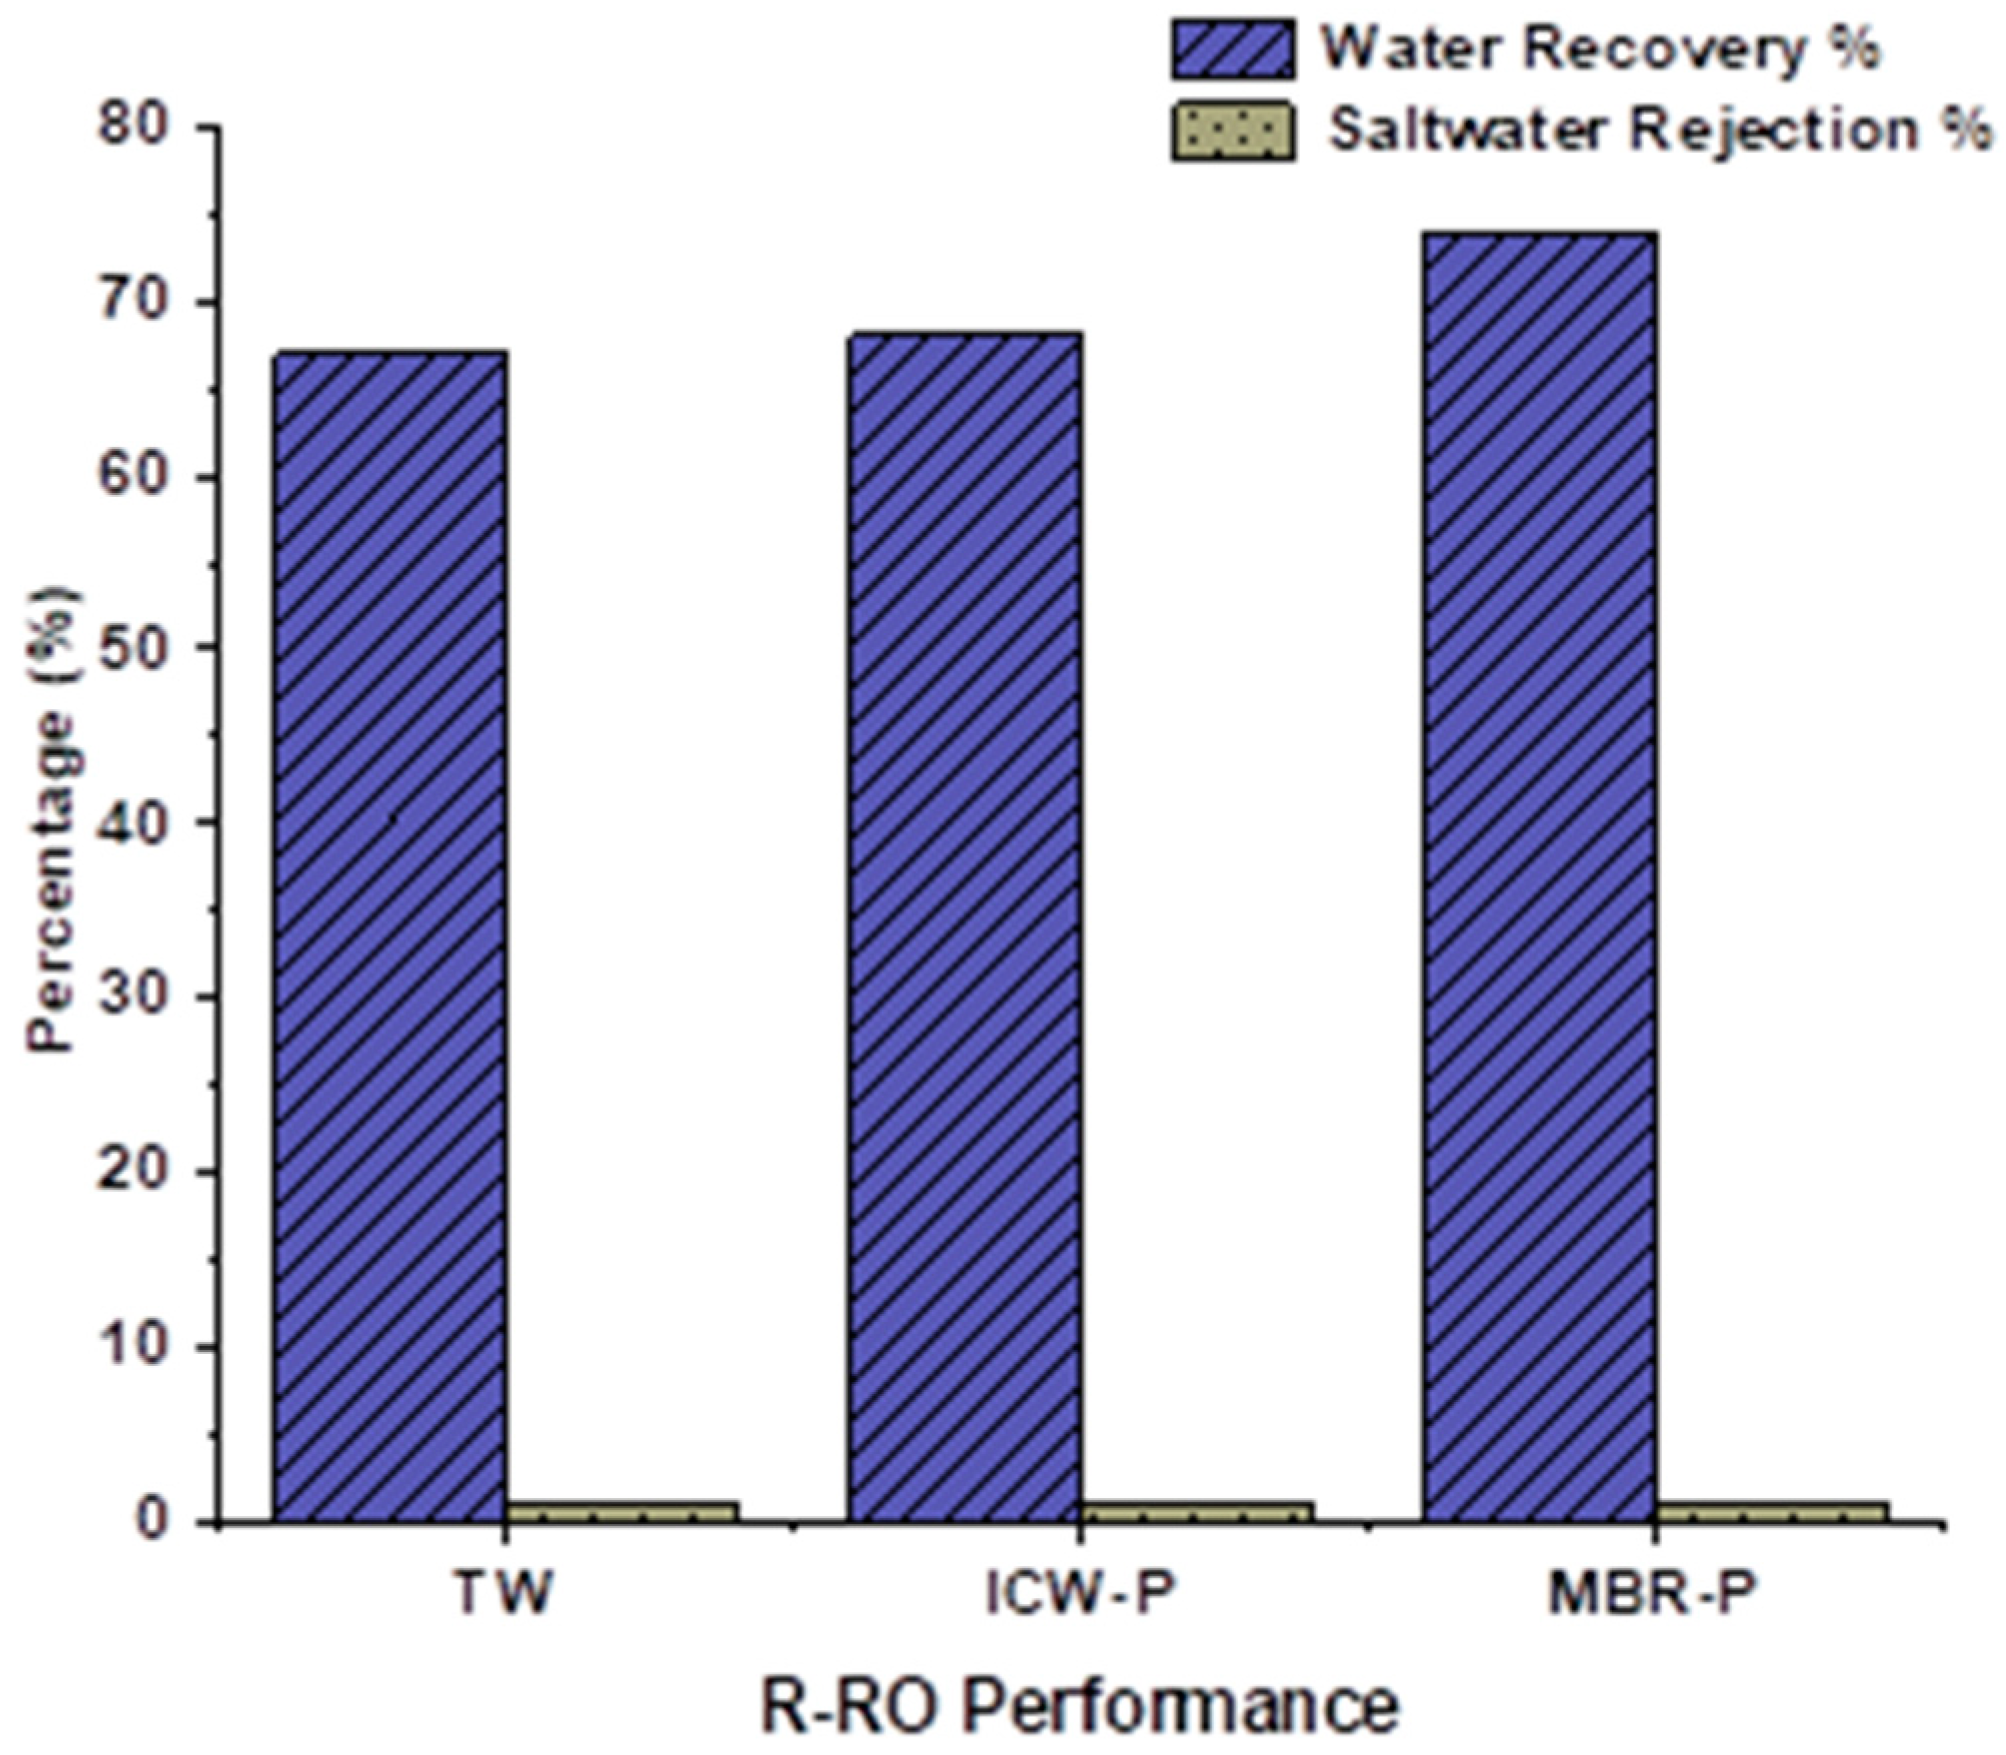
  • R-RO membranes proved to be very effective on TW, ICW-P, and MBR-P in terms of water recovery % that can be compared with the virgin UF spiral wound membrane.
  • It also demonstrated an unprecedented turbidity removal percentage of 95% which is exactly equal to UF performance in some studies in the literature.
  • The COD removal percentage was observed to be up to 67% using the R-RO membrane, which is in accordance with converted RO membranes in the literature.
  • The highest number of total coliforms were present in all of the feed water from (TW, ICW-P, and MBR-P), but R-RO ensured it was safe for use by eliminating all of the total coliforms with a 95% confidence level.
  • It proved to be an economically viable, environmentally friendly, and sustainable approach to convert the RO-used membranes and utilize them for water treatment of these origins because its product water is under the drinking water limits for TW and effluent discharge limits for ICW-P and MBR-P of the WHO and Pakistan’s NSDWQ (National Standards for Drinking Water Quality) and NEQS (National Environmental Quality Standards), respectively.
  • Developing countries can leverage this by importing the used RO membrane from the developed nations and play a pivotal role in the reduction of waste and transition towards the circular economy.

Supplementary Materials

The following supporting information can be downloaded at: https://www.mdpi.com/article/10.3390/membranes13070628/s1, Figure S1: Average pH removal efficiency in TW, ICW-P and MBR-P using R-RO membrane (mentioned under heading of pH results in the supplementary materials document), Figure S2: Average nitrate removal efficiency in TW, ICW-P and MBR-P using R-RO membrane (mentioned under heading of nitrate results in the supplementary materials document), Figure S3: SEM micrographs at 1000 magnification (a) sample one (b) sample two (c) sample three of R-RO (mentioned under heading of SEM analysis at different resolutions in the supplementary materials document), Figure S4: SEM micrographs at 2000 magnification (a) sample one (b) sample two (c) sample three of R-RO (mentioned under heading of SEM analysis at different resolutions in the supplementary materials document), Figure S5: SEM micrographs at 500 nm scale (a) sample one (b) sample two (c) sample three of R-RO (mentioned under heading of SEM analysis at different resolutions in the Supplementary Materials document). References [51,52,53] are listed in Supplementary Materials.

Author Contributions

Conceptualization, H.A., S.J.K. and N.K.K.; Funding acquisition, H.A.; Methodology, Z.U.R. and S.J.K.; Resources, S.J.K.; Supervision, H.A.; Validation, A.A.K.; Writing—review and editing, Z.U.R., M.Y. and A.A.K. All authors have read and agreed to the published version of the manuscript.

Funding

This pilot scale study was supported by the National University of Science and Technology (NUST) through research grant fund for MS degree students.

Data Availability Statement

The data presented in this study are available on request from the corresponding author. The data are not publicly available due to maintaining and limiting the research to the trustable and reliable research journals only.

Conflicts of Interest

The authors declare no conflict of interest.

References

  1. Angelakis, A.N.; Valipour, M.; Choo, K.-H.; Ahmed, A.T.; Baba, A.; Kumar, R.; Toor, G.S.; Wang, Z. Desalination: From ancient to present and future. Water 2021, 13, 2222. [Google Scholar] [CrossRef]
  2. Drinan, J.E.; Spellman, F. Water and Wastewater Treatment: A Guide for the Nonengineering Professional; CRC Press: Boca Raton, FL, USA, 2012. [Google Scholar]
  3. Greenlee, L.F.; Lawler, D.F.; Freeman, B.D.; Marrot, B.; Moulin, P. Reverse osmosis desalination: Water sources, technology, and today’s challenges. Water Res. 2009, 43, 2317–2348. [Google Scholar] [CrossRef] [PubMed]
  4. Jokinen, L. Optimising Flocculation and Cell Separation of Fermentation Broth with In-Situ Particle Size Analysis; Turku University of Applied Sciences: Turku, Finland, 2022. [Google Scholar]
  5. Kumar, M.; Culp, T.; Shen, Y. Water Desalination: History, Advances, and Challenges. In Frontiers of Engineering Report on Leading-Edge Engineering; The National Academy Press Pennsylvania State University: Philadelphia, PA, USA, 2017. [Google Scholar]
  6. Goh, P.; Ismail, A.; Hilal, N. Nano-enabled membranes technology: Sustainable and revolutionary solutions for membrane desalination? Desalination 2016, 380, 100–104. [Google Scholar] [CrossRef] [Green Version]
  7. Malaeb, L.; Ayoub, G.M. Reverse osmosis technology for water treatment: State of the art review. Desalination 2011, 267, 1–8. [Google Scholar] [CrossRef]
  8. Joo, S.H.; Tansel, B. Novel technologies for reverse osmosis concentrate treatment: A review. J. Environ. Manag. 2015, 150, 322–335. [Google Scholar] [CrossRef]
  9. Najafi, F.T.; Alsaffar, M.; Schwerer, S.C.; Brown, N.; Ouedraogo, J. Environmental impact cost analysis of multi-stage flash, multi-effect distillation, mechanical vapor compression, and reverse osmosis medium-size desalination facilities. In Proceedings of the 2016 ASEE Annual Conference & Exposition, New Orleans, LA, USA, 26 June–28 August 2016. [Google Scholar]
  10. Fang, W.; Shi, L.; Wang, R. Interfacially polymerized composite nanofiltration hollow fiber membranes for low-pressure water softening. J. Membr. Sci. 2013, 430, 129–139. [Google Scholar] [CrossRef]
  11. Landaburu-Aguirre, J.; García-Pacheco, R.; Molina, S.; Rodríguez-Sáez, L.; Rabadán, J.; García-Calvo, E. Fouling prevention, preparing for re-use and membrane recycling. Towards circular economy in RO desalination. Desalination 2016, 393, 16–30. [Google Scholar] [CrossRef]
  12. Ismail, A.; Padaki, M.; Hilal, N.; Matsuura, T.; Lau, W. Thin film composite membrane—Recent development and future potential. Desalination 2015, 356, 140–148. [Google Scholar] [CrossRef]
  13. Camilleri, M.A. Closing the loop for resource efficiency, sustainable consumption and production: A critical review of the circular economy. Int. J. Sustain. Dev. 2018, 21, 1–17. [Google Scholar] [CrossRef]
  14. McCarthy, A.; Dellink, R.; Bibas, R. The Macroeconomics of the Circular Economy Transition: A Critical Review of Modelling Approaches; OECD Publishing: Paris, France, 2018. [Google Scholar]
  15. Goyal, S.; Esposito, M.; Kapoor, A. Circular economy business models in developing economies: Lessons from India on reduce, recycle, and reuse paradigms. Thunderbird Int. Bus. Rev. 2018, 60, 729–740. [Google Scholar] [CrossRef]
  16. Senan-Salinas, J.; Blanco, A.; Garcia-Pacheco, R.; Landaburu-Aguirre, J.; García-Calvo, E. Prospective Life Cycle Assessment and economic analysis of direct recycling of end-of-life reverse osmosis membranes based on Geographic Information Systems. J. Clean. Prod. 2021, 282, 124400. [Google Scholar] [CrossRef]
  17. Bhattacharya, P.; Todi, R.; Tiwari, M.; Bhattacharjee, C.; Bhattacharjee, S.; Datta, S. Studies on ultrafiltration of spent sulfite liquor using various membranes for the recovery of lignosulphonates. Desalination 2005, 174, 287–297. [Google Scholar] [CrossRef]
  18. García-Pacheco, R.; Landaburu-Aguirre, J.; Molina, S.; Rodríguez-Sáez, L.; Teli, S.B.; García-Calvo, E. Transformation of end-of-life RO membranes into NF and UF membranes: Evaluation of membrane performance. J. Membr. Sci. 2015, 495, 305–315. [Google Scholar] [CrossRef]
  19. Ng, Z.C.; Chong, C.Y.; Sunarya, M.H.; Lau, W.J.; Liang, Y.Y.; Fong, S.Y.; Ismail, A.F. Reuse potential of spent RO membrane for NF and UF process. Membr. Water Treat. 2020, 11, 323–331. [Google Scholar]
  20. Ahmed, J.; Jamal, Y. A pilot application of recycled discarded RO membranes for low strength gray water reclamation. Environ. Sci. Pollut. Res. 2021, 28, 34042–34050. [Google Scholar] [CrossRef]
  21. Khaless, K.; Achiou, B.; Boulif, R.; Benhida, R. Recycling of spent reverse osmosis membranes for second use in the clarification of wet-process phosphoric acid. Minerals 2021, 11, 637. [Google Scholar] [CrossRef]
  22. Lawler, W.; Alvarez-Gaitan, J.; Leslie, G.; Le-Clech, P. Comparative life cycle assessment of end-of-life options for reverse osmosis membranes. Desalination 2015, 357, 45–54. [Google Scholar] [CrossRef]
  23. Lee, K.; Jepson, W. Environmental impact of desalination: A systematic review of Life Cycle Assessment. Desalination 2021, 509, 115066. [Google Scholar] [CrossRef]
  24. Rasheed, H.; Altaf, F.; Anwaar, K.; Ashraf, M. Drinking Water Quality in Pakistan: Current Status and Challenges; Pakistan Council of Research in Water Resources, Ministry of Water Resources: Islamabad, Pakistan, 2021. [Google Scholar]
  25. Fida, M.; Li, P.; Wang, Y.; Alam, S.K.; Nsabimana, A. Water contamination and human health risks in Pakistan: A review. Expo. Health 2022, 1–21. [Google Scholar] [CrossRef]
  26. Ahmad, W.; Iqbal, J.; Nasir, M.J.; Ahmad, B.; Khan, M.T.; Khan, S.N.; Adnan, S. Impact of land use/land cover changes on water quality and human health in district Peshawar Pakistan. Sci. Rep. 2021, 11, 16526. [Google Scholar] [CrossRef]
  27. Perveen, S. Drinking water quality monitoring, assessment and management in Pakistan: A review. Heliyon 2023, 9, 13872. [Google Scholar] [CrossRef] [PubMed]
  28. Khanzada, N.; Khan, S.J.; Davies, P. Performance evaluation of reverse osmosis (RO) pre-treatment technologies for in-land brackish water treatment. Desalination 2017, 406, 44–50. [Google Scholar] [CrossRef] [Green Version]
  29. Altaee, A.; Millar, G.J.; Zaragoza, G. Integration and optimization of pressure retarded osmosis with reverse osmosis for power generation and high efficiency desalination. Energy 2016, 103, 110–118. [Google Scholar] [CrossRef] [Green Version]
  30. Talaeipour, M.; Nouri, J.; Hassani, A.; Mahvi, A. An investigation of desalination by nanofiltration, reverse osmosis and integrated (hybrid NF/RO) membranes employed in brackish water treatment. J. Environ. Health Sci. Eng. 2017, 15, 18. [Google Scholar] [CrossRef] [Green Version]
  31. Zheng, X.; Chen, Y.; Zheng, L.; Cheng, R.; Hua, H. Recycling of aged RO membranes as NF/UF membranes: Biosafety evaluation and aging process. Desalination 2022, 538, 115845. [Google Scholar] [CrossRef]
  32. Madaeni, S.; Samieirad, S. Chemical cleaning of reverse osmosis membrane fouled by wastewater. Desalination 2010, 257, 80–86. [Google Scholar] [CrossRef]
  33. Yu, T.; Meng, L.; Zhao, Q.-B.; Shi, Y.; Hu, H.-Y.; Lu, Y. Effects of chemical cleaning on RO membrane inorganic, organic and microbial foulant removal in a full-scale plant for municipal wastewater reclamation. Water Res. 2017, 113, 1–10. [Google Scholar] [CrossRef]
  34. Ang, W.S.; Tiraferri, A.; Chen, K.L.; Elimelech, M. Fouling and cleaning of RO membranes fouled by mixtures of organic foulants simulating wastewater effluent. J. Membr. Sci. 2011, 376, 196–206. [Google Scholar] [CrossRef]
  35. Akin, O.; Temelli, F. Probing the hydrophobicity of commercial reverse osmosis membranes produced by interfacial polymerization using contact angle, XPS, FTIR, FE-SEM and AFM. Desalination 2011, 278, 387–396. [Google Scholar] [CrossRef]
  36. Ashfaq, M.Y.; Al-Ghouti, M.A.; Da’na, D.A.; Qiblawey, H.; Zouari, N. Investigating the effect of temperature on calcium sulfate scaling of reverse osmosis membranes using FTIR, SEM-EDX and multivariate analysis. Sci. Total Environ. 2020, 703, 134726. [Google Scholar] [CrossRef]
  37. García-Pacheco, R.; Landaburu-Aguirre, J.; Lejarazu-Larrañaga, A.; Rodríguez-Sáez, L.; Molina, S.; Ransome, T.; García-Calvo, E. Free chlorine exposure dose (ppm h) and its impact on RO membranes ageing and recycling potential. Desalination 2019, 457, 133–143. [Google Scholar] [CrossRef]
  38. Mierzwa, J.C.; Hespanhol, I.; Da Silva, M.; Rodrigues, L.; Giorgi, C. Direct drinking water treatment by spiral-wound ultrafiltration membranes. Desalination 2008, 230, 41–50. [Google Scholar] [CrossRef]
  39. Lawler, W.; Bradford-Hartke, Z.; Cran, M.J.; Duke, M.; Leslie, G.; Ladewig, B.P.; Le-Clech, P. Towards new opportunities for reuse, recycling and disposal of used reverse osmosis membranes. Desalination 2012, 299, 103–112. [Google Scholar] [CrossRef]
  40. Arkhangelsky, E.; Duek, A.; Gitis, V. Maximal pore size in UF membranes. J. Membr. Sci. 2012, 394, 89–97. [Google Scholar] [CrossRef]
  41. Zhang, X.; Chen, Y.; Konsowa, A.; Zhu, X.; Crittenden, J.C. Evaluation of an innovative polyvinyl chloride (PVC) ultrafiltration membrane for wastewater treatment. Sep. Purif. Technol. 2009, 70, 71–78. [Google Scholar] [CrossRef]
  42. Rabiller-Baudry, M.; Le Maux, M.; Chaufer, B.; Begoin, L. Characterisation of cleaned and fouled membrane by ATR—FTIR and EDX analysis coupled with SEM: Application to UF of skimmed milk with a PES membrane. Desalination 2002, 146, 123–128. [Google Scholar] [CrossRef]
  43. Sumisha, A.; Arthanareeswaran, G.; Thuyavan, Y.L.; Ismail, A.; Chakraborty, S. Treatment of laundry wastewater using polyethersulfone/polyvinylpyrollidone ultrafiltration membranes. Ecotoxicol. Environ. Saf. 2015, 121, 174–179. [Google Scholar] [CrossRef] [PubMed]
  44. Liu, M.; Lü, Z.; Chen, Z.; Yu, S.; Gao, C. Comparison of reverse osmosis and nanofiltration membranes in the treatment of biologically treated textile effluent for water reuse. Desalination 2011, 281, 372–378. [Google Scholar] [CrossRef]
  45. Zulaikha, S.; Lau, W.; Ismail, A.; Jaafar, J. Treatment of restaurant wastewater using ultrafiltration and nanofiltration membranes. J. Water Process Eng. 2014, 2, 58–62. [Google Scholar] [CrossRef]
  46. Al’Afghani, M.M. Legal Frameworks for Transparency in Water Utilities Regulation: A Comparative Perspectiv; Routledge: New York, NY, USA, 2016. [Google Scholar]
  47. Pak, E. National Standards for Drinking Water Quality; Pakistan Environmental Protection Agency, (Ministry of Environment) Government of Pakistan: Islamabad, Pakistan, 2008. [Google Scholar]
  48. World Health Organizati. Guidelines for Drinking-Water Quality; World Health Organization: Geneva, Switzerland, 2004; Volume 1. [Google Scholar]
  49. de Paula, E.C.; Amaral, M.C.S. Environmental and economic evaluation of end-of-life reverse osmosis membranes recycling by means of chemical conversion. J. Clean. Prod. 2018, 194, 85–93. [Google Scholar] [CrossRef]
  50. Yusuf, A.; Sodiq, A.; Giwa, A.; Eke, J.; Pikuda, O.; De Luca, G.; Di Salvo, J.L.; Chakraborty, S. A review of emerging trends in membrane science and technology for sustainable water treatment. J. Clean. Prod. 2020, 266, 121867. [Google Scholar] [CrossRef]
  51. Donose, B.C.; Sukumar, S.; Pidou, M.; Poussade, Y.; Keller, J.; Gernjak, W. Effect of pH on the ageing of reverse osmosis membranes upon exposure to hypochlorite. Desalination 2013, 309, 97–105. [Google Scholar] [CrossRef]
  52. Ward, M.H.; Jones, R.R.; Brender, J.D.; de Kok, T.M.; Weyer, P.J.; Nolan, B.T.; Villanueva, C.M.; van Breda, S.G. Drinking Water Nitrate and Human Health: An Updated Review. Int. J. Environ. Res. Public Health 2018, 15, 1557. [Google Scholar] [CrossRef] [PubMed] [Green Version]
  53. Xie, L.; He, X.; Liu, Y.; Cao, C.; Zhang, W. Treatment of reverse osmosis membrane by sodium hypochlorite and alcohols for enhanced performance using the swelling-fastening effect. Chemosphere 2022, 292, 133444. [Google Scholar] [CrossRef] [PubMed]
Figure 1. Process flow diagram (1) Feed tank, (2) Submersible feed pump, (3) Cartridge filters 10 and 5 µm, (4) RO module, (5) Ultraviolet sterilizer (UV), (6) CIP tank, (7) Storage tank, and (8) CIP pump.
Membranes 13 00628 g001
Figure 2. Pilot scale reverse osmosis experimental setup installed at NUST.
Membranes 13 00628 g002
Figure 3. Performance of RO membrane before conversion.
Membranes 13 00628 g003
Figure 4. Exposure of NaOCl on the RO membrane, water recovery %, and saltwater rejection % with respect to time.
Membranes 13 00628 g004
Figure 5. Performance of RO after conversion.
Membranes 13 00628 g005
Figure 6. R-RO Permeate flux with respect to TMP.
Membranes 13 00628 g006
Figure 7. SEM micrographs at 5000 magnification, (top a,top b) recycled RO membrane after 10 h exposure at 5000 magnification, (lower a) SEM micrograph of R-RO after 0 h (lower b) after 12 h from the literature at the same magnification for comparison.
Membranes 13 00628 g007
Figure 8. Pore size of the R-RO membrane at 500 nm magnification.
Membranes 13 00628 g008
Figure 9. (a) EDX spectra of elements, (b) SEM micrograph.
Membranes 13 00628 g009
Figure 10. COD removal efficiency of the R-RO membrane in TW, ICW-P, and MBR-P waters.
Membranes 13 00628 g010
Figure 11. Turbidity removal efficiency of R-RO membrane in TW, ICW-P, and MBR-P water.
Membranes 13 00628 g011
Table 1. RO membrane specifications and operating conditions.
MembraneModelSize (Inches)Active Area ft2 (m2)Maximum Operating PressureMaximum Operating TemperaturepH
Filmtec-BWROLC-LE-40404094 (8.7)(41 bars) 600 psig113 °F (45 °C)2–11
Table 2. Conversion procedure of spent RO and R-RO.
RunsMembraneChemical UsedExposure Time (h)Method
(AS or PS)
Dose Level (ppm/h)Total Exposure Time (h)
2Filmtec- BWRO
(LC-LE-4040)
6% NaOCl (12.5% conc. aqueous solution)5 hActive System (CIP pump used)300,0005
Table 3. Initial physicochemical and microbial analysis of TW, ICW-P, and MBR-P.
Water Type
ParametersTWICW-PMBR-P
pH788
EC (uS/cm)104716141143
Turbidity (NTU)1251
COD (mg/L)495355
MPN (CFU/100 mL)>23>23>23
Table 4. SEM-EDX number and percentage of elements present on the R-RO membrane surface.
ElementWeight %Atomic %
C K38.2143.51
N K37.2436.36
O K22.2118.99
Na K0.870.52
Al K0.190.10
Si K0.070.03
S K0.850.36
Cl K0.330.13
Ca K0.020.01
100.00
Table 5. MPN results (CFU/100 mL) and removal of total coliforms from MPN index/100 mL.
Intermittent Stages
TW, ICW-P and MBR-PFeedCFRecycled ROUV
MPN (CFU/100 mL)>23>2300
95% Confidence Limits13131–3.41–3.4
Removal % 100%100%
Table 6. Product water values after R-RO and their comparison with standard limits.
Water TypeStandards Limits
ParametersTWICW-PMBR-PWHO Standards NSDWQ Pakistan NEQS for Municipal and Liquid Industrial Effluent
pH77.37.86.5–8.56.5–8.56–9
EC (uS/cm)103516021143
Turbidity (NTU)0.80.80.6<5 NTU<5 NTU
COD (mg/L)495355 150 mg/L
MPN (CFU/100 mL)Not detectedNot detectedNot detectedMust not be detectable in 100 mL of waterMust not be detectable in 100 mL of water
Nitrate (mg/L)0.7333.022.3150 mg/L≤50 mg/L
Disclaimer/Publisher’s Note: The statements, opinions and data contained in all publications are solely those of the individual author(s) and contributor(s) and not of MDPI and/or the editor(s). MDPI and/or the editor(s) disclaim responsibility for any injury to people or property resulting from any ideas, methods, instructions or products referred to in the content.

