
Evaluation of Er Doped CeO2-δ as Oxygen Transport Membrane

 ,
,  , and
, and 
Abstract
:1. Introduction
2. Materials and Methods
3. Results and Discussion
3.1. Synthesis and Structural Characterization
3.2. Electrochemical Properties
3.3. Permeation
4. Conclusions
Supplementary Materials
Author Contributions
Funding
Institutional Review Board Statement
Informed Consent Statement
Data Availability Statement
Acknowledgments
Conflicts of Interest
References
- Shao, Z.P.; Haile, S.M. A high-performance cathode for the next generation of solid-oxide fuel cells. Nature 2004, 431, 170–173. [Google Scholar] [CrossRef] [PubMed]
- Wachsman, E.D.; Lee, K.T. Lowering the Temperature of Solid Oxide Fuel Cells. Science 2011, 334, 935–939. [Google Scholar] [CrossRef] [PubMed]
- Ruiz-Trejo, E.; Boldrin, P.; Medley-Hallam, J.L.; Darr, J.; Atkinson, A.; Brandon, N.P. Partial oxidation of methane using silver/gadolinia-doped ceria composite membranes. Chem. Eng. Sci. 2015, 127, 269–275. [Google Scholar] [CrossRef] [Green Version]
- Zhang, B.C.; Tang, X.L.; Li, Y.; Xu, Y.D.; Shen, W.J. Hydrogen production from steam reforming of ethanol and glycerol over ceria-supported metal catalysts. Int. J. Hydrogen Energy 2007, 32, 2367–2373. [Google Scholar] [CrossRef]
- Montini, T.; Melchionna, M.; Monai, M.; Fornasiero, P. Fundamentals and Catalytic Applications of CeO2-Based Materials. Chem. Rev. 2016, 116, 5987–6041. [Google Scholar] [CrossRef]
- Serra, J.M.; Borrás-Morell, J.F.; García-Baños, B.; Balaguer, M.; Plaza-González, P.; Santos-Blasco, J.; Catalán-Martínez, D.; Navarrete, L.; Catalá-Civera, J.M. Hydrogen production via microwave-induced water splitting at low temperature. Nat. Energy 2020, 5, 910–919. [Google Scholar] [CrossRef]
- Solis, C.; Balaguer, M.; Garcia-Fayos, J.; Palafox, E.; Serra, J.M. Progress in Ce(0.8)Gd(0.2)O(2-delta) protective layers for improving the CO(2) stability of Ba0.5Sr0.5Co0.8Fe0.2O3-delta O2-transport membranes. Sustain. Energy Fuels 2020, 4, 3747–3752. [Google Scholar] [CrossRef]
- Sunarso, J.; Baumann, S.; Serra, J.M.; Meulenberg, W.A.; Liu, S.; Lin, Y.S.; da Costa, J.C.D. Mixed ionic-electronic conducting (MIEC) ceramic-based membranes for oxygen separation. J. Membr. Sci. 2008, 320, 13–41. [Google Scholar] [CrossRef]
- Cai, L.; Li, W.; Cao, Z.; Zhu, X.; Yang, W. Improving oxygen permeation of MIEC membrane reactor by enhancing the electronic conductivity under intermediate-low oxygen partial pressures. J. Membr. Sci. 2016, 520, 607–615. [Google Scholar] [CrossRef]
- Carrillo, A.J.; Navarrete, L.; Laqdiem, M.; Balaguer, M.; Serra, J.M. Boosting methane partial oxidation on ceria through exsolution of robust Ru nanoparticles. Mater. Adv. 2021, 2, 2924–2934. [Google Scholar] [CrossRef]
- Tuller, H.L.; Nowick, A.S. Doped Ceria as a Solid Oxide Electrolyte. J. Electrochem. Soc. 1975, 122, 255–259. [Google Scholar] [CrossRef]
- Fagg, D.P.; Kharton, V.V.; Frade, J.R. P-Type Electronic Transport in Ce0.8Gd0.2O2-δ: The Effect of Transition Metal Oxide Sintering Aids. J. Electroceram. 2002, 9, 199–207. [Google Scholar] [CrossRef]
- Lobera, M.P.; Balaguer, M.; Garcia-Fayos, J.; Serra, J.M. Rare Earth-doped Ceria Catalysts for ODHE Reaction in a Catalytic Modified MIEC Membrane Reactor. ChemCatChem 2012, 4, 2102–2111. [Google Scholar] [CrossRef] [Green Version]
- Gellings, P.J.; Bouwmeester, H.J.M. Solid state aspects of oxidation catalysis. Catal. Today 2000, 58, 1–53. [Google Scholar] [CrossRef]
- Rodríguez-Carvajal, J. Recent advances in magnetic structure determination by neutron powder diffraction. Phys. B Condens. Matter 1993, 192, 55–69. [Google Scholar] [CrossRef]
- Zak, A.K.; Majid, W.A.; Abrishami, M.E.; Yousefi, R. X-ray analysis of ZnO nanoparticles by Williamson–Hall and size–strain plot methods. Solid State Sci. 2011, 13, 251–256. [Google Scholar] [CrossRef]
- Song, C.R.; Yoo, H.I. Chemical diffusivity of BaTiO3-delta III. Conductivity-nonstoichiometry (delta) correlation in a mixed n/p regime. Solid State Ion. 1999, 124, 289–299. [Google Scholar] [CrossRef]
- Sogaard, M.; Hendriksen, P.V.; Mogensen, M. Oxygen nonstoichiometry and transport properties of strontium substituted lanthanum ferrite. J. Solid State Chem. 2007, 180, 1489–1503. [Google Scholar] [CrossRef]
- Lobera, M.P.; Escolastico, S.; Garcia-Fayos, J.; Serra, J.M. Ethylene Production by ODHE in Catalytically Modified Ba0.5Sr0.5Co0.8Fe0.2O3-delta Membrane Reactors. ChemSusChem 2012, 5, 1587–1596. [Google Scholar] [CrossRef] [Green Version]
- Balaguer, M.; Solis, C.; Serra, J.M. Structural-Transport Properties Relationships on Ce(1−x)Ln(x)O(2-delta) System (Ln = Gd, La, Tb, Pr, Eu, Er, Yb, Nd) and Effect of Cobalt Addition. J. Phys. Chem. C 2012, 116, 7975–7982. [Google Scholar] [CrossRef]
- Hong, S.J.; Virkar, A.V. Lattice-Parameters and Densities of Rare-Earth-Oxide Doped Ceria Electrolytes. J. Am. Ceram. Soc. 1995, 78, 433–439. [Google Scholar] [CrossRef]
- Mogensen, M.; Sammes, N.M.; Tompsett, G.A. Physical, chemical and electrochemical properties of pure and doped ceria. Solid State Ion. 2000, 129, 63–94. [Google Scholar] [CrossRef]
- Kim, D.J. Lattice-Parameters, Ionic Conductivities, and Solubility Limits in Fluorite-Structure Hf-4+O2, Zr-4+O2, Ce-4+O2, Th-4+O2, V-4+O2 Oxide Solid-Solutions. J. Am. Ceram. Soc. 1989, 72, 1415–1421. [Google Scholar] [CrossRef]
- Pikalova, E.Y.; Murashkina, A.A.; Maragou, V.I.; Demin, A.K.; Strekalovsky, V.N.; Tsiakaras, P.E. CeO2 based materials doped with lanthanides for applications in intermediate temperature electrochemical devices. Int. J. Hydrogen Energy 2011, 36, 6175–6183. [Google Scholar] [CrossRef]
- Horlait, D.; Claparede, L.; Clavier, N.; Szenknect, S.; Dacheux, N.; Ravaux, J.; Podor, R. Stability and Structural Evolution of Ce(1−x)(IV)Ln(x)(III)O(2−x/2) Solid Solutions: A Coupled mu-Raman/XRD Approach. Inorg. Chem. 2011, 50, 7150–7161. [Google Scholar] [CrossRef] [PubMed]
- Balaguer, M.; Solis, C.; Serra, J.M. Study of the Transport Properties of the Mixed Ionic Electronic Conductor Ce1−xTbxO2-delta + Co (x = 0.1, 0.2) and Evaluation As Oxygen-Transport Membrane. Chem. Mater. 2011, 23, 2333–2343. [Google Scholar] [CrossRef] [Green Version]
- Tang, C.-W.; Wang, C.-B.; Chien, S.-H. Characterization of cobalt oxides studied by FT-IR, Raman, TPR and TG-MS. Thermochim. Acta 2008, 473, 68–73. [Google Scholar] [CrossRef]
- Lin, H.Y.; Chen, Y.W. The mechanism of reduction of cobalt by hydrogen. Mater. Chem. Phys. 2004, 85, 171–175. [Google Scholar] [CrossRef]
- Ernst, B.; Hilaire, L.; Kiennemann, A. Effects of highly dispersed ceria addition on reducibility, activity and hydrocarbon chain growth of a Co/SiO2 Fischer-Tropsch catalyst. Catal. Today 1999, 50, 413–427. [Google Scholar] [CrossRef]
- Yashiro, K.; Onuma, S.; Kaimai, A.; Nigara, Y.; Kawada, T.; Mizusaki, J.; Kawamura, K.; Horita, T.; Yokokawa, H. Mass transport properties of Ce0.9Gd0.1O2-delta at the surface and in the bulk. Solid State Ion. 2002, 152, 469–476. [Google Scholar] [CrossRef]
- Lane, J.A.; Kilner, J.A. Oxygen surface exchange on gadolinia doped ceria. Solid State Ion. 2000, 136, 927–932. [Google Scholar] [CrossRef]
- Gaudillere, C.; Garcia-Fayos, J.; Balaguer, M.; Serra, J.M. Enhanced Oxygen Separation through Robust Freeze-Cast Bilayered Dual-Phase Membranes. ChemSusChem 2014, 7, 2554–2561. [Google Scholar] [CrossRef] [PubMed]
- Garcia-Fayos, J.; Søgaard, M.; Kaiser, A.; Serra, J.M. Oxygen permeation studies in surface Pd-activated asymmetric Ce0.9Gd0.1O1.95 membranes for application in CO2 and CH4 environments. Sep. Purif. Technol. 2019, 216, 58–64. [Google Scholar] [CrossRef]
- Balaguer, M.; Escolastico, S.; Serra, J.M. Oxygen permeation and stability of CaTi0.73Fe(0.18)Mg(0.09)O(3-delta) oxygen-transport membrane. J. Membr. Sci. 2017, 524, 56–63. [Google Scholar] [CrossRef]
- Escolastico, S.; Schulze-Kuppers, F.; Baumann, S.; Haas-Santo, K.; Dittmeyer, R. Development and Proof of Concept of a Compact Metallic Reactor for MIEC Ceramic Membranes. Membranes 2021, 11, 541. [Google Scholar] [CrossRef]
- Balaguer, M.; Garcia-Fayos, J.; Solis, C.; Serra, J.M. Fast Oxygen Separation Through SO2- and CO2-Stable Dual-Phase Membrane Based on NiFe2O4-Ce0.8Tb0.2O2-delta. Chem. Mater. 2013, 25, 4986–4993. [Google Scholar] [CrossRef]


| Material | Permeation (mL·min−1·cm−2) | Thickness (μm) | Temperature (°C) | Ref. |
|---|---|---|---|---|
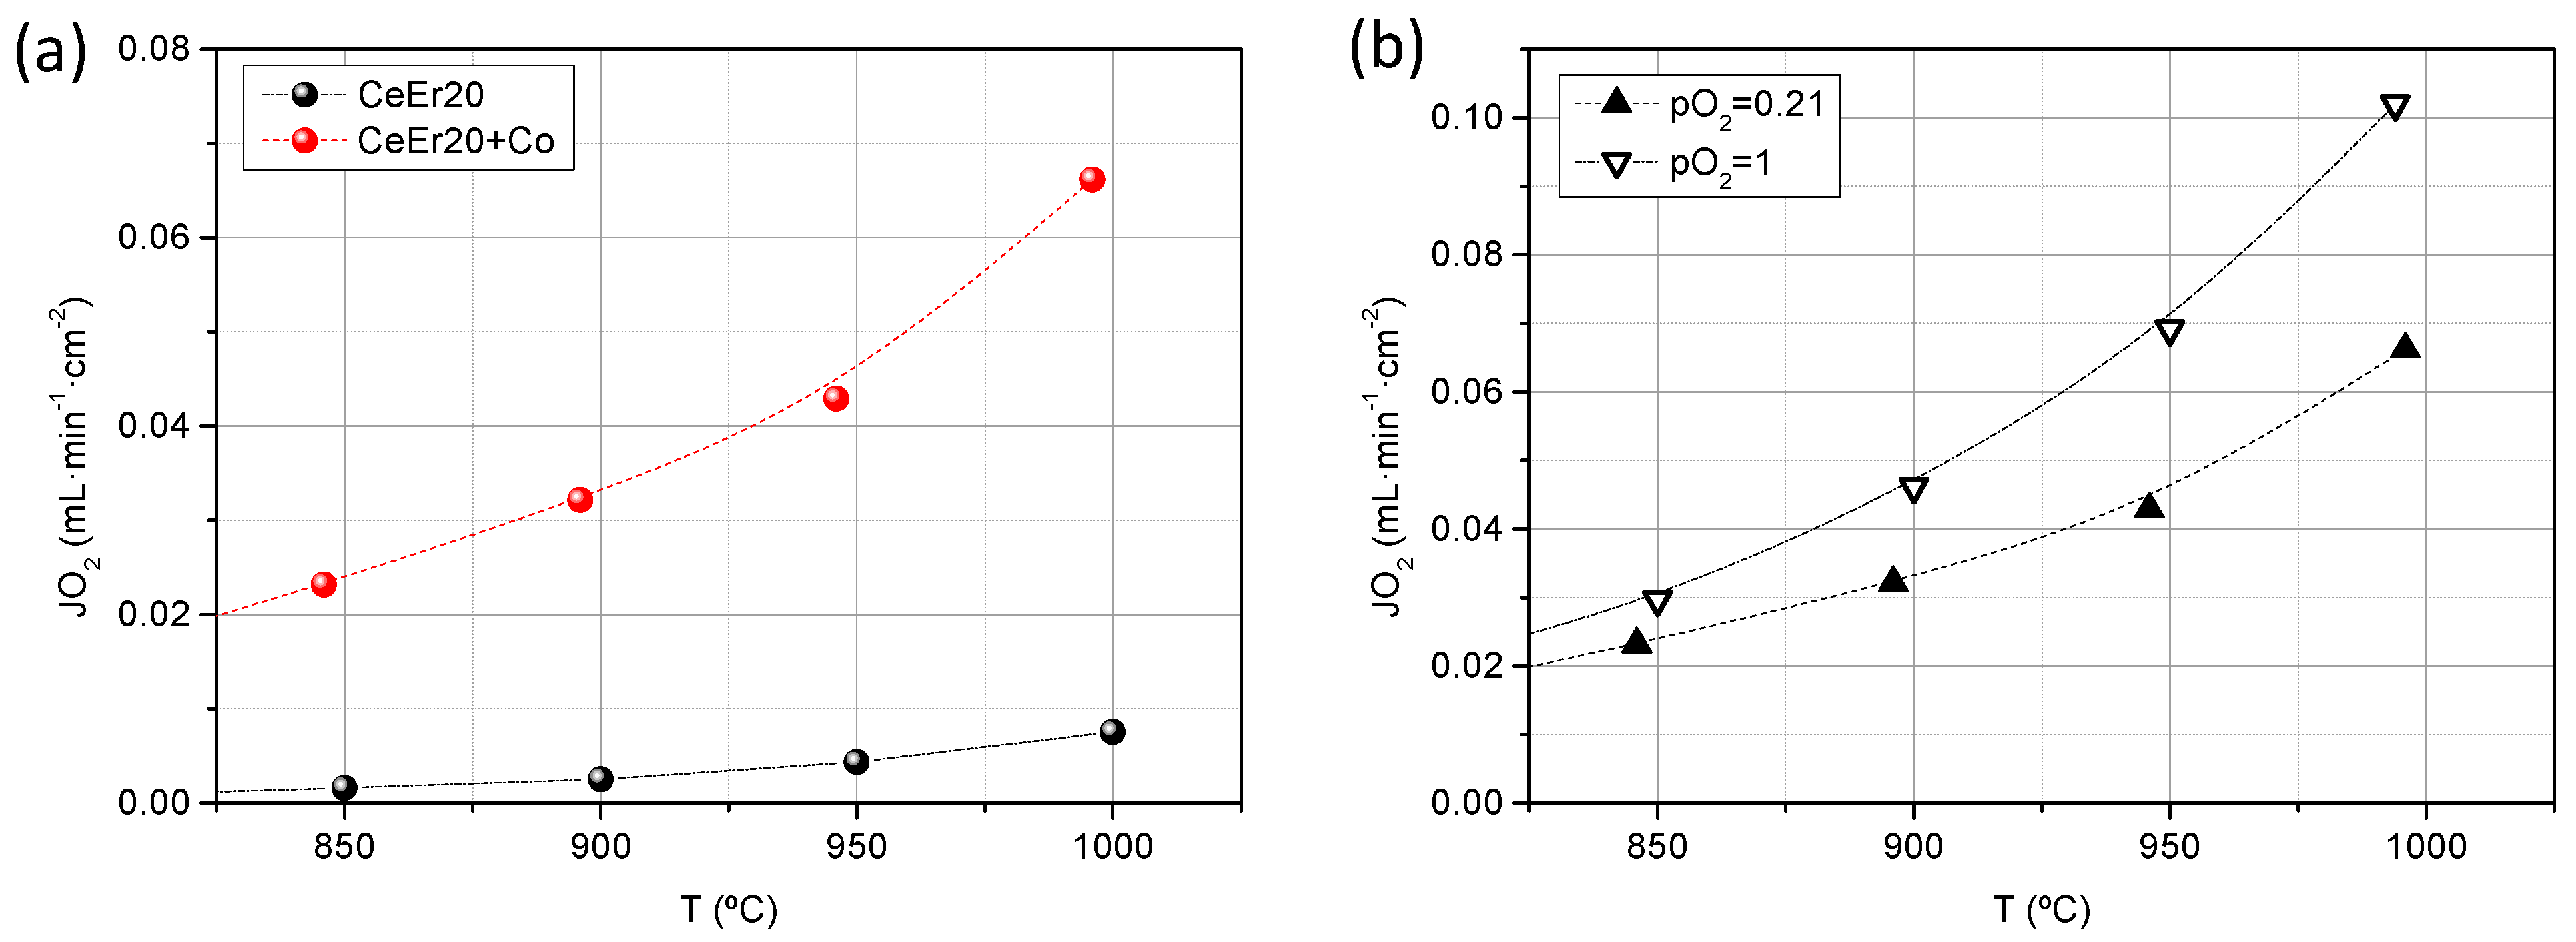
| Ce0.8Er0.2O2-δ | 0.008 | 630 | 1000 | This work |
| Ce0.8Er0.2O2-δ +Co 2 mol% | 0.07 | 769 | 1000 | This work |
| Ce0.8Tb0.2O2-δ +Co 2 mol% | 0.08 | 1200 | 1000 | [24] |
| CGO thin film (Pd activated) | 0.024 | 40 | 1000 | [33] |
Publisher’s Note: MDPI stays neutral with regard to jurisdictional claims in published maps and institutional affiliations. |
© 2022 by the authors. Licensee MDPI, Basel, Switzerland. This article is an open access article distributed under the terms and conditions of the Creative Commons Attribution (CC BY) license (https://creativecommons.org/licenses/by/4.0/).
Share and Cite
Balaguer, M.; Solís, C.; Escolástico, S.; Garcia-Fayos, J.; Serra, J.M. Evaluation of Er Doped CeO2-δ as Oxygen Transport Membrane. Membranes 2022, 12, 172. https://doi.org/10.3390/membranes12020172
Balaguer M, Solís C, Escolástico S, Garcia-Fayos J, Serra JM. Evaluation of Er Doped CeO2-δ as Oxygen Transport Membrane. Membranes. 2022; 12(2):172. https://doi.org/10.3390/membranes12020172
Chicago/Turabian StyleBalaguer, María, Cecilia Solís, Sonia Escolástico, Julio Garcia-Fayos, and Jose Manuel Serra. 2022. "Evaluation of Er Doped CeO2-δ as Oxygen Transport Membrane" Membranes 12, no. 2: 172. https://doi.org/10.3390/membranes12020172
APA StyleBalaguer, M., Solís, C., Escolástico, S., Garcia-Fayos, J., & Serra, J. M. (2022). Evaluation of Er Doped CeO2-δ as Oxygen Transport Membrane. Membranes, 12(2), 172. https://doi.org/10.3390/membranes12020172